Download as PDF, PPTX
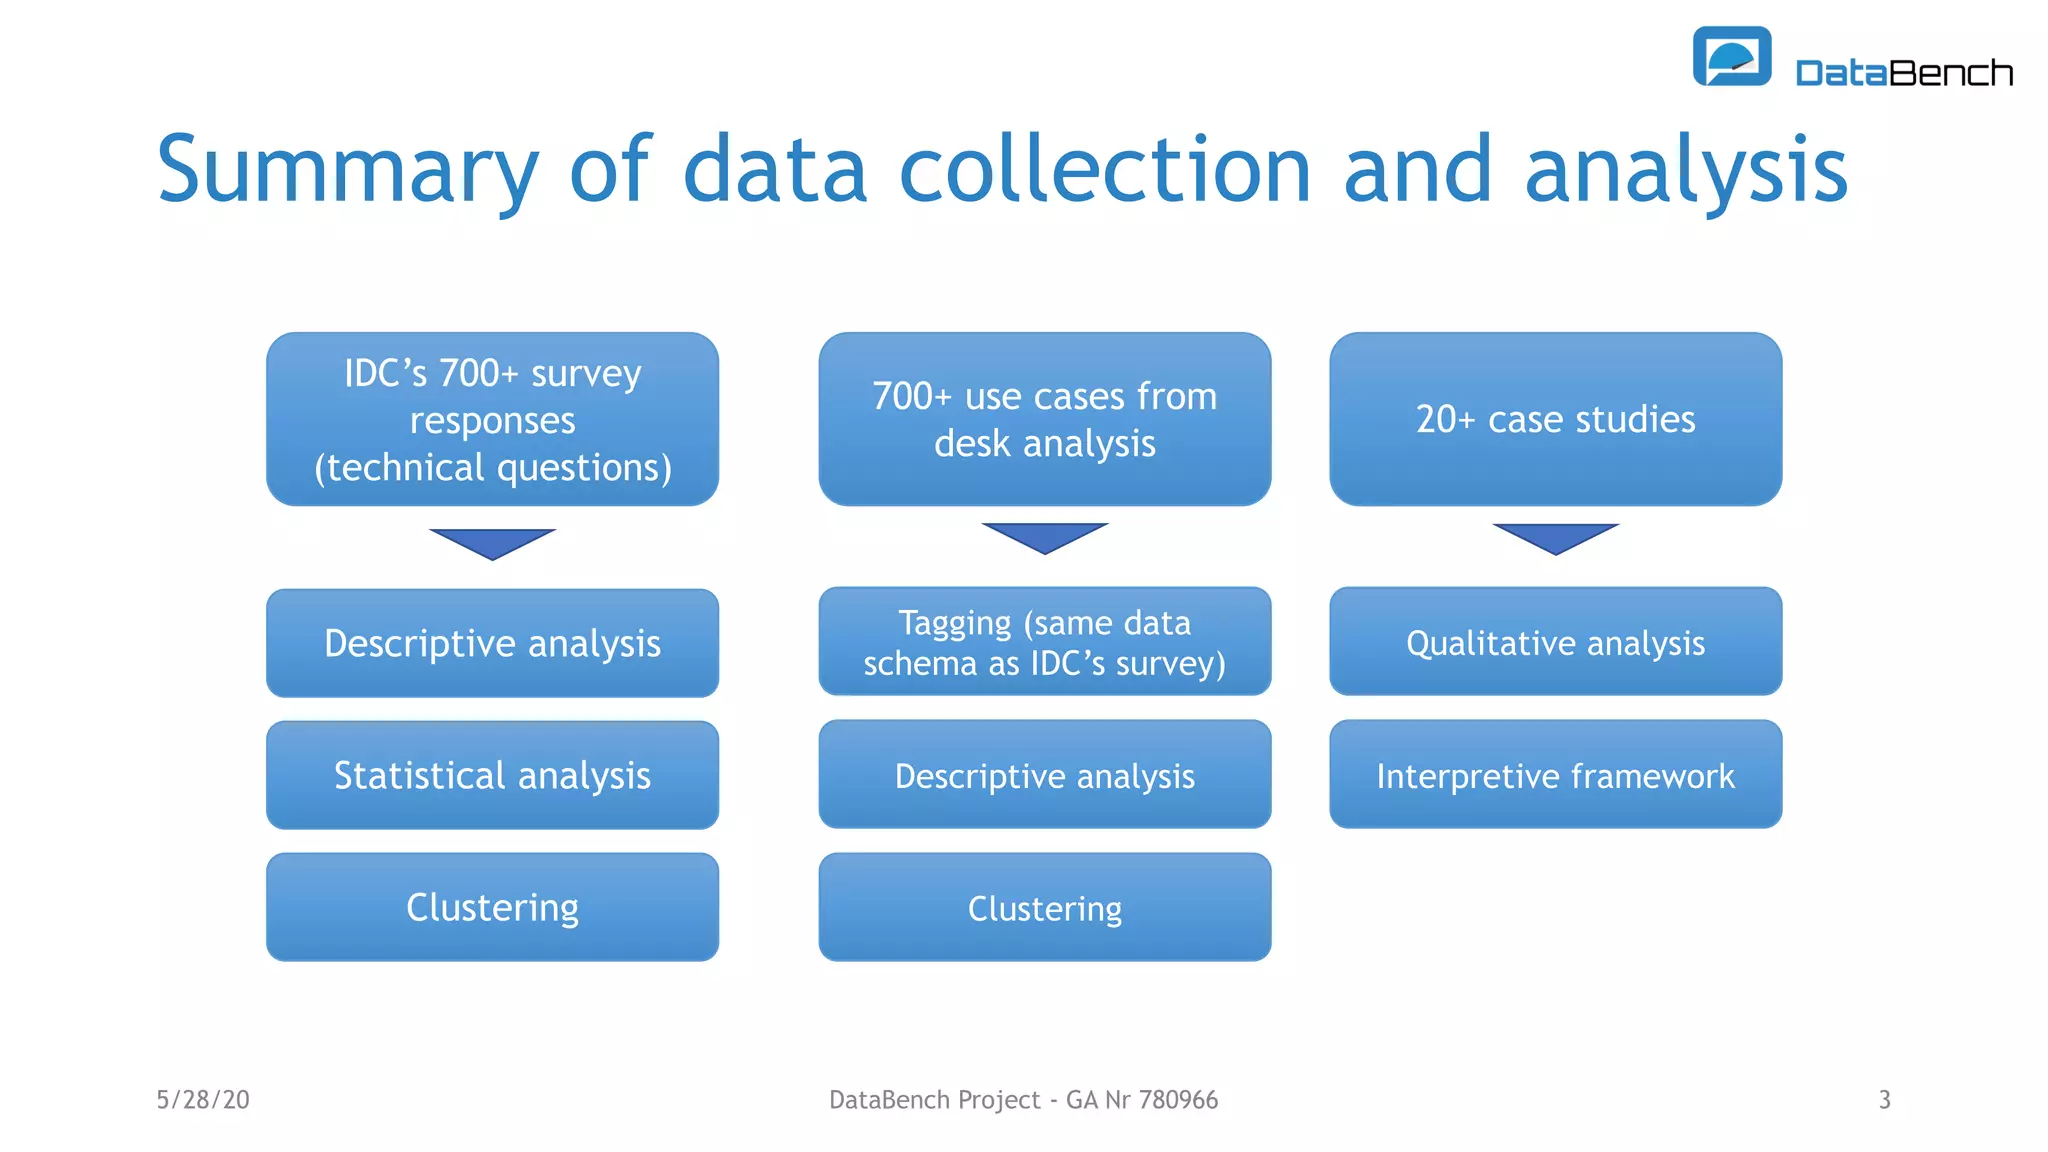
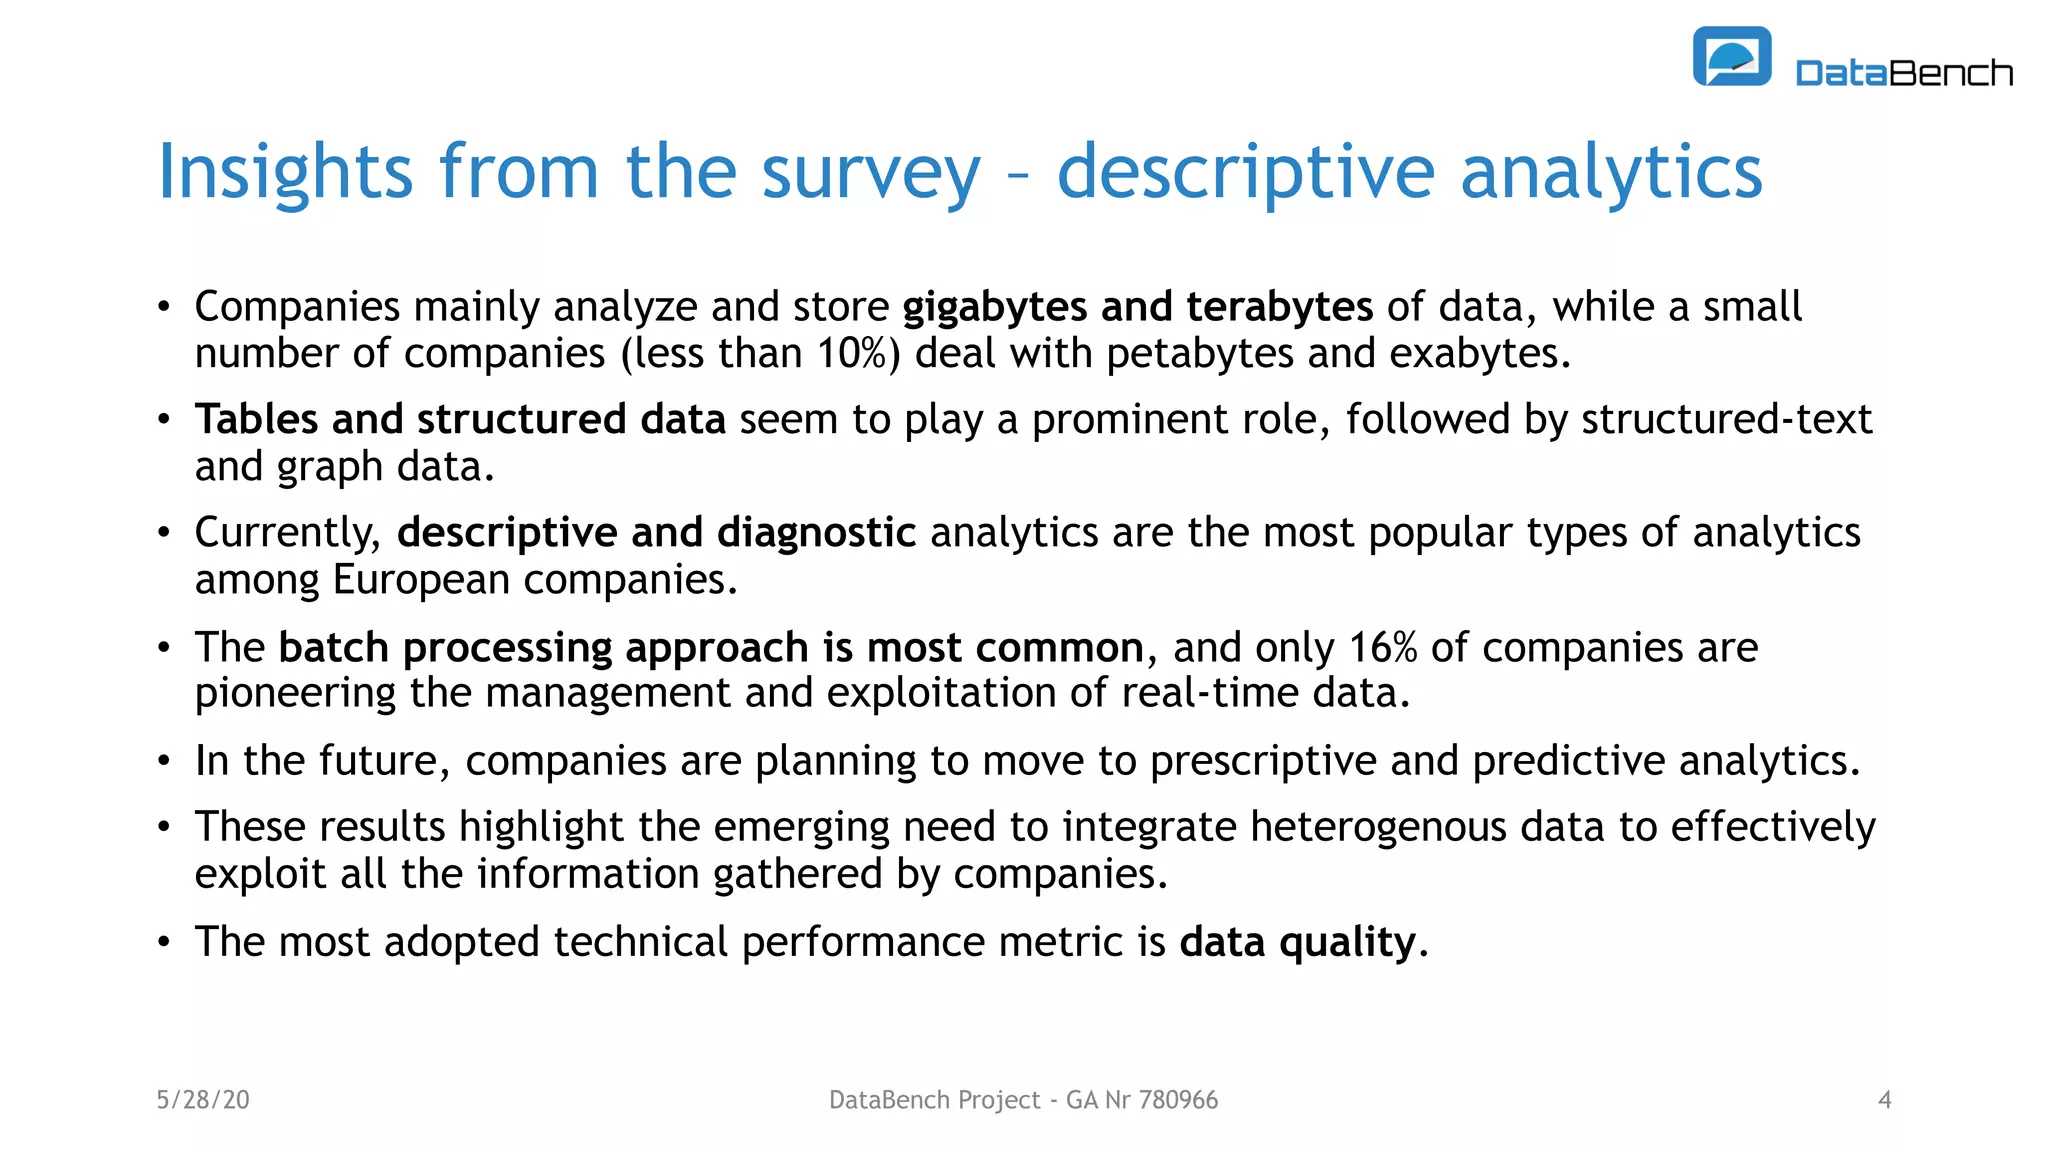
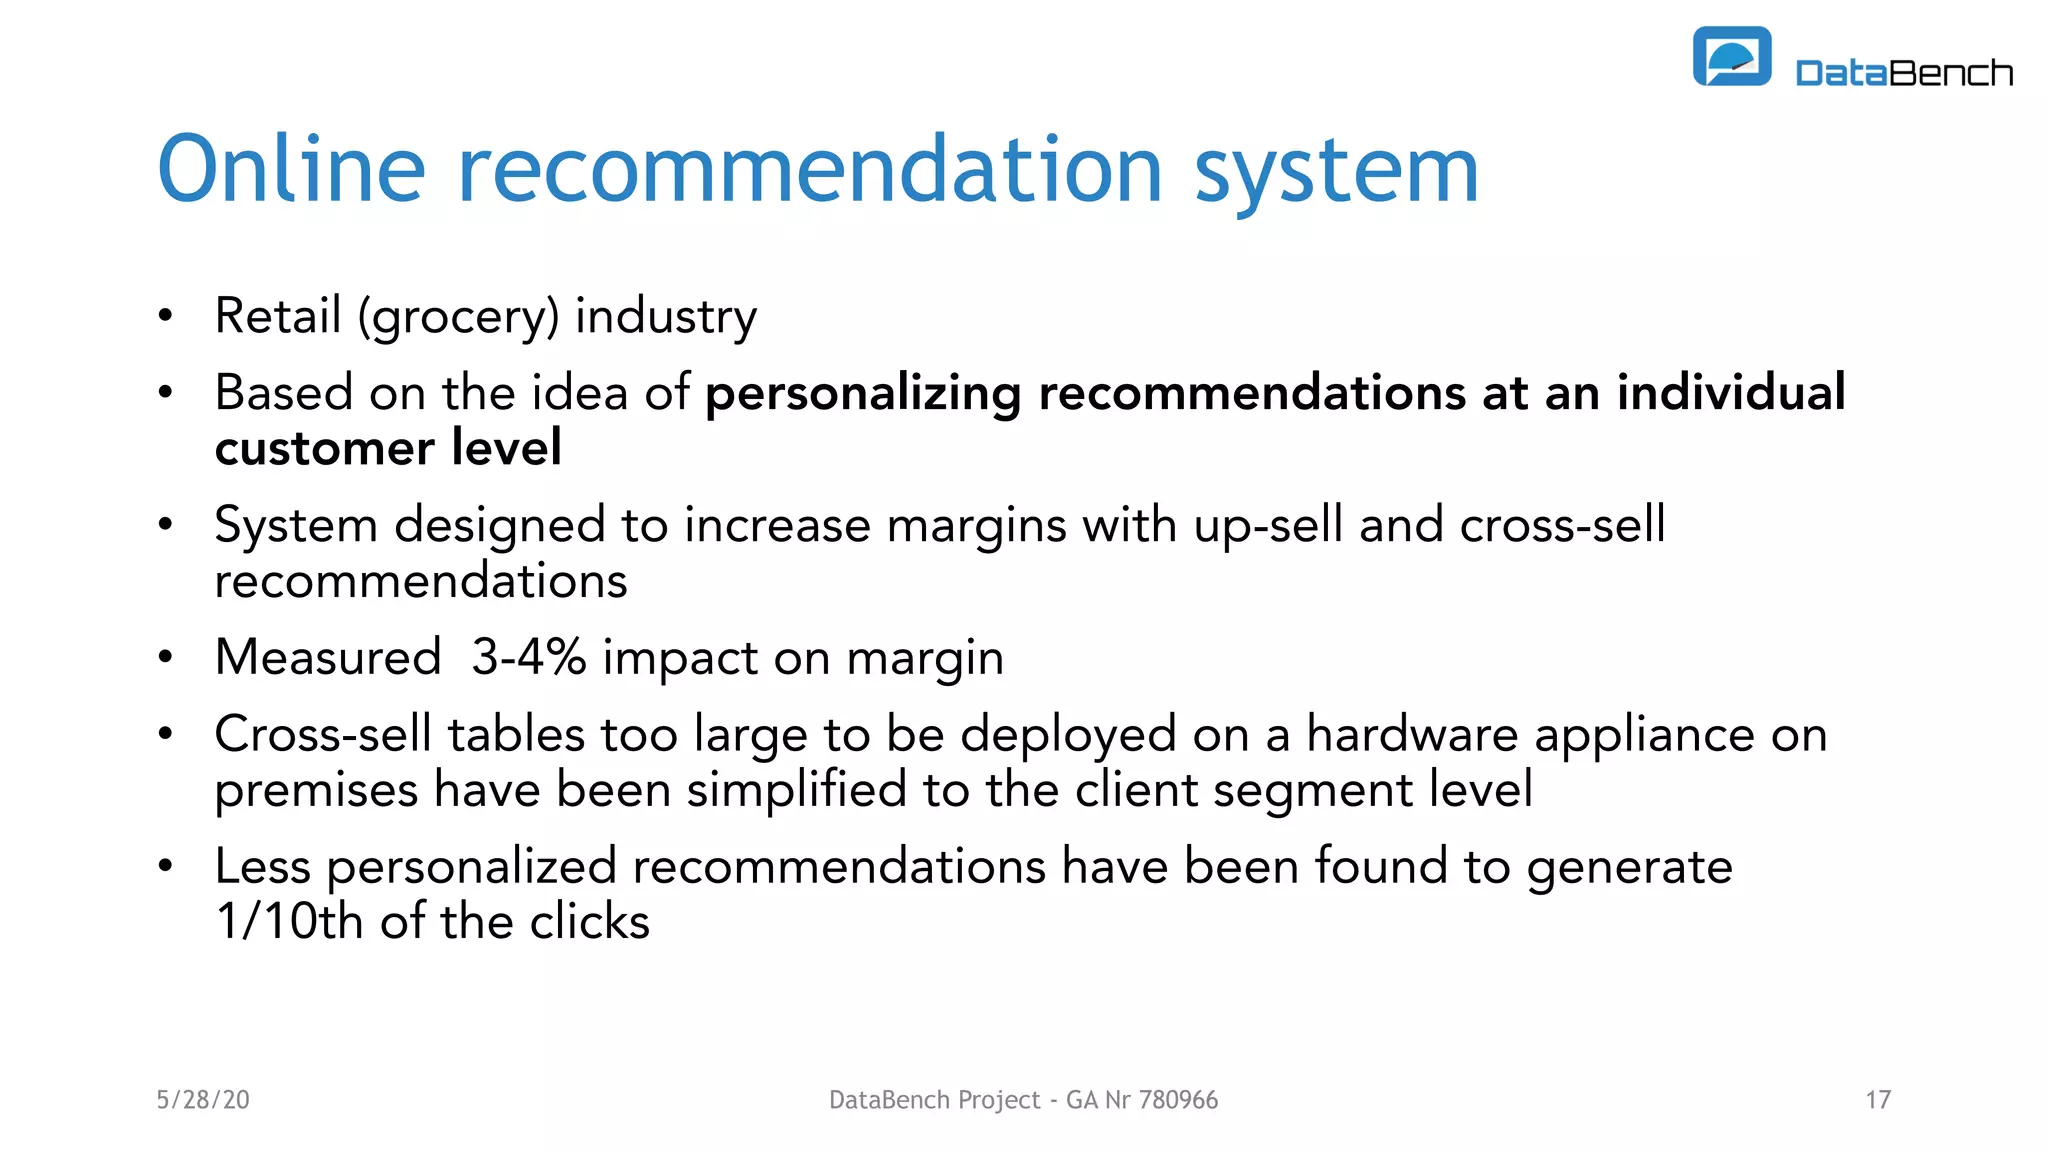
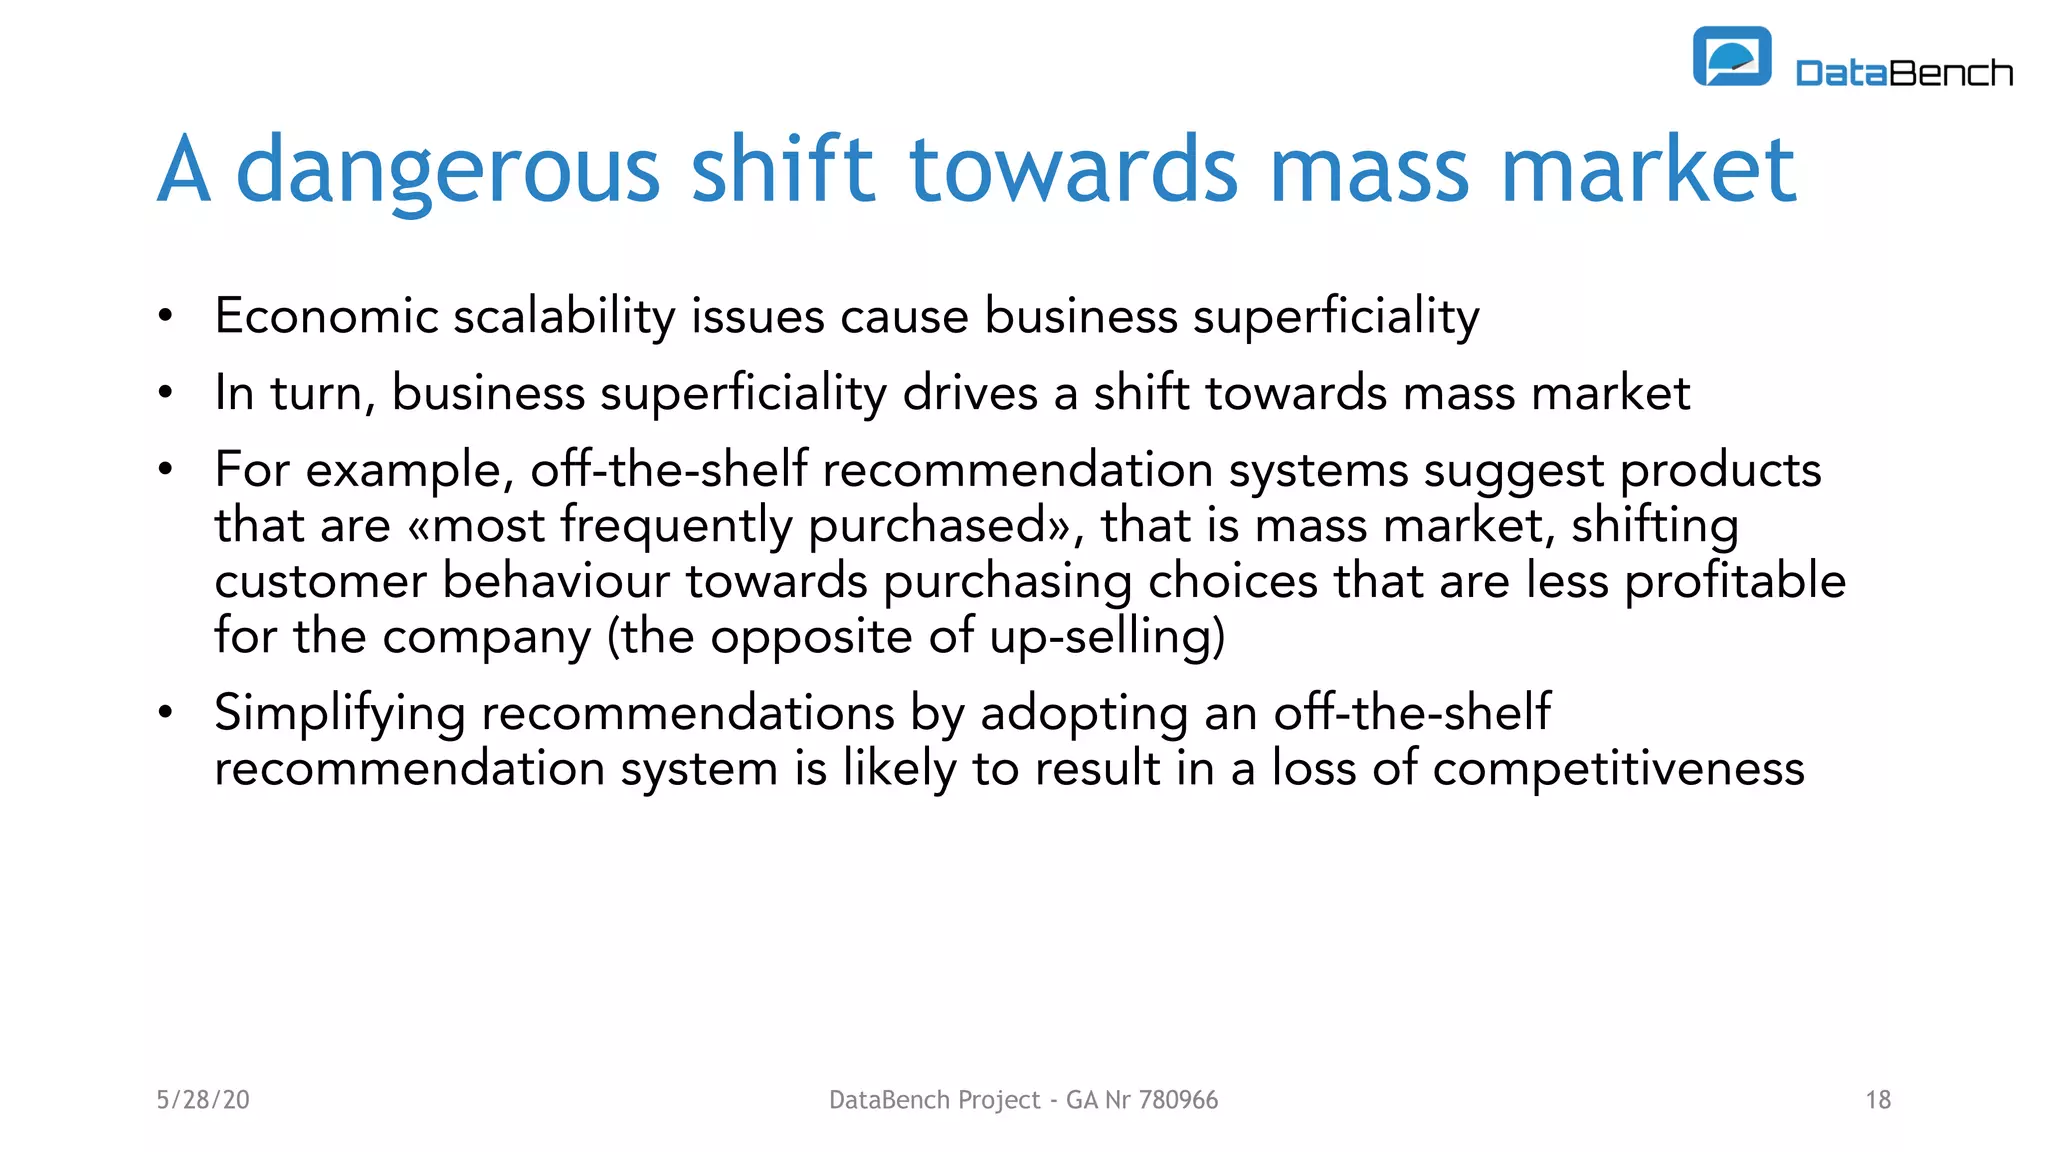
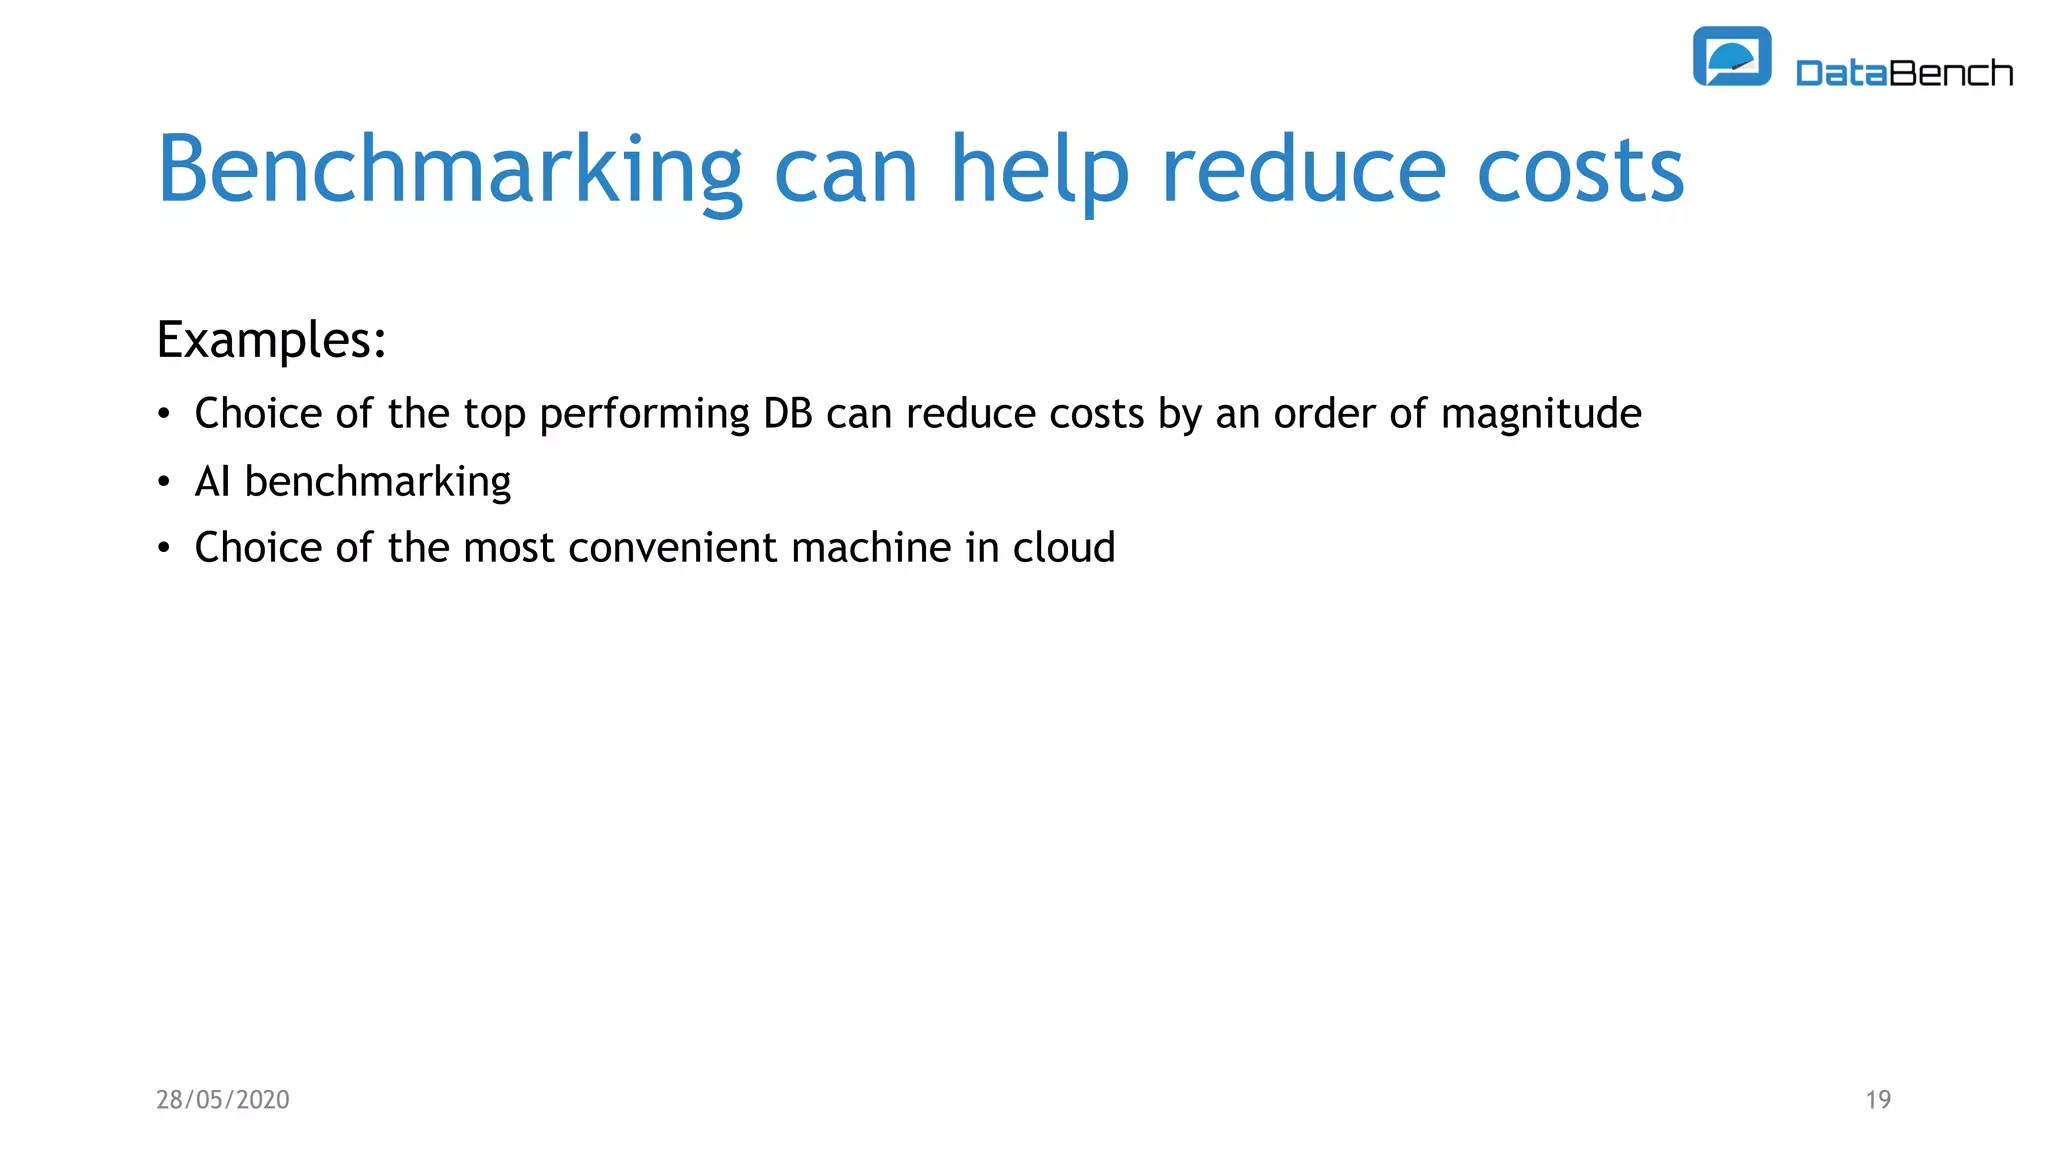
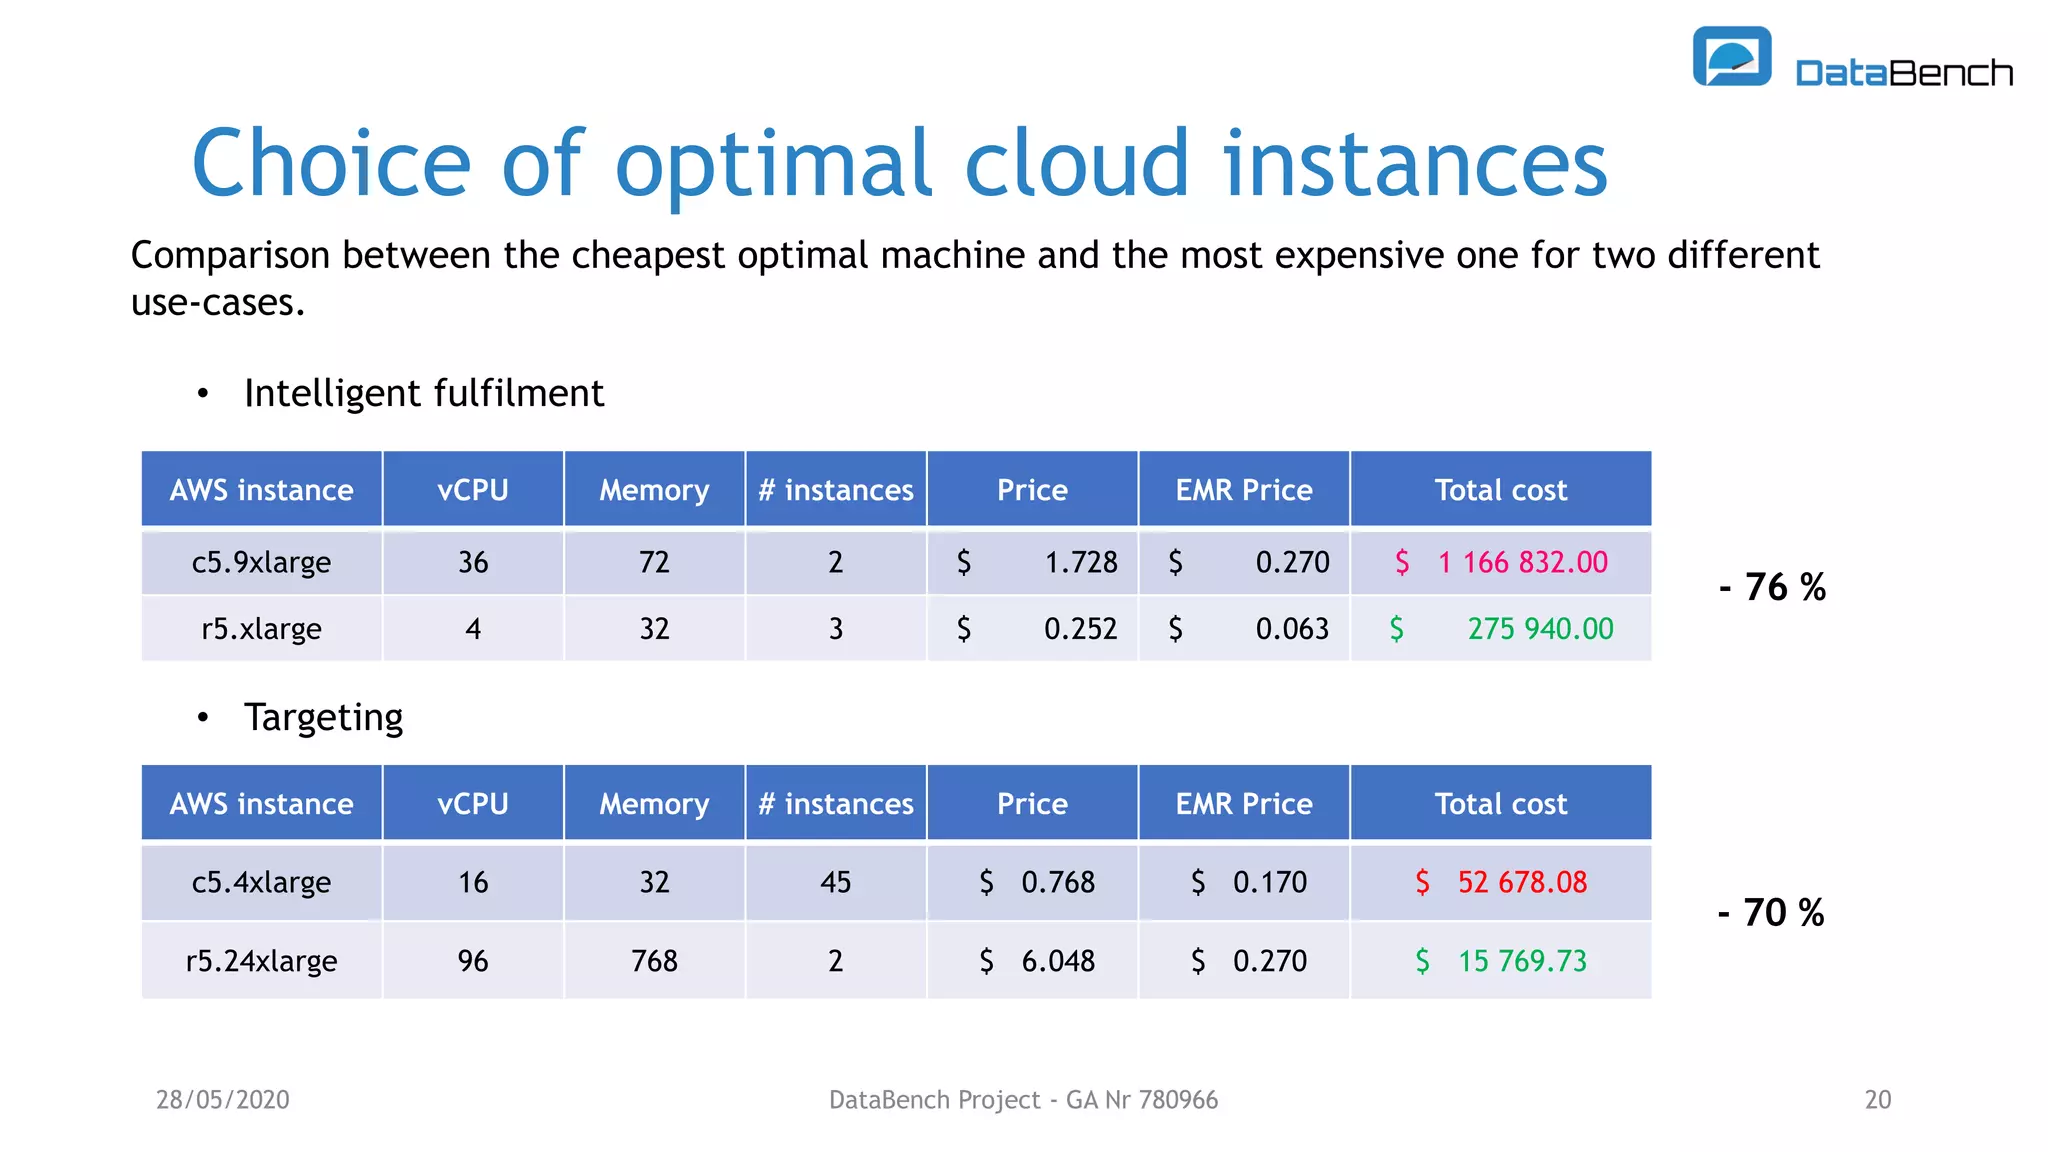
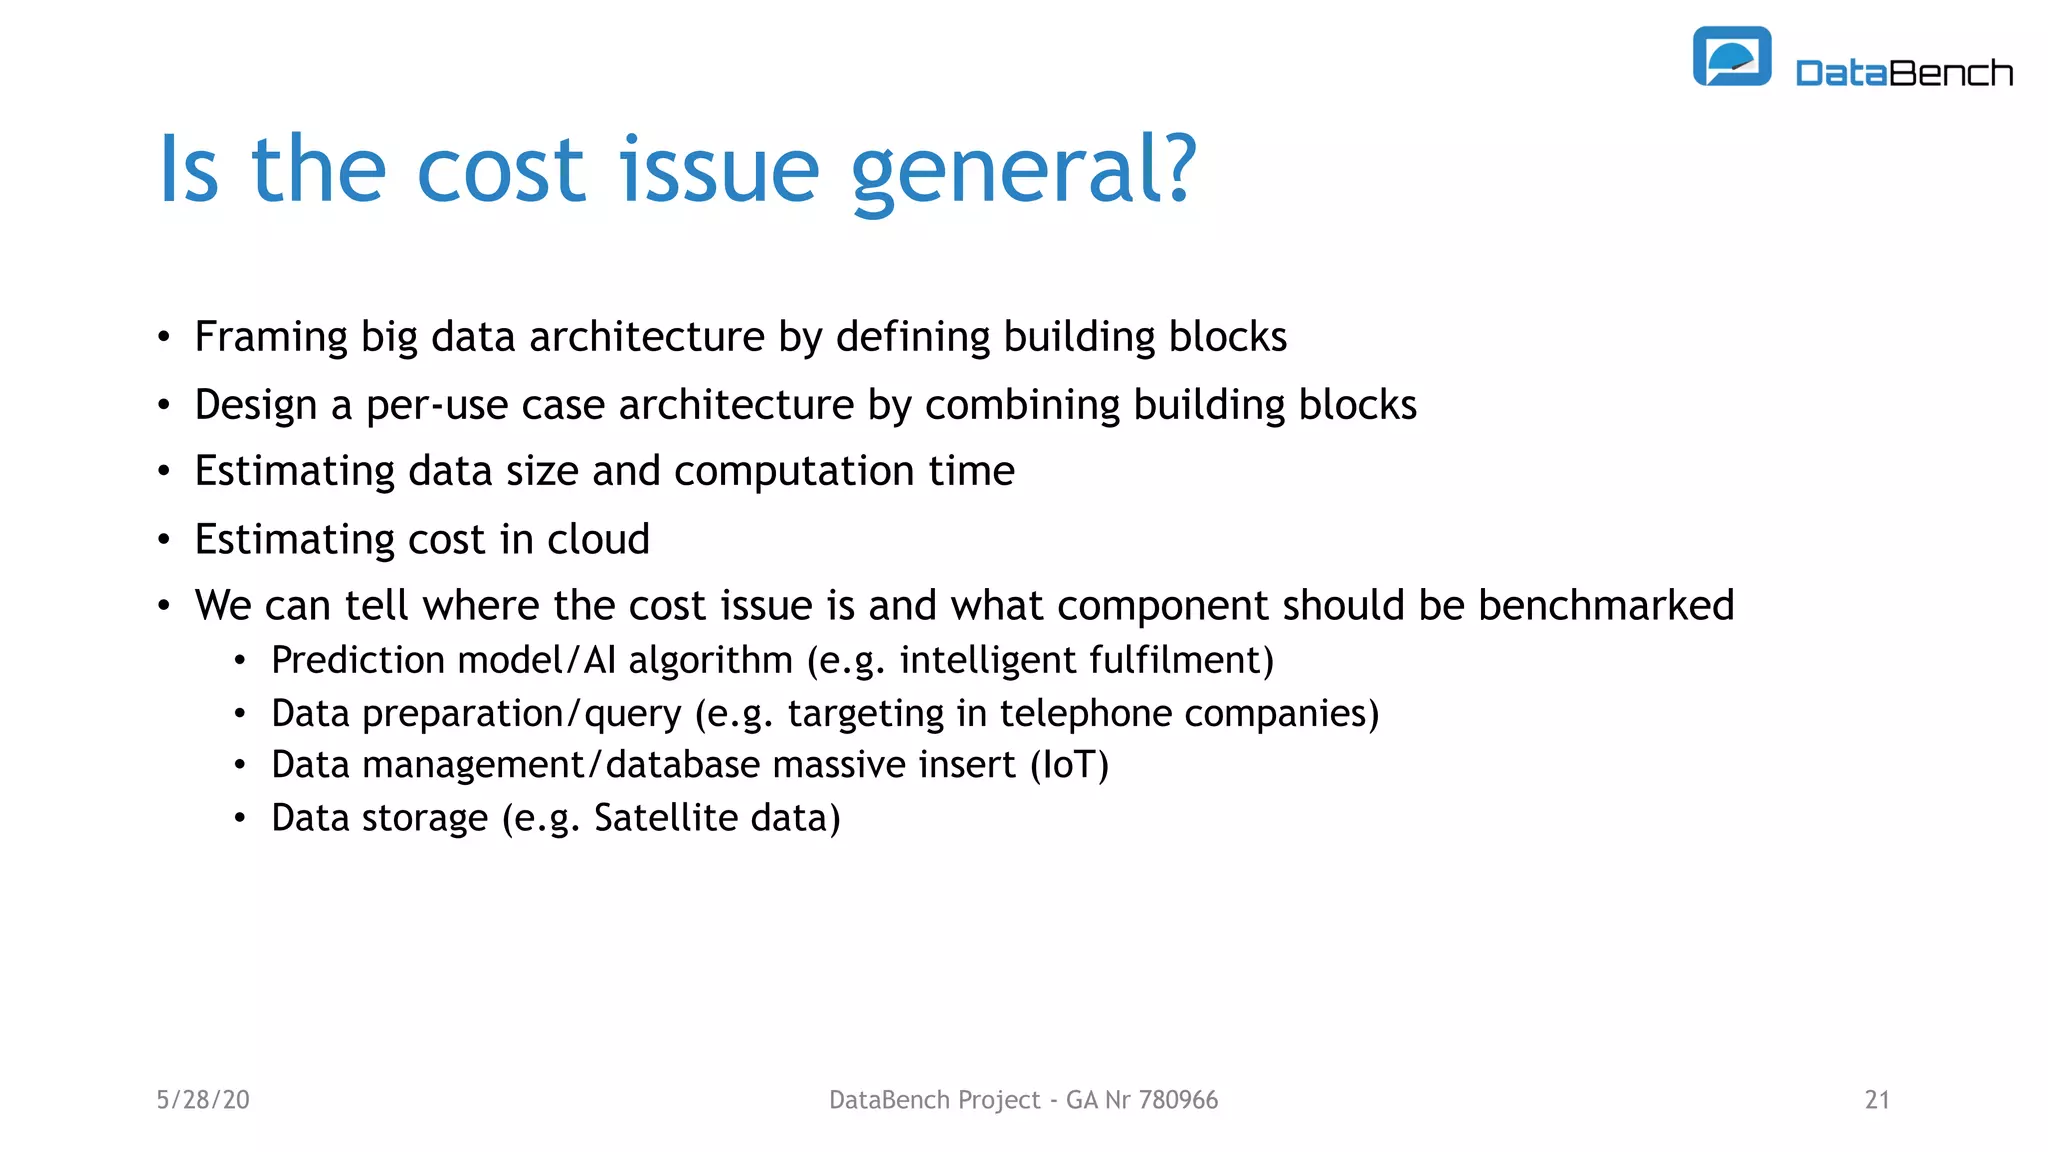
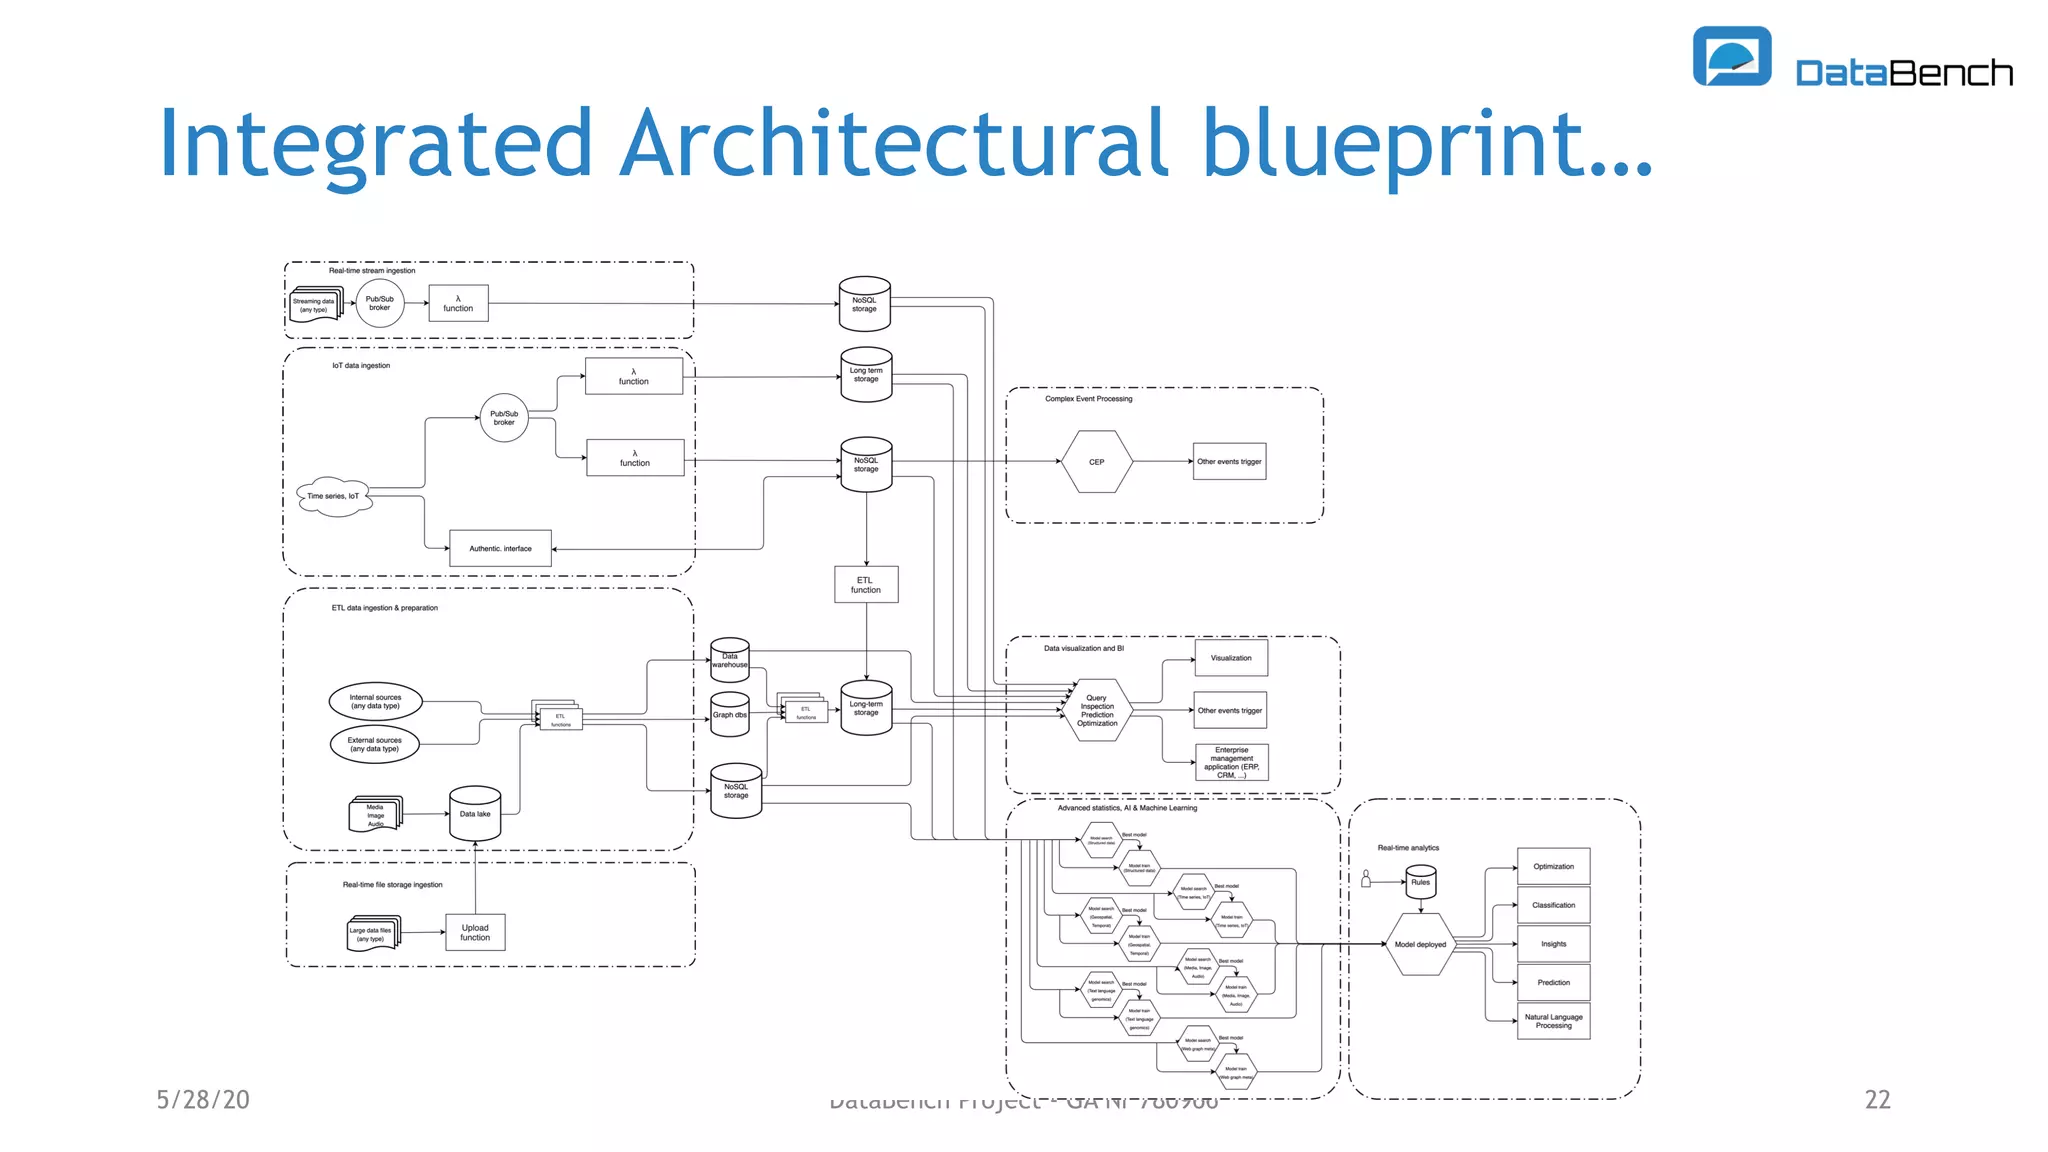
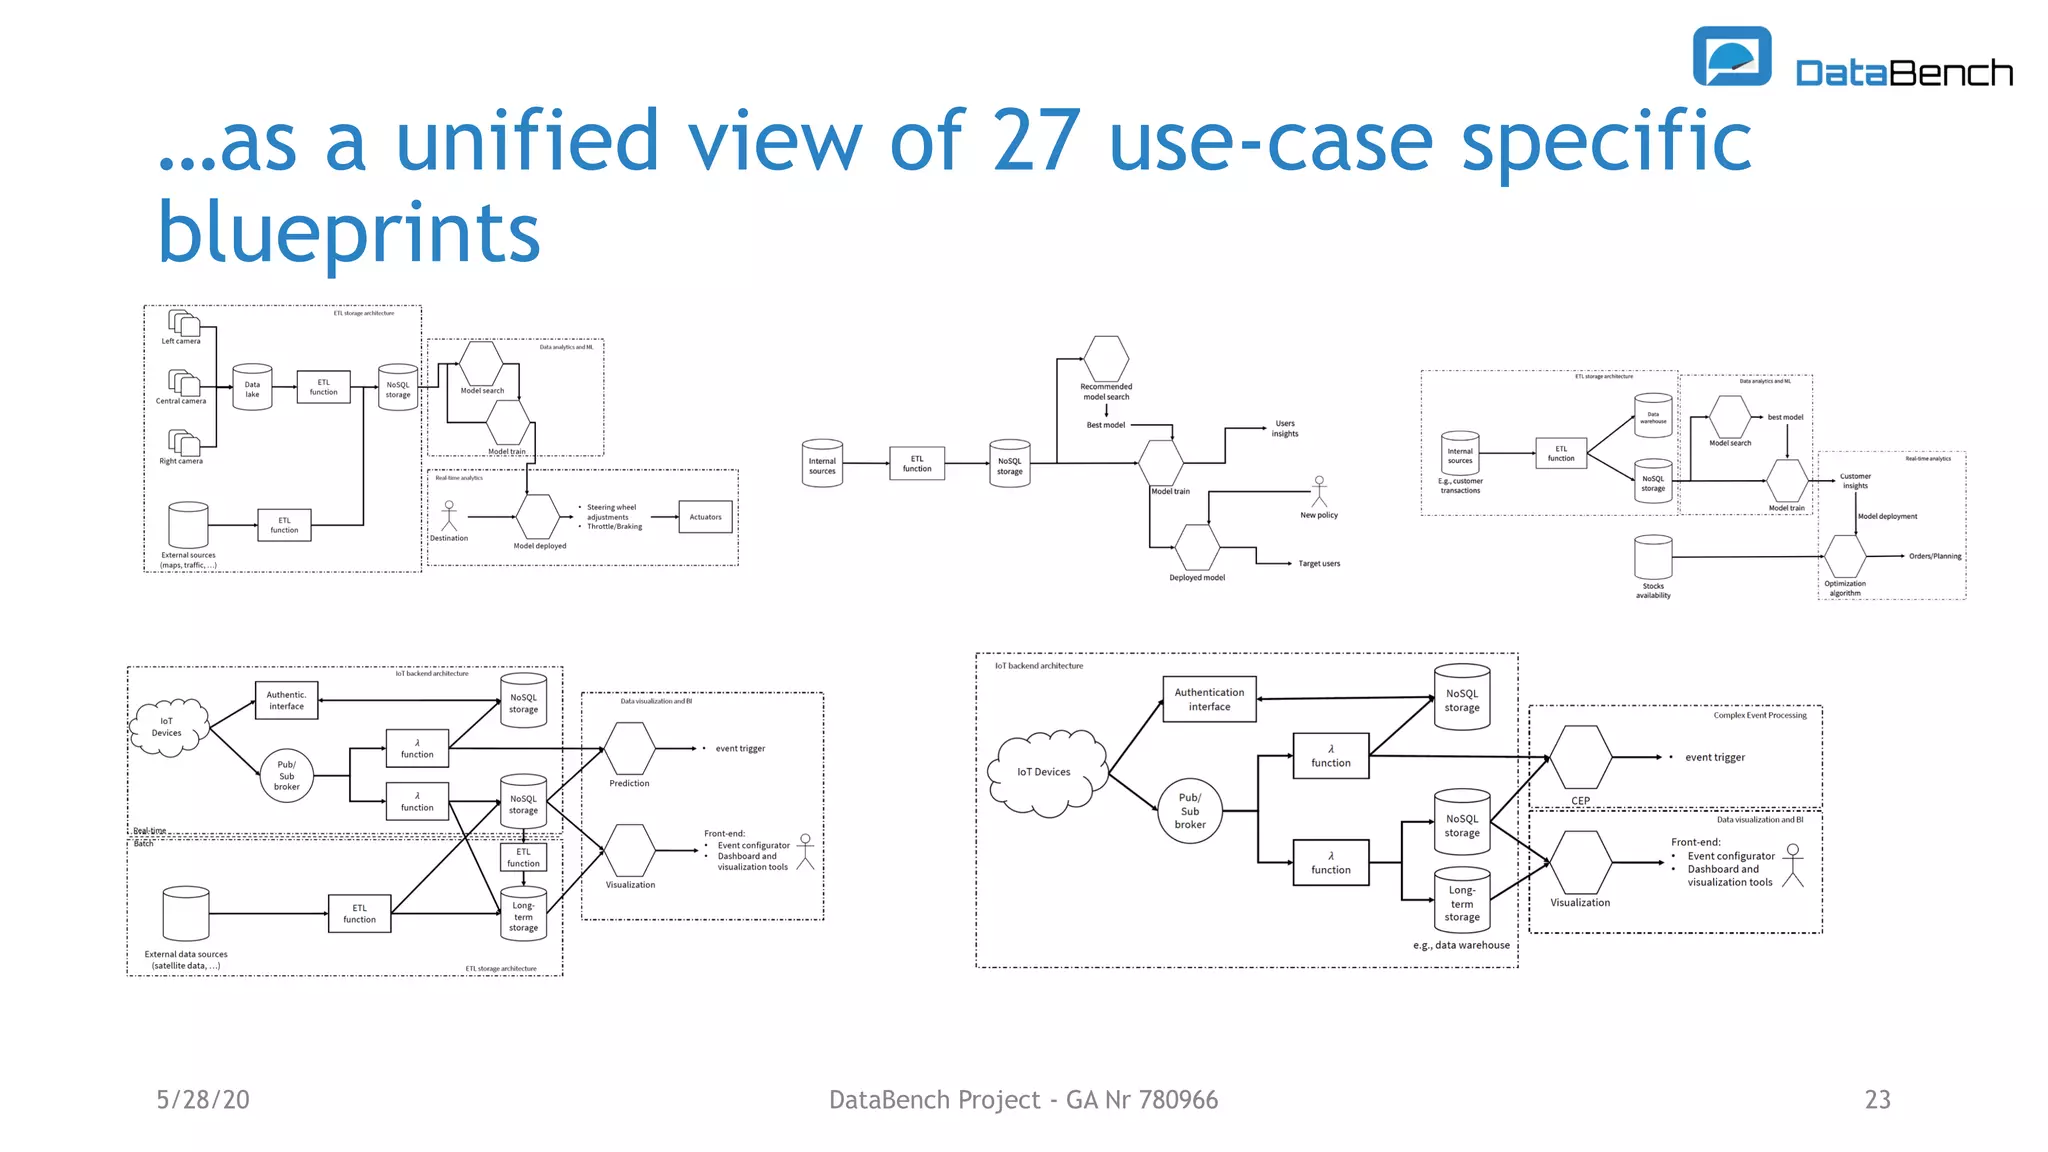
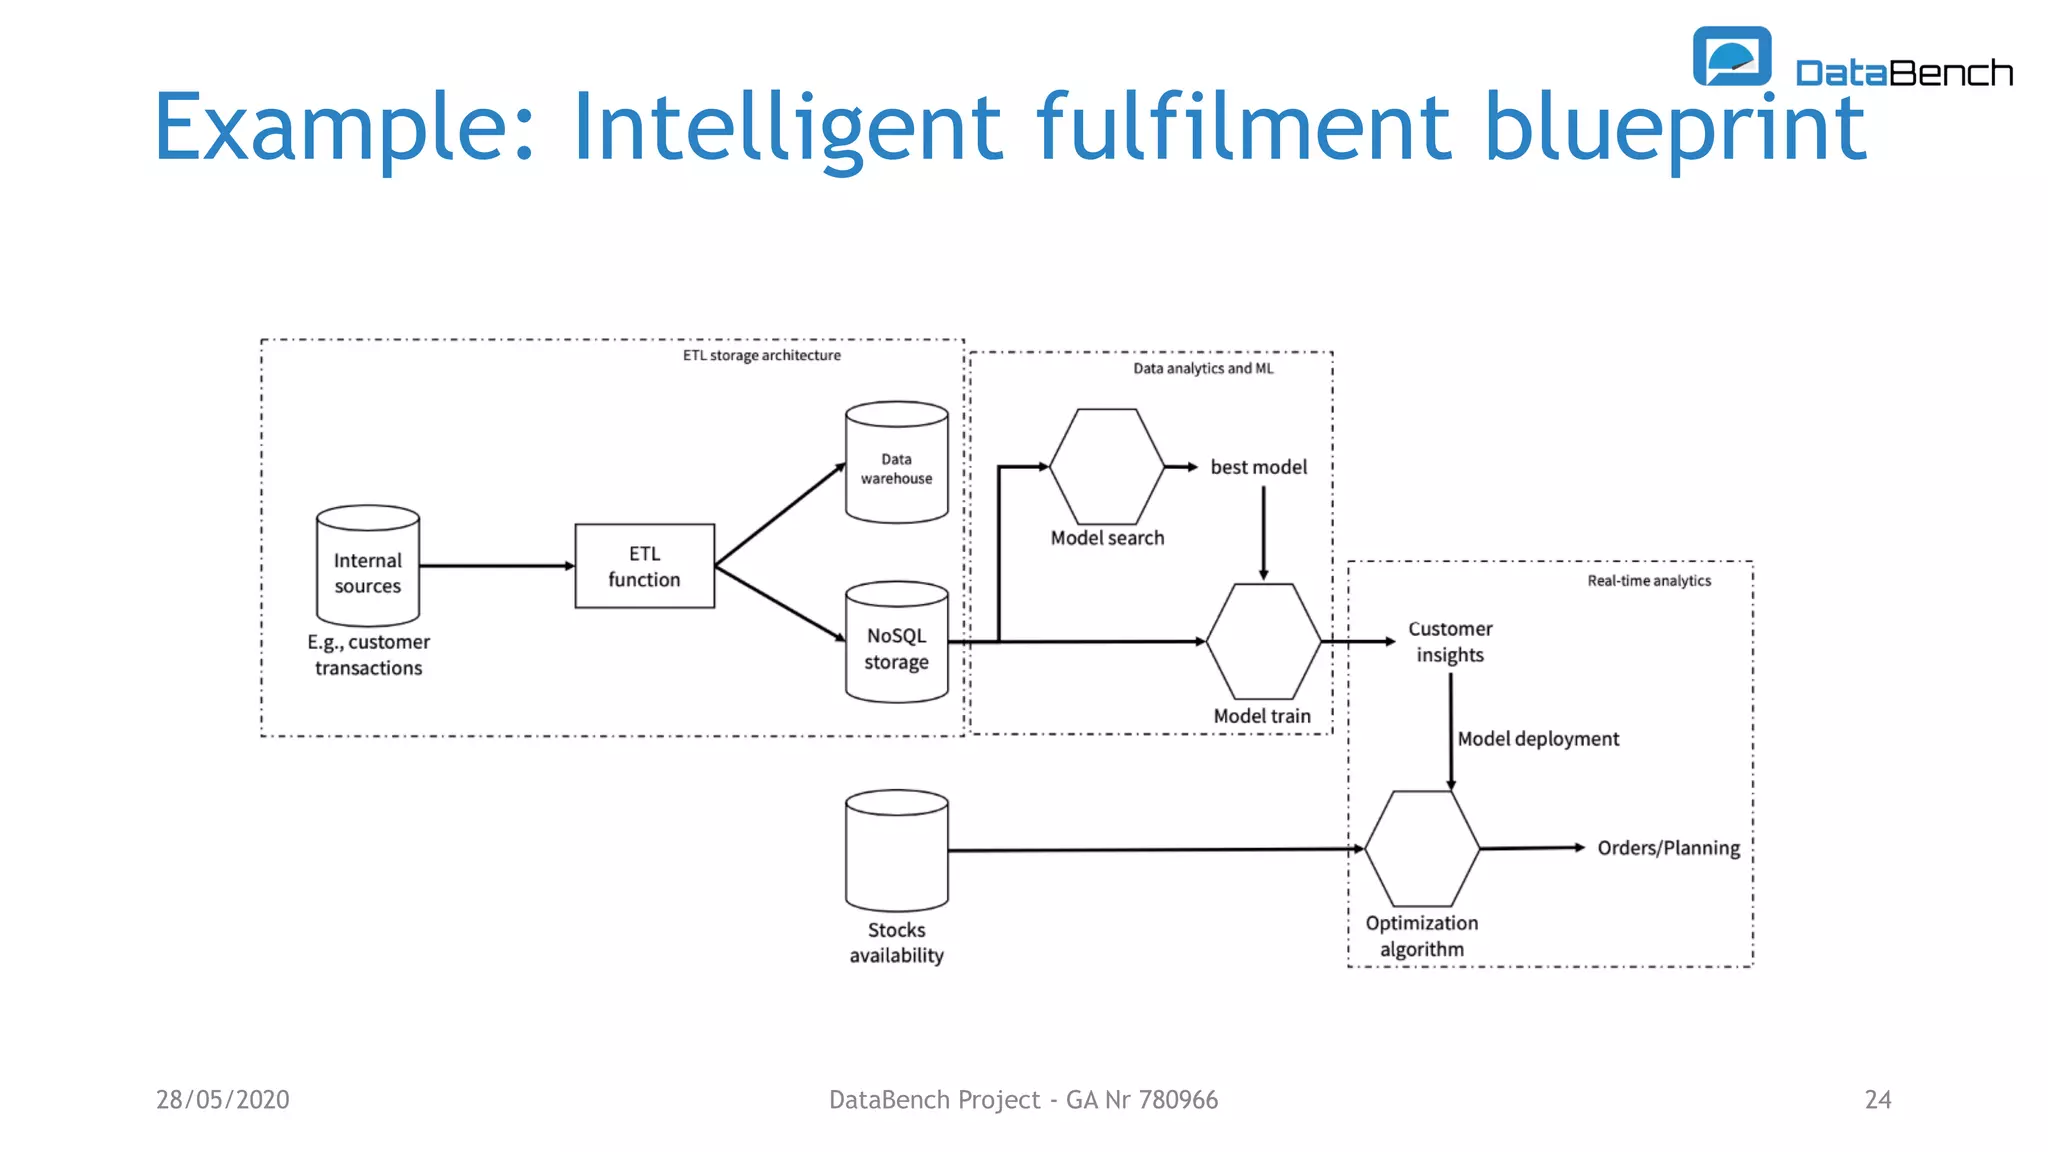
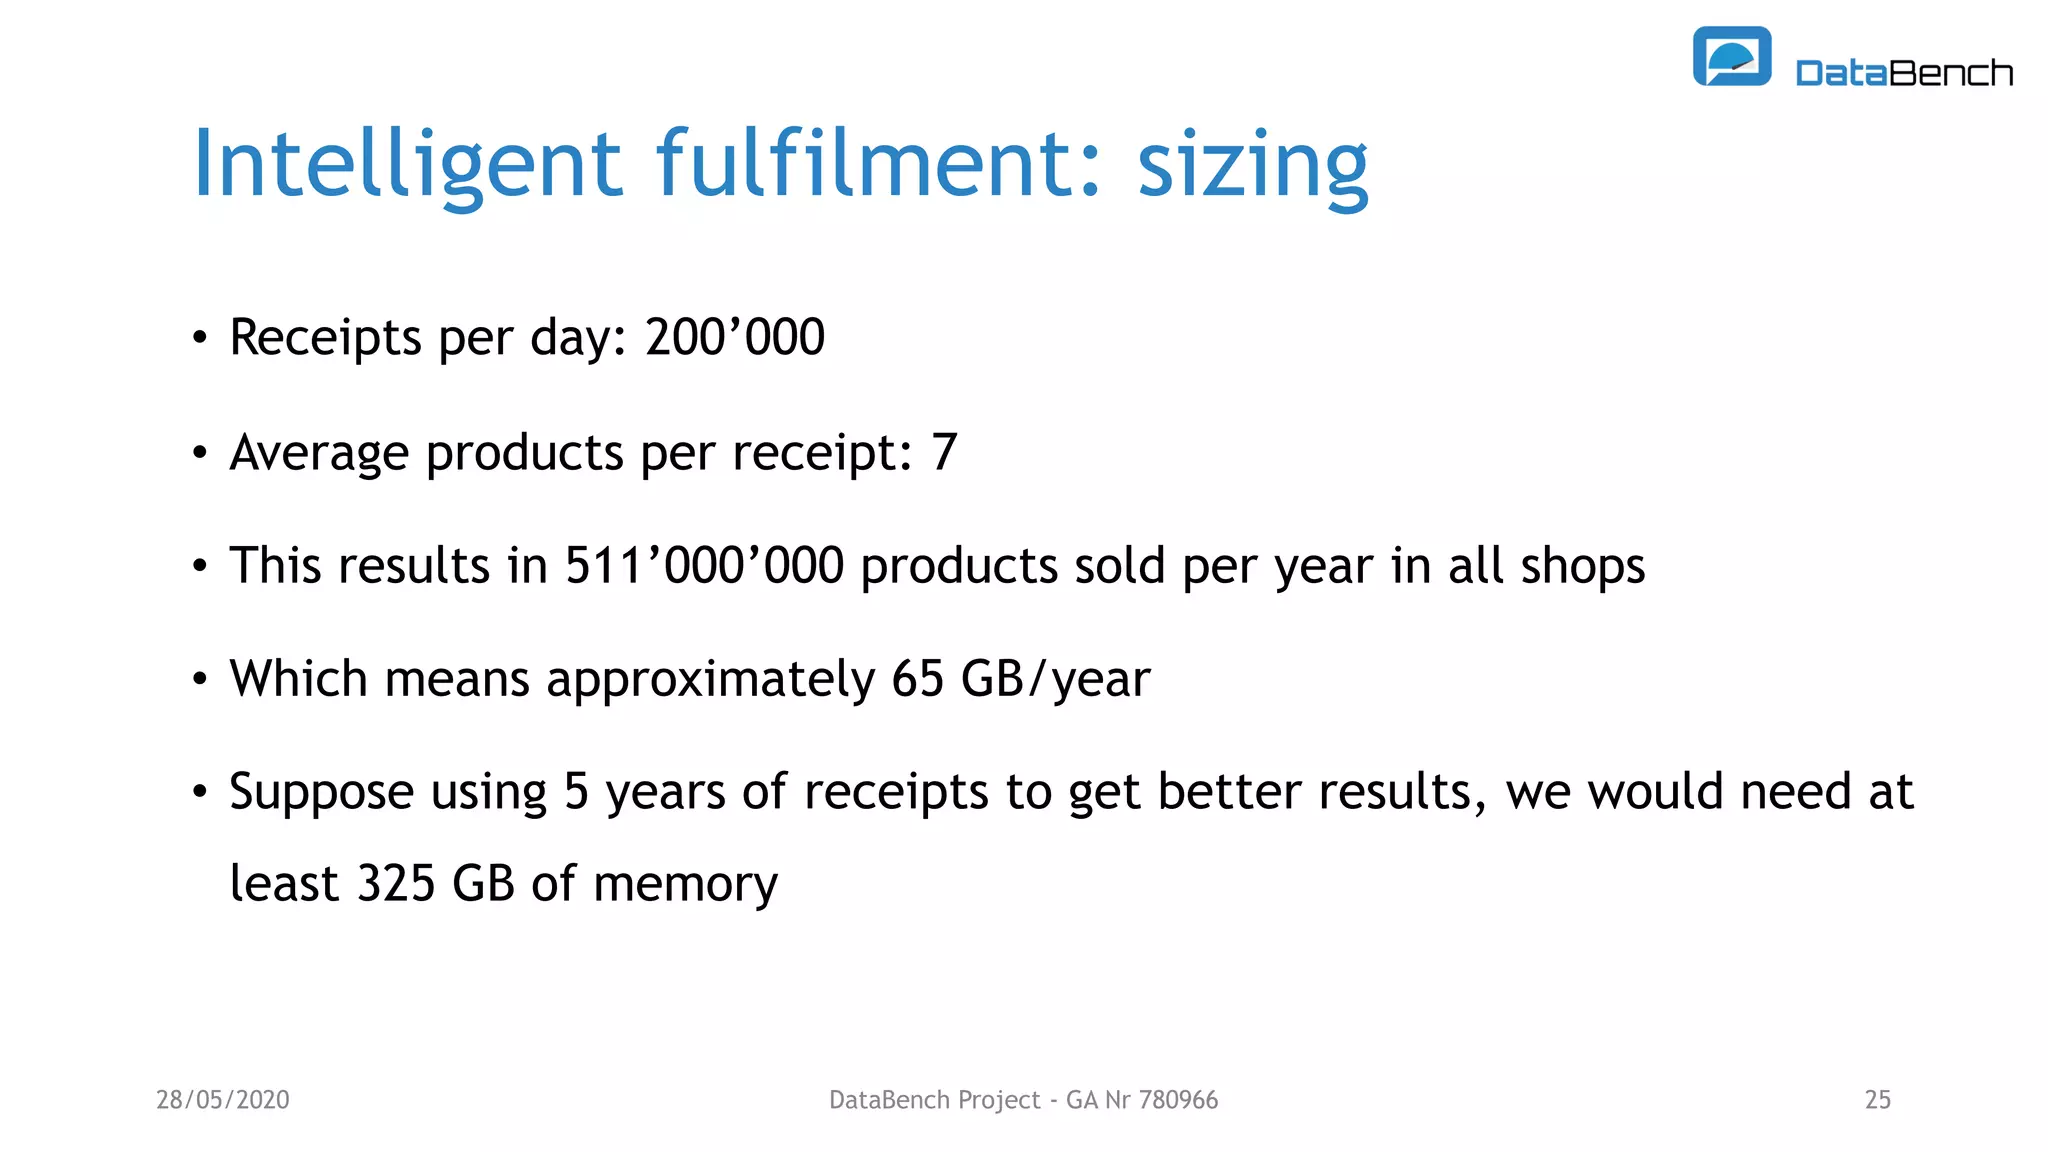
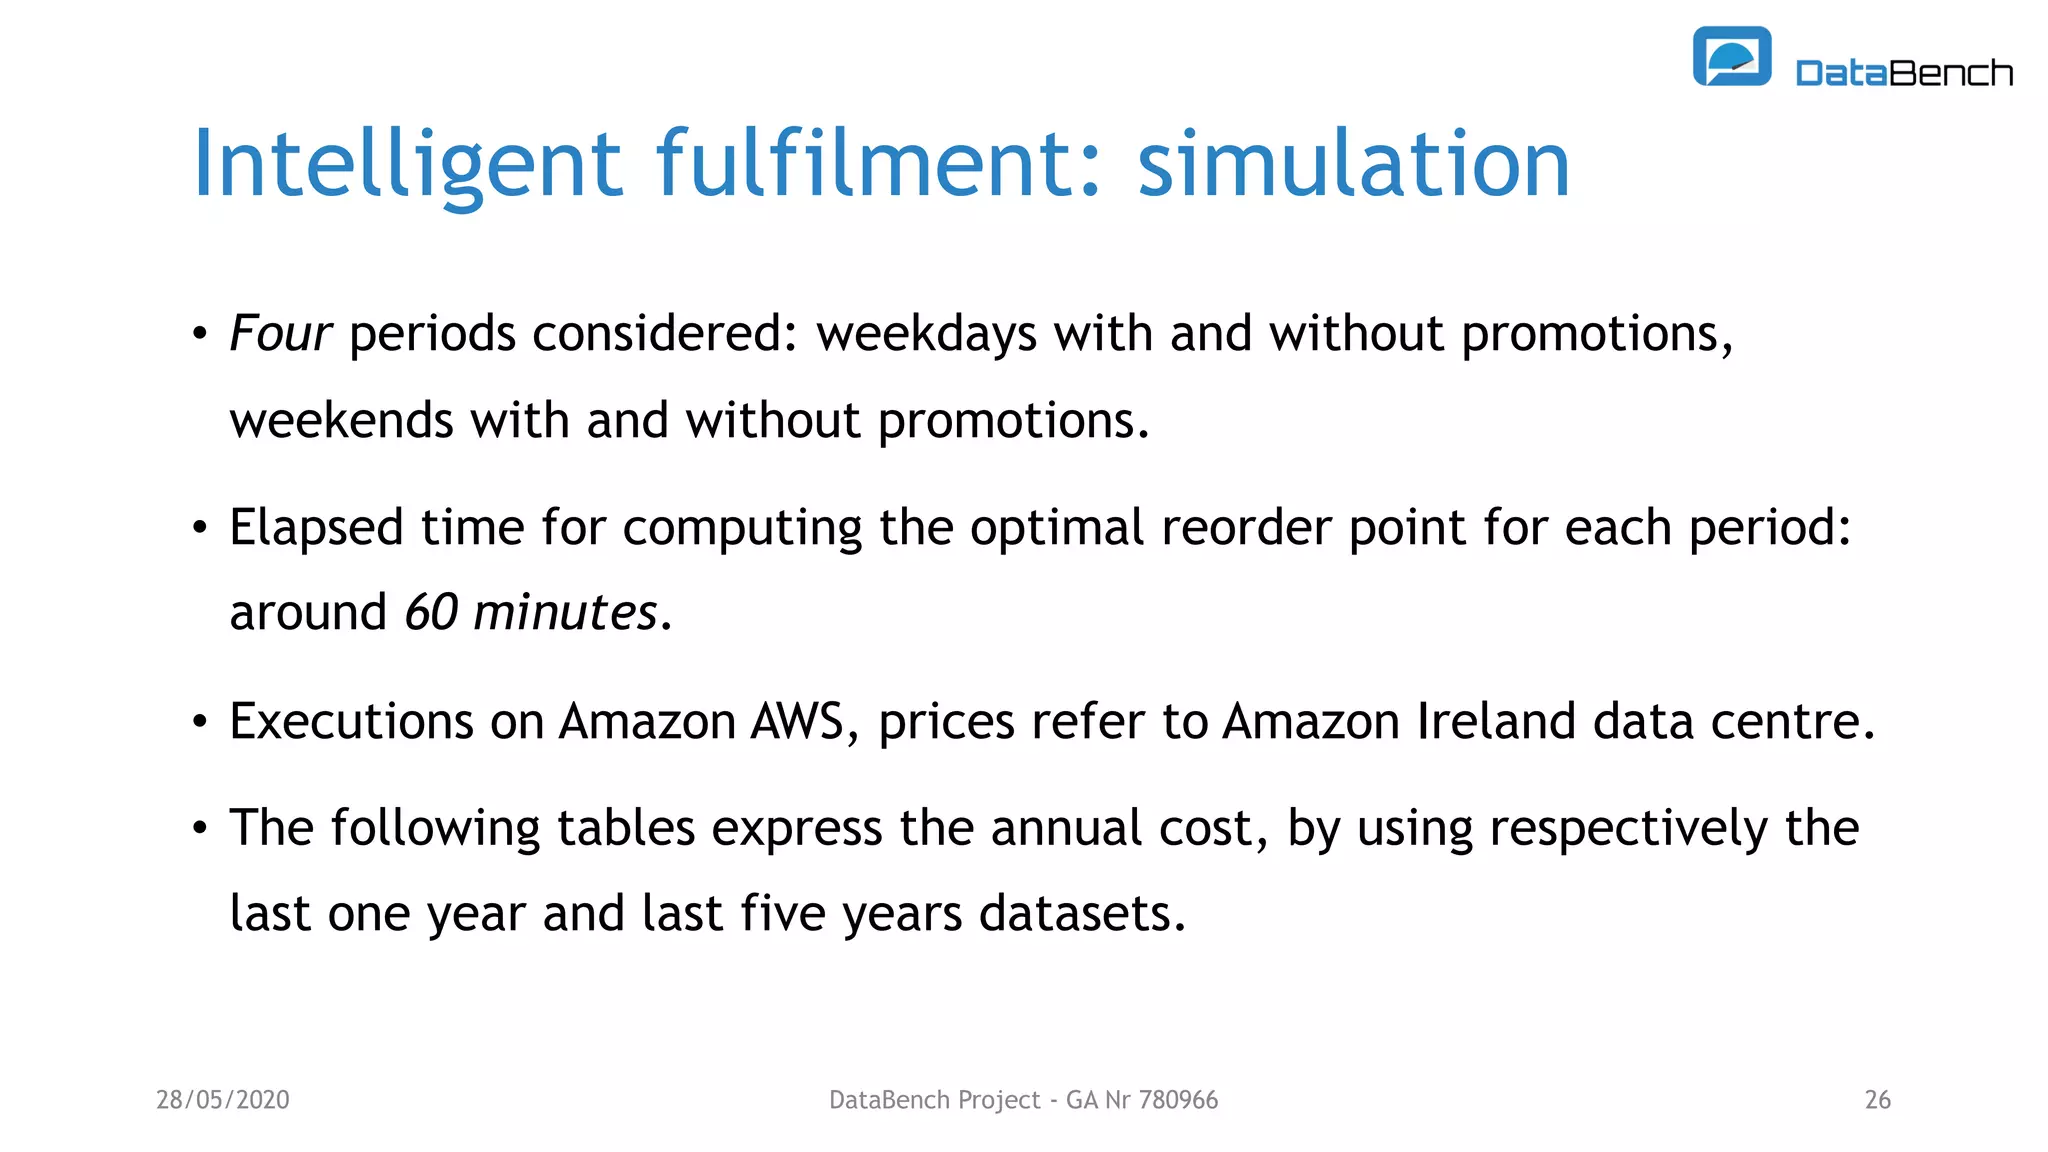
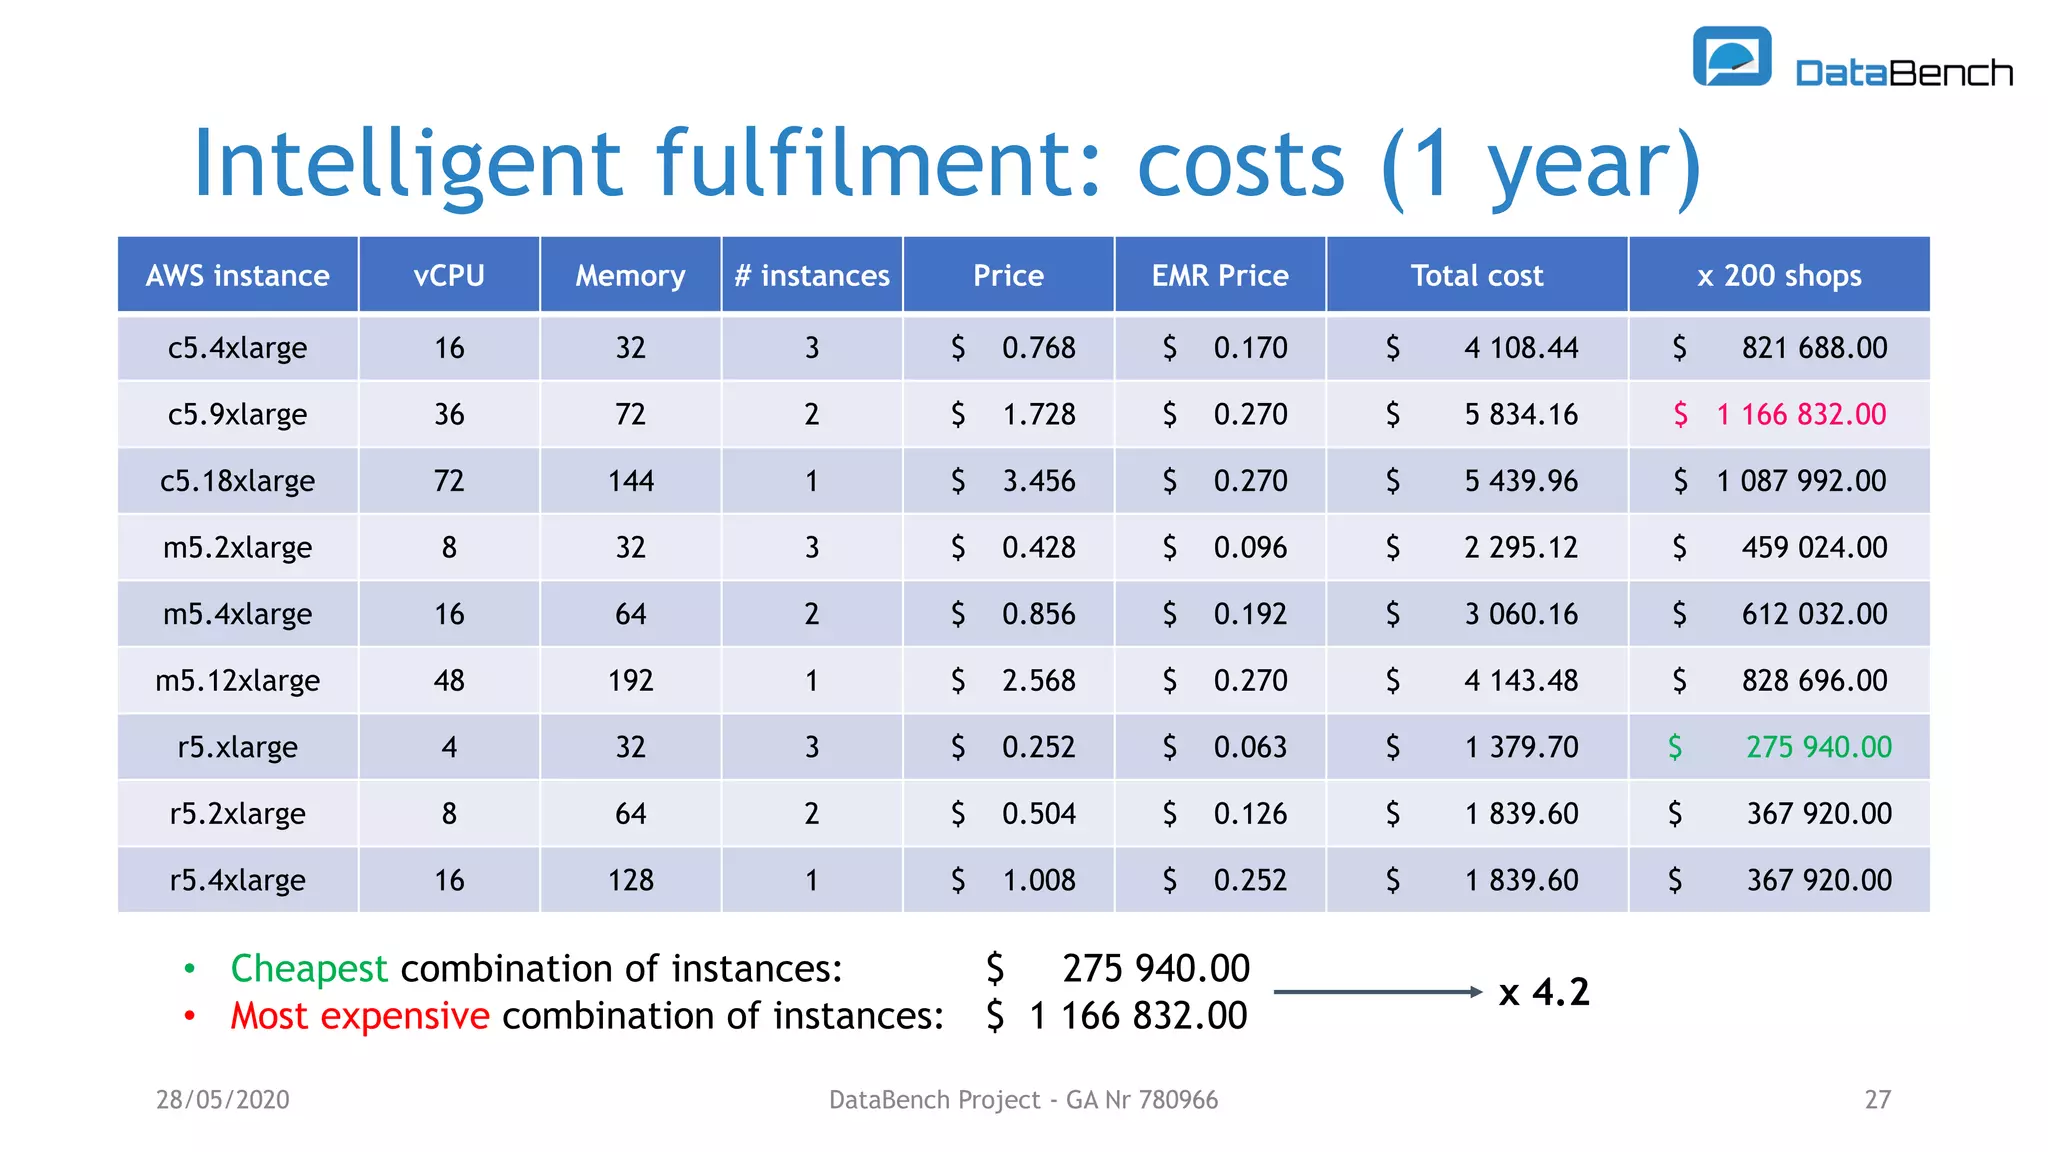
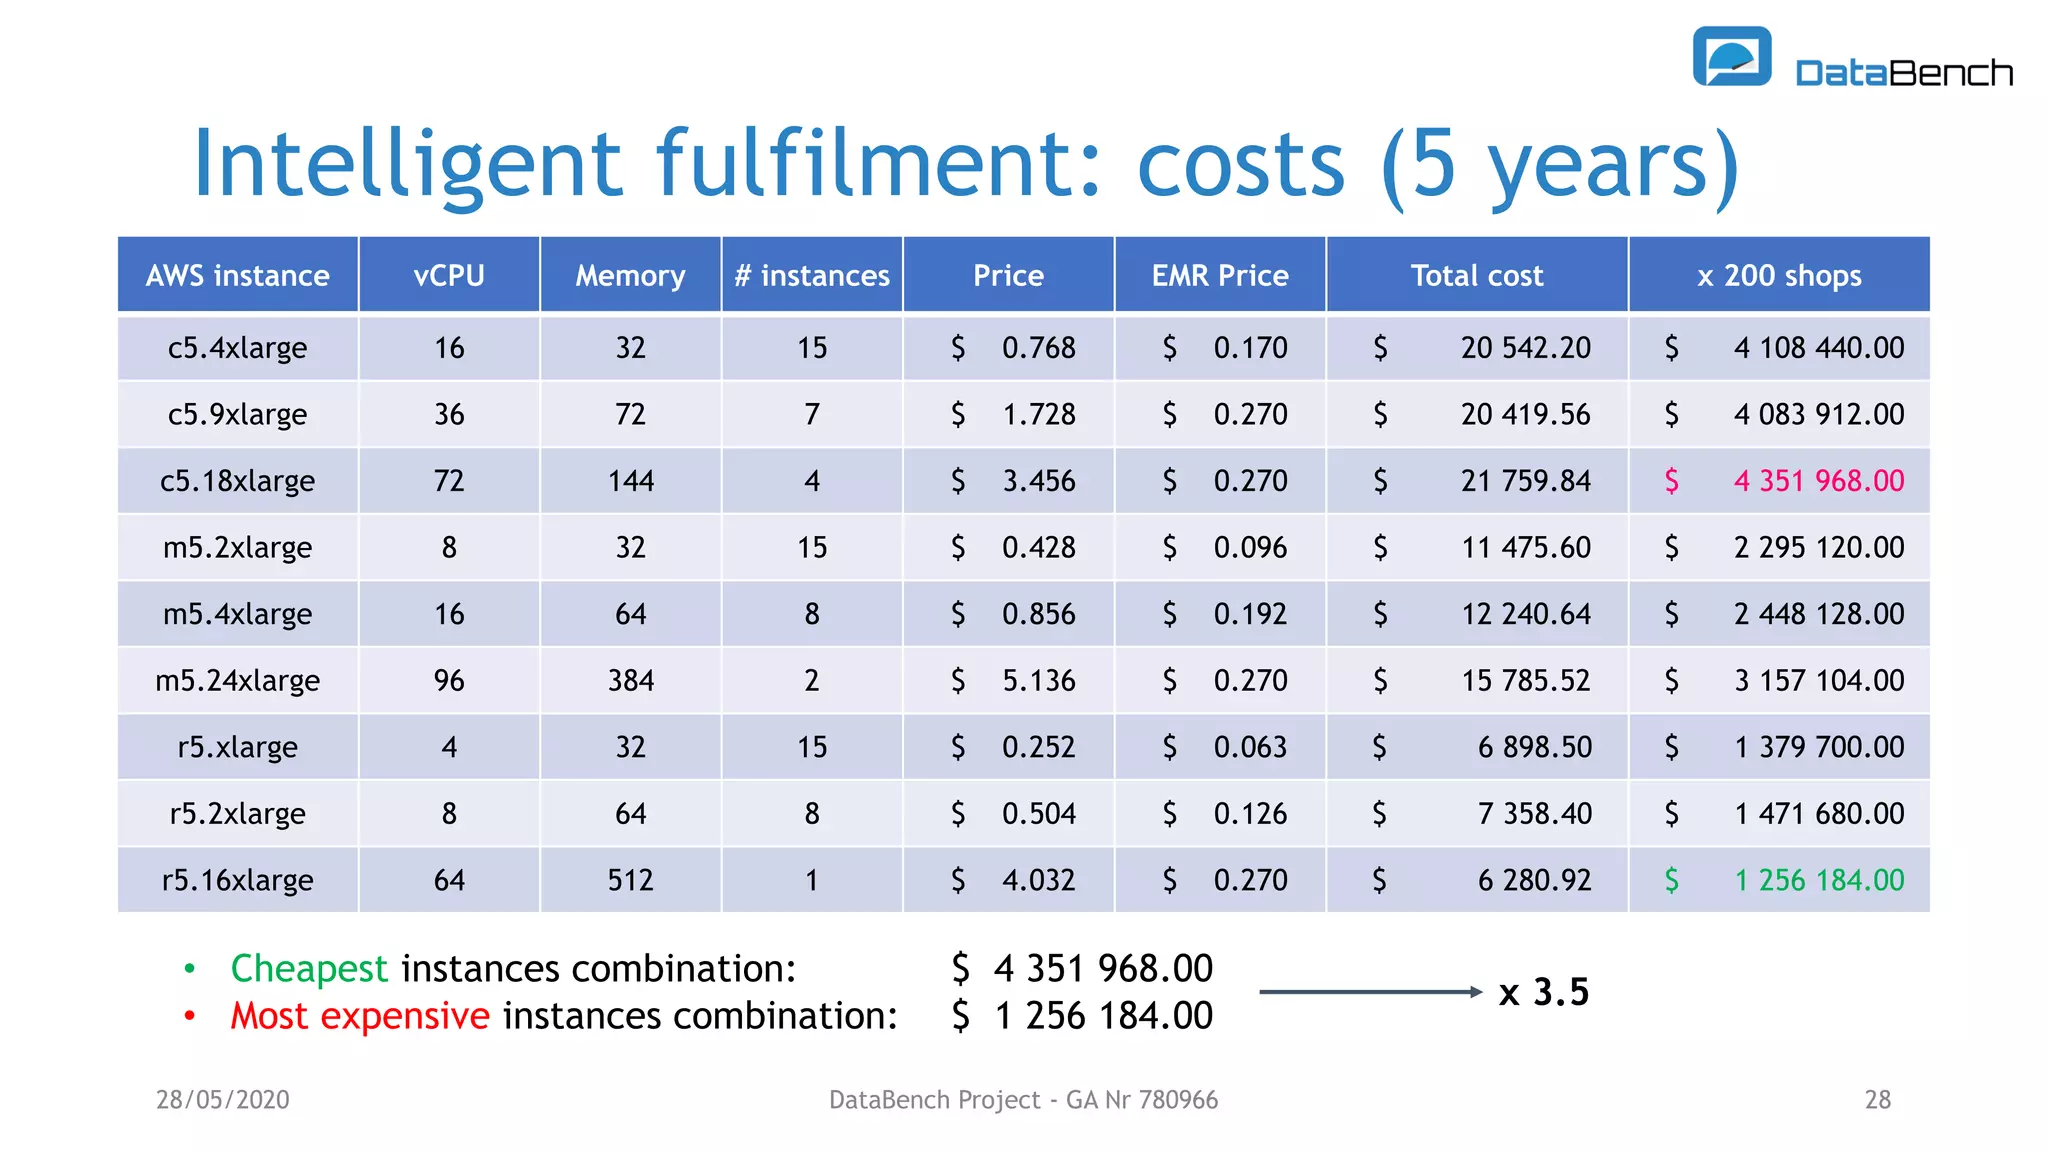
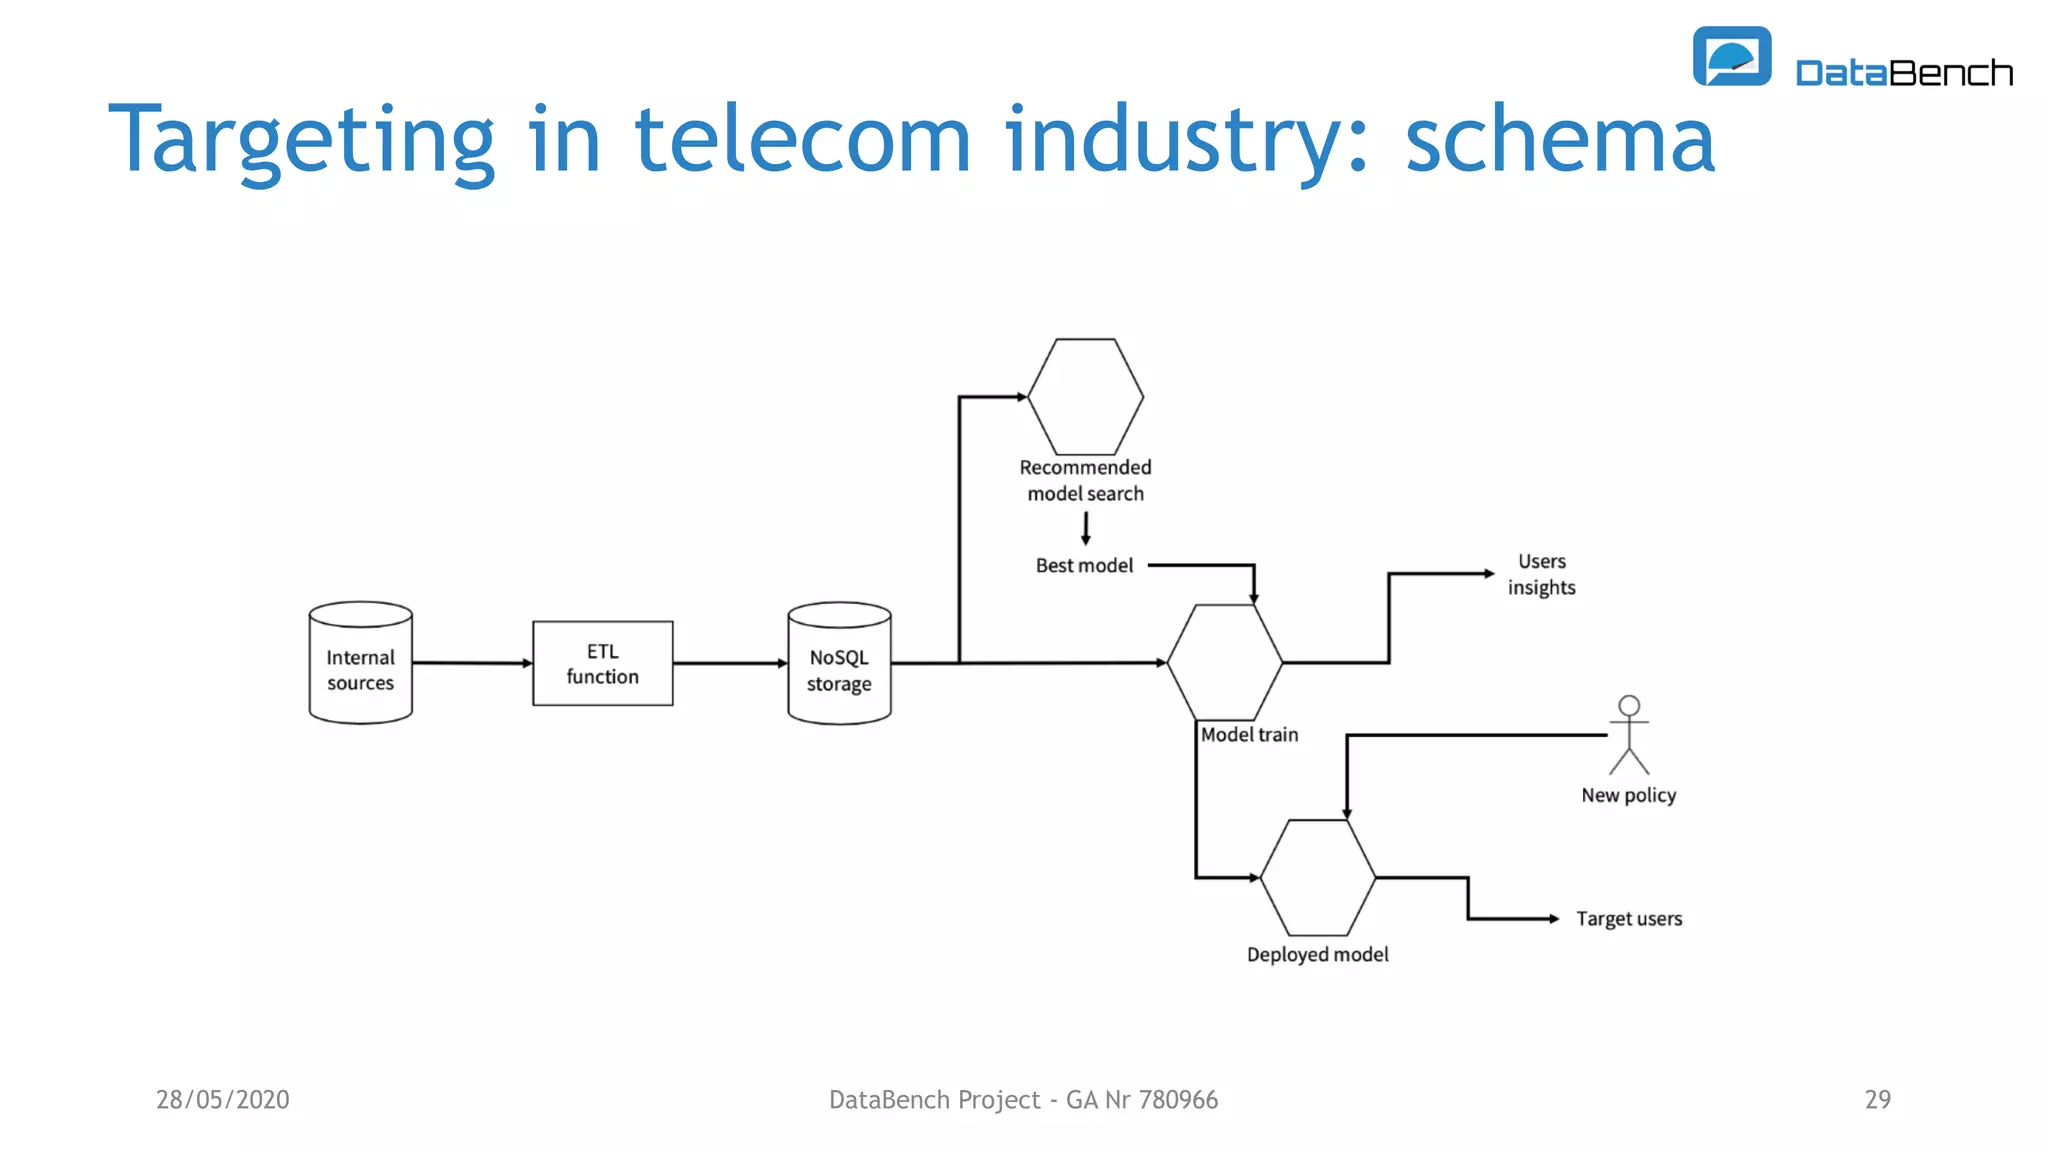
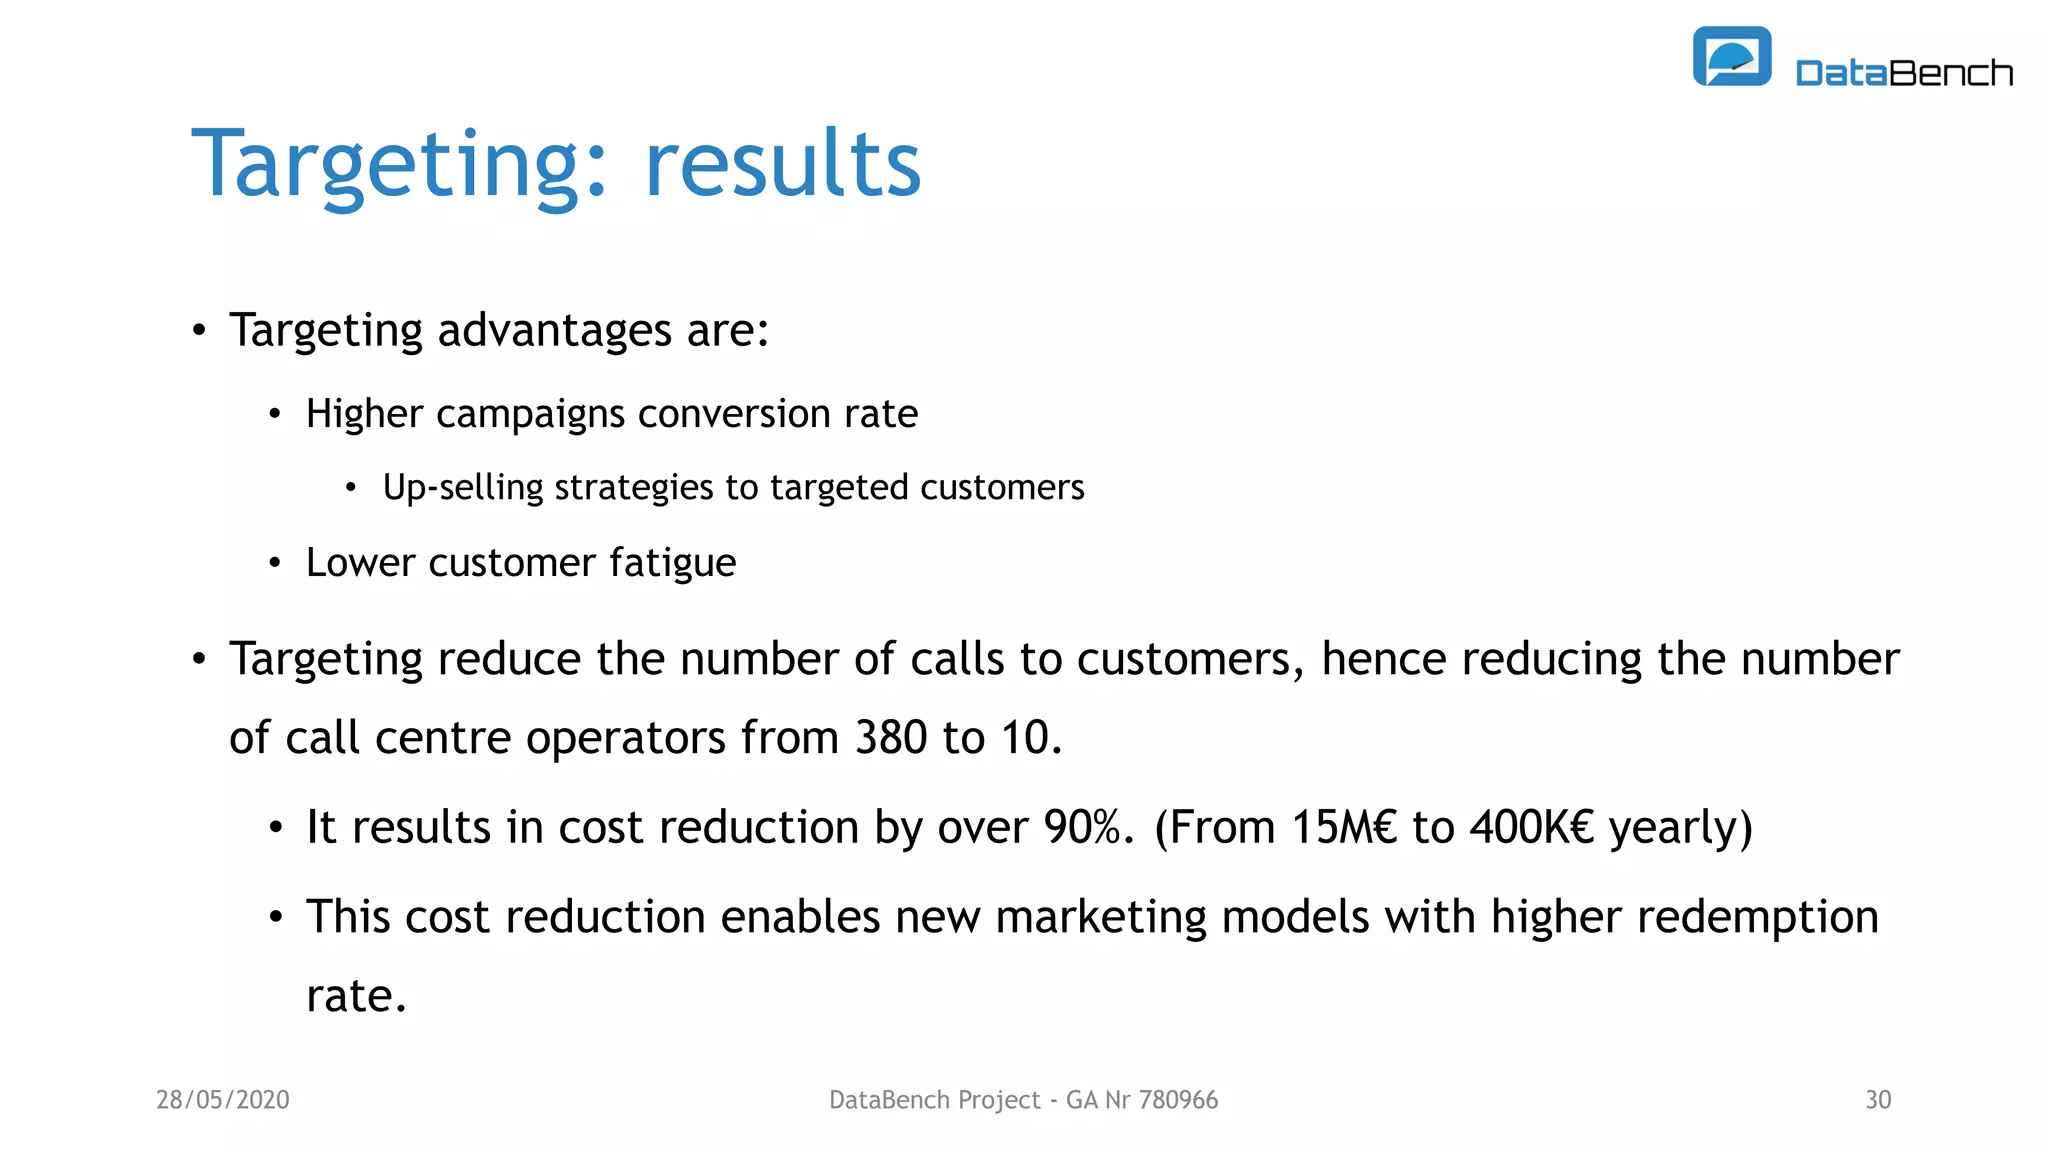
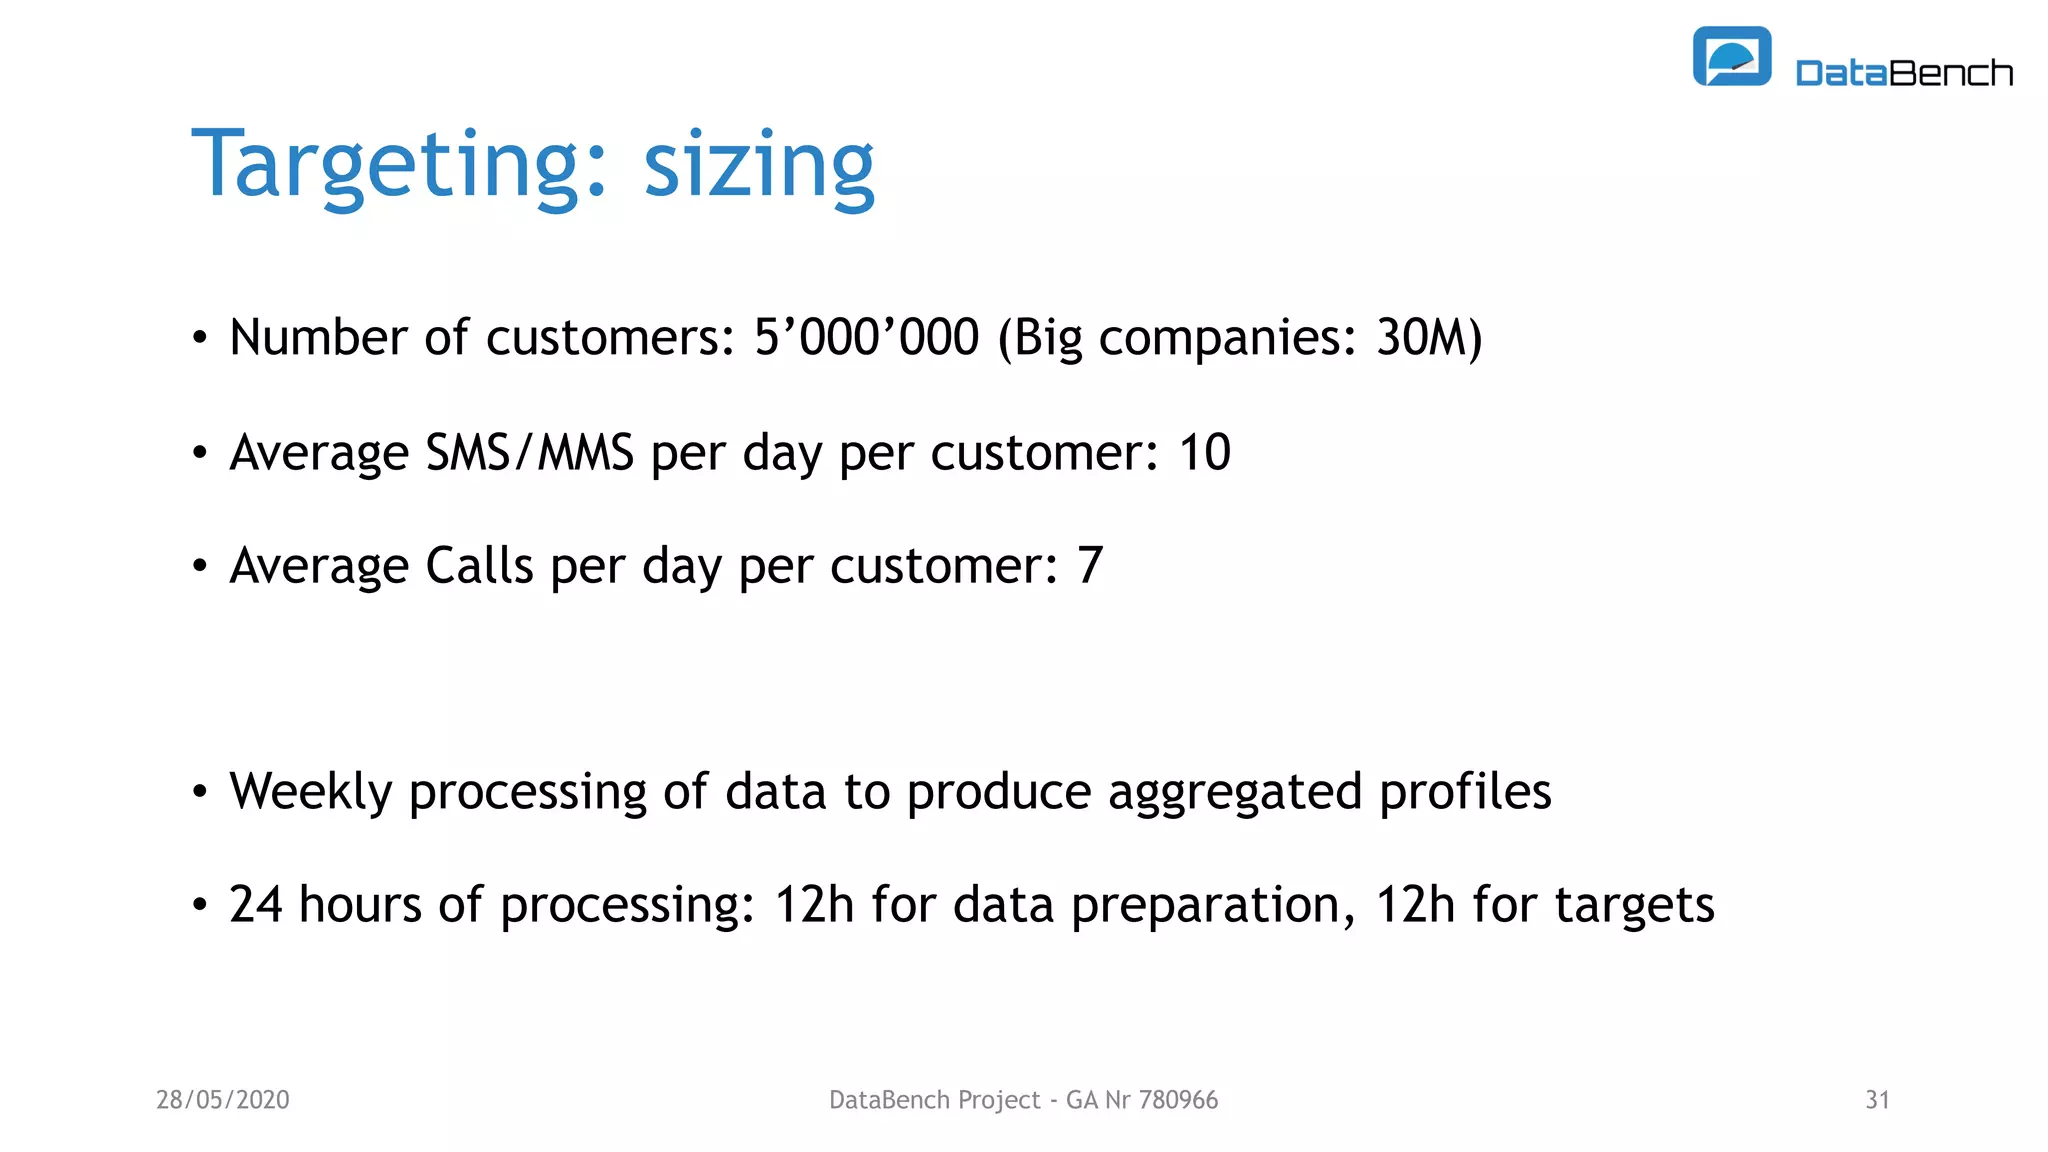
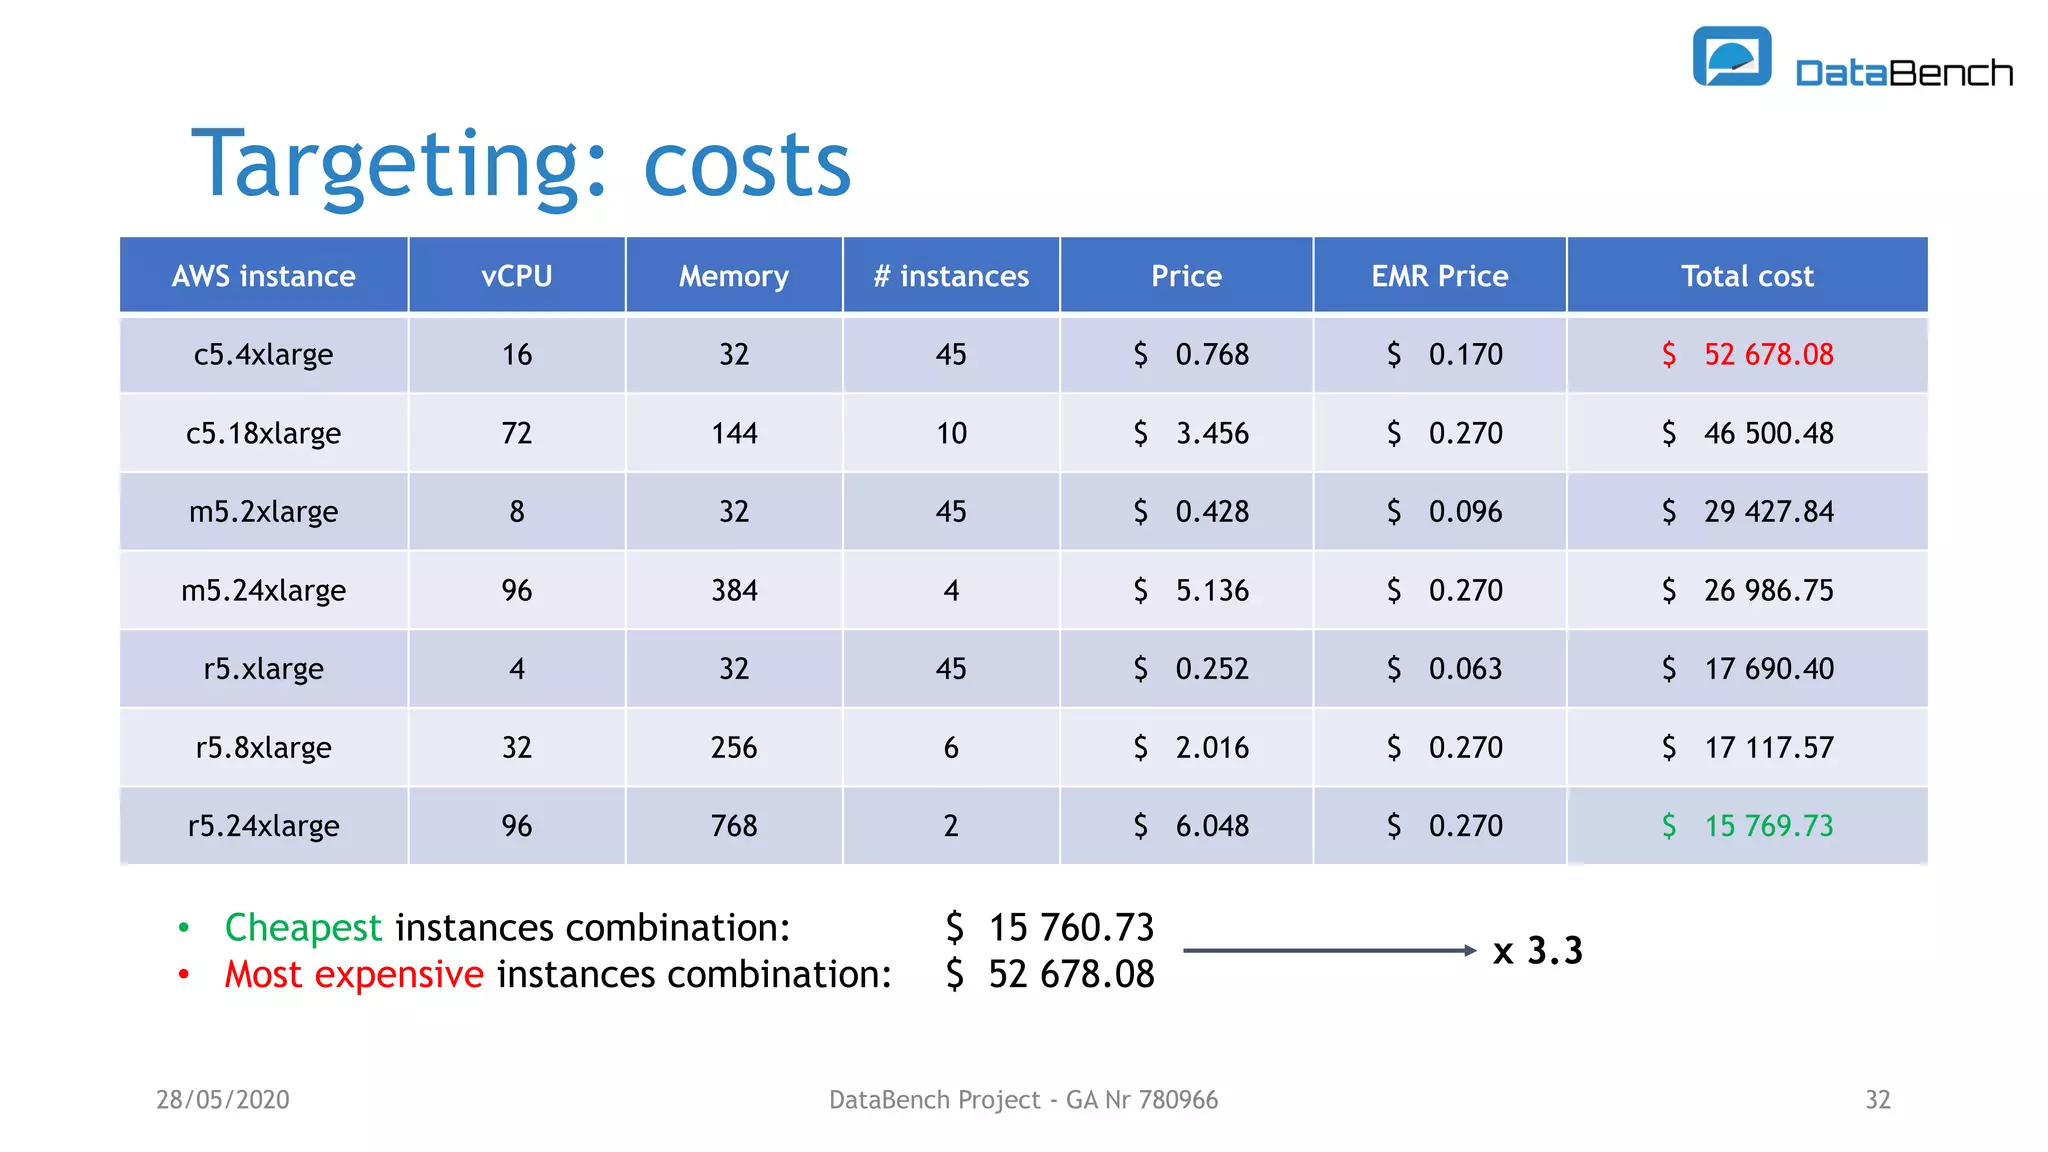

The Databench project evaluates the impact of big data technologies on business performance through industrial benchmarks and case studies. It identifies trends in data handling and analytics, highlighting the importance of data integration and technical benchmarking for informed decision-making. Key insights reveal the varying use of analytics types and the benefits of cloud solutions, with specific case studies demonstrating successful applications across multiple industries.


![[DSC Europe 25] Jon Dajci - Bridging TradFi and DeFi: Building the Future of ...](https://cdn.slidesharecdn.com/ss_thumbnails/fqmhfvlbqhkihjvqvhmu-7-251211083849-6af7e325-thumbnail.jpg?width=640&height=640&fit=bounds)


![[DSC Europe 25] Bassam Maharmeh - Artificial Intelligence: Opportunities and ...](https://cdn.slidesharecdn.com/ss_thumbnails/thhfmr2fqpawzj7hsjpg-5-251211083048-2c23204f-thumbnail.jpg?width=640&height=640&fit=bounds)


![[DSC Europe 25] Katherine Forrest - AI NOW: Understanding the Velocity of Cha...](https://cdn.slidesharecdn.com/ss_thumbnails/wvvbruqfrci0sfq9xwgb-4-251212104007-e5ad1987-thumbnail.jpg?width=640&height=640&fit=bounds)
