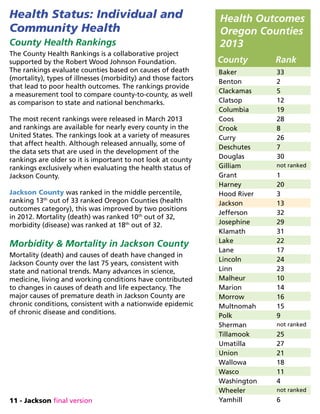
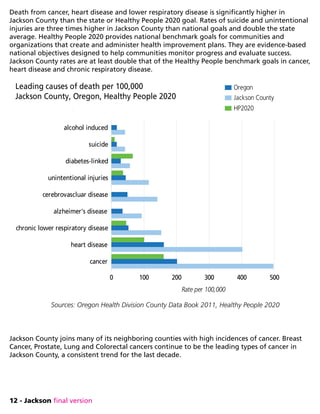
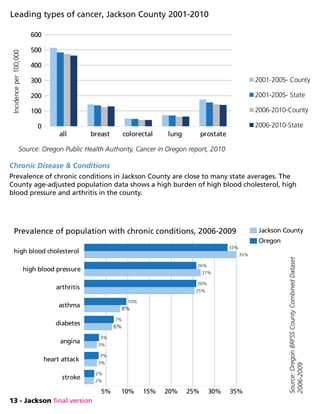
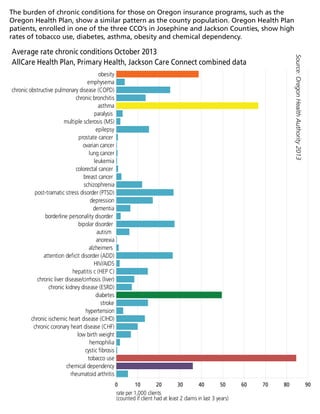
The Community Health Assessment provides an overview of community health issues in Jackson County, Oregon based on a review of data from 2013. It finds that while Jackson County saw population growth from 2002-2008, it experienced an outmigration of younger residents from 2008-2010 due to job losses. At the same time, the elderly population increased, with 18.8% of residents over 65 years old in 2012. The assessment identifies chronic diseases, mental health, addictions, and access to care as key health issues. It incorporates input from community focus groups and interviews to understand resident perspectives on local health priorities and strengths of the healthcare system.
![20 - Jackson final version
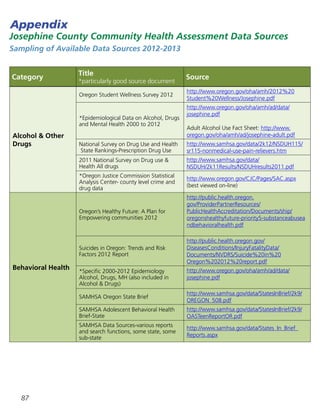
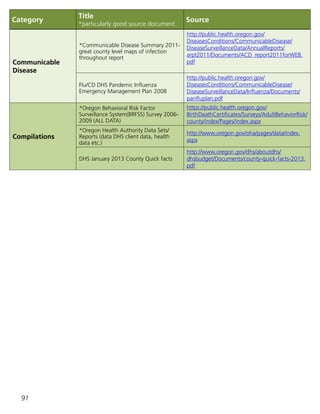
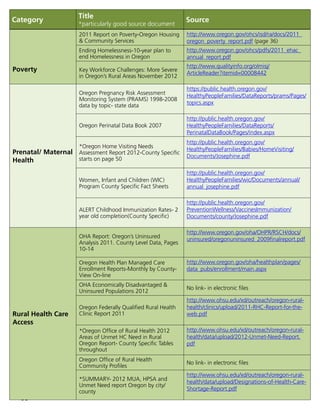
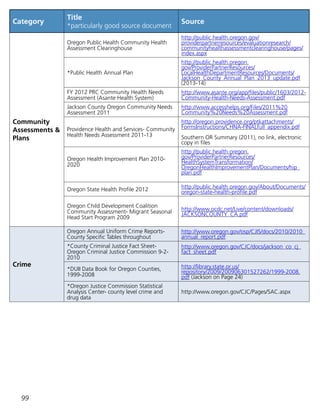
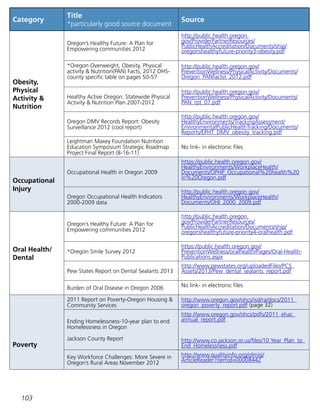
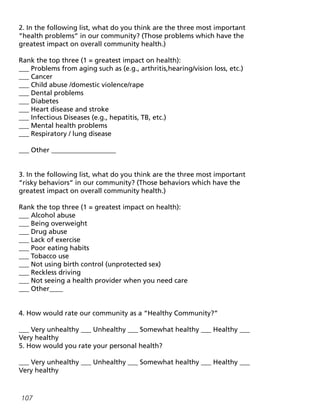
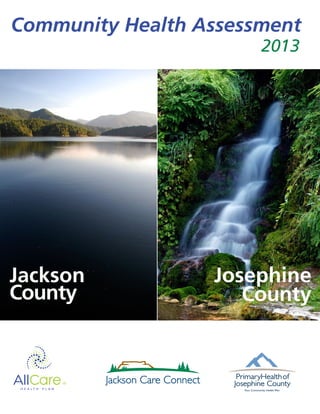
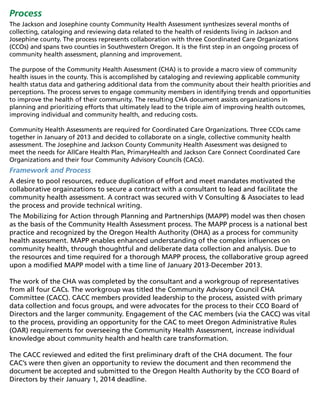
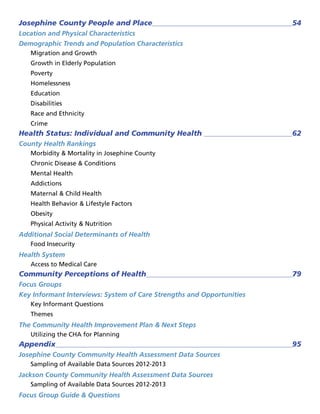
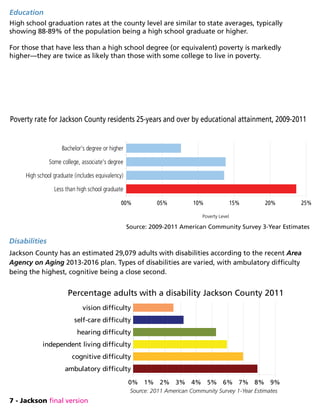
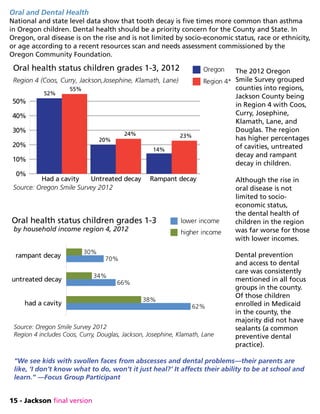
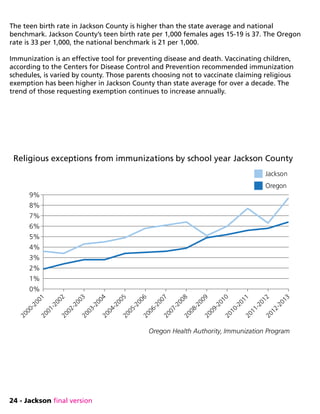
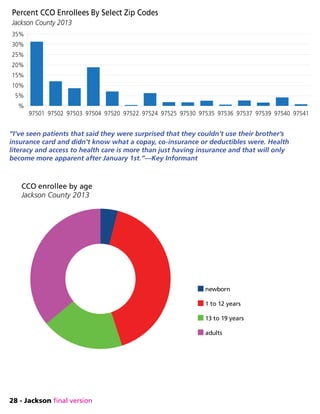
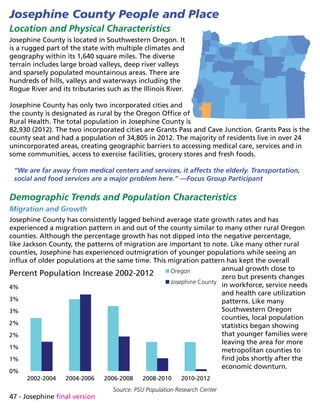
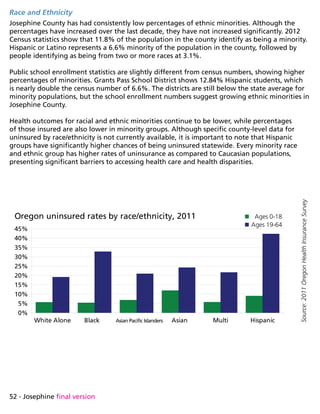
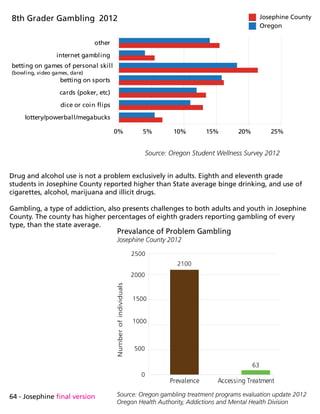
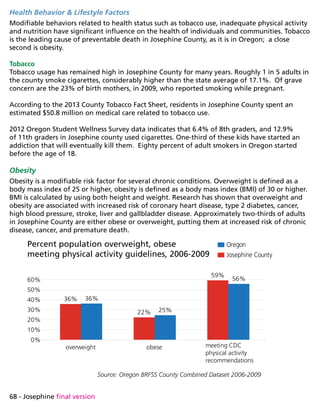
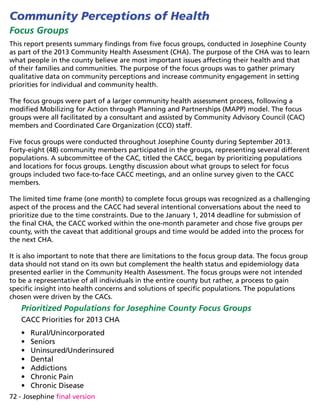
The rate of DUII (driving under the influence of intoxicants) is a data set reviewed when
evaluating impact of addictions on a community. For well over a decade, rates of DUII has
been higher in Jackson County than the state average.
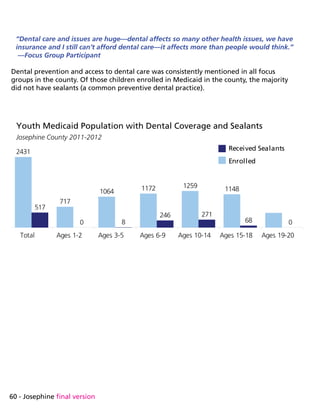
Drug and alcohol use is not a problem exclusively in adults. Jackson County shows youth
reporting higher rates of cigarette, alcohol, binge drinking, marijuana and illicit drug use than
state averages, for grade school through high school.
“Kids come back from lunch [at my school] visibly high—having smoked their parents’
stash at lunch. Everybody knows who the smokers are here, but there isn’t much that we
can do about it.” —Focus Group Participant
Source: 2012 Oregon Student Wellness Survey
smoked cigarettes alcohol binge drinking marijuana any illicit drugs
0
5
10
15
20
25
30
35
40
45
50
Youth Drug Use — Jackson County 2012
percentageusedinpast30days
grade 6- county
grade 6- state
grade 8- county
grade 8- state
grade 11- county
grade 11-state
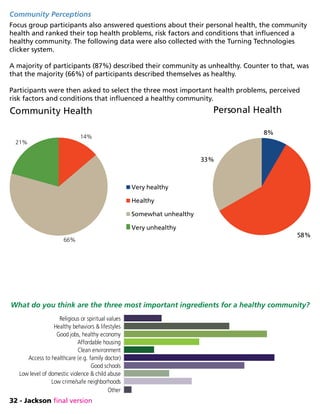
Source: DUII Data Book for Oregon Counties, 1999-2008
1999 2000 2001 2002 2003 2004 2005 2006 2007 2008
0
2
4
6
8
10
DUII Offenses 1999-2008 Jackson County
Oregon State
Rateper1000](https://image.slidesharecdn.com/jacksonsubstanceabuse-150806090559-lva1-app6891/85/Substance-Abuse-Jackson-Michigan-30-320.jpg)
![34 - Jackson final version
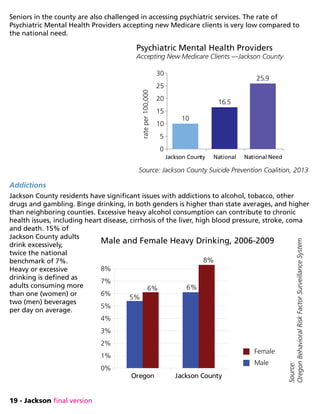
Access to and Quality of Health Services
Focus group participants consistently brought up barriers to accessing health and medical
services. Insurance (or lack of), paying for health care services, physically getting to a health
care provider (transportation), language barriers, having providers available and the
relationship with providers were all common themes in every focus group.
“Insurance needs to be more cost effective for us—I don’t want it for free, but it needs to be more
affordable so that we don’t have to choose between feeding my kids or getting medical care.”
“Some clinics don’t want to treat all issues at the same time, they only treat one issue at a time—
they ask for multiple appointments—but that requires more paying,deductibles, or copays.
“For years, I’ve been trying to get on OHP but I am over income—so I have to save for emergencies
and just deal with my pain.”
“[My biggest concern is] access to healthcare, being able to go to the doctor when you need to,
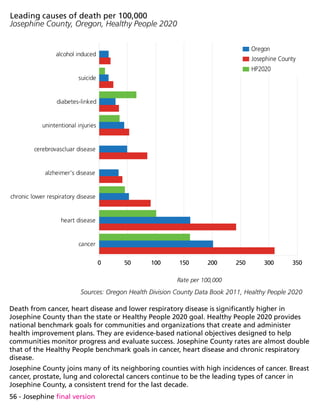
not always going to emergency room.”
“Availability of healthcare—up to a week ago I had no health insurance—I skipped a few doctor
appointments which made my chronic conditions worse and cost [more] in the long run.”
“Availability—getting into the doctor or specialists took me six months. You could be dead by
then. Even when you have insurance getting in is not always easy.”
“Continuity of care—not all docs on the same page, they all treat differently—not coordinated at
all.”
“Negative: Cost of healthcare, even with insurance, is a barrier. Positive: Availability of quality
healthcare in our community.”
“Most of the time, we just get over the counter medications or share each others prescription
medications and then it gets worse. We can’t afford to get the labs/tests to determine what is
wrong too, so it just gets worse.”
“Access isn’t just about insurance—we need more services, access on many different levels. More
of all services are needed, addictions, prenatal, all services are needed.”
“Transportation—even those that have chronic diseases—must have insurance but getting to the
provider is super difficult.”](https://image.slidesharecdn.com/jacksonsubstanceabuse-150806090559-lva1-app6891/85/Substance-Abuse-Jackson-Michigan-44-320.jpg)
![35 - Jackson final version
“A woman at the gas station told me she was happy to see a clinic start in Butte Falls—and that
it will save peoples’ lives on the road. Older people were driving and either waiting too long or
getting in an accident—she told me, in tears, about several that she knew [that] died after leaving
the gas station to get to Medford.”
“Somebody might want to get to a workshop but they have no transportation, transportation is a
huge need.”
Mental Health and Addictions
Challenges with mental illness and addictions weighed heavily on all groups. The effects of
both on the individual and community were prevalent in many conversations about what
concerned participants and what solutions they wanted to improve their health and the health
of their community.
“Mental health problems, people don’t think they can be healthy so they turn into negative
thinking. If you are healthy mentally you are less prone to do drugs.”
“The biggest factor is lack of a continuum of mental health supports and services. Services seem to
be focused on meeting crisis needs rather than prevention and community support due to lack of
funding.”
“Mental illness and substance abuse are huge and costly. Also, the criminalization of mentally ill
and addicted individuals is an ineffective and costly approach to dealing with these issues.”
“Just about everyone I know has had an addiction. People with addictions are more sick, can’t get
to the doctor, don’t have health insurance and are embarrassed.”
“We need clean needles. I see needles laying around all over the place, in the street, on the
sidewalk, its disgusting and I was a user.”
“I am diabetic and used to supply all of Hawthorne Park with hypodermic needles, I got over 200 a
month and didn’t need them all. I’m here now (inpatient treatment) so I don’t know who is giving
out clean needles.”
“People are scared now—because of more homeless people are in the woods and the drug culture
they bring.”
“Substance abuse is another serious issue in our community across all economic levels. Also a lack
of adequate mental health services is a big problem.”](https://image.slidesharecdn.com/jacksonsubstanceabuse-150806090559-lva1-app6891/85/Substance-Abuse-Jackson-Michigan-45-320.jpg)
![36 - Jackson final version
“We need less probation-focused treatment.”
“Pot, heroin, pills and prescription pills. People have gotten pretty creative. Like snorting Excedrin
migraine in their nose (in my high school).”
“Two years ago we had a huge problem with inhalants—kids were doing them at football
games—whipits with whip cream inhalants. My nephews were killed last year from doing whipits
and getting in a car accident.”
“Kids come back from lunch (at my school) visibly high—having smoked their parents’ stash at
lunch. Everybody knows who the smokers are here, but there isn’t much we can do about it.”
“Lack of resources [is a problem] they are out there but they are always broken. Bus passes, food
banks, etcetera are broke. It’s hard to get to resources. Not a lot of help for women with no
children. Jackson County Mental Health only has 12 visits a year—that’s not enough, it’s like you
just start getting into your problems and have to stop.”
“Homelessness, limited help for young single people. Hard if you don’t have parents to help you.”
“Out of fifteen of my preschoolers—four were raised by grandparents last year. They aren’t always
healthy [the grandparents]—and their health affects the kids and the grandparents. Plus, its
stressful to raise your grandkids.”
“Bullying is destroying our future, education systems are atrocious, our country is at the bottom of
education scales, (writing, math, science and reading) and it affects our health.”
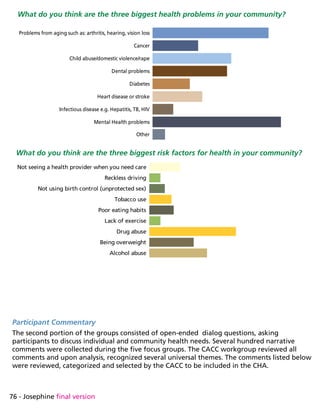
Lifestyle: Exercise, Obesity, Nutrition and Access to Food
The need for lifestyle changes, including diet and exercise were clearly recognized in all
groups. Participants were quick to recognize their own challenges with lifestyle change while
also making suggestions for solutions such as community gardens, walking groups or farmers
markets.
“Habits are hard to break and start from our family going way back. I do what my parents did, and
food and life has changed, so should our habits.”
“Unhealthy food seems to be more convenient.”
“Access to resources to live a healthy lifestyle is hard. Food access here is bad—small stores
in small communities have mostly processed foods, they can’t afford to bring in fresh out of
town produce. That’s made worse with the fact that those with SNAP use their food stamps for](https://image.slidesharecdn.com/jacksonsubstanceabuse-150806090559-lva1-app6891/85/Substance-Abuse-Jackson-Michigan-46-320.jpg)
![37 - Jackson final version
processed food-the money goes farther with processed food.”
“It costs $20 gas to get to Eagle Point [out of rural town] to a grocery store with good produce,
there is no public transit except “‘the thumb .’” (hitchhiking)
“Part of the problem is the lack of real education around nutrition and disease prevention.”
“With no grocery store with produce here, sometimes I call the local café and ask them for a head
of lettuce when I need it.”
“As a family—lack of consistent exercise for entire family affects our health—life is busy, exercise
becomes last on the list of priorities.”
“Kids don’t play outside—they sit in front of video games.”
Dental and Vision Health
Access to dental care and the negative effects of not having both preventive and crisis dental
care was a consistent theme among all groups and demographics. Vision health was also
mentioned in approximately 60% of the groups, related those living in poverty and not being
able to acquire glasses or contacts.
“[There are] lots of dental issues here—all they do is pull your teeth. When you don’t have teeth
you lose self esteem.”
“Dental appointments are still 2-3 weeks out even when in pain, what if I have a bad infection?
People can die without help.”
“We see kids with swollen face from abscesses and dental problems—their parents are like, “I
don’t know what to do, won’t it just heal?” It affects their ability to be at school and learn even
when they are there.”
“Vision services—glasses are expensive and if you can’t see you probably can’t work—half the
people that we serve at the food bank can’t see the line to sign for their food box.”
“Lack of affordable dental care—if you don’t have teeth, you can’t eat—it’s expensive to get
care—fillings, root canals which can lead to other chronic conditions. If it costs you $170-200 to
get your teeth cleaned, you probably won’t do it if you can already barely make it.”
“Homeless people don’t have the freedom to eat well, they eat whatever they can get, which is
usually not healthy food. Canned chili should not be a staple of anyone’s diet.”](https://image.slidesharecdn.com/jacksonsubstanceabuse-150806090559-lva1-app6891/85/Substance-Abuse-Jackson-Michigan-47-320.jpg)
![38 - Jackson final version
“The homeless can’t get glasses because of [not having] ID for the Lions Club. ‘Free’ glasses—they
aren’t free.”
Poverty and the Economy
Poverty and the economy influences individual, family and community health. All groups
consistently discussed their influence on health, having lengthy conversations about how
improving the economy, jobs and not living in poverty would help improve health.
“No, [we are not healthy] because of homelessness. It’s embarrassing to go to doctor’s office and
they ask for address and I don’t have one.”
“I am very concerned at the growing numbers of families needing emergency food who are
food insecure, and the lack of affordable housing which is the number one need reported by the
families in my program.”
“We are not healthy enough. We have too much poverty, uninsured, lack of public health
programs, no affordable housing, too many homeless and jobless.”
“Multiple families are living under one roof since the economy went downhill-it affects everyone’s
health.”
“Childcare—hard to get benefits for it if you work and it’s expensive.”
“I think the health of the people in our community varies from very healthy to poor health. Some
groups are every physically active and health conscious with good incomes and other sub-groups
are impacted by very low incomes, inadequate housing and childcare, which produces high levels
of stress and negatively impacts health.”
Chronic Disease and Aging Issues
61% of focus group participants noted that they were currently living with a chronic
condition. Several participants also discussed challenges of managing chronic pain, particularly
in light of many programs to reduce opioid use in the county.
“I have MS and my husband has diabetes—I bring home preschool kids’colds from work and it
affects our health. In small towns you see small epidemics of flu, it goes through the entire town
and shuts us down. We can’t function with the flu like big cities do.”
“As our population ages—they have more chronic conditions and can’t get the right medical and
support services.”](https://image.slidesharecdn.com/jacksonsubstanceabuse-150806090559-lva1-app6891/85/Substance-Abuse-Jackson-Michigan-48-320.jpg)
![39 - Jackson final version
“Caregiver fatigue—there is not a lot of money for caregivers so family often does it, they get tired
and they have their own health issues like depression, stress, etc.”
“The disabled— the entire group that just fell off Medicare that now won’t get care—hospice care
is narrowing and becoming highly medical focused.”
Crime, Domestic Violence and Child Abuse
Crime and concern about community and individual safety rated as a high concern in nearly all
focus groups. Concern about child abuse and domestic violence and their connection to health
were noted in all groups.
“Public safety. Cutting Sheriff’s Department. Criminals know public safety is last priority.”
“Need more counseling services and support to help families and dependents with trauma.”
Community Engagement in Solutions
All focus groups ended with a question about solutions to the challenges, problems and needs
identified in the prior questions. Specifically, the facilitator asked “what do you think we (as a
community) can do to enhance the health of our community?” The focus was directed at what
solutions participants wanted to be engaged in to address the problems discussed earlier.
All groups, regardless of demographic or location expressed a strong sense of concern about
their community and how they could contribute to improving problems. Several solutions and
positive comments were stated in every group, some of those comments are as follows:
Suggestions
“Embrace that we are all in this together—find things that help more than myself, but my larger
community too.”
“We have a community kitchen, but my problem is awareness and getting them there. I made
apple sauce one time and a lady said ‘oh, you can make apple sauce?’ People want to know how
to improve their life, they just don’t know how.”
“[We need] education for professionals on addictions, being addicted is a disease, we aren’t all bad
people.”
“Make sure I get prenatal care and take care of my baby now so she’s not a drain on the
community later.”](https://image.slidesharecdn.com/jacksonsubstanceabuse-150806090559-lva1-app6891/85/Substance-Abuse-Jackson-Michigan-49-320.jpg)
![40 - Jackson final version
“I will stay clean, be a productive citizen in the community, volunteer work to help others with
addictions.”
“We need more opportunities to keep young people [get] active in good ways instead of getting
into trouble.”
“[We need] more things at schools to give youth direction. Now that I’m clean and sober, I realize I
wasted 44 years in my life-now I want to help and develop myself with education.”
“The meth commercial where they chase the addict like we are a horrible pople, that makes us
more separate. Instead, maybe the commercial should be a hand reaching out to help us with
problems. Reach out to the addict, don’t chase us.”
“Education is key. sometimes it’s about breaking cycles and learning new ways. Education can be
many different levels.”
“I appreciate that all three CCOs are working together for this, it’s hopeful. I am really glad that
they are listening.”
“Develop creative affordable ways to provide community service supports to those suffering from
mental illness to reduce isolation, support recovery, and prevent re-hospitalization.”
“Build and initiate pubic health programs that have community buy-in. Involve public in CCO
process.”](https://image.slidesharecdn.com/jacksonsubstanceabuse-150806090559-lva1-app6891/85/Substance-Abuse-Jackson-Michigan-50-320.jpg)
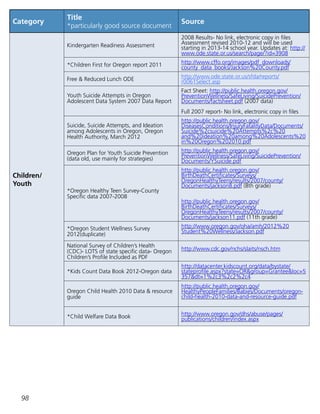
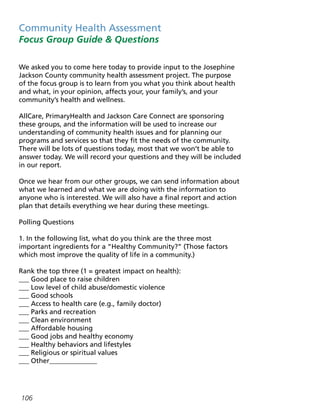
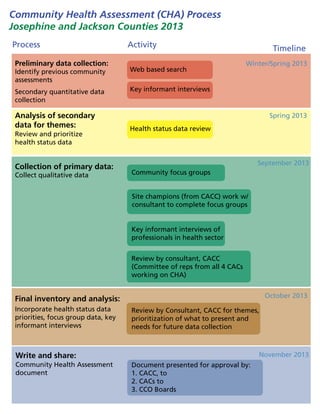
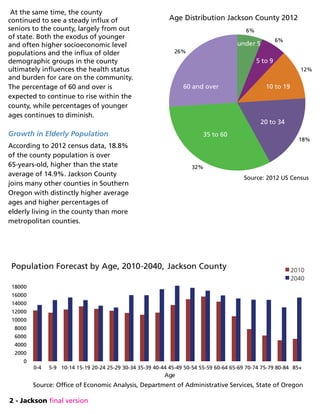
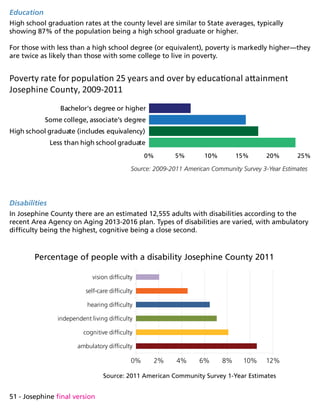
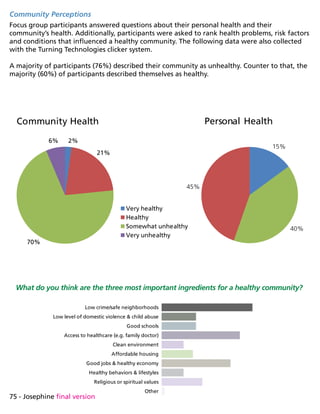
![At the same time, the county continued to see a steady influx of seniors to the county, largely
from out of state.
Both the exodus of younger and often higher socioeconomic level populations and the influx
of older demographic groups in the county ultimately influences the health status and burden
for care on the community. The percentage of 60 and over is expected to continue to rise
within the county, while percentages of younger ages continues to diminish.
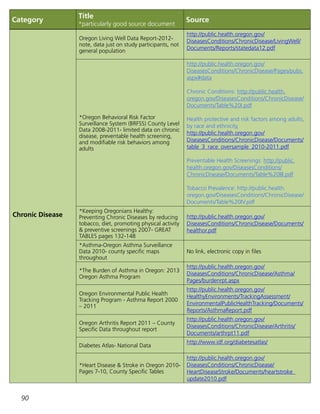
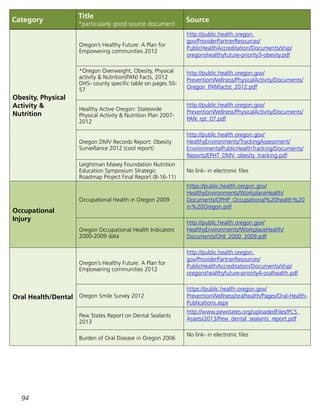
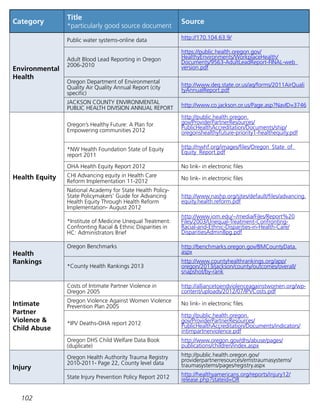
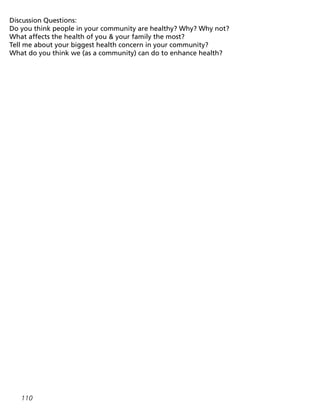
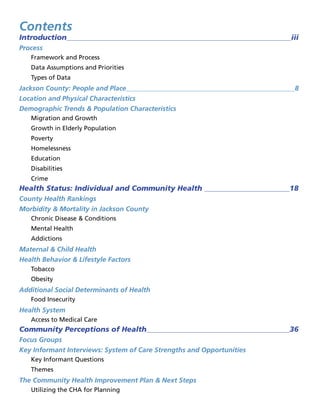
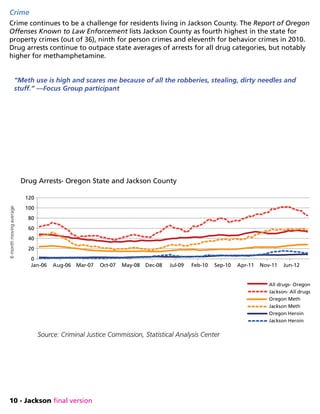
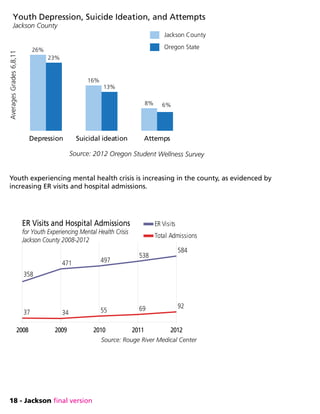
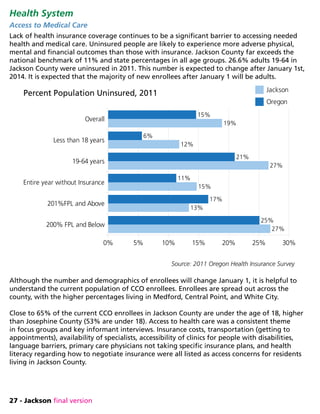
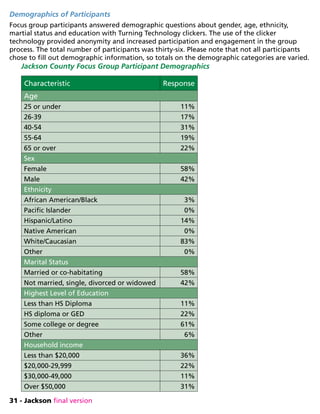
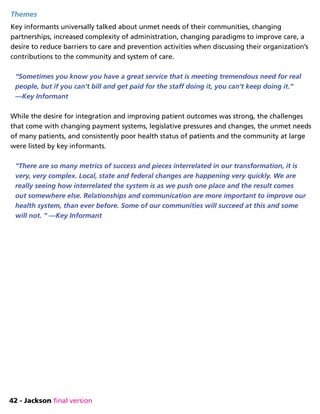
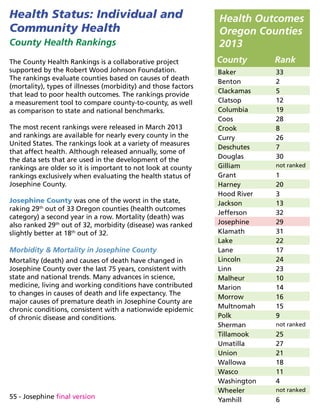
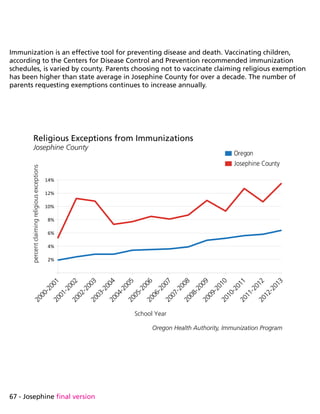
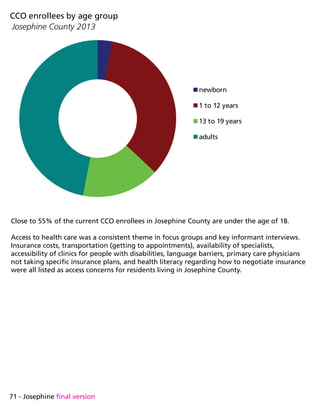
Growth in Elderly Population
According to 2012 census data, 23.6% of the county population is over 65 years old. That is nearly
double the state average of 14.9% and still higher than Jackson County at 18.8%.
Josephine County joins many other
counties in Southern Oregon with
distinctly higher average ages and higher
percentages of elderly living in the
county than more metropolitan counties.
The more isolated rural communities in
Josephine County have higher percentages
of residents over age 60 than Grants Pass,
the county seat.
“People here are old, they don’t have
anyone to help them anymore, they get
isolated [out here] and the group of them
is getting bigger.”
—Focus Group Participant
Age Distribution Josephine County 2012
source: 2012 US Census
5%
6%
11%
15%
33%
30%
60 and over
under 5
years 5 to
9 years
10 to 19 years
20 to 34 years
35 to 60 years
0-45 -9 10-
14
15-
19
20-
24
25-
29
30-
34
35-
39
40-
44
45-
49
50-
54
55-
59
60-
64
65-
69
70-
74
75-
79
80-
84
85+
0
1,000
2,000
3,000
4,000
5,000
6,000
7,000
8,000
Population Forecast by Age, 2010-2040
Josephine County
2010
2040
Source: Office of Economic Analysis, Department of Administrative Services, State of Oregon](https://image.slidesharecdn.com/jacksonsubstanceabuse-150806090559-lva1-app6891/85/Substance-Abuse-Jackson-Michigan-58-320.jpg)
![77 - Josephine final version
Focus group participants’ responses are presented in seven categories. All comments below
were transcribed verbatim. Comments are intentionally written out as they were spoken in the
group.
1. Access to and quality of health services
2. Mental health and addictions
3. Lifestyle: exercise, obesity, nutrition and access to food
4. Dental and/or vision health
5. Poverty and the economy
6. Chronic disease and/or aging issues
7. Crime, domestic violence and child abuse
Access to and Quality of Health Services
Participants in groups consistently brought up barriers to accessing health and medical
services. Insurance (or lack of), paying for health care services, physically getting to a health
care provider (transportation), language barriers, having providers available and the
relationship with providers were common themes in every focus group.
“We only have major medical, so dental and eye visits have been pushed to “as needed” as
opposed to “routine.” And for our major medical benefits, the deductibles on our plan has made
it tough for both my husband and to get care in the same year. We’ve had to choose who’s health
issues are more threatening and that person goes to the doctor and uses the money budgeted for
co-insurance.”
“I had to go off meds and withdrawls were crazy because I couldn’t pay for the doctors
appointment to get it refilled.”
“We are far away here from medical center and services, it affects the elderly. Transportation,
social, and food services are a major problem.”
“Healthcare shouldn’t just be ‘see the doctor and get a prescription and go home.’ We need
holistic approaches. We need lifestyle changes. Alcohol and drug abuse have to be included.”
“A lot of healthcare plans won’t pay for a Naturopath; it’s the only place my wife will go.”
“[I have] depression from not having money for care—problems get added to the pile and my
depression gets worse—its easy to get hopeless.”
“Providers won’t talk to me—only want to know one issue or complaint. I do know my body.”
“A lot of physicians that won’t take Medicare patients, it’s a small town. Where are we going to
go?”](https://image.slidesharecdn.com/jacksonsubstanceabuse-150806090559-lva1-app6891/85/Substance-Abuse-Jackson-Michigan-87-320.jpg)
![78 - Josephine final version
“Providers and doctors don’t always give you credit for your intuition about your health, they don’t
want to listen, they only want one…complaint per visit.”
“Transportation is a challenge—getting to where we need to go is almost impossible sometimes.”
Mental Health and Addictions
Challenges with mental illness and addictions weighed heavily on all groups. The effects of
both on the individual and community were prevalent in many conversations about what
concerned participants and what solutions they wanted to improve their health and the health
of their community.
“When you are surrounded by drugs you can’t be healthy.”
“I see a lot of mental health problems with homeless people—I’ve seen a lot of homeless and it’s a
notable increase.”
“Mental health is a disaster area—my adopted daughter has been in 15 facilities in 5 years and she
has very little hope for her future, it’s sad even when your parents cannot advocate for you.”
“Mental disabilities, lack of staffing and services and they wander the street. Not taking meds and/
or can’t afford it. There is nowhere for them to go or they can’t get transportation to get there.”
“Meth and Heroin are our biggest drug problems, [they] cause broken families, effect safety,
education.”
“My addiction caused me to go into heart attack—that caused issues for family on top of my
addiction problem.”
“My alcoholism is from a lack of treatment of my depression—it wasn’t being treated and alcohol
is what I turned to.”
“Drugs [are our number one problem]. To me it’s a core problem that affects and creates broken
families, abuse, crime, is a vicious cycle. We have good programs here but it’s just so common, we
need to break the cycle in people, families and communities”
“Inadequate or negligent prescribing of drugs with dangerous side effects, like anti-depressants,
methadone can be worse than the disease.”
“Unfortunately my addictions have affected the entire community so my choice to be clean will
too.”](https://image.slidesharecdn.com/jacksonsubstanceabuse-150806090559-lva1-app6891/85/Substance-Abuse-Jackson-Michigan-88-320.jpg)
![81 - Josephine final version
“Chronic pain effects both me and my wife—doing what we can do to manage pain to do
everyday tasks like mowing the lawn. Long-term we try to stay cheerful, but at times we get sad
and hopeless—is this as good as it gets? That’s a big drag that affects all aspects of life. We used
to go dancing, but not anymore, we are lucky to just get through the day.”
“We have insurance but it doesn’t cover medication for my chronic pain-when something breaks in
the house, it stays broken. I have to save money to pay for my medication to help with my pain.”
“People here are old, they don’t have anyone to help them anymore, they get isolated (out here)
and the group of them is getting bigger.”
Crime, Domestic Violence and Child Abuse
Crime and concern about community and individual safety rated as a high concern in nearly all
focus groups. Concern about child abuse and domestic violence and their connection to health
were noted in all groups.
“I normally feel safe here, but the police protection is horrible.”
“I called 911 and it took 20 minutes for them to respond, I don’t feel safe.”
“My community [of domestic violence workers and clients] are very unhealthy—a lot of drug use,
alcohol, sexual assault—a lot of violence unreported that our community doesn’t see.”
“Domestic violence was in my household and has affected me and my kids with PTSD and
depression—I wonder how it will affect my kids long term.”
“[We need to] increase public awareness of the impact of stress and trauma on children and our
future.”](https://image.slidesharecdn.com/jacksonsubstanceabuse-150806090559-lva1-app6891/85/Substance-Abuse-Jackson-Michigan-91-320.jpg)
![82 - Josephine final version
Community Engagement in Solutions
All focus groups ended with a question about solutions to the challenges, problems and needs
identified in the prior questions. Specifically, the facilitator asked “what do you think we (as a
community) can do to enhance the health of our community?” The focus was directed at what
solutions participants wanted to be engaged in to address the problems discussed earlier.
All groups, regardless of demographic or location expressed a strong sense of concern about
their community and how they could contribute to improving problems. Several solutions and
positive comments were stated in every group, some of those comments are as follows:
Suggestions
“We need to build opportunities for multi-generations to share skills like gardening, sewing,
community gardens-would help to teach and provide food and skills.”
“Church and social groups—support them. We need to do these skills again and not rely on others
to do them for us.”
“Change attitudes that we hold helping and doing something, improving something every day.
This has to start young. Striving for self-sufficiency starts young.”
“[We need] community gardens—teach to grow and preserve.”
“[We should] educate children about importance of healthy food and exercise. change life styles.
Could we do a community walk your child to school day? Like the nationalwalktoschool.org in
October.”
“[We must] recognize that community health is a systems issue and that every cog in the wheel
(law enforcement, school systems, health care, housing affordability) all impact the health of a
community. People in this community just want to hunker down and ignore our problems, blame
the government for their woes and not accept personal responsibility as citizens for positive
change.](https://image.slidesharecdn.com/jacksonsubstanceabuse-150806090559-lva1-app6891/85/Substance-Abuse-Jackson-Michigan-92-320.jpg)