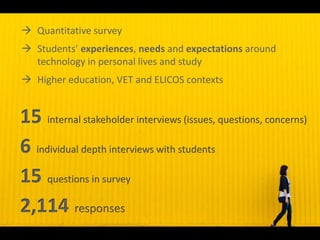
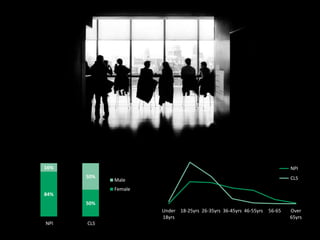
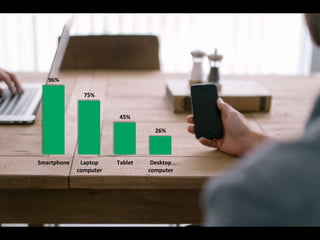
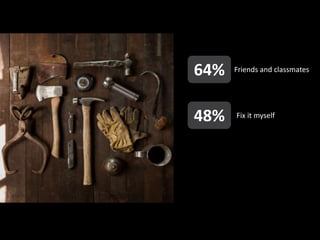
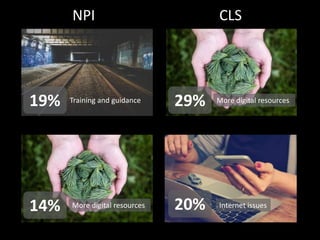
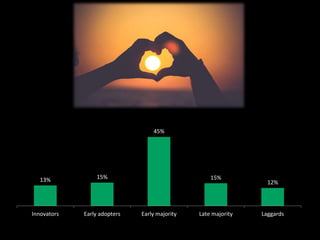
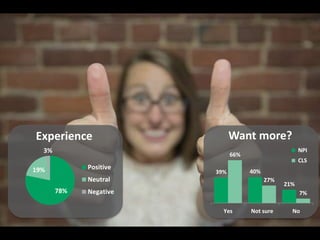
Students,
screens and the
ever-present
smartphone
2015 Student
Technology Survey
15 questions in survey
6 individual depth interviews with students
2,114 responses
15 internal stakeholder interviews (issues, questions, concerns)
 Quantitative survey
 Students’ experiences, needs and expectations around
technology in personal lives and study
 Higher education, VET and ELICOS contexts
84%
50%
16%
50%
NPI CLS
Male
Female
Under
18yrs
18-25yrs 26-35yrs 36-45yrs 46-55yrs 56-65 Over
65yrs
NPI
CLS
96%
75%
45%
26%
Smartphone Laptop
computer
Tablet Desktop
computer
Everywhere
Home
71%
96%
54%
50%
53%
51%
32%
17%
Mobile usage
Mobile data
Mix of my data and free WiFi
Free WiFi / internet
82%
20%
55%
42%
Laptop / desktop Phone
Learning activities NPI
CLS
Short
activity
Long
activity
Productive
Receptive
11%29%
60%
45%
84%
63%
11%
2% 2%
67%
48%
20%
13% 12%
6%
Face to face Email Online class
space
Phone calls /
text messages
Social media Messaging apps
With my teacher(s)
Communication with teachers
NPI
CLS
53% 55%
63%
46% 48%
18%
80%
43%
35%
78% 74% 76%
Face to face
With students
Email Online class
space
Phone calls / text
messages
Social media Messaging apps
Communication with other students
NPI
CLS
Learning new technology
71%
66%
I teach myself
Google/online search
NPI
CLS
48%
64% Friends and classmates
Fix it myself
Barriers
‘Nothing
stops me’
29%19%
14% 20%
More digital resourcesTraining and guidance
NPI CLS
More digital resources Internet issues
13% 15%
45%
15%
12%
Innovators Early adopters Early majority Late majority Laggards
78%
19%
3%
Experience
Positive
Neutral
Negative
39% 40%
21%
66%
27%
7%
Yes Not sure No
Want more?
NPI
CLS
Questions?
Lucy Blakemore
Manager, Learning & Teaching Innovation
E: Lucy.Blakemore@navitas.com
Yindta Whittington
Research & Project Officer
E: Yindta.Whittington@navitas.com

Students, screens and the ever-present smartphone - Lucy Blakemore