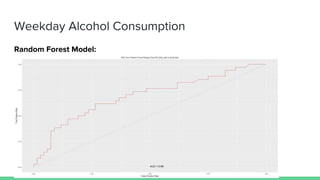
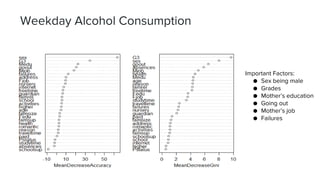
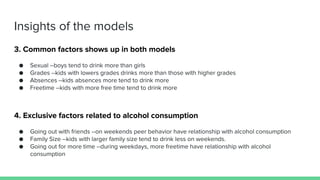
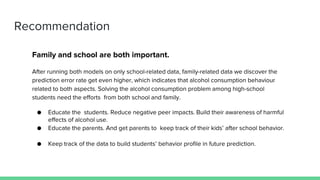
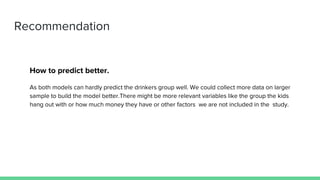
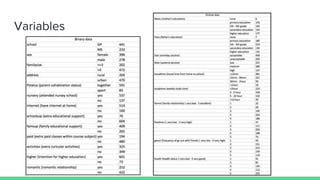
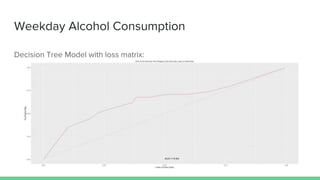
Some of the most important new data to emerge on young adult drinking were collected through a recent nationwide survey, the National Epidemiologic Survey on Alcohol and Related Conditions (NESARC). According to these data, about 70 percent of young adults or about 19 million people, consumed alcohol in the year preceding the survey.
Short exploratory data analysis focusing on the alcohol variables from the Portuguese school dataset. Our main goal is using Data Mining To Predict School Student Alcohol Consumption and finding the significant factors.
2. Introduction
Some of the most important new data to emerge on young adult drinking were
collected through a recent nationwide survey, the National Epidemiologic Survey
on Alcohol and Related Conditions (NESARC). According to these data, about 70
percent of young adults or about 19 million people, consumed alcohol in the year
preceding the survey.
Short exploratory data analysis focusing on the alcohol variables from the
Portuguese school dataset. Our main goal is using Data Mining To Predict School
Student Alcohol Consumption and finding the significant factors.
3. Objective/problem statement
•Build models to predict school students’ drinking behavior during weekdays and
weekends.
•Compare various models and choose the best.
•Find out which factors are influential to school students’ alcohol consumption –
sensible recommendations were made.
4. Dataset
Data collected through a survey from two classes in two schools in Portugal
33 Variables
Personal e.g. school, sex, age, address, health status, romantic experience, going out with friends,
free time after school
Educational e.g. study time, class failures, intention for higher education, extra-curricular activities,
educational support, number of school absences, grades
Family e.g. mother/father’s education, mother/father’s job, family size, quality of family relationship,
parent’s cohabitation status
Alcohol Consumption e.g. workday alcohol consumption, weekend alcohol consumption
Data Types
5. Data preparation
No missing data
Overlapping
Students taking both math and portuguese class
649 students in Portuguese class, 395 students in Math class
Merging data
Criterion
"school","sex","age","address","famsize","Pstatus","Medu","Fedu","Mjob","Fjob","reason","nurs
ery","internet"
382 students identified
6. Approaches
The data is distributed to analyse 2 different models(alcohol consumption for weekday and for the
weekend)
Target variables: Weekday alcohol consumption and weekends alcohol consumption
For weekday (more serious issue than weekend),
Level 1 - acceptable alcohol consumption
Levels 2- 5 - unacceptable
For the weekend,
Levels 1 and 2 - acceptable alcohol consumption
Level 3, 4, 5 - unacceptable
7. Techniques Used
Decision Tree
Poor performance ☹
• Overall error rate 38%
• Tried improving the model by cost matrix (0,25,80,0) →
32% error in predicting unacceptable behavior
• But increased the error rate of acceptable to 44%
REJECTED DECISION TREE
Neural Network
Poor performance ☹
• Neural network worked best for 15 nodes
• But the error rate is quite high → 53% for unacceptable
class
• Also the error rate for the acceptable class was 22%
REJECTED NEURAL NETWORK
Boosting
Poor performance ☹
• Overall error rate is 25% which is quite less
☺
• However, 59% of the data is wrongly
classified into unacceptable
• Area under ROC curve is 0.6782
REJECTED BOOSTING
Naïve Bayes
Poor performance ☹
• Overall error rate was 38.46%
• Couldn’t properly classify unacceptable class
• Accuracy was also very low
REJECTED NAÏVE BAYES
8. Random Forest
Winner ☺
• Unacceptable class error rate was 29%
• And the unacceptable class is very important for the
prediction of the model
ACCEPTED RANDOM FOREST
9. Weekday Alcohol Consumption
Input Variables: All the variables were chosen as input for Weekday Alcohol consumption model building except
G1, G2 and Weekend Alcohol consumption.
Weekend Alcohol consumption is ignored to avoid the target leakage condition
G1, G2 - Grades for the first and second year. We include G3 (derived from G1 and G2) and ignore G1 and G2 to make the
input variables independent.
Target:
Weekday Alcohol consumption
We classified the Ordinal Variable Weekday Alcohol consumption (Ratings 1 - 5)
Acceptable (Rating 1) and
Unacceptable (Ratings 2 - 5)
10. Weekday Alcohol Consumption
Random Forest Model:
Partitioning:
Training: Validation: Test - 70:15:15
Sample size chosen as 85,100 to downsample the acceptable class
No.of Trees : 5200
17. Weekend Alcohol Consumption - Importance
Important Factors:
● Going Out with friends
● Sexual
● Grades
● Family Size
● Absences
● Freetime
● Father’s Job
18. Compare two models
Random forest can best predict the data in both models.
For daily alcohol consumption, the overall error rate is 35%, with the error rate in
unacceptable group of 29%. However, according to AUC, it explains only 69%
of the data.
For weekends alcohol consumption, the overall error rate is 32%, with the error
rate in high consumption group of 26%. According to AUC, it explains 74.8% of
the data.
The weekend model is the better one.
19. Insights of the models
1.Drinking is a daily behavior
most of the drinkers drink both on weekends and weekdays.Students tend to drink more on weekends.
2. Mom and dad plays important roles in different time
According to the daily alcohol consumption model, mother’s education, mother’s job have relationship with
the daily drinking behavior of the child.
While, during weekends, father’s job matters to the weekends drinking behavior.
20. Insights of the models
3. Common factors shows up in both models
● Sexual --boys tend to drink more than girls
● Grades --kids with lowers grades drinks more than those with higher grades
● Absences --kids absences more tend to drink more
● Freetime --kids with more free time tend to drink more
4. Exclusive factors related to alcohol consumption
● Going out with friends --on weekends peer behavior have relationship with alcohol consumption
● Family Size --kids with larger family size tend to drink less on weekends.
● Going out for more time --during weekdays, more freetime have relationship with alcohol
consumption
21. Recommendation
Family and school are both important.
After running both models on only school-related data, family-related data we discover the
prediction error rate get even higher, which indicates that alcohol consumption behaviour
related to both aspects. Solving the alcohol consumption problem among high-school
students need the efforts from both school and family.
● Educate the students. Reduce negative peer impacts. Build their awareness of harmful
effects of alcohol use.
● Educate the parents. And get parents to keep track of their kids’ after school behavior.
● Keep track of the data to build students’ behavior profile in future prediction.
22. Recommendation
How to predict better.
As both models can hardly predict the drinkers group well. We could collect more data on larger
sample to build the model better.There might be more relevant variables like the group the kids
hang out with or how much money they have or other factors we are not included in the study.
28. Weekday Alcohol Consumption
Decision Tree Model:
● Sex being male
● Lesser Grade during finals (G3 <14)
● Going out more
● More absences from class
● Mother’s education lower than 1.5 yrs
● Mother’s job other than At home,health or teacher
are the factors that seemed to cause Unacceptable drinking behavior (Ratings 2 - 5)