Physiochemical properties of nanomaterials and its nanotoxicity.pptx
document.pdf
1. 6th
International Conference & Exposition on Petroleum Geophysics “Kolkata 2006”
(545)
Introduction
Used initially in exploration, the dipmeter tool
helped to locate and identify the major features of geologic
structures that serve as oil traps. With improved techniques
in data acquisition and computation, the application of this
tool has expanded until it has become the principle logging
measurement for describing internal lithologic features as
well as revealing the sedimentological process responsible
for them. As a result, the dip information now a days is used
to identify both structural features such as faults and folds
and stratigraphic features such as paleocurrent direction, sand
or shale thickening direction and sand body orientation.
The primary function of the dipmeter tool is to
measure the magnitude and direction of the slope (known as
dips) of sedimentary features such as bedding planes. Most
sediments were essentially deposited nearly flat, and
subsequently subjected to post depositional structural
uplifting or down wrapping. This post depositional tilt is
what is referred to as structural dip. A computed dip arrow
plot (called Tadpole plot) presents individual dip
measurements computed from micro-resistivity data
recorded at measured depths. Certain dip trends or dip
patterns can be expected to occur with different geological
features including folding, faulting and unconformities.
Modern 3D seismic techniques provide both high
resolution and dense coverage for interpretation of
Structural Interpretation of Dipmeter Log – A Case Study from
Baramura Field of Tripura
T. Chattopadhyay* and D. K. Ghosh
Petropysics Division, KDMIPE, ONGC, Dehradun India
Summary
Dipmeter logging tool has gained acceptance in petroleum industry as a means to define subsurface sedimentary
structures and to detect geologic signatures of tectonic events. The advantage of dipmeter, over seismic is that it provides
accurate informations near the well bore and detects structural features beyond seismic resolution. Identification of these
structural features and detection of their orientations are done on the basis of structural dip trend analysis which compares
characteristic dip patterns of various geological structures with observed dip patterns on computed dip plot. A detailed
examination of raw dipmeter curves and correlation logs and proper selection of dip processing parameters are significant in
this respect. These facts have been explained with the help of dipmeter log data of a well in Baramura field processed with in-
house software. In this well, a minor normal drag fault has been identified and its orientation has been determined. Various
conditions necessary for reliable and meaningful structural dip trend analysis have also been discussed.
subsurface structures and are a great improvement on older
2D methods. However, features at the lower limit of seismic
resolution (less than 20 meters thick) or with low acoustic
impedance contrast are often not resolved and interpretation
can become ambiguous. Structures at this scale, in particular
small scale faults are important to reservoir production as
they may form permeability barriers. Identification of such
features are critical for optimum placement of production
wells and enhanced field development. Integration of
structural analysis derived from borehole dipmeter data with
3D seismic data allows better structural control in complex
structural settings.
Structural interpretation of Dip Data
Successful structural dip interpretation is based on
the good knowledge of geometrical and geological character
of the structural features and their characteristic patterns on
computed dip arrow plot. Structural features, such as faults
and folds, generally result from laterally directed forces
which are either to compress or pull apart the rock strata of
the earth’s crust.
Folds are undulations in the rock strata. They are
displayed at their best in well stratified formations. Many
structural reservoir traps are the result of folding. A clear
indication of a fold on a dip arrow plot requires the borehole
to cut across the axial plane. The plot will then show changes
in dip from one side of the plane to the other. Because of
2. (546)
this reason, in case of symmetrical fold where the axial plane
is vertical, the computed dips of a vertical borehole will
register no change in dip trend. However, within an
asymmetrical fold, the dipmeter log will register a change in
direction from one flank of the fold to the other where the
borehole crosses the axial plane. In case of overturned folds,
we can expect dramatic changes in dip trend. For example,
in case of overturned anticline, both flanks may dip in the
same direction but lower flank dips at a steeper angle than
the upper flank. An overturned syncline would do the
opposite. Between the flanks, the dip sweeps from 0 to 90o
.
In a recumbent fold, the upper and lower flanks dip in
opposite directions. In this case, the dip trend will increase
to 90o
between the two planks and an inverse repetition of
the folded beds (mirror image) is usually recognizable on
the log correlation curves. Flexures usually appear on the
arrow plot as alternately increasing and decreasing dip angles
with nearly constant azimuth.
A fault is a natural fracture marking displacement
– vertical, lateral and/or rotational of geological strata in the
earth’s crust. Faults are classified according to the kind of
movement exhibited by the upper and lower blocks, the rocks
on either side of the fault plane (or zone). Normal faults or
gravity faults are those in which upper block has moved
downward. If the upper block has moved upward, a reverse
fault is resulted. Low angle (low dip fault plane) reverse
faults are commonly referred to as thrust faults. Faulting
with progressive distortion on one or both sides of the fault
creates the best conditions for detection by dip analysis. This
distortion is akin to folding and gives rise to characteristic
dip patterns. Folding of this sort, called drag, is produced
by the friction between the fault blocks as they move past
one another. Drags usually create concave folds in the
downthrown block and convex folds in the upthrown block
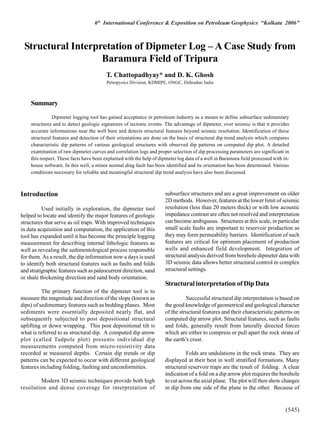
(Fig.1). However, when faulting occurs during
sedimentation, bedding dips into the fault rather than away
from it. This is rollover or growth fault.
A normal drag fault is characterized by drag in both
the upper and lower blocks. The dip results usually reflect
this distortion with a red dip pattern (a set of successive dips
with constant azimuth and increasing magnitudes with depth)
in the down thrown block, the dips pointing in the direction
of movement. The blue dip pattern (a set of successive dips
with constant azimuth and magnitudes decreasing with depth)
is the result of drag in the upthrown block. Ideal characteristic
dip pattern of a normal drag fault is shown in Fig.1. Strike
of the fault is generally perpendicular to the average direction
of the red dip pattern. Dip magnitude of the fault plane is
picked near the point of intersection or the two coloured
Fig.1: Ideal dip characteristic pattern for normal drag fault
patterns on dip plot. In case of normal growth fault, the red
and blue patterns will be in opposite direction. The drag in
a reverse fault occurs frequently on both sides of the fault,
although distortion is usually greater in the overthrust block,
due to faulting mechanism. The characteristic dip pattern
of a reverse drag fault is similar to that of normal drag fault.
However, dip of the fault plane in case of reverse fault is
opposite to the drag or overthrust direction and normal to
the strike of the fault. On well logs, the presence of faults
often shows up in the form of missing (normal faults) or
repeated (reverse faults) sections. The thickness of the
missing or repeated section, measured on a well log, is equal
to the vertical separation (throw) produced by the fault, if
the well is vertical. Sometimes, the faulting process forms a
broken up zone of shatter rock or breccias near the fault
surface. This region has no bedding and thus appears on the
dipmeter arrow plot as a gap (if no correlations are found)
or a series of random, usually low quality dips.
In this section we have discussed about some
common geological structures in terms of their geometrical
features and their characteristic signatures on computed dip
arrow plot in the form of various dip patterns. In the next
section, we will show a field example of processed dipmeter
data and attempt to identify specific structural deformations
based on pattern recognition from arrow-plot results.
A case study
Tripura area is located in the North Eastern part of
India and forms a part of Assam-Arakan frontal belt,
characterized by a number of N-S trending long narrow
elongated anticlines and broad flat intervening synclines,
occurring in an en-echelon fashion. Located in this area,
Baramura field is an asymmetric doubly plunging anticline
trending roughly NNE-SSW. Tectonically Baramura falls in
the frontal folded belt of Tripura, which is the western
continuation of the Surma Valley folded belt. The eastern
3. 6th
International Conference & Exposition on Petroleum Geophysics “Kolkata 2006”
(547)
flank of Baramura structure has been affected by a thrust
dipping westward. Located on this flank, the well Baramura-
A was drilled to the depth of X185 m to explore hydrocarbon
potentiality in Bokabil and Upper Bhuban formations of
Miocene age.
In this well, dipmeter log was recorded using four
electrode dipmeter (FED) tool of Gearhart Inc. (presently
Halliburton). The dipmeter raw data has been processed
with in-house software DAISY. The algorithm is based on
pattern recognition and feature extraction methods similar
to Schlumberger’s GEODIP processing. In this program,
different features called elements such as peaks, troughs,
spikes and steps are identified in each micro-resistivity curve
and accordingly each curve, to be correlated, is
mathematically decomposed into a depth ordered sequence
of ranked elements. The program then correlates the
elements on each curve (and not the actual resistivity curves)
and relates them to the same geological event. As a result,
the density of the output data (dips) depends on the density
of geological events. This makes DAISY processing
particularly successful in fine structured sedimentary
sections. For structural interpretation of dipmeter data, the
selection of processing parameters are crucial so that we
can obtain high dip angle and large scale dip pattern (without
finer details). Because of this we have taken search angle as
45o
and tmin
(minimum bed thickness) as 0.2 meter. Dips
corresponding to different filters (1 to 20) were generated
and optimum filter was selected for structural analysis. Here,
higher filter means more averaging and screening.
A section of the computed dip-arrow plot is
presented in Fig.2 in the depth interval X060-X180 m in
1:500 depth scale. A close inspection reveals that a structural
deformation of small scale is prominent in the interval X081-
X101 m represented in the form of a red pattern underlain
by a blue pattern. To know the lithology, conventional logs
(Resistivity, GR, RHOB, PHIN, SP and Caliper) are also
plotted alongwith computed dips. They indicate that the event
occurred in shale section. Above and below this section,
the structural dip is very gentle (2-4o
pointing towards East).
Once a structural deformation has been identified using dip
trend analysis, it is essential to examine the raw dipmeter
Fig.2: Dip arrow plot along with correlation logs in the interval X060-
X180m of well Baramura-A
Fig.3: Raw microresistivity and auxiliary curves of dipmeter log of
Baramura-A. Deformed zone is indicated by shaded portion.
4. (548)
data for confirmation of arrow plot interpretation. The micro-
resistivity (four in number) and auxiliary (calipers, Pad-1
azimuth, relative bearing and borehole deviation) curves
covering this interval is presented in Fig.3 in 1:200 scale.
The visual inspection of these curves shows that deformed
zone is marked by conductivity anomalies (shaded in the
figure), very less tool rotation and vertical and gauged hole.
Reliable interpretation of the raw data requires that effects
such as excessive tool rotation or borehole rugosity are not
responsible for producing such conductivity anomalies.
Analysis and discussion
If we examine the dipmeter response of the
deformed zone in Fig.2, the possibility of occurrence of any
kind of fold system can be excluded. This is because except
recumbent fold, no fold system has a dip response of a red
pattern in the upper flank and a blue pattern in the lower
flank. We also observe no sweep of dips from 0 to 90o
between the flanks. In case of recumbent fold, upper and
lower flanks dip in the opposite directions. In our case, both
red and blue patterns have the same azimuth. Moreover, a
mirror image of geological section is not noticed on the log
correlation curves.
When we consider the presence of possible fault
system, this sort of dip response is possible only in case of
normal and reverse (or thrust) drag faults. However, when a
borehole cuts a reverse fault, it re-enters the same interval
of the geological section that it had just passed through and
the correlation logs show this section as repeated. No such
repeat section is observed in our case. Hence, the possibility
of the presence of a minor normal drag fault in the interval
X081-X101 m is the logical conclusion.
Once a specific fault system has been identified,
its orientation can be determined by a careful inspection of
the dip arrow plot. As mentioned earlier, the position of
fault plane can be located as the point of intersection of red
and blue pattern. Thus the fault plane is located at X092 m
in this well. The fault plane is dipping at an angle of 18o
.
Azimuth of fault plane should be same as that of red pattern
of hanging wall block. Hence the fault is downthrown to
west. The strike of the fault is N-S. The fault is slowing a
blank expression (no dips) in the interval X091.5-X093.5 m
on dip plot. This might be due to intensive brecciation of
the rocks producing high dip scatter which has been
subsequently removed by high filter dip processing.
Another geological event is observed in the interval
X145-X158 m of Baramura-A (Fig.2) in the form of a red
pattern. This is correlated with an angular unconformity at
the depth of X158 m. Unconformities are breaks in the
otherwise regular stratigraphic sequence marked by a surface
of erosion or non deposition separating the younger strata
from the older rocks. Although unconformities are
considered to be stratigraphic events, their characteristic dip
patterns resemble those found associated with folds and
faults. Angular unconformities will show a change in
dipmeter pattern due to differences in dip and azimuth of
the strata above and below the unconformity. The older rocks
usually dip at a much steeper angle since they are more likely
to have been tilted tectonically prior to the deposition of
upper strata. Also the beds overlying an unconformity tend
to be laid parallel to the surface of unconformity. This
differentiates between the characteristic dip patterns of
unconformity and fault. Moreover, unconformities usually
occur at lithology boundaries but faults are not so selective.
The conventional logs plotted in Fig.2 indicate the change
of lithology at the unconformity surface. The lower beds
below the unconformity are dipping towards North at an
angle of 15o
whereas upper beds have very gentle structural
dip of 3-4o
pointing towards East. Occurrence of a red dip
pattern just above the level of unconformity in Fig.2 may be
because of the following reason. The erosion linked to
unconformity had created topographic relief whose hollows
were first filled when deposition resumed and later these
filled sediments were differentially compacted by subsequent
overburden layers of strata. This is reflected on the arrow
plot by an increase of dip with depth down to the level of
unconformity.
Conclusions
Resolution of seismic under optimal conditions is
about 20 meters. This represents a considerable uncertainty
regarding interpretation and mapping of small scale structural
features. The importance of dipmeter tool is that it provides
more accurate information at the well location and detects
structural features either beyond seismic resolution or with
low acoustic impedance. These informations are important
for optimum well positioning to maximize hydrocarbon
recovery. Identification of these structural features and
detection of their orientations are done on the basis of
structural dip trend analysis which compares characteristic
dip patterns of various geological structures with observed
dip patterns on computed dip plot. This technique has been
applied to a field example where a minor normal drag fault
has been identified and its orientation has been determined
on the basis of structural dip trend analysis.
Identification of structural features from dipmeter
5. 6th
International Conference & Exposition on Petroleum Geophysics “Kolkata 2006”
(549)
data is limited to those which display clear bedding
deformation or which allow orientation. When these are
not present, or when chaotic dips result from shattering or
poor borehole conditions, it is not possible to characterize
structural deformations fully from dip data alone. Moreover,
steeply dipping events such as faults are not picked up by
computed dips due to the different response of the tool on
the opposite sides of the borehole. This necessitates the
critical examination of raw dipmeter curves and other log
curves along with computed dip data. A visual inspection
of formation microresistivity image log will be of great help
in these situations.
Acknowledgment
Authors are thankful to Dr. D. M. Kale, ED-Head,
KDMIPE for encouragement and giving permission to use
dipmeter log data related to case study. Thanks are also due
to Shri R. P. Verma, Head, Petrophysics Division, KDMIPE,
Shri D. Sar, GM-Head, GSSG, KDMIPE, Shri G. K. Ray and
ShriP.K.Sinha,E-ONGroup,BSG,KDMIPEfortheirvaluable
suggestions.
Views expressed in this paper are that of the author
only and may not necessarily be of ONGC.
References
Adams, J. T., Ayodele, J. K., Bedford, J., Kaars-Sijpesteijn, C. H. and
Watts, N. L., 1992, Application of dipmeter data in structural
interpretation, Niger Delta; Geological Society Special
Publication, UK, No.65, 247-264.
Atlas Wireline Services, 1987, Fundamentals of Diplog Analysis; Atlas
International Inc., Houston, Texas. USA.
Deilliers, M.C. and Werner, P., 1990, Example of fault identification using
dipmeter data; Geological Society Special Publication, UK,
No.48, 287-295.
Schlumberger, 1986, Dipmeter Interpretation-Fundamentals;
Schlumberger, New York, USA.