SlideShare a Scribd company logo
1 of 151
The Strategy-Formulation
Analytical Framework
Strategic Management
Sr. # Topic Title
1 Strategic Management: an overview
2 Strategy Formulation
 Designing Vision and Mission Statements
• External Assessment
• Internal Assessment
• Setting Objectives and Strategic Options
• Strategy Analysis and Choice
3 Strategy Execution
4 Strategy Evaluation
5 Limitations of Strategic Management: why strategy fails?
2
Stages of Strategic Management
Strategic Management process consists
of three stages:
1. Strategy formulation,
2. Strategy implementation, and
3. Strategy evaluation.
3
Strategy formulation
Strategy formulation includes:
 Developing a vision and mission statements
 Identifying organization’s external opportunities
and threats
 Indentifying internal strengths and weaknesses
 Setting long-term objectives and alternative
strategies
 Analyzing alternative strategies and choosing
particular strategy.
4
Presentation Contents of 6th Session
• Nature of Strategy Analysis and choice
• Process of Strategy Analysis and Choice
• A Comprehensive Strategy Formulation Framework
– Input stage: EFE Matrix, CP (Competitive Profile) Matrix, and
IFE (Internal Factor Evaluation) Matrix
– Matching stage: SWOT Matrix, SPACE Matrix, IE Matrix, GS
Matrix
– Decision stage: QSP (Quantitative Strategic Planning) Matrix
 Cultural and Political Aspects of Strategy Choice
5
Nature of Strategy Analysis and choice
• Generating and analyzing alternative
strategies and selecting a set of strategies
involve making subjective decision based on
objective information.
• Alternative strategies are derived from the
organization’s vision, mission, objectives,
external audit, and internal audit, and are
build on past strategies that have worked well.
6
Process of Strategy Analysis and Choice
• As it’s not possible to consider infinite number of
alternative strategies, a manageable set of most
attractive alternative strategies are developed.
• Identifying and evaluating alternative strategies
should involve as many managers and employees as
possible from each department who earlier
participated in formulation of organizational vision,
mission, internal and external audits.
• After identifying all feasible strategies, they must be
ranked to arrive at a list of prioritized strategies
reflecting the collective wisdom of the organization.
7
Comprehensive Strategy-Formulation Framework
Stage 1:
The Input Stage
Stage 2:
The Matching Stage
Stage 3:
The Decision Stage
Ch 7 -8 Copyright © 2011 Pearson Education
A Comprehensive Strategy-Formulation Analytical
Framework (SFAF)
Stage 1: Input Stage:
– EFE Matrix,
– IFE (Internal Factor Evaluation) Matrix, and
– CP (Competitive Profile) Matrix
Stage 2: Matching Stage
– SWOT ( Strength-Weakness-Opportunities-Threat) Matrix,
– SPACE (Strategic Position and Action Evaluation) Matrix,
– IE (Internal-External) Matrix,
– GS (Grand Strategy) Matrix
Stage 3: Decision making stage
– QSP (Quantitative Strategic Planning) Matrix
9
A Comprehensive Strategy-
Formulation Framework
Stage 1 - Input Stage
 summarizes the basic input information
needed to formulate strategies
 consists of the EFE Matrix, the IFE Matrix,
and the Competitive Profile Matrix (CPM)
Strategy-Formulation Analytical Framework
Internal Factor Evaluation
Matrix (IFE)
External Factor Evaluation
Matrix (EFE)
Competitive Profile Matrix
(CPM)
Stage 1:
The Input Stage
Ch 7 -11 Copyright © 2011 Pearson Education
IFE (Internal Factor Evolution) Matrix
• IFE Matrix is a management strategy formulation tool that
summarizes and evaluates major strengths and weaknesses in
functional areas of the organization.
• Five steps to construct IFE Matrix:
– List key strengths and weaknesses
– Assign weight ranging from 0.0 (not important) to 1.0 (all
important)
– Assign rating from 1 (major weakness) to 4 (major strength)
– Multiply weights and rating to get weighted score
– Sum the weighted score to get total weighted score for the
organization.
12
An example of IFE Matrix
Key Internal Factors Weight Rating Weighted
Score
Strengths
1
2
3
Weaknesses
1
2
3
Total Weighted Score
13
IFE Matrix
Factors Weight Rating (1-4)
Weighted Score
Strengths
RM Availability 0.15 4 0.60
Construction Sector Growth 0.13 3 0.39
Production Technology 0.12 3 0.36
Brand Image 0.15 4 0.60
0.10 3 0.30
Total Strengths 0.65 2.55
Weaknesses
Captive Generation by WHR 0.10 2 0.20
Brand Promotion 0.04 2 0.08
Production Cost 0.13 3 0.39
Qualified Workforce 0.08 2 0.16
Total Weakness 0.35 0.83
Total IFE Matrix Score 3.38
External Factors
OPPORTUNITIES
Significant growth opportunities in the domestic
market due to growing population & increasing
urbanization.
Infrastructure boom in Government sector –
hydropower, major dams, real estate etc.
THREATS
Continuous pass on of input costs to consumers
with ever high cement prices effecting demand
Rising fuel prices.
Economic Recession in the country
EFE Matrix
An EFE (external factor evaluation) Matrix summarizes and
evaluate all the external forces that affect an organization.
It is developed in 5 stages:
1. List key external factors identified in external audit;
2. Assign to each factor weight ranging from say 0.0 (not
important) to 1.0 (very important) indicating relative
importance of that factor to be successful in the
industry.
3. Assign rating say between 1 (poor response) and 4
(superior response) based on effectiveness of the
organization’s strategies.
4. Multiply weight by its rating to get weighted score
5. Sum up to get total weighted score for the organization.
16
Example of EFE Matrix
Key External Factors Weight Rating Weighted
score
Opportunities
1. Domestic demand increasing 10% annually
2. Export demand increasing 15% annually
3. Input price decreasing 5% annually
Threats
1. Rival organizations increasing ad by 20%
annually
2. Govt. Tightening its regulation
3. Interest rates are increasing 3% annually
Total
17
EFE Matrix
Factors Weight Rating(1-4) Weighted Score
Opportunities
Infrastructure Development 0.15 4 0.60
Population Growth 0.13 4 0.52
Export Potential 0.15 4 0.60
Green Initiatives 0.10 3 0.30
Technological Advancements 0.10 3 0.30
Total Opportunities 0.63 2.32
Threats
Economy 0.08 4 0.32
Competition 0.07 3 0.24
Raw MaterialAvailability 0.07 3 0.24
Regulatory Changes 0.07 2 0.14
Energy Costs 0.08 4 0.24
TotalThreats 0.37 1.18
Total EFE Matrix Score 1 3.50
Competitive Profile
Matrix
CP (Competitive Profile) Matrix
• CP Matrix identifies a organization’s strategic
competitors and its particular strengths and weakness
in relation to the organization’s strategic position.
• CP Matrix is broader as it includes both internal and
external issues.
• CP Matrix rating refers to strengths and weakness
between I (major weakness) and 4 (major strength).
20
Example of CP Matrix
Org A Org B Org C
Critical success
factors
weight rating score rating score Rating score
Product quality
Price
competitiveness
Advertising
Management
Financial position
Market share
Customer loyalty
Global expansion
Total
21
Competitive Profile Matrix (CPM)
 CPM is an essential strategic management tool to compare the
firm with the major players of the industry.
 CPM shows the clear picture to the firm about their strong points
& weak points relative to their competitors.
 The CPM score is measured on basis of critical success factors,
each factor is measured in same scale mean the weight remain
same for every firm only rating varies.
 The best thing about CPM is it includes our firm & also facilitates
to add other competitors make easier the competitor analysis.
 In IFE matrix, only internal factors are evaluated & in EFE matrix
only external factors are evaluated but CPM include both
internal and external factors to evaluate overall position of the
firm with respective to their major competitors.
Competitive Profile Matrix (CPM)
The competitive profile matrix consists of below mentioned attributes.
 Rating
 Weight
 Weighted Score
 Total Weighted Score
Rating:
Rating represents the response of the firm towards the critical success
factors. Highest the rating the better response of the firm towards the
critical success factors, rating range from 1 to 4.
Rating is applied to each factor.
 Major strength = 4
 Minor strength = 3
 Minor weakness = 2
 Major weakness = 1
Competitive Profile Matrix (CPM)
Weight:
Weight attribute in CPM indicates the relative importance of factor to being
successful in the firm’s industry. The weight range from 0.0 means not
important and 1.0 means important, sum of all assigned weight to factors must
be equal to 1.0, otherwise the calculation won’t be considered correct.
Weighted Score:
Weighted score value is the result achieved after multiplying each factor rating
with the weight.
Total Weighted Score:
The sum of all weighted score is equal to the total weighted score, final value of
total weighted score should be between range 1.0 (low) and 4.0 (high). The
average weighted score for CPM matrix is 2.5, any company total weighted
score fall below 2.5 is considered as weak. The company total weighted score if
higher than 2.5 is considered strong in position.
CPM - Data Interpretation
• MCL need to maintain Financial position and exports through
clear business plan control overheads.
• Need to improve the quality to make major strength.
• MCL need to improve the sale distributor network specially in the
western part of country by
 Target lead sales
 Feed back
 Launch products to distributors
• Reduce the cost of production to reduce the prices to gain the
major strength.
• Invest more on WHRP to produce more energy to maintain the
major strength.
• There is no energy production currently.
Weightage Rating Score
Financial Position 0.15 3 0.45
Quality 0.08 3 0.24
Exports 0.15 1 0.15
Production Capacity 0.07 4 0.28
Sales Distribution 0.07 2 0.14
Technology 0.18 3 0.54
Price 0.12 3 0.36
Energy Production 0.18 3 0.54
Total 1 2.7
Competitive Profile Matrix
A Comprehensive Strategy-
Formulation Framework
Stage 2 - Matching Stage
 focuses on generating feasible alternative
strategies by aligning key external & internal
factors
 techniques include the Strengths-Weaknesses-
Opportunities-Threats (SWOT) Matrix, the
Strategic Position and Action Evaluation (SPACE)
Matrix, the Boston Consulting Group (BCG)
Matrix, the Internal-External (IE) Matrix, and the
Grand Strategy Matrix
Strategy-Formulation Analytical Framework
SWOT Matrix
SPACE Matrix
BCG Matrix
IE Matrix
Grand Strategy Matrix
Stage 2:
The Matching Stage
Ch 7 -28 Copyright © 2011 Pearson Education
Matching Key External and Internal Factors
to Formulate Alternative Strategies
SWOT (Strength-Weakness-Opportunities-
Threat) Analysis
SWOT
Analysis
Resource
Strengths
Threats
Resource
Weaknesses
Market
Opportunities
30
SWOT Analysis (contd.)
SWOT analysis leads to:
• Drawing conclusions from the SWOT listings
about overall situation of an organization; and
• Translating these conclusions into strategic
actions to better match organization’s strategy
to its resource strengths and market
opportunities, and to correct the weaknesses
and to defend from external threats.
31
SWOT Matrix contd.
SWOT Matrix generates 4 types of strategies:
1. SO (Strength-Opportunities) Strategies: intend to use
internal strengths to take advantage of external
opportunities.
2. WO (Weakness-Opportunities) Strategies: aim at
improving internal weakness by taking advantage of
external opportunities.
3. ST (Strengths-Threat) Strategies: intend to use internal
strengths to reduce the impact of external threats.
4. WT (Weakness-Threat) Strategy: defensive strategy at
reducing internal weakness and avoiding external threats.
32
SWOT Matrix (contd.)
Strength - S
1
2
3
4
Weakness – W
1
2
3
4
Opportunities –O
1
2
3
4
SO Strategies
1
2
3
WO Strategies
1
2
3
Threats- T
1
2
3
4
ST Strategies
1
2
3
WT Strategies
1
2
3
33
SWOT Matrix contd.
Eight steps to construct a SWOT Matrix: strategies
1. Listing key external opportunities
2. Listing key external threats
3. Listing key internal strengths
4. Listing key internal weakness
5. Matching internal strengths with external opportunities to get the
SO
6. Matching internal weakness with external opportunities to get
WO strategies
7. Matching internal strengths with external threats to get ST
strategies
8. Matching internal weakness with external threats to get WT
strategies.
SWOT – Strength – Internal Factor
1. Raw Material Availability: MCL has acquired its’ own
quarry for limestone reserve, a primary raw material for
cement production, which provides a competitive advantage
to the cement industry.
2. Brand Image: MCL has built strong brand reputations &
customer loyalty over the years, providing a competitive
edge in the market.
SWOT – Weakness – Internal Factor
1. Production Technology: Some Nepalese cement industries may lack
access to the latest technologies & equipment, impacting efficiency &
productivity. Investing in modern technologies & production processes
can enhance efficiency, reduce costs, & improve product quality, thereby
increasing competitiveness.
2. Quality of Workforce
3. Captive Generation
4. Brand Promotion
5. Governance System
6. Poor Sourcing Hub
SWOT – Opportunities – External Factor
1. Growing construction sector: The demand for cement is fueled by the
booming construction industry in Nepal, driven by infrastructure
projects, residential housing, & commercial developments.
2. government policies: Government initiatives to promote infrastructure
development & attract foreign investment in the construction sector can
provide opportunities for growth.
3. Increasing urbanization: Rapid urbanization in Nepal is driving
demand for housing, infrastructure, & commercial buildings, creating a
sustained demand for cement products.
4. Infrastructure development: Government-led infrastructure projects
such as roads, bridges, hydropower projects, & urban development
initiatives provide high growth opportunities for the cement industry.
5. Exports: Nepalese cement industries can explore export markets in
neighbor states, leveraging competitive pricing & geographical proximity.
SWOT – Opportunities – External Factor
6. Diversification: We can diversify our product offerings to include
specialized cement types catering to specific construction needs or explore
value-added products like ready-mix concrete.
7. Strategic partnerships: Collaborating with MNC cement companies or
forming strategic alliances with construction firms can facilitate
knowledge transfer, access to new markets, & investment opportunities.
SWOT – Threat – External Factor
1. Infrastructure challenges: Poor transportation infrastructure to
quarries & logistical constraints can increase production costs & limit
market access for cement manufacturers.
2. Dependency on imports: Despite abundant raw materials, Nepal still
imports some cement products to meet demand, indicating potential
inefficiencies in domestic production.
3. Regulatory hurdles: Regulatory complexities & bureaucratic processes
can hinder business operations & investment in the cement industry.
4. Environmental concerns: Cement production is resource-intensive &
can have adverse environmental impacts such as emissions of
greenhouse gases & dust pollution, which may face increasing scrutiny.
5. Cost of Coal & other fuel:
SWOT – Threat – External Factor
1. Intense competition: The Nepalese cement industry faces competition
from domestic players as well as imports from neighboring countries,
leading to price pressures & market saturation.
2. Economic instability: Political unrest, currency fluctuations, & economic
uncertainties can impact consumer confidence, investment decisions, &
overall demand for cement products.
3. RM availability: Disruptions in the supply of key raw materials like
limestone or coal due to regulatory issues, environmental concerns, or
natural disasters can disrupt production & affect profitability.
4. Substitute materials: Alternate to cement, such as alternative building
materials or construction techniques, pose a threat to traditional cement
usage, especially in sustainable & eco-friendly construction practices.
5. Regulatory changes: Changes in government policies, regulations, or
taxation related to the cement industry can impact operational costs,
compliance requirements, & overall business viability.
SWOT
• SWOT is an important tool to develop 4 types of strategies: SO
(Strength - Opportunity), WO (Weakness – Opportunities), ST
(Strength - Threats), and WT (Weakness – Threats) depending on key
Internal & external factors.
• SO strategies use internal strength to take advantage of external
opportunities.
• WO strategies aim at improving internal weakness by taking
advantage of external opportunities. Sometimes external
opportunities exist, but a firm has internal weaknesses that prevent it
from exploiting those opportunities.
• ST strategies use strength to avoid/reduce the impact of external
threats.
• WT strategies are defensive tactics directed at reducing internal
weakness and avoiding external threats.
The Matching Stage
The Strengths-Weaknesses-
Opportunities-Threats (SWOT) Matrix
helps managers develop four types of
strategies:
 SO (strengths-opportunities) Strategies
 WO (weaknesses-opportunities) Strategies
 ST (strengths-threats) Strategies
 WT (weaknesses-threats) Strategies
SO Strategies
Use a firm’s
internal strengths
to take advantage
of external
opportunities
SO
Strategies
Strengths
Weaknesses
Opportunities
Threats
SWOT
Ch 7 -43 Copyright © 2011 Pearson Education
 Increase domestic sales
 Penetrate new market
 Explore export potential
WO Strategies
Improving internal
weaknesses by
taking advantage
of external
opportunities
WO
Strategies
Strengths
Weaknesses
Opportunities
Threats
SWOT
 Market Development
 Training of employee
ST Strategies
Use a firm’s
strengths
to avoid or
reduce the impact
of external
threats
ST
Strategies
Strengths
Weaknesses
Opportunities
Threats
SWOT
• Market development
• Increase Dividend for shareholders
• Invest in Maintenance.
WT Strategies
Defensive tactics
aimed at reducing
internal
weaknesses &
avoiding
environmental
threats
WT
Strategies
Strengths
Weaknesses
Opportunities
Threats
SWOT
• High Promotion Campaign
• Training of employee
SWOT Matrix
Strengths –
S
List Strengths
Weaknesses – W
List Weaknesses
Opportunities – O
List Opportunities
SO
Strategies
Use strengths to
take advantage of
opportunities
WO Strategies
Overcoming weaknesses
by taking advantage of
opportunities
Threats – T
List Threats
ST
Strategies
Use strengths to
avoid threats
WT Strategies
Minimize weaknesses and
avoid threats
Ch 6 -48
Strategy-Formulation Analytical Framework
SWOT Matrix
SPACE Matrix
BCG Matrix
IE Matrix
Grand Strategy Matrix
Stage 2:
The Matching Stage
Ch 7 -48 Copyright © 2011 Pearson Education
SPACE (Strategic Position and Action
Evaluation) Matrix
• SPACE Matrix in its 4 quadrant framework indicates
whether aggressive, conservative, defensive or
competitive strategies are appropriate for a
organization.
• Axes of the SPACE Matrix represent 2 internal and 2
external dimensions.
• Internal dimensions are:
– FS (Financial strength)
– CA (Competitive Advantage)
 External dimensions are:
 ES (Environmental Stability)
 IS (Industry Strength)
Factors of SPACE Matrix (contd.)
Internal Strategic Position External Strategic Position
FS (Financial Strengths) ES (Environmental Stability)
1. Return on Investment
2. Leverage Ratios
3. Liquidity Ratios
4. Working Capital
5. Cash Flow
1. Rate of Inflation
2. Price Elasticity of Demand
3. Competitive Pressure
4. Price range of competing products
5. Technological change
CA (Competitive Advantage) IS (Industry Strength)
1. Market share
2. Product quality
3. Customer loyalty
4. Control over input suppliers
1. Growth potential
2. Profit potential
3. Financial stability
4. Productivity
SPACE Matrix (contd.)
FS +
Conservative Strategies Aggressive Strategies
CA IS
• _ +
Defensive Strategies Competitive Strategies
ES _
The Strategic Position and Action
Evaluation (SPACE) Matrix
Two internal dimensions (financial
position [FP] and competitive position
[CP])
Two external dimensions (stability
position [SP] and industry position [IP])
Most important determinants of an
organization’s overall strategic position
6-52
Steps to Develop a SPACE Matrix
1. Select a set of variables to define
financial position (FP), competitive
position (CP), stability position (SP), and
industry position (IP)
6-53
Steps to Develop a SPACE Matrix
2. Assign a numerical value ranging from +1
(worst) to +7 (best) to each of the
variables that make up the FP and IP
dimensions.
Assign a numerical value ranging from –1
(best) to –7 (worst) to each of the
variables that make up the SP and CP
dimensions
6-54
Copyright ©2013 Pearson Education, Inc. publishing as Prentice Hall
Steps to Develop a SPACE Matrix
3. Compute an average score for FP, CP, IP, and
SP
4. Plot the average scores for FP, IP, SP, and CP
on the appropriate axis in the SPACE Matrix
5. Add the two scores on the x-axis and plot the
resultant point on X. Add the two scores on the
y-axis and plot the resultant point on Y. Plot the
intersection of the new xy point
6-55
Copyright ©2013 Pearson Education, Inc. publishing as Prentice Hall
Steps to Develop a SPACE Matrix
6. Draw a directional vector from the origin
of the SPACE Matrix through the new
intersection point
 This vector reveals the type of strategies
recommended for the organization:
aggressive, competitive, defensive, or
conservative
6-56
Copyright ©2013 Pearson Education, Inc. publishing as Prentice Hall
The SPACE Matrix
It is used to determine what type of a strategy a company should undertake.
Space matrix is a strategic management tool, which focuses on strategy
formulation especially related to the competitive position of an organization.
 FP – Financial Position
 CP – Competitive Position
 IP – Industrial Position
 SP – Stability Position
There are 2 internal and 2 external strategic dimensions. FP & CP are internal
dimension that compare our company with other companies. Similarly, SP & IP
are external dimensions.
In space matrix, CP and IP values are plotted on x-axis
 CP value range from -1 (best) to -6 (worst).
 IP value range from +1 to +6.
Whereas, FP and SP are plotted on Y-axis
 SP value range from -1 (best) to -6 (worst)
 FP value range from +1 to +6
Financial Position (FP) Rating
Net profit 5
Earnings per share 3
Debt Equity Ratio 4
Stock Turnover Ratio 4
Inventory turnover 5
Average 21/5= 4.2
Industrial Position (IP) Ratings
Resource Utilization 5
Financial Stability 6
Resource Utilization 4
Growth Rate 5
Competitors 4
Average 24/5= 4.8
The SPACE Matrix
• After rating each factor of SP, CP, IP and FP average is taken of the
rating and then total of all average is taken.
• By taking total of Y-axis and x-axis the net result will be marked on
the space matrix and it will show the competitive position of an
organization.
In a space matrix, there are 4 quadrants & each quadrant represents a
different type of nature,
 Aggressive
 Conservative
 Defensive
 Competitive
The SPACE Matrix
Competitive Position (CP) Ratings
Brand Image -1
Distribution Network -1
Technology -2
Customer Loyalty -1
Market share -2
Average -7/5= -1.4
Stability Position (SP) Ratings
GDP -2
Rate of Inflation -3
Tax -1
Barriers to entry in market (Govt. Policies) -2
Peace & Security -3
Average -11/5= -2.2
The SPACE Matrix
• Company Position – Aggressive
• Financially strong
• Can take advantage of external opportunities, overcome
internal weakness & avoid external threats by its internal
strength.
• Capable of Market penetration, product development and
integration depending on the specific circumstances
The SPACE Matrix
Y axis X axis
FP +4.2 +4.8 IP
SP -2.2 -1.4 CP
Total +2 +3.4
The SPACE Matrix
Ch 6 -63
SPACE Matrix
Strategic Position & Action Evaluation Matrix
4-quadrants indicate whether the most appropriate
strategy is:
• Aggressive
• Conservative
• Defensive
• Competitive
Ch 7 -63 Copyright © 2011 Pearson Education
The SPACE Matrix
Factors That Make Up the
SPACE Matrix Axes
6-65
Factors That Make Up the
SPACE Matrix Axes
6-66
Example Strategy Profiles
6-67
Copyright ©2013 Pearson Education, Inc. publishing as Prentice Hall
Example Strategy Profiles
6-68
Copyright ©2013 Pearson Education, Inc. publishing as Prentice Hall
Ch 6 -69
Strategy-Formulation Analytical Framework
SWOT Matrix
SPACE Matrix
BCG Matrix
IE Matrix
Grand Strategy Matrix
Stage 2:
The Matching Stage
Ch 7 -69 Copyright © 2011 Pearson Education
The Boston Consulting Group
(BCG) Matrix
BCG Matrix
 graphically portrays differences among
divisions in terms of relative market share
position and industry growth rate
 allows a multidivisional organization to
manage its portfolio of businesses by
examining the relative market share position
and the industry growth rate of each division
relative to all other divisions in the
organization
The BCG Matrix
The BCG Matrix
The major benefit of the BCG Matrix is that
it draws attention to the cash flow,
investment characteristics, and needs of an
organization’s various divisions
Boston Consulting Group Matrix (BCG)
• Also known as the BCG Growth-Share Matrix, provides a visual
representation of product portfolio. Helps to make strategic
decisions about investment, divestment or growth strategies for
each product.
• The BCG model is based on product life cycle theory. Helps to
determine priorities for products in the product portfolio.
• For long term value creation, a company product portfolio shall
contains both high- growth products in need of cash inputs &
low-growth products that generate a lot of cash.
• The matrix categorizes products into 4 quadrants based on 2
dimensions, Market Growth Rate & Relative Market Share.
Beyond these, also need to consider industry dynamics,
competitive landscape & market trends.
Interrelation of Market Share & Market Growth
 Market Share: Market share is the percentage of the total
market that is being serviced by your company measured either
in the revenue terms or unit volume terms. The higher our
market share, the higher proportion of the market we control.
Higher market share indicates a stronger competitive position.
 Market Growth Rate is used as a measure of a market’s
attractiveness. High growth markets offer opportunities for
expansion, while low growth markets may require defensive
strategies to maintain market share.
 Markets experiencing high growth are ones where the total
market share available is expanding & there is plenty of
opportunity for everyone to make money.
Individual Sales this year – Individual sales last year
MGR =
Individual Sales last year
Business Unit Sales this year
RMS =
Leading rival sales this year
Boston Consulting Group
Matrix (BCG)
Boston Consulting Group Matrix (BCG)
STAR: (High Market Share & High Market Growth)
QUESTION MARK: (Low Market Share & High Market Growth)
CASH COW: (High Market Share & Low Market Growth)
DOG: (Low Market Share & Low Market Growth)
Boston Consulting Group Matrix (BCG)
Product Life Cycle
The BCG Matrix
Question marks – Quadrant I
 Organization must decide whether to strengthen
them by pursuing an intensive strategy (market
penetration, market development, or product
development) or to sell them
BCG - Question Marks/Problem Children
 High Growth Rate, Low Market Share
 Most business start as question marks. There is uncertainty
about their future success, hence the name "question marks.“
 They absorb great amount of cash if the market share remains
low
 Question marks have potential to become star, & then cash
cow, but can also become dog.
 Investment should be high for question marks.
 High market share in high-growth markets.
 Stars are leader in business
 They also require heavy investment to maintain it’s large
market share.
 It leads to large amount of cash consumption & cash
generation.
 Stars typically require significant investment to sustain their
growth but have the potential to become future cash cows if
they maintain their market dominance.
BCG - Stars
Stars
• High relative market share and high growth rate
- Best long-run opportunities for growth &
profitability
• Substantial investment to maintain or strengthen
dominant position
- Integration strategies, intensive strategies, joint
ventures
Cash Cows - Low Growth, High Market Share
 Cash cows are products or businesses with a high market share
in low-growth markets.
 They are foundation of the company & often the stars of
yesterday.
 Profits and cash generation should be high because of the low
growth, investments needed should be low.
 They generate significant cash flow but typically require
minimal investment to maintain their market position.
 Cash cows are "cash generators" of a company & provide
resources to invest in other areas.
 They are in an industry that is mature, neither growing nor
declining.
Cash Cows
• High relative market share, competes in low-growth
industry
- Generate cash in excess of their needs
- Milked for other purposes
• Maintain strong position as long as possible
- Product development, concentric diversification
- If weakens – retrenchment or divestiture
Ch 7 -84
Dogs – Low Growth, Low Market Share
 Dogs are the cash traps
 Business is situated at a declining stage
 They do not generate significant cash flow and may even
consume resources.
 Companies often face the decision of whether to divest or
restructure these businesses to minimize losses. Beware of
expensive, turn around plans.
 Avoid and minimize the number of dogs in a company.
 Low relative market share, competes in slow or no market
growth. Weak internal & external position
 Liquidation, divestiture, retrenchment
BCG-MATRIX FOR THE PRODUCT LINE
OF
Coca-Cola
QUESTION MARKS
(HIGH GROWTH, LOW MARKET SHARE
STARS
(HIGH GROWTH, HIGH MARKET SHARE)
CASH COWS
(LOW GROWTH, HIGH MARKET SHARE
DOGS
(LOW GROWTH, LOW MARKET SHARE)
QUESTION MARKS
STARS
 Invest for growth
CASH COWS
( MILK TO FUND OTHER BUSINESS)
DOGS
Samsung
STAR: (High Market Share & High Market Growth)
 We have our OPC cement in this category. We should continue
to invest in this product to maintain or expand our market
leadership.
 We should consider expanding production capacity &
enhancing distribution channels to meet growing demand.
 Continuously innovate & improve the quality of OPC to
maintain its competitive edge.
 Explore opportunities for producing specialized variations of
OPC to cater to specific customer needs.
BCG in MCL
Strategy-Formulation Analytical
Framework
SWOT Matrix
SPACE Matrix
BCG Matrix
IE Matrix
Grand Strategy Matrix
Stage 2:
The Matching Stage
The Internal-External Matrix
 Positions an organization’s various divisions in a
nine-cell display
 IE Matrix is similar to BCG Matrix, except:
- Requires more information about the divisions
- Strategic implications of each matrix are different
Ch 7 -104
IE M ATR IX
The Internal-External (IE) Matrix
IE Matrix
 Based on two key dimensions
- The IFE total weighted scores on the x-axis
- The EFE total weighted scores on the y-axis
 Divided into three major regions
- Grow and build – Cells I, II, or IV
- Hold and maintain – Cells III, V, or VII
- Harvest or divest – Cells VI, VIII, or IX
Ch 7 -107
The IE Matrix
Strategy-Formulation Analytical Framework
SPACE Matrix
BCG Matrix
IE Matrix
Stage 2:
The Matching Stage
SWOT Matrix
Grand Strategy Matrix
GS (Grand Strategy) Matrix
GS Matrix is based on two evaluative dimensions:
1. Competitive Position, and
2. Market Growth.
All organizations can be positioned in one of the four
strategy quadrants:
1. Quadrant I is an excellent strategic position for an
organization due to strong competitive position and rapid
market growth.
2. Quadrant II organizations need to evaluate their market
position as they are facing weak competitive position.
3. Quadrant III organizations are in slow growth industries and
have weak competitive position.
4. Quadrant IV organizations have strong competitive position ,
but are in a slow growth industry.
GS (Grand Strategy) Matrix (contd.)
RMG
Quadrant II Quadrant I
Intensive strategies Intensive strategies
Defensive strategies Integration strategies
WCP SCP
Quadrant III Quadrant IV
Defensive strategies Diversification strategies
SMG
The Grand Strategy Matrix
Grand Strategy Matrix
 based on two evaluative dimensions:
• competitive position and
• market (industry) growth
The Grand Strategy Matrix
Quadrant I
 continued concentration on current markets
(market penetration and market development)
and products (product development) is an
appropriate strategy
Quadrant II
 unable to compete effectively
 need to determine why the firm’s current approach
is ineffective and how the company can best
change to improve its competitiveness
The Grand Strategy Matrix
Quadrant III
 must make some drastic changes quickly to avoid
further decline and possible liquidation
 Extensive cost and asset reduction (retrenchment)
should be pursued first
Quadrant IV
 have characteristically high cash-flow levels and
limited internal growth needs and often can
pursue related or unrelated diversification
successfully
Strategy-Formulation Analytical
Framework
Stage 3:
The Decision Stage
Quantitative Strategic
Planning Matrix
(QSPM)
Ch 7 - Copyright © 2011 Pearson Education
QSP (Quantitative Strategic Planning)
Matrix
• QSP Matrix is the decision making tool of Stage 3 of
Strategy-Formulation Analytical Framework.
• QSP Matrix determines the relative attractiveness of
various strategies based on the extent to which key
external and internal success factors are capitalized
upon or improved.
• QSP Matrix is prepared using information of stage 1
(input stage) and stage 2 (matching stage) of Strategy
Formulation Analytical Framework.
QSP Matrix (contd.)
Six steps are required to prepare QSP Matrix:
• Step 1: listing external opportunities/threats and internal
strengths/weakness from stage 1 (input stage) of SFAF;
• Step 2: assigning weights to each external and internal
factors as from stage 1 (input stage) of SFAF;
• Step 3: Identifying alternative strategies from stage 2
(matching stage) of SFAF;
• Step 4: determining strategy Attractiveness Score (AS);
• Step 5: Computing Total Attractiveness Score (TAS); and
• Step 6: Computing Sum Total Attractiveness Score (STAS).
QSP Matrix (contd.)
Key Factors Weight Strategy 1 Strategy 2 Strategy 3
AS TAS AS TAS AS TAS
Key External Factors
(Opportunities/Threats)
Economy
Political/legal/governance
Technology trends
Competitive environment
Key Internal Factors
(Strengths/Weakness)
Management
Marketing
Finance/Accounting
Production/Operation
R&D
MIS
A Comprehensive Strategy-
Formulation Framework
Stage 3 - Decision Stage
 involves the Quantitative Strategic Planning
Matrix (QSPM)
 reveals the relative attractiveness of alternative
strategies and thus provides objective basis for
selecting specific strategies
The Quantitative Strategic
Planning Matrix (QSPM)
Quantitative Strategic Planning Matrix
(QSPM)
 objectively indicates which alternative
strategies are best
 uses input from Stage 1 analyses and
matching results from Stage 2 analyses to
decide objectively among alternative
strategies
The Quantitative Strategic
Planning Matrix (QSPM)
Steps in a QSPM
1. Make a list of the firm’s key external opportunities/
threats and internal strengths/ weaknesses in the
left column of the QSPM
2. Assign weights to each key external & internal
factor
3. Examine the Stage 2 (matching) matrices, and
identify alternative strategies that the organization
should consider implementing
4. Determine the Attractiveness Scores (AS)
5. Compute the Total Attractiveness Scores
6. Compute the Sum Total Attractiveness Score
Positive Features of the QSPM
Sets of strategies can be examined
sequentially or simultaneously
Requires strategists to integrate pertinent
external and internal factors into the
decision process
Can be adapted for use by small and
large for-profit and nonprofit organizations
Internal & External Factors
IE (Internal-External) Matrix
• IE Matrix is based on two dimensions:
– IFE total weighted scores on x-axis, and
– EFE total weighted scores on y-axis
 IE Matrix is divided into 3 regions with different
strategic implications:
 I, II &IV : grow and build (intensive or integrative
strategies)
 III, V & VII : hold and maintain (market penetration and
product development strategies)
 VI, VIII &IX : harvest or divest (defensive strategies)
IE (Internal-External) Matrix (contd.)
IFE TW Score
EFE TW Score
IFE Strong
3.0 – 4.0
IFE Average
2.0 – 2.99
IFE Weak
1.0 – 1.99
EFE High
3.0 – 4.0
I
Grow and build
II
Grow and build
III
Hold and
maintain
EFE Medium
2.0 – 2.99
IV
Grow and build
V
Hold and
maintain
VI
Harvest or divest
EFE Low
1.0 – 1.99
VII
Hold and
maintain
VIII
Harvest or divest
IX
Harvest or divest
STRENGTHS
Maruti Cement is an accepted brand in Nepalese market.
Trusted for mega projects both private and public, fetching a
premium price and optimal capacity utilization.
MCL is an environmentally responsible corporate entity as
evident from its investment in emission control equipment.
WEAKNESS
MCL does not own Waste Heat Recovery Captive generation
power plants
Dependency on imported, erratic supply of coal due to various
reasons
State-of-the-art, energy-efficient production lines.
Workforce needs training
Internal Factors
Strategy Formulation
1. Positioning Forces Before Action:
• MCL should thoroughly analyze its external & internal environment before
making strategic decisions. This includes assessing market conditions,
competitive forces, and its own capabilities and resources.
2. Focus on Effectiveness:
• MCL should prioritize strategies and actions that are most likely to lead to
effective outcomes. This might involve selecting strategies that align with its
strengths and opportunities and addressing weaknesses and threats.
3. Intuitive and Analytical Skills:
• MCL should assemble a team with a mix of intuitive and analytical skills.
Intuition can help identify trends and opportunities, while analytical skills
are crucial for data-driven decision-making.
4. CoordinationAmong Few Individuals:
 Strategy formulation at MCL should involve coordination among key
individuals, such as top management and strategic planners. This ensures
that the decision-making process is focused and streamlined.
Internal Matrix - OPC
External Matrix - OPC
Quantitative Strategic Planning Matrix
(QSPM)
• It's a tool used in strategic management to evaluate & prioritize
various strategic alternatives based on
• potential impact on an organization's success.
• QSPM involves assessing internal and external factors, assigning
weights and scores, and generating a matrix that helps decision-
makers choose the most suitable strategies to pursue.
Limitations of the Strategy
Formulation Framework
• Quantitative techniques used in Strategy
Formulation Analytical Framework (SFAF), like
any other quantitative methods are based on
simplified assumptions that may not always
realistic;
• SFAF always requires intuitive judgments
based on objective information;
• SFAF can be only as good as the inputs and
matching analysis on which it is based.
Cultural and Political aspects of
Strategy Choice
• All organization have a culture. If formulated
strategies are in conflict with organizational
culture, implementation will be slow and
difficult.
• All organization have internal power politics.
Unless internal power politics is managed
well, implementation of strategies could be
sabotaged.
Strategic Management: references
• Fred R. David (2008), Strategic
Management: Concepts and Cases, 11th
Edition, Prentice Hall (Chapter 6)
• Arthur A. Thompson, Jr. (2010) Crafting and
Executing Strategy: the quest for
comparative, 16th Edition, McGraw Hill (Chapter
5 & 6)
137
 The external environment plays an integral role in the
company’s operational & financial performance.
 Our strategy seeks to optimize performance by aligning with the
external environment.
 This involves managing risks and capitalizing on opportunities
across political, economic, social, technological, environmental &
legal domains.
PESTEL Analysis
Organizatio
n
PESTEL / MACRO Analysis
Political Factors
How government policy and actions intervene in the
economy and other factors that can affect a business.
These include the following:
• Tax Policy
• Trade Restrictions
• Tariffs
• Bureaucracy
Different political parties in a country have diverging
views and strategies for policy on the items above.
Economic Factors
Economic Factors take into account the various aspects of the
economy, and how the outlook on each area could impact your
business. These economic indicators are usually measured and
reported by Central Banks and other Government Agencies.
• Economic Growth Rates
• Interest Rates
• Exchange Rates
• Inflation
• Unemployment Rates
The Economic outlook is of extreme importance for a business.
Social Factors
Which are related to the cultural & demographic trends of
society. Social norms and pressures are key to determining a
society consumerist behavior.
Factors to be considered are the following:
• Cultural Aspects & Perceptions
• Health Consciousness
• Populations Growth Rates
• Age Distribution
• Career Attitudes
Technological Factors
Technological Factors are linked to innovation in the industry, as
well as innovation of the overall economy. Not being up to date
to the latest trends of a particular industry can be extremely
harmful to operations. Technological Factors include the
following:
• R&D – Activity
• Automation
• Technological Incentives
• The Rate of change in technology
Environmental Factors
Ecological impacts on business. As weather extremes become
more common, businesses need to plan how to adapt to these
changes. Key Environmental Factors include the following:
• Weather Conditions
• Temperature
• Climate Change
• Pollution
• Natural disasters (tsunami, tornadoes, corona etc.)
Additionally, there is increasing importance for businesses to be
environmentally friendly with their operations, as evidenced by the
rise Corporate Sustainability Responsibility (CSR) initiatives.
Examples of CSR initiatives include carbon footprint reduction
efforts and transitions into renewable material and energy sources.
Legal Factors
There is often uncertainty regarding the difference between
Political and Legal Factors in the context of a PESTEL analysis.
Legal Factors pertain to any legal forces that define what a
business can or cannot do. Political Factors involve the
relationship between business & the government.
Political & Legal Factors can intercept when governmental
bodies introduce legislature & policies that affect how
businesses operate. Legal factors include the following:
• Industry Regulation
• Licenses & Permits
• Labor Laws
• Intellectual Property
• Consumerism
Porters Five Forces Model
Threats of New Entrance
• Maruti Cement operates
in a competitive industry
with low entry barriers.
• Large investment is
required to do such
businesses.
Bargaining Power ofSuppliers
• Cost of Cement materials
(limestone, coal, gypsum)
impact costs.
• Multiple suppliers,
Strong relationship &
timely payments
maintain broad
supplier base & power.
Bargaining Power of Buyers
• Construction buyers impact
cement prices & terms.
• Buyer bargaining power is
moderate.
• Company's quality focus,
customer satisfaction &
diverse customer base provide
Industry advantage.
Competitive Rivalry
• Fierce rivalry exists. Focus on price,
quality, innovation, client attraction.
• MCL competes with well- known
brands, with fierce competition due to
product similarities & the industry's
cluttered landscape.
Threat of Substitutes
• Cement is the main construction
material being used globally.
• Threat of its substitution with new
product is not significant.
Porters Five Forces
Key Points
Supply The demand-supply situation is high skewed with the
latter being significantly higher.
Demand Housing sector acts as the principal growth driver for
cement. However, recently industrial and infrastructure
sectors have also emerged as demand drivers.
Barriers to entry
High capital costs and long gestation periods. Access to
limestone reserves (key input) also acts as a significant
entry barrier.
Key Points
Bargaining power of
suppliers
Licensing of coal and limestone reserves, supply of
power from the state grid etc. are all controlled by a
single entity, which is the government. However,
nowadays producers are relying more on captive
power, but the shortage of coal and volatile fuel prices
remain a concern.
Bargaining power of
customers
Cement is a commodity business and sales volumes
mostly depend upon the distribution reach of the
company. However, things are changing and few
brands have started commanding a premium on
account of better quality perception.
Competition Intense competition with players expanding reach and
achieving pan India presence.
Porter Five Forces Model
Summary:
• In the context of Porter's Five Forces Model, MCL faces
moderate threats from new entrants, suppliers, and buyers.
• The threat of substitutes is low due to the essential nature of
cement in construction.
• Competitive rivalry is very high in the industry.
• To remain competitive, MCL needs to focus on cost efficiency,
product quality, and differentiation strategies to distinguish
itself from competitors and mitigate the impacts of these forces.
Thank You!

More Related Content

Similar to Strategy Formulation 29th March 2024.pptx

Srategic Managementchap06
Srategic Managementchap06Srategic Managementchap06
Srategic Managementchap06Masroor Soomro
 
Chapter 5; Chosen Competitive Strategies Startegic managnment assignment
Chapter 5; Chosen Competitive Strategies Startegic managnment assignmentChapter 5; Chosen Competitive Strategies Startegic managnment assignment
Chapter 5; Chosen Competitive Strategies Startegic managnment assignmentMuhammad Ameen Ujjan
 
C O M P E T I T I V E P R O F I L E M A T R I X (2)
C O M P E T I T I V E  P R O F I L E  M A T R I X (2)C O M P E T I T I V E  P R O F I L E  M A T R I X (2)
C O M P E T I T I V E P R O F I L E M A T R I X (2)Syed Sibtain Shah
 
An assignment of Competitive Profile Matrix
An assignment of Competitive Profile MatrixAn assignment of Competitive Profile Matrix
An assignment of Competitive Profile MatrixSaymon Arafat
 
Strategic management (final)
Strategic management (final)Strategic management (final)
Strategic management (final)JosephFawzy4
 
Strategy Formulation 29th March 2024.pptx
Strategy Formulation 29th March 2024.pptxStrategy Formulation 29th March 2024.pptx
Strategy Formulation 29th March 2024.pptxMadan Karki
 
Instructions for this assignment Perform all of the elements listed.docx
Instructions for this assignment Perform all of the elements listed.docxInstructions for this assignment Perform all of the elements listed.docx
Instructions for this assignment Perform all of the elements listed.docxJeniceStuckeyoo
 
L 7 strategy analysis and formulation tools
L 7 strategy analysis and formulation toolsL 7 strategy analysis and formulation tools
L 7 strategy analysis and formulation toolsSudhir Upadhyay
 
Strategicanalysis 091208051235-phpapp02
Strategicanalysis 091208051235-phpapp02Strategicanalysis 091208051235-phpapp02
Strategicanalysis 091208051235-phpapp02Aditi Sharma
 
STRATEGIC MANAGEMENT - STRATEGY ANALYSIS AND CHOICE.pptx
STRATEGIC MANAGEMENT - STRATEGY ANALYSIS AND CHOICE.pptxSTRATEGIC MANAGEMENT - STRATEGY ANALYSIS AND CHOICE.pptx
STRATEGIC MANAGEMENT - STRATEGY ANALYSIS AND CHOICE.pptxYara t
 
STRATEGIC MANAGEMENT CH6 : Strategy Analysis and Choice ( Economic and Busine...
STRATEGIC MANAGEMENT CH6 : Strategy Analysis and Choice ( Economic and Busine...STRATEGIC MANAGEMENT CH6 : Strategy Analysis and Choice ( Economic and Busine...
STRATEGIC MANAGEMENT CH6 : Strategy Analysis and Choice ( Economic and Busine...InikeAprilia1
 
Strategy analysis and change- Matrix
Strategy analysis and change- MatrixStrategy analysis and change- Matrix
Strategy analysis and change- MatrixAtta Hussain Syed
 
Strategic Management lecture # 05
Strategic Management lecture # 05Strategic Management lecture # 05
Strategic Management lecture # 05Hijratullah Tahir
 
Strategy Generation and Selection.pdf
Strategy Generation and Selection.pdfStrategy Generation and Selection.pdf
Strategy Generation and Selection.pdfWILLIAMTANDRA2
 
Course StructureWHAT ARE THE REQUIRED RESOURCES AND CAPABILI.docx
Course StructureWHAT ARE THE REQUIRED RESOURCES AND CAPABILI.docxCourse StructureWHAT ARE THE REQUIRED RESOURCES AND CAPABILI.docx
Course StructureWHAT ARE THE REQUIRED RESOURCES AND CAPABILI.docxfaithxdunce63732
 

Similar to Strategy Formulation 29th March 2024.pptx (20)

Srategic Managementchap06
Srategic Managementchap06Srategic Managementchap06
Srategic Managementchap06
 
Chapter 5; Chosen Competitive Strategies Startegic managnment assignment
Chapter 5; Chosen Competitive Strategies Startegic managnment assignmentChapter 5; Chosen Competitive Strategies Startegic managnment assignment
Chapter 5; Chosen Competitive Strategies Startegic managnment assignment
 
C O M P E T I T I V E P R O F I L E M A T R I X (2)
C O M P E T I T I V E  P R O F I L E  M A T R I X (2)C O M P E T I T I V E  P R O F I L E  M A T R I X (2)
C O M P E T I T I V E P R O F I L E M A T R I X (2)
 
An assignment of Competitive Profile Matrix
An assignment of Competitive Profile MatrixAn assignment of Competitive Profile Matrix
An assignment of Competitive Profile Matrix
 
Strategic management (final)
Strategic management (final)Strategic management (final)
Strategic management (final)
 
Strategic presentation
Strategic presentationStrategic presentation
Strategic presentation
 
Strategy Formulation 29th March 2024.pptx
Strategy Formulation 29th March 2024.pptxStrategy Formulation 29th March 2024.pptx
Strategy Formulation 29th March 2024.pptx
 
Instructions for this assignment Perform all of the elements listed.docx
Instructions for this assignment Perform all of the elements listed.docxInstructions for this assignment Perform all of the elements listed.docx
Instructions for this assignment Perform all of the elements listed.docx
 
L 7 strategy analysis and formulation tools
L 7 strategy analysis and formulation toolsL 7 strategy analysis and formulation tools
L 7 strategy analysis and formulation tools
 
Chapter 5
Chapter 5Chapter 5
Chapter 5
 
Chap04
Chap04Chap04
Chap04
 
Strategicanalysis 091208051235-phpapp02
Strategicanalysis 091208051235-phpapp02Strategicanalysis 091208051235-phpapp02
Strategicanalysis 091208051235-phpapp02
 
STRATEGIC MANAGEMENT - STRATEGY ANALYSIS AND CHOICE.pptx
STRATEGIC MANAGEMENT - STRATEGY ANALYSIS AND CHOICE.pptxSTRATEGIC MANAGEMENT - STRATEGY ANALYSIS AND CHOICE.pptx
STRATEGIC MANAGEMENT - STRATEGY ANALYSIS AND CHOICE.pptx
 
STRATEGIC MANAGEMENT CH6 : Strategy Analysis and Choice ( Economic and Busine...
STRATEGIC MANAGEMENT CH6 : Strategy Analysis and Choice ( Economic and Busine...STRATEGIC MANAGEMENT CH6 : Strategy Analysis and Choice ( Economic and Busine...
STRATEGIC MANAGEMENT CH6 : Strategy Analysis and Choice ( Economic and Busine...
 
Strategy analysis and change- Matrix
Strategy analysis and change- MatrixStrategy analysis and change- Matrix
Strategy analysis and change- Matrix
 
Ch1 notes
Ch1 notesCh1 notes
Ch1 notes
 
Strategic Management lecture # 05
Strategic Management lecture # 05Strategic Management lecture # 05
Strategic Management lecture # 05
 
Strategy Generation and Selection.pdf
Strategy Generation and Selection.pdfStrategy Generation and Selection.pdf
Strategy Generation and Selection.pdf
 
Course StructureWHAT ARE THE REQUIRED RESOURCES AND CAPABILI.docx
Course StructureWHAT ARE THE REQUIRED RESOURCES AND CAPABILI.docxCourse StructureWHAT ARE THE REQUIRED RESOURCES AND CAPABILI.docx
Course StructureWHAT ARE THE REQUIRED RESOURCES AND CAPABILI.docx
 
Strategic Planning
Strategic PlanningStrategic Planning
Strategic Planning
 

More from Madan Karki

Dairy development activities in country.pptx
Dairy development activities in country.pptxDairy development activities in country.pptx
Dairy development activities in country.pptxMadan Karki
 
Indian Dairy Industry Present Status and.ppt
Indian Dairy Industry Present Status and.pptIndian Dairy Industry Present Status and.ppt
Indian Dairy Industry Present Status and.pptMadan Karki
 
Marketing of Milk & Dairy status India.pptx
Marketing of Milk & Dairy status India.pptxMarketing of Milk & Dairy status India.pptx
Marketing of Milk & Dairy status India.pptxMadan Karki
 
Diagnosing Organizational Effectiveness.pptx
Diagnosing Organizational Effectiveness.pptxDiagnosing Organizational Effectiveness.pptx
Diagnosing Organizational Effectiveness.pptxMadan Karki
 
Competency-based Human Resource Management.pptx
Competency-based Human Resource Management.pptxCompetency-based Human Resource Management.pptx
Competency-based Human Resource Management.pptxMadan Karki
 
cement industry in India by T. Sumitha.pptx
cement industry in India by T. Sumitha.pptxcement industry in India by T. Sumitha.pptx
cement industry in India by T. Sumitha.pptxMadan Karki
 
Choosing the best strategy qspm matrix.pptx
Choosing the best strategy qspm matrix.pptxChoosing the best strategy qspm matrix.pptx
Choosing the best strategy qspm matrix.pptxMadan Karki
 
BCG Matrix by Raunak Strategic Management.ppt
BCG Matrix by Raunak Strategic Management.pptBCG Matrix by Raunak Strategic Management.ppt
BCG Matrix by Raunak Strategic Management.pptMadan Karki
 
external analysis0000000000000000 .pptx
external analysis0000000000000000  .pptxexternal analysis0000000000000000  .pptx
external analysis0000000000000000 .pptxMadan Karki
 
Cement clinker coolers perf & efficiency.pptx
Cement clinker coolers perf & efficiency.pptxCement clinker coolers perf & efficiency.pptx
Cement clinker coolers perf & efficiency.pptxMadan Karki
 
Cement Industry in India by Saurabh.pptx
Cement Industry in India by Saurabh.pptxCement Industry in India by Saurabh.pptx
Cement Industry in India by Saurabh.pptxMadan Karki
 
Safety Occupational Health & Environment SHE.ppt
Safety Occupational Health & Environment SHE.pptSafety Occupational Health & Environment SHE.ppt
Safety Occupational Health & Environment SHE.pptMadan Karki
 
INTERNAL AUDIT - of Cement Industry.pptx
INTERNAL AUDIT - of Cement Industry.pptxINTERNAL AUDIT - of Cement Industry.pptx
INTERNAL AUDIT - of Cement Industry.pptxMadan Karki
 
corporate governance strategic management.pdf
corporate governance strategic management.pdfcorporate governance strategic management.pdf
corporate governance strategic management.pdfMadan Karki
 
Modular manufacturing by self directed.ppt
Modular manufacturing by self directed.pptModular manufacturing by self directed.ppt
Modular manufacturing by self directed.pptMadan Karki
 
Balanced Scorecard BalancedScorecard.ppt
Balanced Scorecard BalancedScorecard.pptBalanced Scorecard BalancedScorecard.ppt
Balanced Scorecard BalancedScorecard.pptMadan Karki
 
Balanced Scorecard Balanced scorecard_workshop.pptx
Balanced Scorecard Balanced scorecard_workshop.pptxBalanced Scorecard Balanced scorecard_workshop.pptx
Balanced Scorecard Balanced scorecard_workshop.pptxMadan Karki
 
Balanced Scorecard Balanced Scorecard.ppt
Balanced Scorecard Balanced Scorecard.pptBalanced Scorecard Balanced Scorecard.ppt
Balanced Scorecard Balanced Scorecard.pptMadan Karki
 
Basics of Feed Manufacturing Basics.pptx
Basics of Feed Manufacturing Basics.pptxBasics of Feed Manufacturing Basics.pptx
Basics of Feed Manufacturing Basics.pptxMadan Karki
 
Failure Modes FMEA-&-Measurement_Systems_Analysis.ppt
Failure Modes FMEA-&-Measurement_Systems_Analysis.pptFailure Modes FMEA-&-Measurement_Systems_Analysis.ppt
Failure Modes FMEA-&-Measurement_Systems_Analysis.pptMadan Karki
 

More from Madan Karki (20)

Dairy development activities in country.pptx
Dairy development activities in country.pptxDairy development activities in country.pptx
Dairy development activities in country.pptx
 
Indian Dairy Industry Present Status and.ppt
Indian Dairy Industry Present Status and.pptIndian Dairy Industry Present Status and.ppt
Indian Dairy Industry Present Status and.ppt
 
Marketing of Milk & Dairy status India.pptx
Marketing of Milk & Dairy status India.pptxMarketing of Milk & Dairy status India.pptx
Marketing of Milk & Dairy status India.pptx
 
Diagnosing Organizational Effectiveness.pptx
Diagnosing Organizational Effectiveness.pptxDiagnosing Organizational Effectiveness.pptx
Diagnosing Organizational Effectiveness.pptx
 
Competency-based Human Resource Management.pptx
Competency-based Human Resource Management.pptxCompetency-based Human Resource Management.pptx
Competency-based Human Resource Management.pptx
 
cement industry in India by T. Sumitha.pptx
cement industry in India by T. Sumitha.pptxcement industry in India by T. Sumitha.pptx
cement industry in India by T. Sumitha.pptx
 
Choosing the best strategy qspm matrix.pptx
Choosing the best strategy qspm matrix.pptxChoosing the best strategy qspm matrix.pptx
Choosing the best strategy qspm matrix.pptx
 
BCG Matrix by Raunak Strategic Management.ppt
BCG Matrix by Raunak Strategic Management.pptBCG Matrix by Raunak Strategic Management.ppt
BCG Matrix by Raunak Strategic Management.ppt
 
external analysis0000000000000000 .pptx
external analysis0000000000000000  .pptxexternal analysis0000000000000000  .pptx
external analysis0000000000000000 .pptx
 
Cement clinker coolers perf & efficiency.pptx
Cement clinker coolers perf & efficiency.pptxCement clinker coolers perf & efficiency.pptx
Cement clinker coolers perf & efficiency.pptx
 
Cement Industry in India by Saurabh.pptx
Cement Industry in India by Saurabh.pptxCement Industry in India by Saurabh.pptx
Cement Industry in India by Saurabh.pptx
 
Safety Occupational Health & Environment SHE.ppt
Safety Occupational Health & Environment SHE.pptSafety Occupational Health & Environment SHE.ppt
Safety Occupational Health & Environment SHE.ppt
 
INTERNAL AUDIT - of Cement Industry.pptx
INTERNAL AUDIT - of Cement Industry.pptxINTERNAL AUDIT - of Cement Industry.pptx
INTERNAL AUDIT - of Cement Industry.pptx
 
corporate governance strategic management.pdf
corporate governance strategic management.pdfcorporate governance strategic management.pdf
corporate governance strategic management.pdf
 
Modular manufacturing by self directed.ppt
Modular manufacturing by self directed.pptModular manufacturing by self directed.ppt
Modular manufacturing by self directed.ppt
 
Balanced Scorecard BalancedScorecard.ppt
Balanced Scorecard BalancedScorecard.pptBalanced Scorecard BalancedScorecard.ppt
Balanced Scorecard BalancedScorecard.ppt
 
Balanced Scorecard Balanced scorecard_workshop.pptx
Balanced Scorecard Balanced scorecard_workshop.pptxBalanced Scorecard Balanced scorecard_workshop.pptx
Balanced Scorecard Balanced scorecard_workshop.pptx
 
Balanced Scorecard Balanced Scorecard.ppt
Balanced Scorecard Balanced Scorecard.pptBalanced Scorecard Balanced Scorecard.ppt
Balanced Scorecard Balanced Scorecard.ppt
 
Basics of Feed Manufacturing Basics.pptx
Basics of Feed Manufacturing Basics.pptxBasics of Feed Manufacturing Basics.pptx
Basics of Feed Manufacturing Basics.pptx
 
Failure Modes FMEA-&-Measurement_Systems_Analysis.ppt
Failure Modes FMEA-&-Measurement_Systems_Analysis.pptFailure Modes FMEA-&-Measurement_Systems_Analysis.ppt
Failure Modes FMEA-&-Measurement_Systems_Analysis.ppt
 

Recently uploaded

VIP Call Girls Service Kondapur Hyderabad Call +91-8250192130
VIP Call Girls Service Kondapur Hyderabad Call +91-8250192130VIP Call Girls Service Kondapur Hyderabad Call +91-8250192130
VIP Call Girls Service Kondapur Hyderabad Call +91-8250192130Suhani Kapoor
 
Introduction to IEEE STANDARDS and its different types.pptx
Introduction to IEEE STANDARDS and its different types.pptxIntroduction to IEEE STANDARDS and its different types.pptx
Introduction to IEEE STANDARDS and its different types.pptxupamatechverse
 
High Profile Call Girls Nagpur Meera Call 7001035870 Meet With Nagpur Escorts
High Profile Call Girls Nagpur Meera Call 7001035870 Meet With Nagpur EscortsHigh Profile Call Girls Nagpur Meera Call 7001035870 Meet With Nagpur Escorts
High Profile Call Girls Nagpur Meera Call 7001035870 Meet With Nagpur EscortsCall Girls in Nagpur High Profile
 
SPICE PARK APR2024 ( 6,793 SPICE Models )
SPICE PARK APR2024 ( 6,793 SPICE Models )SPICE PARK APR2024 ( 6,793 SPICE Models )
SPICE PARK APR2024 ( 6,793 SPICE Models )Tsuyoshi Horigome
 
(PRIYA) Rajgurunagar Call Girls Just Call 7001035870 [ Cash on Delivery ] Pun...
(PRIYA) Rajgurunagar Call Girls Just Call 7001035870 [ Cash on Delivery ] Pun...(PRIYA) Rajgurunagar Call Girls Just Call 7001035870 [ Cash on Delivery ] Pun...
(PRIYA) Rajgurunagar Call Girls Just Call 7001035870 [ Cash on Delivery ] Pun...ranjana rawat
 
MANUFACTURING PROCESS-II UNIT-5 NC MACHINE TOOLS
MANUFACTURING PROCESS-II UNIT-5 NC MACHINE TOOLSMANUFACTURING PROCESS-II UNIT-5 NC MACHINE TOOLS
MANUFACTURING PROCESS-II UNIT-5 NC MACHINE TOOLSSIVASHANKAR N
 
(ANJALI) Dange Chowk Call Girls Just Call 7001035870 [ Cash on Delivery ] Pun...
(ANJALI) Dange Chowk Call Girls Just Call 7001035870 [ Cash on Delivery ] Pun...(ANJALI) Dange Chowk Call Girls Just Call 7001035870 [ Cash on Delivery ] Pun...
(ANJALI) Dange Chowk Call Girls Just Call 7001035870 [ Cash on Delivery ] Pun...ranjana rawat
 
Call Girls Service Nagpur Tanvi Call 7001035870 Meet With Nagpur Escorts
Call Girls Service Nagpur Tanvi Call 7001035870 Meet With Nagpur EscortsCall Girls Service Nagpur Tanvi Call 7001035870 Meet With Nagpur Escorts
Call Girls Service Nagpur Tanvi Call 7001035870 Meet With Nagpur EscortsCall Girls in Nagpur High Profile
 
Decoding Kotlin - Your guide to solving the mysterious in Kotlin.pptx
Decoding Kotlin - Your guide to solving the mysterious in Kotlin.pptxDecoding Kotlin - Your guide to solving the mysterious in Kotlin.pptx
Decoding Kotlin - Your guide to solving the mysterious in Kotlin.pptxJoão Esperancinha
 
(SHREYA) Chakan Call Girls Just Call 7001035870 [ Cash on Delivery ] Pune Esc...
(SHREYA) Chakan Call Girls Just Call 7001035870 [ Cash on Delivery ] Pune Esc...(SHREYA) Chakan Call Girls Just Call 7001035870 [ Cash on Delivery ] Pune Esc...
(SHREYA) Chakan Call Girls Just Call 7001035870 [ Cash on Delivery ] Pune Esc...ranjana rawat
 
College Call Girls Nashik Nehal 7001305949 Independent Escort Service Nashik
College Call Girls Nashik Nehal 7001305949 Independent Escort Service NashikCollege Call Girls Nashik Nehal 7001305949 Independent Escort Service Nashik
College Call Girls Nashik Nehal 7001305949 Independent Escort Service NashikCall Girls in Nagpur High Profile
 
Porous Ceramics seminar and technical writing
Porous Ceramics seminar and technical writingPorous Ceramics seminar and technical writing
Porous Ceramics seminar and technical writingrakeshbaidya232001
 
Architect Hassan Khalil Portfolio for 2024
Architect Hassan Khalil Portfolio for 2024Architect Hassan Khalil Portfolio for 2024
Architect Hassan Khalil Portfolio for 2024hassan khalil
 
Structural Analysis and Design of Foundations: A Comprehensive Handbook for S...
Structural Analysis and Design of Foundations: A Comprehensive Handbook for S...Structural Analysis and Design of Foundations: A Comprehensive Handbook for S...
Structural Analysis and Design of Foundations: A Comprehensive Handbook for S...Dr.Costas Sachpazis
 
(MEERA) Dapodi Call Girls Just Call 7001035870 [ Cash on Delivery ] Pune Escorts
(MEERA) Dapodi Call Girls Just Call 7001035870 [ Cash on Delivery ] Pune Escorts(MEERA) Dapodi Call Girls Just Call 7001035870 [ Cash on Delivery ] Pune Escorts
(MEERA) Dapodi Call Girls Just Call 7001035870 [ Cash on Delivery ] Pune Escortsranjana rawat
 
Call for Papers - African Journal of Biological Sciences, E-ISSN: 2663-2187, ...
Call for Papers - African Journal of Biological Sciences, E-ISSN: 2663-2187, ...Call for Papers - African Journal of Biological Sciences, E-ISSN: 2663-2187, ...
Call for Papers - African Journal of Biological Sciences, E-ISSN: 2663-2187, ...Christo Ananth
 

Recently uploaded (20)

9953056974 Call Girls In South Ex, Escorts (Delhi) NCR.pdf
9953056974 Call Girls In South Ex, Escorts (Delhi) NCR.pdf9953056974 Call Girls In South Ex, Escorts (Delhi) NCR.pdf
9953056974 Call Girls In South Ex, Escorts (Delhi) NCR.pdf
 
VIP Call Girls Service Kondapur Hyderabad Call +91-8250192130
VIP Call Girls Service Kondapur Hyderabad Call +91-8250192130VIP Call Girls Service Kondapur Hyderabad Call +91-8250192130
VIP Call Girls Service Kondapur Hyderabad Call +91-8250192130
 
Introduction to IEEE STANDARDS and its different types.pptx
Introduction to IEEE STANDARDS and its different types.pptxIntroduction to IEEE STANDARDS and its different types.pptx
Introduction to IEEE STANDARDS and its different types.pptx
 
Call Us -/9953056974- Call Girls In Vikaspuri-/- Delhi NCR
Call Us -/9953056974- Call Girls In Vikaspuri-/- Delhi NCRCall Us -/9953056974- Call Girls In Vikaspuri-/- Delhi NCR
Call Us -/9953056974- Call Girls In Vikaspuri-/- Delhi NCR
 
High Profile Call Girls Nagpur Meera Call 7001035870 Meet With Nagpur Escorts
High Profile Call Girls Nagpur Meera Call 7001035870 Meet With Nagpur EscortsHigh Profile Call Girls Nagpur Meera Call 7001035870 Meet With Nagpur Escorts
High Profile Call Girls Nagpur Meera Call 7001035870 Meet With Nagpur Escorts
 
SPICE PARK APR2024 ( 6,793 SPICE Models )
SPICE PARK APR2024 ( 6,793 SPICE Models )SPICE PARK APR2024 ( 6,793 SPICE Models )
SPICE PARK APR2024 ( 6,793 SPICE Models )
 
(PRIYA) Rajgurunagar Call Girls Just Call 7001035870 [ Cash on Delivery ] Pun...
(PRIYA) Rajgurunagar Call Girls Just Call 7001035870 [ Cash on Delivery ] Pun...(PRIYA) Rajgurunagar Call Girls Just Call 7001035870 [ Cash on Delivery ] Pun...
(PRIYA) Rajgurunagar Call Girls Just Call 7001035870 [ Cash on Delivery ] Pun...
 
MANUFACTURING PROCESS-II UNIT-5 NC MACHINE TOOLS
MANUFACTURING PROCESS-II UNIT-5 NC MACHINE TOOLSMANUFACTURING PROCESS-II UNIT-5 NC MACHINE TOOLS
MANUFACTURING PROCESS-II UNIT-5 NC MACHINE TOOLS
 
(ANJALI) Dange Chowk Call Girls Just Call 7001035870 [ Cash on Delivery ] Pun...
(ANJALI) Dange Chowk Call Girls Just Call 7001035870 [ Cash on Delivery ] Pun...(ANJALI) Dange Chowk Call Girls Just Call 7001035870 [ Cash on Delivery ] Pun...
(ANJALI) Dange Chowk Call Girls Just Call 7001035870 [ Cash on Delivery ] Pun...
 
Call Girls Service Nagpur Tanvi Call 7001035870 Meet With Nagpur Escorts
Call Girls Service Nagpur Tanvi Call 7001035870 Meet With Nagpur EscortsCall Girls Service Nagpur Tanvi Call 7001035870 Meet With Nagpur Escorts
Call Girls Service Nagpur Tanvi Call 7001035870 Meet With Nagpur Escorts
 
Decoding Kotlin - Your guide to solving the mysterious in Kotlin.pptx
Decoding Kotlin - Your guide to solving the mysterious in Kotlin.pptxDecoding Kotlin - Your guide to solving the mysterious in Kotlin.pptx
Decoding Kotlin - Your guide to solving the mysterious in Kotlin.pptx
 
(SHREYA) Chakan Call Girls Just Call 7001035870 [ Cash on Delivery ] Pune Esc...
(SHREYA) Chakan Call Girls Just Call 7001035870 [ Cash on Delivery ] Pune Esc...(SHREYA) Chakan Call Girls Just Call 7001035870 [ Cash on Delivery ] Pune Esc...
(SHREYA) Chakan Call Girls Just Call 7001035870 [ Cash on Delivery ] Pune Esc...
 
DJARUM4D - SLOT GACOR ONLINE | SLOT DEMO ONLINE
DJARUM4D - SLOT GACOR ONLINE | SLOT DEMO ONLINEDJARUM4D - SLOT GACOR ONLINE | SLOT DEMO ONLINE
DJARUM4D - SLOT GACOR ONLINE | SLOT DEMO ONLINE
 
College Call Girls Nashik Nehal 7001305949 Independent Escort Service Nashik
College Call Girls Nashik Nehal 7001305949 Independent Escort Service NashikCollege Call Girls Nashik Nehal 7001305949 Independent Escort Service Nashik
College Call Girls Nashik Nehal 7001305949 Independent Escort Service Nashik
 
Porous Ceramics seminar and technical writing
Porous Ceramics seminar and technical writingPorous Ceramics seminar and technical writing
Porous Ceramics seminar and technical writing
 
Architect Hassan Khalil Portfolio for 2024
Architect Hassan Khalil Portfolio for 2024Architect Hassan Khalil Portfolio for 2024
Architect Hassan Khalil Portfolio for 2024
 
Structural Analysis and Design of Foundations: A Comprehensive Handbook for S...
Structural Analysis and Design of Foundations: A Comprehensive Handbook for S...Structural Analysis and Design of Foundations: A Comprehensive Handbook for S...
Structural Analysis and Design of Foundations: A Comprehensive Handbook for S...
 
(MEERA) Dapodi Call Girls Just Call 7001035870 [ Cash on Delivery ] Pune Escorts
(MEERA) Dapodi Call Girls Just Call 7001035870 [ Cash on Delivery ] Pune Escorts(MEERA) Dapodi Call Girls Just Call 7001035870 [ Cash on Delivery ] Pune Escorts
(MEERA) Dapodi Call Girls Just Call 7001035870 [ Cash on Delivery ] Pune Escorts
 
Roadmap to Membership of RICS - Pathways and Routes
Roadmap to Membership of RICS - Pathways and RoutesRoadmap to Membership of RICS - Pathways and Routes
Roadmap to Membership of RICS - Pathways and Routes
 
Call for Papers - African Journal of Biological Sciences, E-ISSN: 2663-2187, ...
Call for Papers - African Journal of Biological Sciences, E-ISSN: 2663-2187, ...Call for Papers - African Journal of Biological Sciences, E-ISSN: 2663-2187, ...
Call for Papers - African Journal of Biological Sciences, E-ISSN: 2663-2187, ...
 

Strategy Formulation 29th March 2024.pptx

  • 2. Strategic Management Sr. # Topic Title 1 Strategic Management: an overview 2 Strategy Formulation  Designing Vision and Mission Statements • External Assessment • Internal Assessment • Setting Objectives and Strategic Options • Strategy Analysis and Choice 3 Strategy Execution 4 Strategy Evaluation 5 Limitations of Strategic Management: why strategy fails? 2
  • 3. Stages of Strategic Management Strategic Management process consists of three stages: 1. Strategy formulation, 2. Strategy implementation, and 3. Strategy evaluation. 3
  • 4. Strategy formulation Strategy formulation includes:  Developing a vision and mission statements  Identifying organization’s external opportunities and threats  Indentifying internal strengths and weaknesses  Setting long-term objectives and alternative strategies  Analyzing alternative strategies and choosing particular strategy. 4
  • 5. Presentation Contents of 6th Session • Nature of Strategy Analysis and choice • Process of Strategy Analysis and Choice • A Comprehensive Strategy Formulation Framework – Input stage: EFE Matrix, CP (Competitive Profile) Matrix, and IFE (Internal Factor Evaluation) Matrix – Matching stage: SWOT Matrix, SPACE Matrix, IE Matrix, GS Matrix – Decision stage: QSP (Quantitative Strategic Planning) Matrix  Cultural and Political Aspects of Strategy Choice 5
  • 6. Nature of Strategy Analysis and choice • Generating and analyzing alternative strategies and selecting a set of strategies involve making subjective decision based on objective information. • Alternative strategies are derived from the organization’s vision, mission, objectives, external audit, and internal audit, and are build on past strategies that have worked well. 6
  • 7. Process of Strategy Analysis and Choice • As it’s not possible to consider infinite number of alternative strategies, a manageable set of most attractive alternative strategies are developed. • Identifying and evaluating alternative strategies should involve as many managers and employees as possible from each department who earlier participated in formulation of organizational vision, mission, internal and external audits. • After identifying all feasible strategies, they must be ranked to arrive at a list of prioritized strategies reflecting the collective wisdom of the organization. 7
  • 8. Comprehensive Strategy-Formulation Framework Stage 1: The Input Stage Stage 2: The Matching Stage Stage 3: The Decision Stage Ch 7 -8 Copyright © 2011 Pearson Education
  • 9. A Comprehensive Strategy-Formulation Analytical Framework (SFAF) Stage 1: Input Stage: – EFE Matrix, – IFE (Internal Factor Evaluation) Matrix, and – CP (Competitive Profile) Matrix Stage 2: Matching Stage – SWOT ( Strength-Weakness-Opportunities-Threat) Matrix, – SPACE (Strategic Position and Action Evaluation) Matrix, – IE (Internal-External) Matrix, – GS (Grand Strategy) Matrix Stage 3: Decision making stage – QSP (Quantitative Strategic Planning) Matrix 9
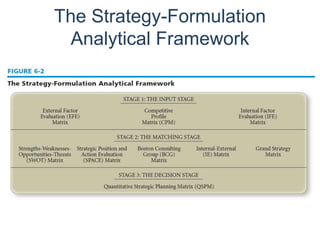
  • 10. A Comprehensive Strategy- Formulation Framework Stage 1 - Input Stage  summarizes the basic input information needed to formulate strategies  consists of the EFE Matrix, the IFE Matrix, and the Competitive Profile Matrix (CPM)
  • 11. Strategy-Formulation Analytical Framework Internal Factor Evaluation Matrix (IFE) External Factor Evaluation Matrix (EFE) Competitive Profile Matrix (CPM) Stage 1: The Input Stage Ch 7 -11 Copyright © 2011 Pearson Education
  • 12. IFE (Internal Factor Evolution) Matrix • IFE Matrix is a management strategy formulation tool that summarizes and evaluates major strengths and weaknesses in functional areas of the organization. • Five steps to construct IFE Matrix: – List key strengths and weaknesses – Assign weight ranging from 0.0 (not important) to 1.0 (all important) – Assign rating from 1 (major weakness) to 4 (major strength) – Multiply weights and rating to get weighted score – Sum the weighted score to get total weighted score for the organization. 12
  • 13. An example of IFE Matrix Key Internal Factors Weight Rating Weighted Score Strengths 1 2 3 Weaknesses 1 2 3 Total Weighted Score 13
  • 14. IFE Matrix Factors Weight Rating (1-4) Weighted Score Strengths RM Availability 0.15 4 0.60 Construction Sector Growth 0.13 3 0.39 Production Technology 0.12 3 0.36 Brand Image 0.15 4 0.60 0.10 3 0.30 Total Strengths 0.65 2.55 Weaknesses Captive Generation by WHR 0.10 2 0.20 Brand Promotion 0.04 2 0.08 Production Cost 0.13 3 0.39 Qualified Workforce 0.08 2 0.16 Total Weakness 0.35 0.83 Total IFE Matrix Score 3.38
  • 15. External Factors OPPORTUNITIES Significant growth opportunities in the domestic market due to growing population & increasing urbanization. Infrastructure boom in Government sector – hydropower, major dams, real estate etc. THREATS Continuous pass on of input costs to consumers with ever high cement prices effecting demand Rising fuel prices. Economic Recession in the country
  • 16. EFE Matrix An EFE (external factor evaluation) Matrix summarizes and evaluate all the external forces that affect an organization. It is developed in 5 stages: 1. List key external factors identified in external audit; 2. Assign to each factor weight ranging from say 0.0 (not important) to 1.0 (very important) indicating relative importance of that factor to be successful in the industry. 3. Assign rating say between 1 (poor response) and 4 (superior response) based on effectiveness of the organization’s strategies. 4. Multiply weight by its rating to get weighted score 5. Sum up to get total weighted score for the organization. 16
  • 17. Example of EFE Matrix Key External Factors Weight Rating Weighted score Opportunities 1. Domestic demand increasing 10% annually 2. Export demand increasing 15% annually 3. Input price decreasing 5% annually Threats 1. Rival organizations increasing ad by 20% annually 2. Govt. Tightening its regulation 3. Interest rates are increasing 3% annually Total 17
  • 18. EFE Matrix Factors Weight Rating(1-4) Weighted Score Opportunities Infrastructure Development 0.15 4 0.60 Population Growth 0.13 4 0.52 Export Potential 0.15 4 0.60 Green Initiatives 0.10 3 0.30 Technological Advancements 0.10 3 0.30 Total Opportunities 0.63 2.32 Threats Economy 0.08 4 0.32 Competition 0.07 3 0.24 Raw MaterialAvailability 0.07 3 0.24 Regulatory Changes 0.07 2 0.14 Energy Costs 0.08 4 0.24 TotalThreats 0.37 1.18 Total EFE Matrix Score 1 3.50
  • 20. CP (Competitive Profile) Matrix • CP Matrix identifies a organization’s strategic competitors and its particular strengths and weakness in relation to the organization’s strategic position. • CP Matrix is broader as it includes both internal and external issues. • CP Matrix rating refers to strengths and weakness between I (major weakness) and 4 (major strength). 20
  • 21. Example of CP Matrix Org A Org B Org C Critical success factors weight rating score rating score Rating score Product quality Price competitiveness Advertising Management Financial position Market share Customer loyalty Global expansion Total 21
  • 22. Competitive Profile Matrix (CPM)  CPM is an essential strategic management tool to compare the firm with the major players of the industry.  CPM shows the clear picture to the firm about their strong points & weak points relative to their competitors.  The CPM score is measured on basis of critical success factors, each factor is measured in same scale mean the weight remain same for every firm only rating varies.  The best thing about CPM is it includes our firm & also facilitates to add other competitors make easier the competitor analysis.  In IFE matrix, only internal factors are evaluated & in EFE matrix only external factors are evaluated but CPM include both internal and external factors to evaluate overall position of the firm with respective to their major competitors.
  • 23. Competitive Profile Matrix (CPM) The competitive profile matrix consists of below mentioned attributes.  Rating  Weight  Weighted Score  Total Weighted Score Rating: Rating represents the response of the firm towards the critical success factors. Highest the rating the better response of the firm towards the critical success factors, rating range from 1 to 4. Rating is applied to each factor.  Major strength = 4  Minor strength = 3  Minor weakness = 2  Major weakness = 1
  • 24. Competitive Profile Matrix (CPM) Weight: Weight attribute in CPM indicates the relative importance of factor to being successful in the firm’s industry. The weight range from 0.0 means not important and 1.0 means important, sum of all assigned weight to factors must be equal to 1.0, otherwise the calculation won’t be considered correct. Weighted Score: Weighted score value is the result achieved after multiplying each factor rating with the weight. Total Weighted Score: The sum of all weighted score is equal to the total weighted score, final value of total weighted score should be between range 1.0 (low) and 4.0 (high). The average weighted score for CPM matrix is 2.5, any company total weighted score fall below 2.5 is considered as weak. The company total weighted score if higher than 2.5 is considered strong in position.
  • 25. CPM - Data Interpretation • MCL need to maintain Financial position and exports through clear business plan control overheads. • Need to improve the quality to make major strength. • MCL need to improve the sale distributor network specially in the western part of country by  Target lead sales  Feed back  Launch products to distributors • Reduce the cost of production to reduce the prices to gain the major strength. • Invest more on WHRP to produce more energy to maintain the major strength. • There is no energy production currently.
  • 26. Weightage Rating Score Financial Position 0.15 3 0.45 Quality 0.08 3 0.24 Exports 0.15 1 0.15 Production Capacity 0.07 4 0.28 Sales Distribution 0.07 2 0.14 Technology 0.18 3 0.54 Price 0.12 3 0.36 Energy Production 0.18 3 0.54 Total 1 2.7 Competitive Profile Matrix
  • 27. A Comprehensive Strategy- Formulation Framework Stage 2 - Matching Stage  focuses on generating feasible alternative strategies by aligning key external & internal factors  techniques include the Strengths-Weaknesses- Opportunities-Threats (SWOT) Matrix, the Strategic Position and Action Evaluation (SPACE) Matrix, the Boston Consulting Group (BCG) Matrix, the Internal-External (IE) Matrix, and the Grand Strategy Matrix
  • 28. Strategy-Formulation Analytical Framework SWOT Matrix SPACE Matrix BCG Matrix IE Matrix Grand Strategy Matrix Stage 2: The Matching Stage Ch 7 -28 Copyright © 2011 Pearson Education
  • 29. Matching Key External and Internal Factors to Formulate Alternative Strategies
  • 31. SWOT Analysis (contd.) SWOT analysis leads to: • Drawing conclusions from the SWOT listings about overall situation of an organization; and • Translating these conclusions into strategic actions to better match organization’s strategy to its resource strengths and market opportunities, and to correct the weaknesses and to defend from external threats. 31
  • 32. SWOT Matrix contd. SWOT Matrix generates 4 types of strategies: 1. SO (Strength-Opportunities) Strategies: intend to use internal strengths to take advantage of external opportunities. 2. WO (Weakness-Opportunities) Strategies: aim at improving internal weakness by taking advantage of external opportunities. 3. ST (Strengths-Threat) Strategies: intend to use internal strengths to reduce the impact of external threats. 4. WT (Weakness-Threat) Strategy: defensive strategy at reducing internal weakness and avoiding external threats. 32
  • 33. SWOT Matrix (contd.) Strength - S 1 2 3 4 Weakness – W 1 2 3 4 Opportunities –O 1 2 3 4 SO Strategies 1 2 3 WO Strategies 1 2 3 Threats- T 1 2 3 4 ST Strategies 1 2 3 WT Strategies 1 2 3 33
  • 34. SWOT Matrix contd. Eight steps to construct a SWOT Matrix: strategies 1. Listing key external opportunities 2. Listing key external threats 3. Listing key internal strengths 4. Listing key internal weakness 5. Matching internal strengths with external opportunities to get the SO 6. Matching internal weakness with external opportunities to get WO strategies 7. Matching internal strengths with external threats to get ST strategies 8. Matching internal weakness with external threats to get WT strategies.
  • 35. SWOT – Strength – Internal Factor 1. Raw Material Availability: MCL has acquired its’ own quarry for limestone reserve, a primary raw material for cement production, which provides a competitive advantage to the cement industry. 2. Brand Image: MCL has built strong brand reputations & customer loyalty over the years, providing a competitive edge in the market.
  • 36. SWOT – Weakness – Internal Factor 1. Production Technology: Some Nepalese cement industries may lack access to the latest technologies & equipment, impacting efficiency & productivity. Investing in modern technologies & production processes can enhance efficiency, reduce costs, & improve product quality, thereby increasing competitiveness. 2. Quality of Workforce 3. Captive Generation 4. Brand Promotion 5. Governance System 6. Poor Sourcing Hub
  • 37. SWOT – Opportunities – External Factor 1. Growing construction sector: The demand for cement is fueled by the booming construction industry in Nepal, driven by infrastructure projects, residential housing, & commercial developments. 2. government policies: Government initiatives to promote infrastructure development & attract foreign investment in the construction sector can provide opportunities for growth. 3. Increasing urbanization: Rapid urbanization in Nepal is driving demand for housing, infrastructure, & commercial buildings, creating a sustained demand for cement products. 4. Infrastructure development: Government-led infrastructure projects such as roads, bridges, hydropower projects, & urban development initiatives provide high growth opportunities for the cement industry. 5. Exports: Nepalese cement industries can explore export markets in neighbor states, leveraging competitive pricing & geographical proximity.
  • 38. SWOT – Opportunities – External Factor 6. Diversification: We can diversify our product offerings to include specialized cement types catering to specific construction needs or explore value-added products like ready-mix concrete. 7. Strategic partnerships: Collaborating with MNC cement companies or forming strategic alliances with construction firms can facilitate knowledge transfer, access to new markets, & investment opportunities.
  • 39. SWOT – Threat – External Factor 1. Infrastructure challenges: Poor transportation infrastructure to quarries & logistical constraints can increase production costs & limit market access for cement manufacturers. 2. Dependency on imports: Despite abundant raw materials, Nepal still imports some cement products to meet demand, indicating potential inefficiencies in domestic production. 3. Regulatory hurdles: Regulatory complexities & bureaucratic processes can hinder business operations & investment in the cement industry. 4. Environmental concerns: Cement production is resource-intensive & can have adverse environmental impacts such as emissions of greenhouse gases & dust pollution, which may face increasing scrutiny. 5. Cost of Coal & other fuel:
  • 40. SWOT – Threat – External Factor 1. Intense competition: The Nepalese cement industry faces competition from domestic players as well as imports from neighboring countries, leading to price pressures & market saturation. 2. Economic instability: Political unrest, currency fluctuations, & economic uncertainties can impact consumer confidence, investment decisions, & overall demand for cement products. 3. RM availability: Disruptions in the supply of key raw materials like limestone or coal due to regulatory issues, environmental concerns, or natural disasters can disrupt production & affect profitability. 4. Substitute materials: Alternate to cement, such as alternative building materials or construction techniques, pose a threat to traditional cement usage, especially in sustainable & eco-friendly construction practices. 5. Regulatory changes: Changes in government policies, regulations, or taxation related to the cement industry can impact operational costs, compliance requirements, & overall business viability.
  • 41. SWOT • SWOT is an important tool to develop 4 types of strategies: SO (Strength - Opportunity), WO (Weakness – Opportunities), ST (Strength - Threats), and WT (Weakness – Threats) depending on key Internal & external factors. • SO strategies use internal strength to take advantage of external opportunities. • WO strategies aim at improving internal weakness by taking advantage of external opportunities. Sometimes external opportunities exist, but a firm has internal weaknesses that prevent it from exploiting those opportunities. • ST strategies use strength to avoid/reduce the impact of external threats. • WT strategies are defensive tactics directed at reducing internal weakness and avoiding external threats.
  • 42. The Matching Stage The Strengths-Weaknesses- Opportunities-Threats (SWOT) Matrix helps managers develop four types of strategies:  SO (strengths-opportunities) Strategies  WO (weaknesses-opportunities) Strategies  ST (strengths-threats) Strategies  WT (weaknesses-threats) Strategies
  • 43. SO Strategies Use a firm’s internal strengths to take advantage of external opportunities SO Strategies Strengths Weaknesses Opportunities Threats SWOT Ch 7 -43 Copyright © 2011 Pearson Education  Increase domestic sales  Penetrate new market  Explore export potential
  • 44. WO Strategies Improving internal weaknesses by taking advantage of external opportunities WO Strategies Strengths Weaknesses Opportunities Threats SWOT  Market Development  Training of employee
  • 45. ST Strategies Use a firm’s strengths to avoid or reduce the impact of external threats ST Strategies Strengths Weaknesses Opportunities Threats SWOT • Market development • Increase Dividend for shareholders • Invest in Maintenance.
  • 46. WT Strategies Defensive tactics aimed at reducing internal weaknesses & avoiding environmental threats WT Strategies Strengths Weaknesses Opportunities Threats SWOT • High Promotion Campaign • Training of employee
  • 47. SWOT Matrix Strengths – S List Strengths Weaknesses – W List Weaknesses Opportunities – O List Opportunities SO Strategies Use strengths to take advantage of opportunities WO Strategies Overcoming weaknesses by taking advantage of opportunities Threats – T List Threats ST Strategies Use strengths to avoid threats WT Strategies Minimize weaknesses and avoid threats
  • 48. Ch 6 -48 Strategy-Formulation Analytical Framework SWOT Matrix SPACE Matrix BCG Matrix IE Matrix Grand Strategy Matrix Stage 2: The Matching Stage Ch 7 -48 Copyright © 2011 Pearson Education
  • 49. SPACE (Strategic Position and Action Evaluation) Matrix • SPACE Matrix in its 4 quadrant framework indicates whether aggressive, conservative, defensive or competitive strategies are appropriate for a organization. • Axes of the SPACE Matrix represent 2 internal and 2 external dimensions. • Internal dimensions are: – FS (Financial strength) – CA (Competitive Advantage)  External dimensions are:  ES (Environmental Stability)  IS (Industry Strength)
  • 50. Factors of SPACE Matrix (contd.) Internal Strategic Position External Strategic Position FS (Financial Strengths) ES (Environmental Stability) 1. Return on Investment 2. Leverage Ratios 3. Liquidity Ratios 4. Working Capital 5. Cash Flow 1. Rate of Inflation 2. Price Elasticity of Demand 3. Competitive Pressure 4. Price range of competing products 5. Technological change CA (Competitive Advantage) IS (Industry Strength) 1. Market share 2. Product quality 3. Customer loyalty 4. Control over input suppliers 1. Growth potential 2. Profit potential 3. Financial stability 4. Productivity
  • 51. SPACE Matrix (contd.) FS + Conservative Strategies Aggressive Strategies CA IS • _ + Defensive Strategies Competitive Strategies ES _
  • 52. The Strategic Position and Action Evaluation (SPACE) Matrix Two internal dimensions (financial position [FP] and competitive position [CP]) Two external dimensions (stability position [SP] and industry position [IP]) Most important determinants of an organization’s overall strategic position 6-52
  • 53. Steps to Develop a SPACE Matrix 1. Select a set of variables to define financial position (FP), competitive position (CP), stability position (SP), and industry position (IP) 6-53
  • 54. Steps to Develop a SPACE Matrix 2. Assign a numerical value ranging from +1 (worst) to +7 (best) to each of the variables that make up the FP and IP dimensions. Assign a numerical value ranging from –1 (best) to –7 (worst) to each of the variables that make up the SP and CP dimensions 6-54 Copyright ©2013 Pearson Education, Inc. publishing as Prentice Hall
  • 55. Steps to Develop a SPACE Matrix 3. Compute an average score for FP, CP, IP, and SP 4. Plot the average scores for FP, IP, SP, and CP on the appropriate axis in the SPACE Matrix 5. Add the two scores on the x-axis and plot the resultant point on X. Add the two scores on the y-axis and plot the resultant point on Y. Plot the intersection of the new xy point 6-55 Copyright ©2013 Pearson Education, Inc. publishing as Prentice Hall
  • 56. Steps to Develop a SPACE Matrix 6. Draw a directional vector from the origin of the SPACE Matrix through the new intersection point  This vector reveals the type of strategies recommended for the organization: aggressive, competitive, defensive, or conservative 6-56 Copyright ©2013 Pearson Education, Inc. publishing as Prentice Hall
  • 57. The SPACE Matrix It is used to determine what type of a strategy a company should undertake. Space matrix is a strategic management tool, which focuses on strategy formulation especially related to the competitive position of an organization.  FP – Financial Position  CP – Competitive Position  IP – Industrial Position  SP – Stability Position There are 2 internal and 2 external strategic dimensions. FP & CP are internal dimension that compare our company with other companies. Similarly, SP & IP are external dimensions. In space matrix, CP and IP values are plotted on x-axis  CP value range from -1 (best) to -6 (worst).  IP value range from +1 to +6. Whereas, FP and SP are plotted on Y-axis  SP value range from -1 (best) to -6 (worst)  FP value range from +1 to +6
  • 58. Financial Position (FP) Rating Net profit 5 Earnings per share 3 Debt Equity Ratio 4 Stock Turnover Ratio 4 Inventory turnover 5 Average 21/5= 4.2 Industrial Position (IP) Ratings Resource Utilization 5 Financial Stability 6 Resource Utilization 4 Growth Rate 5 Competitors 4 Average 24/5= 4.8 The SPACE Matrix
  • 59. • After rating each factor of SP, CP, IP and FP average is taken of the rating and then total of all average is taken. • By taking total of Y-axis and x-axis the net result will be marked on the space matrix and it will show the competitive position of an organization. In a space matrix, there are 4 quadrants & each quadrant represents a different type of nature,  Aggressive  Conservative  Defensive  Competitive The SPACE Matrix
  • 60. Competitive Position (CP) Ratings Brand Image -1 Distribution Network -1 Technology -2 Customer Loyalty -1 Market share -2 Average -7/5= -1.4 Stability Position (SP) Ratings GDP -2 Rate of Inflation -3 Tax -1 Barriers to entry in market (Govt. Policies) -2 Peace & Security -3 Average -11/5= -2.2 The SPACE Matrix
  • 61. • Company Position – Aggressive • Financially strong • Can take advantage of external opportunities, overcome internal weakness & avoid external threats by its internal strength. • Capable of Market penetration, product development and integration depending on the specific circumstances The SPACE Matrix
  • 62. Y axis X axis FP +4.2 +4.8 IP SP -2.2 -1.4 CP Total +2 +3.4 The SPACE Matrix
  • 63. Ch 6 -63 SPACE Matrix Strategic Position & Action Evaluation Matrix 4-quadrants indicate whether the most appropriate strategy is: • Aggressive • Conservative • Defensive • Competitive Ch 7 -63 Copyright © 2011 Pearson Education
  • 65. Factors That Make Up the SPACE Matrix Axes 6-65
  • 66. Factors That Make Up the SPACE Matrix Axes 6-66
  • 67. Example Strategy Profiles 6-67 Copyright ©2013 Pearson Education, Inc. publishing as Prentice Hall
  • 68. Example Strategy Profiles 6-68 Copyright ©2013 Pearson Education, Inc. publishing as Prentice Hall
  • 69. Ch 6 -69 Strategy-Formulation Analytical Framework SWOT Matrix SPACE Matrix BCG Matrix IE Matrix Grand Strategy Matrix Stage 2: The Matching Stage Ch 7 -69 Copyright © 2011 Pearson Education
  • 70. The Boston Consulting Group (BCG) Matrix BCG Matrix  graphically portrays differences among divisions in terms of relative market share position and industry growth rate  allows a multidivisional organization to manage its portfolio of businesses by examining the relative market share position and the industry growth rate of each division relative to all other divisions in the organization
  • 72. The BCG Matrix The major benefit of the BCG Matrix is that it draws attention to the cash flow, investment characteristics, and needs of an organization’s various divisions
  • 73. Boston Consulting Group Matrix (BCG) • Also known as the BCG Growth-Share Matrix, provides a visual representation of product portfolio. Helps to make strategic decisions about investment, divestment or growth strategies for each product. • The BCG model is based on product life cycle theory. Helps to determine priorities for products in the product portfolio. • For long term value creation, a company product portfolio shall contains both high- growth products in need of cash inputs & low-growth products that generate a lot of cash. • The matrix categorizes products into 4 quadrants based on 2 dimensions, Market Growth Rate & Relative Market Share. Beyond these, also need to consider industry dynamics, competitive landscape & market trends.
  • 74. Interrelation of Market Share & Market Growth  Market Share: Market share is the percentage of the total market that is being serviced by your company measured either in the revenue terms or unit volume terms. The higher our market share, the higher proportion of the market we control. Higher market share indicates a stronger competitive position.  Market Growth Rate is used as a measure of a market’s attractiveness. High growth markets offer opportunities for expansion, while low growth markets may require defensive strategies to maintain market share.  Markets experiencing high growth are ones where the total market share available is expanding & there is plenty of opportunity for everyone to make money.
  • 75. Individual Sales this year – Individual sales last year MGR = Individual Sales last year Business Unit Sales this year RMS = Leading rival sales this year Boston Consulting Group Matrix (BCG)
  • 76. Boston Consulting Group Matrix (BCG)
  • 77. STAR: (High Market Share & High Market Growth) QUESTION MARK: (Low Market Share & High Market Growth) CASH COW: (High Market Share & Low Market Growth) DOG: (Low Market Share & Low Market Growth) Boston Consulting Group Matrix (BCG)
  • 79. The BCG Matrix Question marks – Quadrant I  Organization must decide whether to strengthen them by pursuing an intensive strategy (market penetration, market development, or product development) or to sell them
  • 80. BCG - Question Marks/Problem Children  High Growth Rate, Low Market Share  Most business start as question marks. There is uncertainty about their future success, hence the name "question marks.“  They absorb great amount of cash if the market share remains low  Question marks have potential to become star, & then cash cow, but can also become dog.  Investment should be high for question marks.
  • 81.  High market share in high-growth markets.  Stars are leader in business  They also require heavy investment to maintain it’s large market share.  It leads to large amount of cash consumption & cash generation.  Stars typically require significant investment to sustain their growth but have the potential to become future cash cows if they maintain their market dominance. BCG - Stars
  • 82. Stars • High relative market share and high growth rate - Best long-run opportunities for growth & profitability • Substantial investment to maintain or strengthen dominant position - Integration strategies, intensive strategies, joint ventures
  • 83. Cash Cows - Low Growth, High Market Share  Cash cows are products or businesses with a high market share in low-growth markets.  They are foundation of the company & often the stars of yesterday.  Profits and cash generation should be high because of the low growth, investments needed should be low.  They generate significant cash flow but typically require minimal investment to maintain their market position.  Cash cows are "cash generators" of a company & provide resources to invest in other areas.  They are in an industry that is mature, neither growing nor declining.
  • 84. Cash Cows • High relative market share, competes in low-growth industry - Generate cash in excess of their needs - Milked for other purposes • Maintain strong position as long as possible - Product development, concentric diversification - If weakens – retrenchment or divestiture Ch 7 -84
  • 85. Dogs – Low Growth, Low Market Share  Dogs are the cash traps  Business is situated at a declining stage  They do not generate significant cash flow and may even consume resources.  Companies often face the decision of whether to divest or restructure these businesses to minimize losses. Beware of expensive, turn around plans.  Avoid and minimize the number of dogs in a company.  Low relative market share, competes in slow or no market growth. Weak internal & external position  Liquidation, divestiture, retrenchment
  • 86. BCG-MATRIX FOR THE PRODUCT LINE OF Coca-Cola
  • 87.
  • 88. QUESTION MARKS (HIGH GROWTH, LOW MARKET SHARE
  • 89. STARS (HIGH GROWTH, HIGH MARKET SHARE)
  • 90. CASH COWS (LOW GROWTH, HIGH MARKET SHARE
  • 91. DOGS (LOW GROWTH, LOW MARKET SHARE)
  • 92.
  • 95. CASH COWS ( MILK TO FUND OTHER BUSINESS)
  • 96. DOGS
  • 97.
  • 99.
  • 100.
  • 101.
  • 102. STAR: (High Market Share & High Market Growth)  We have our OPC cement in this category. We should continue to invest in this product to maintain or expand our market leadership.  We should consider expanding production capacity & enhancing distribution channels to meet growing demand.  Continuously innovate & improve the quality of OPC to maintain its competitive edge.  Explore opportunities for producing specialized variations of OPC to cater to specific customer needs. BCG in MCL
  • 103. Strategy-Formulation Analytical Framework SWOT Matrix SPACE Matrix BCG Matrix IE Matrix Grand Strategy Matrix Stage 2: The Matching Stage
  • 104. The Internal-External Matrix  Positions an organization’s various divisions in a nine-cell display  IE Matrix is similar to BCG Matrix, except: - Requires more information about the divisions - Strategic implications of each matrix are different Ch 7 -104
  • 105. IE M ATR IX
  • 107. IE Matrix  Based on two key dimensions - The IFE total weighted scores on the x-axis - The EFE total weighted scores on the y-axis  Divided into three major regions - Grow and build – Cells I, II, or IV - Hold and maintain – Cells III, V, or VII - Harvest or divest – Cells VI, VIII, or IX Ch 7 -107
  • 109. Strategy-Formulation Analytical Framework SPACE Matrix BCG Matrix IE Matrix Stage 2: The Matching Stage SWOT Matrix Grand Strategy Matrix
  • 110. GS (Grand Strategy) Matrix GS Matrix is based on two evaluative dimensions: 1. Competitive Position, and 2. Market Growth. All organizations can be positioned in one of the four strategy quadrants: 1. Quadrant I is an excellent strategic position for an organization due to strong competitive position and rapid market growth. 2. Quadrant II organizations need to evaluate their market position as they are facing weak competitive position. 3. Quadrant III organizations are in slow growth industries and have weak competitive position. 4. Quadrant IV organizations have strong competitive position , but are in a slow growth industry.
  • 111. GS (Grand Strategy) Matrix (contd.) RMG Quadrant II Quadrant I Intensive strategies Intensive strategies Defensive strategies Integration strategies WCP SCP Quadrant III Quadrant IV Defensive strategies Diversification strategies SMG
  • 112. The Grand Strategy Matrix Grand Strategy Matrix  based on two evaluative dimensions: • competitive position and • market (industry) growth
  • 114. The Grand Strategy Matrix Quadrant I  continued concentration on current markets (market penetration and market development) and products (product development) is an appropriate strategy Quadrant II  unable to compete effectively  need to determine why the firm’s current approach is ineffective and how the company can best change to improve its competitiveness
  • 115. The Grand Strategy Matrix Quadrant III  must make some drastic changes quickly to avoid further decline and possible liquidation  Extensive cost and asset reduction (retrenchment) should be pursued first Quadrant IV  have characteristically high cash-flow levels and limited internal growth needs and often can pursue related or unrelated diversification successfully
  • 116. Strategy-Formulation Analytical Framework Stage 3: The Decision Stage Quantitative Strategic Planning Matrix (QSPM) Ch 7 - Copyright © 2011 Pearson Education
  • 117. QSP (Quantitative Strategic Planning) Matrix • QSP Matrix is the decision making tool of Stage 3 of Strategy-Formulation Analytical Framework. • QSP Matrix determines the relative attractiveness of various strategies based on the extent to which key external and internal success factors are capitalized upon or improved. • QSP Matrix is prepared using information of stage 1 (input stage) and stage 2 (matching stage) of Strategy Formulation Analytical Framework.
  • 118. QSP Matrix (contd.) Six steps are required to prepare QSP Matrix: • Step 1: listing external opportunities/threats and internal strengths/weakness from stage 1 (input stage) of SFAF; • Step 2: assigning weights to each external and internal factors as from stage 1 (input stage) of SFAF; • Step 3: Identifying alternative strategies from stage 2 (matching stage) of SFAF; • Step 4: determining strategy Attractiveness Score (AS); • Step 5: Computing Total Attractiveness Score (TAS); and • Step 6: Computing Sum Total Attractiveness Score (STAS).
  • 119. QSP Matrix (contd.) Key Factors Weight Strategy 1 Strategy 2 Strategy 3 AS TAS AS TAS AS TAS Key External Factors (Opportunities/Threats) Economy Political/legal/governance Technology trends Competitive environment Key Internal Factors (Strengths/Weakness) Management Marketing Finance/Accounting Production/Operation R&D MIS
  • 120. A Comprehensive Strategy- Formulation Framework Stage 3 - Decision Stage  involves the Quantitative Strategic Planning Matrix (QSPM)  reveals the relative attractiveness of alternative strategies and thus provides objective basis for selecting specific strategies
  • 121. The Quantitative Strategic Planning Matrix (QSPM) Quantitative Strategic Planning Matrix (QSPM)  objectively indicates which alternative strategies are best  uses input from Stage 1 analyses and matching results from Stage 2 analyses to decide objectively among alternative strategies
  • 123. Steps in a QSPM 1. Make a list of the firm’s key external opportunities/ threats and internal strengths/ weaknesses in the left column of the QSPM 2. Assign weights to each key external & internal factor 3. Examine the Stage 2 (matching) matrices, and identify alternative strategies that the organization should consider implementing 4. Determine the Attractiveness Scores (AS) 5. Compute the Total Attractiveness Scores 6. Compute the Sum Total Attractiveness Score
  • 124.
  • 125.
  • 126. Positive Features of the QSPM Sets of strategies can be examined sequentially or simultaneously Requires strategists to integrate pertinent external and internal factors into the decision process Can be adapted for use by small and large for-profit and nonprofit organizations
  • 128. IE (Internal-External) Matrix • IE Matrix is based on two dimensions: – IFE total weighted scores on x-axis, and – EFE total weighted scores on y-axis  IE Matrix is divided into 3 regions with different strategic implications:  I, II &IV : grow and build (intensive or integrative strategies)  III, V & VII : hold and maintain (market penetration and product development strategies)  VI, VIII &IX : harvest or divest (defensive strategies)
  • 129. IE (Internal-External) Matrix (contd.) IFE TW Score EFE TW Score IFE Strong 3.0 – 4.0 IFE Average 2.0 – 2.99 IFE Weak 1.0 – 1.99 EFE High 3.0 – 4.0 I Grow and build II Grow and build III Hold and maintain EFE Medium 2.0 – 2.99 IV Grow and build V Hold and maintain VI Harvest or divest EFE Low 1.0 – 1.99 VII Hold and maintain VIII Harvest or divest IX Harvest or divest
  • 130. STRENGTHS Maruti Cement is an accepted brand in Nepalese market. Trusted for mega projects both private and public, fetching a premium price and optimal capacity utilization. MCL is an environmentally responsible corporate entity as evident from its investment in emission control equipment. WEAKNESS MCL does not own Waste Heat Recovery Captive generation power plants Dependency on imported, erratic supply of coal due to various reasons State-of-the-art, energy-efficient production lines. Workforce needs training Internal Factors
  • 131. Strategy Formulation 1. Positioning Forces Before Action: • MCL should thoroughly analyze its external & internal environment before making strategic decisions. This includes assessing market conditions, competitive forces, and its own capabilities and resources. 2. Focus on Effectiveness: • MCL should prioritize strategies and actions that are most likely to lead to effective outcomes. This might involve selecting strategies that align with its strengths and opportunities and addressing weaknesses and threats. 3. Intuitive and Analytical Skills: • MCL should assemble a team with a mix of intuitive and analytical skills. Intuition can help identify trends and opportunities, while analytical skills are crucial for data-driven decision-making. 4. CoordinationAmong Few Individuals:  Strategy formulation at MCL should involve coordination among key individuals, such as top management and strategic planners. This ensures that the decision-making process is focused and streamlined.
  • 134. Quantitative Strategic Planning Matrix (QSPM) • It's a tool used in strategic management to evaluate & prioritize various strategic alternatives based on • potential impact on an organization's success. • QSPM involves assessing internal and external factors, assigning weights and scores, and generating a matrix that helps decision- makers choose the most suitable strategies to pursue.
  • 135. Limitations of the Strategy Formulation Framework • Quantitative techniques used in Strategy Formulation Analytical Framework (SFAF), like any other quantitative methods are based on simplified assumptions that may not always realistic; • SFAF always requires intuitive judgments based on objective information; • SFAF can be only as good as the inputs and matching analysis on which it is based.
  • 136. Cultural and Political aspects of Strategy Choice • All organization have a culture. If formulated strategies are in conflict with organizational culture, implementation will be slow and difficult. • All organization have internal power politics. Unless internal power politics is managed well, implementation of strategies could be sabotaged.
  • 137. Strategic Management: references • Fred R. David (2008), Strategic Management: Concepts and Cases, 11th Edition, Prentice Hall (Chapter 6) • Arthur A. Thompson, Jr. (2010) Crafting and Executing Strategy: the quest for comparative, 16th Edition, McGraw Hill (Chapter 5 & 6) 137
  • 138.  The external environment plays an integral role in the company’s operational & financial performance.  Our strategy seeks to optimize performance by aligning with the external environment.  This involves managing risks and capitalizing on opportunities across political, economic, social, technological, environmental & legal domains. PESTEL Analysis
  • 140. Political Factors How government policy and actions intervene in the economy and other factors that can affect a business. These include the following: • Tax Policy • Trade Restrictions • Tariffs • Bureaucracy Different political parties in a country have diverging views and strategies for policy on the items above.
  • 141. Economic Factors Economic Factors take into account the various aspects of the economy, and how the outlook on each area could impact your business. These economic indicators are usually measured and reported by Central Banks and other Government Agencies. • Economic Growth Rates • Interest Rates • Exchange Rates • Inflation • Unemployment Rates The Economic outlook is of extreme importance for a business.
  • 142. Social Factors Which are related to the cultural & demographic trends of society. Social norms and pressures are key to determining a society consumerist behavior. Factors to be considered are the following: • Cultural Aspects & Perceptions • Health Consciousness • Populations Growth Rates • Age Distribution • Career Attitudes
  • 143. Technological Factors Technological Factors are linked to innovation in the industry, as well as innovation of the overall economy. Not being up to date to the latest trends of a particular industry can be extremely harmful to operations. Technological Factors include the following: • R&D – Activity • Automation • Technological Incentives • The Rate of change in technology
  • 144. Environmental Factors Ecological impacts on business. As weather extremes become more common, businesses need to plan how to adapt to these changes. Key Environmental Factors include the following: • Weather Conditions • Temperature • Climate Change • Pollution • Natural disasters (tsunami, tornadoes, corona etc.) Additionally, there is increasing importance for businesses to be environmentally friendly with their operations, as evidenced by the rise Corporate Sustainability Responsibility (CSR) initiatives. Examples of CSR initiatives include carbon footprint reduction efforts and transitions into renewable material and energy sources.
  • 145. Legal Factors There is often uncertainty regarding the difference between Political and Legal Factors in the context of a PESTEL analysis. Legal Factors pertain to any legal forces that define what a business can or cannot do. Political Factors involve the relationship between business & the government. Political & Legal Factors can intercept when governmental bodies introduce legislature & policies that affect how businesses operate. Legal factors include the following: • Industry Regulation • Licenses & Permits • Labor Laws • Intellectual Property • Consumerism
  • 147. Threats of New Entrance • Maruti Cement operates in a competitive industry with low entry barriers. • Large investment is required to do such businesses. Bargaining Power ofSuppliers • Cost of Cement materials (limestone, coal, gypsum) impact costs. • Multiple suppliers, Strong relationship & timely payments maintain broad supplier base & power. Bargaining Power of Buyers • Construction buyers impact cement prices & terms. • Buyer bargaining power is moderate. • Company's quality focus, customer satisfaction & diverse customer base provide Industry advantage. Competitive Rivalry • Fierce rivalry exists. Focus on price, quality, innovation, client attraction. • MCL competes with well- known brands, with fierce competition due to product similarities & the industry's cluttered landscape. Threat of Substitutes • Cement is the main construction material being used globally. • Threat of its substitution with new product is not significant. Porters Five Forces
  • 148. Key Points Supply The demand-supply situation is high skewed with the latter being significantly higher. Demand Housing sector acts as the principal growth driver for cement. However, recently industrial and infrastructure sectors have also emerged as demand drivers. Barriers to entry High capital costs and long gestation periods. Access to limestone reserves (key input) also acts as a significant entry barrier.
  • 149. Key Points Bargaining power of suppliers Licensing of coal and limestone reserves, supply of power from the state grid etc. are all controlled by a single entity, which is the government. However, nowadays producers are relying more on captive power, but the shortage of coal and volatile fuel prices remain a concern. Bargaining power of customers Cement is a commodity business and sales volumes mostly depend upon the distribution reach of the company. However, things are changing and few brands have started commanding a premium on account of better quality perception. Competition Intense competition with players expanding reach and achieving pan India presence.
  • 150. Porter Five Forces Model Summary: • In the context of Porter's Five Forces Model, MCL faces moderate threats from new entrants, suppliers, and buyers. • The threat of substitutes is low due to the essential nature of cement in construction. • Competitive rivalry is very high in the industry. • To remain competitive, MCL needs to focus on cost efficiency, product quality, and differentiation strategies to distinguish itself from competitors and mitigate the impacts of these forces.