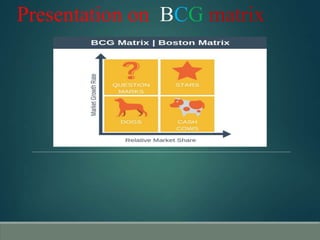
4. It is based on the combination of market growth
& market share relatives of the companies
products.
Question Marks
Stars
Cash cows
Dogs
5.
6. Relative market share
This indicates likely cash generation, because the higher the
share the more cash will be generated. As a result of 'economies
of scale‘. it is assumed that these earnings will grow faster the
higher the share
Market growth rate
Rapidly growing in rapidly growing markets, are what
organizations strive for; but, as we have seen, the penalty is that
they are usually net cash users – they require investment. The
reason for this is often because the growth is being 'bought' by the
high investment, in the reasonable expectation that a high market
share will eventually turn into a sound investment in future profits
7. Question marks
( high growth, low market share)
Growing rapidly and consumes large amounts of cash
But they have low market share.
It has the potential to gain market share and become a
star and when the market growth is slow it will become
cash cow.
When market growth declines it will be degenerate
into dog.
It must be analyzed carefully whether there is worth of
investment required to grow market share.
8. Stars
(high growth, high market share)
Generate large amount of cash – market share.
Consumes large amount of cash – market growth.
It will become cash cow when market growth rate declines.
Frequently roughly in balance on net cash flow however if
needed any attempt should be made to hold share, because
the rewards will be cash cow if market share is kept.
9. Cash cows
( low growth, high marketshare)
Generates stable cash flow.
profits and cash generation should be high, and because of
the low growth , investment needed to be low. Keep profits
high.
Cash cows provide the cash required to turn question marks
into market leaders, to cover R&D and to pay dividends to
shareholders.
10. Dogs
(low growth, low market share)
Neither generate nor consume a large amount of
cash.
Avoid and minimize the number of dogs in a
company.
Beware of expensive turn around plans.
Deliver cash, otherwise liquidate.
11. Limitation
BCG matrix uses only two dimensions relative market
share & market growth rate.
Problem of getting data on market share & market growth.
High market share does not mean profits all time. Business
with market share can be profitable too.
12. Conclusion
Though BCG matrix has its limitation it is one of the most famous & simple
portfolio planning matrix, used by large companies having multi- products.
The BCG matrix will be applied for the companies products and not over the
industries.