Download as PDF, PPTX


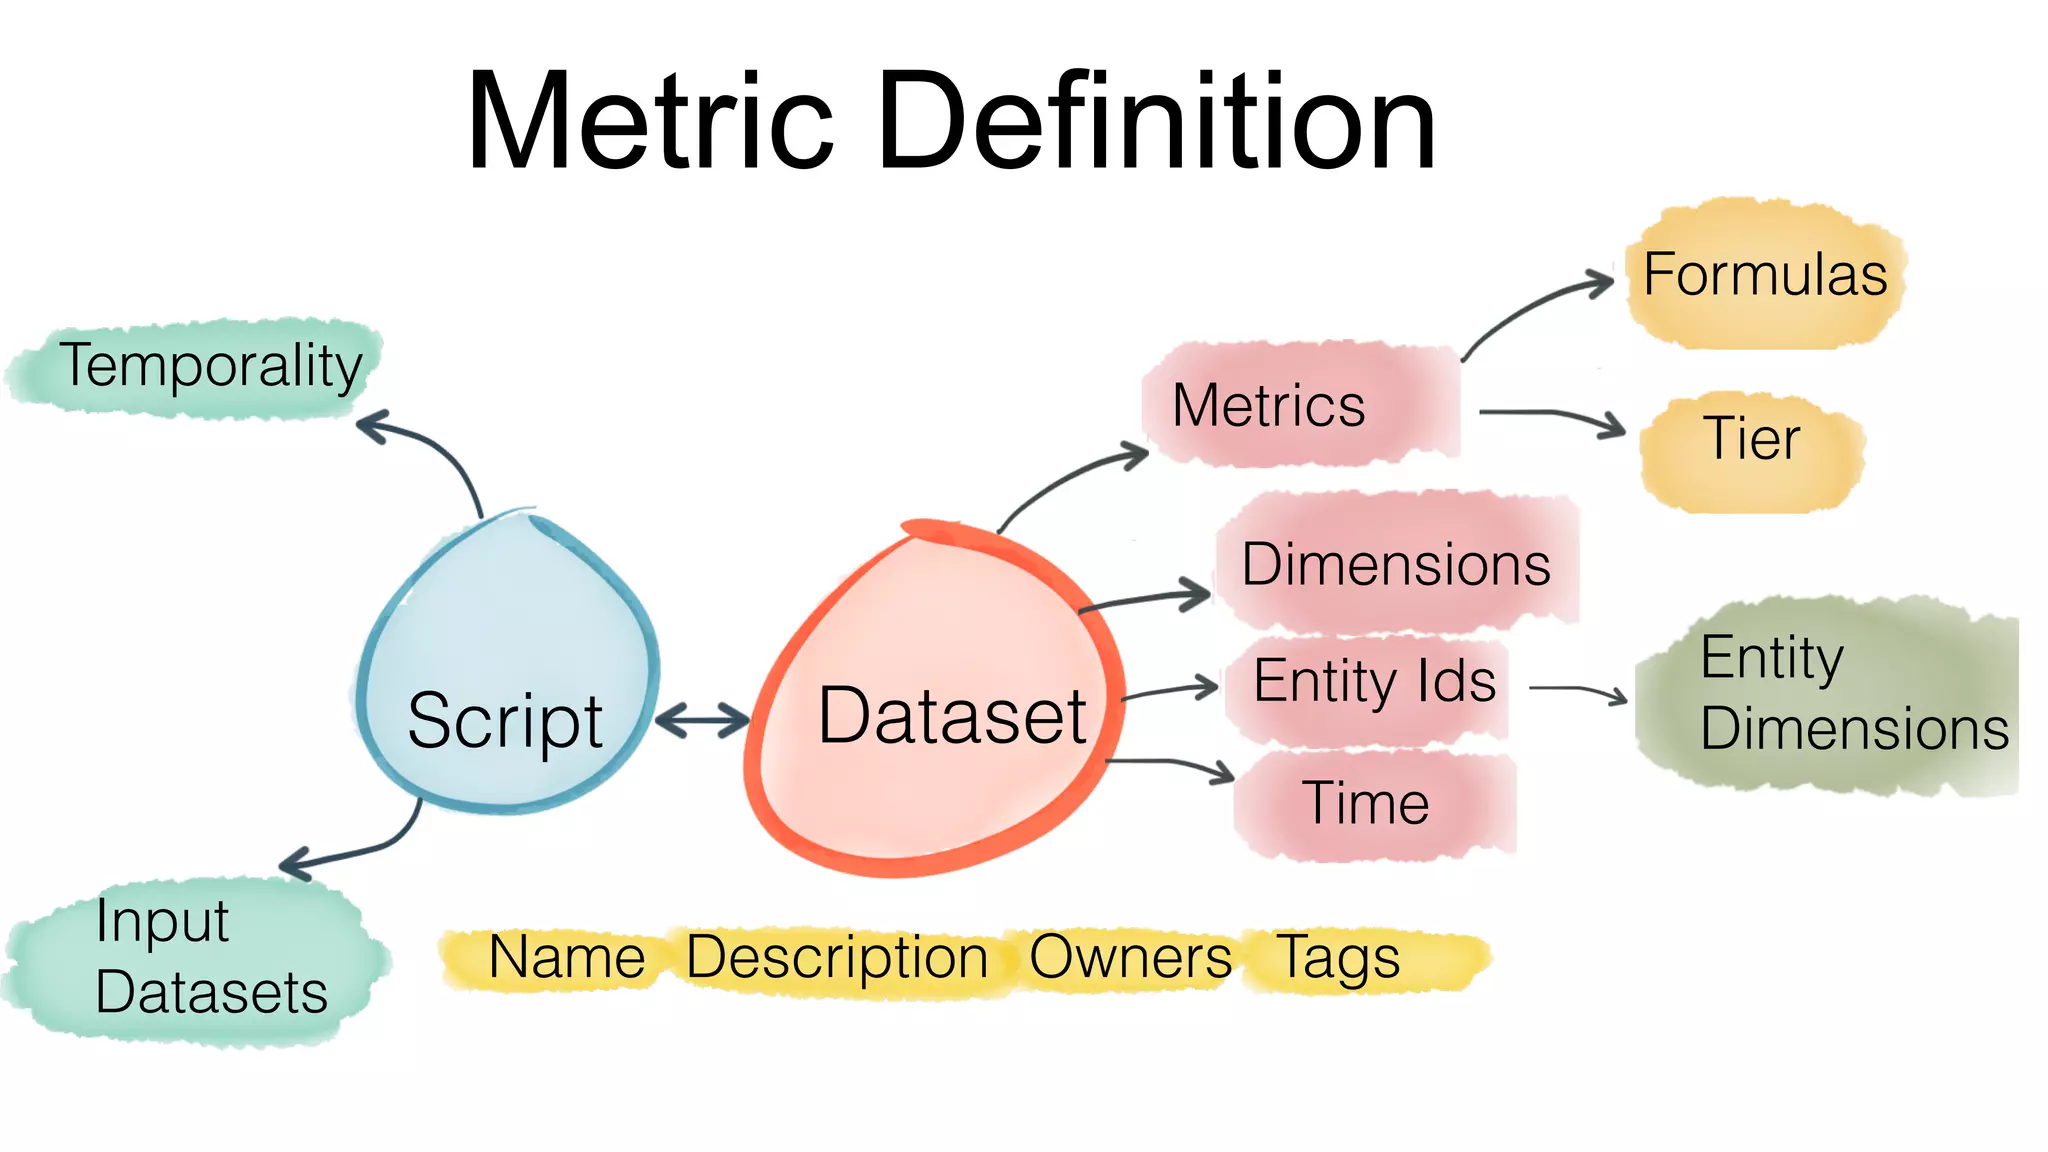
![An example: video play analysis
name: "video"
description: “Metrics for video tracking”
label: “video”
tags: [flagship, feed]
owners: [jdoe, jsmith]
enabled: true
retention: 90d
timestamp: timestamp
frequency: daily
script: video_play.pig
output_window: 1d
dimensions:[
{
name: platform
doc: “phone, tablet or desktop"
}
{
name: action_type
doc: “click play or auto-play“
}
]
input_datasets
[
{
name: actionsRaw
path: Tracking.ActionEvent
range: 1d
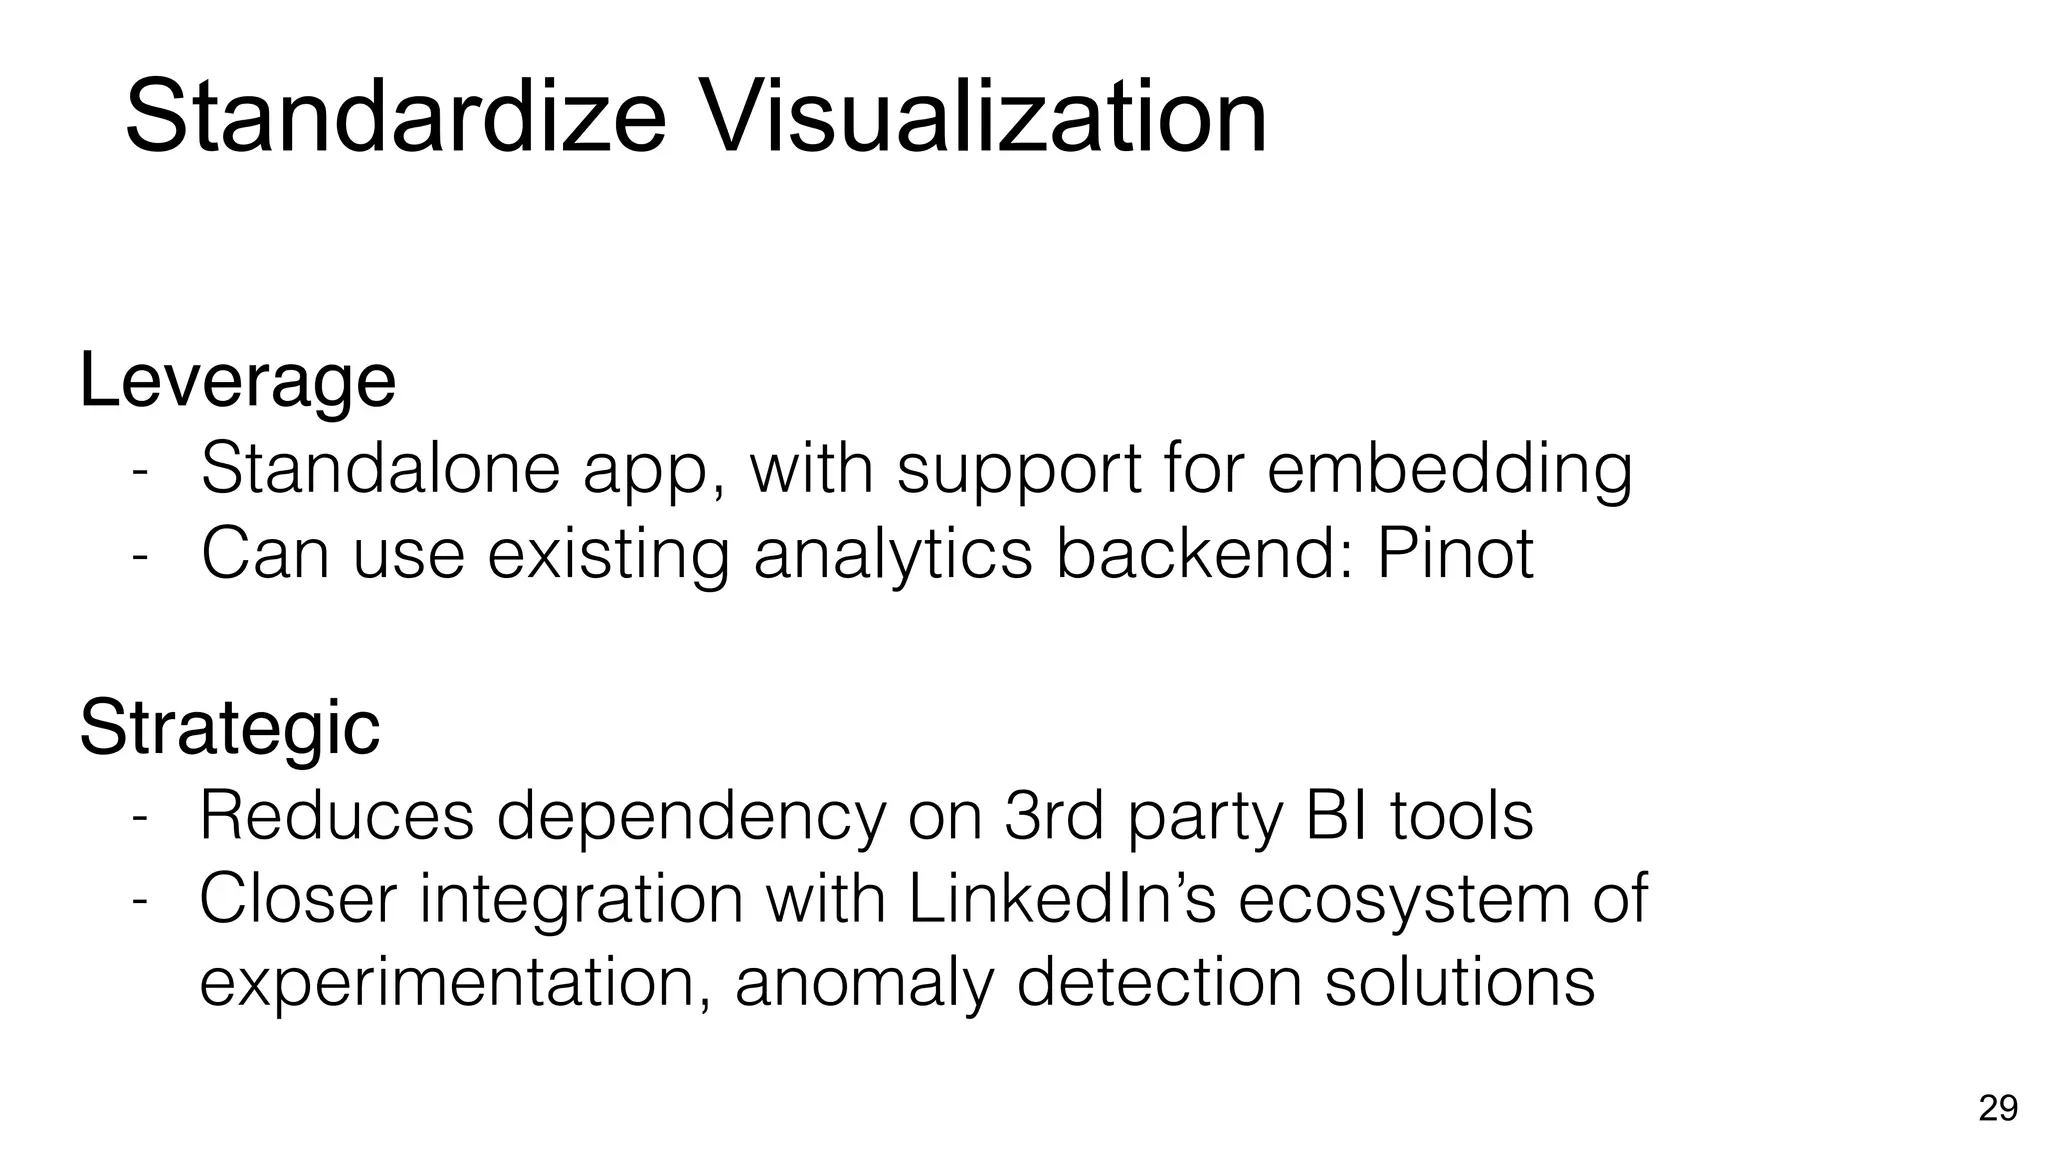
}
]](https://image.slidesharecdn.com/reportinglinkedinstratafinal-151207084404-lva1-app6891/75/Strata-SG-2015-LinkedIn-Self-Serve-Reporting-Platform-on-Hadoop-19-2048.jpg)
![An example contd…
metrics: [
name: unique_viewers
doc: “Count of unique viewers”
formula: “unique(member_id)”
tier: 2
good_direction: "up"
}
{
name: play_actions
doc: “Sum of play actions"
tier: 2
formula: “sum(play_actions)"
good_direction: "up"
}
]
entity_ids: [
{
name: member_id
category: member
}
{
name:video_id
category: video
}
]](https://image.slidesharecdn.com/reportinglinkedinstratafinal-151207084404-lva1-app6891/75/Strata-SG-2015-LinkedIn-Self-Serve-Reporting-Platform-on-Hadoop-20-2048.jpg)
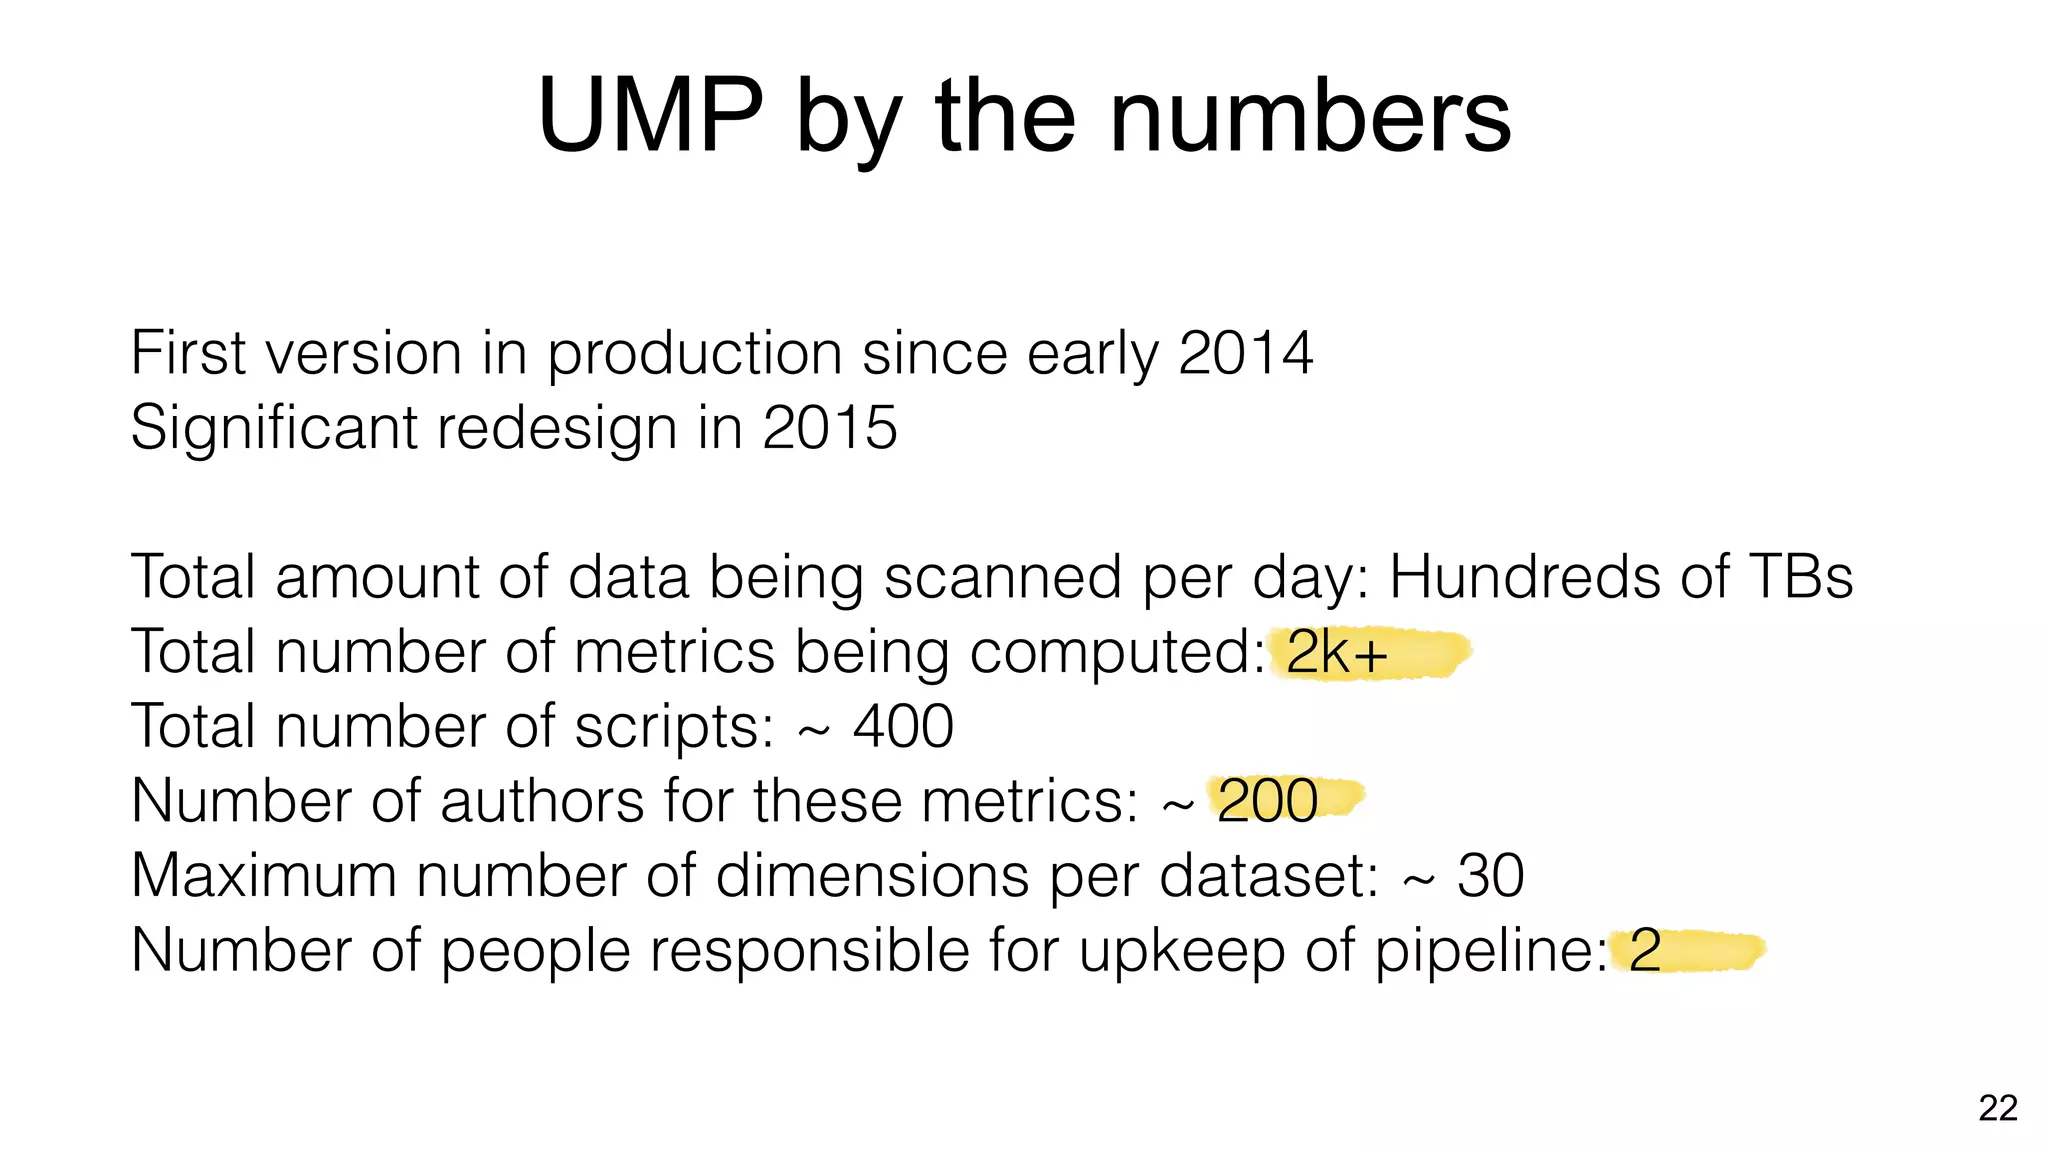
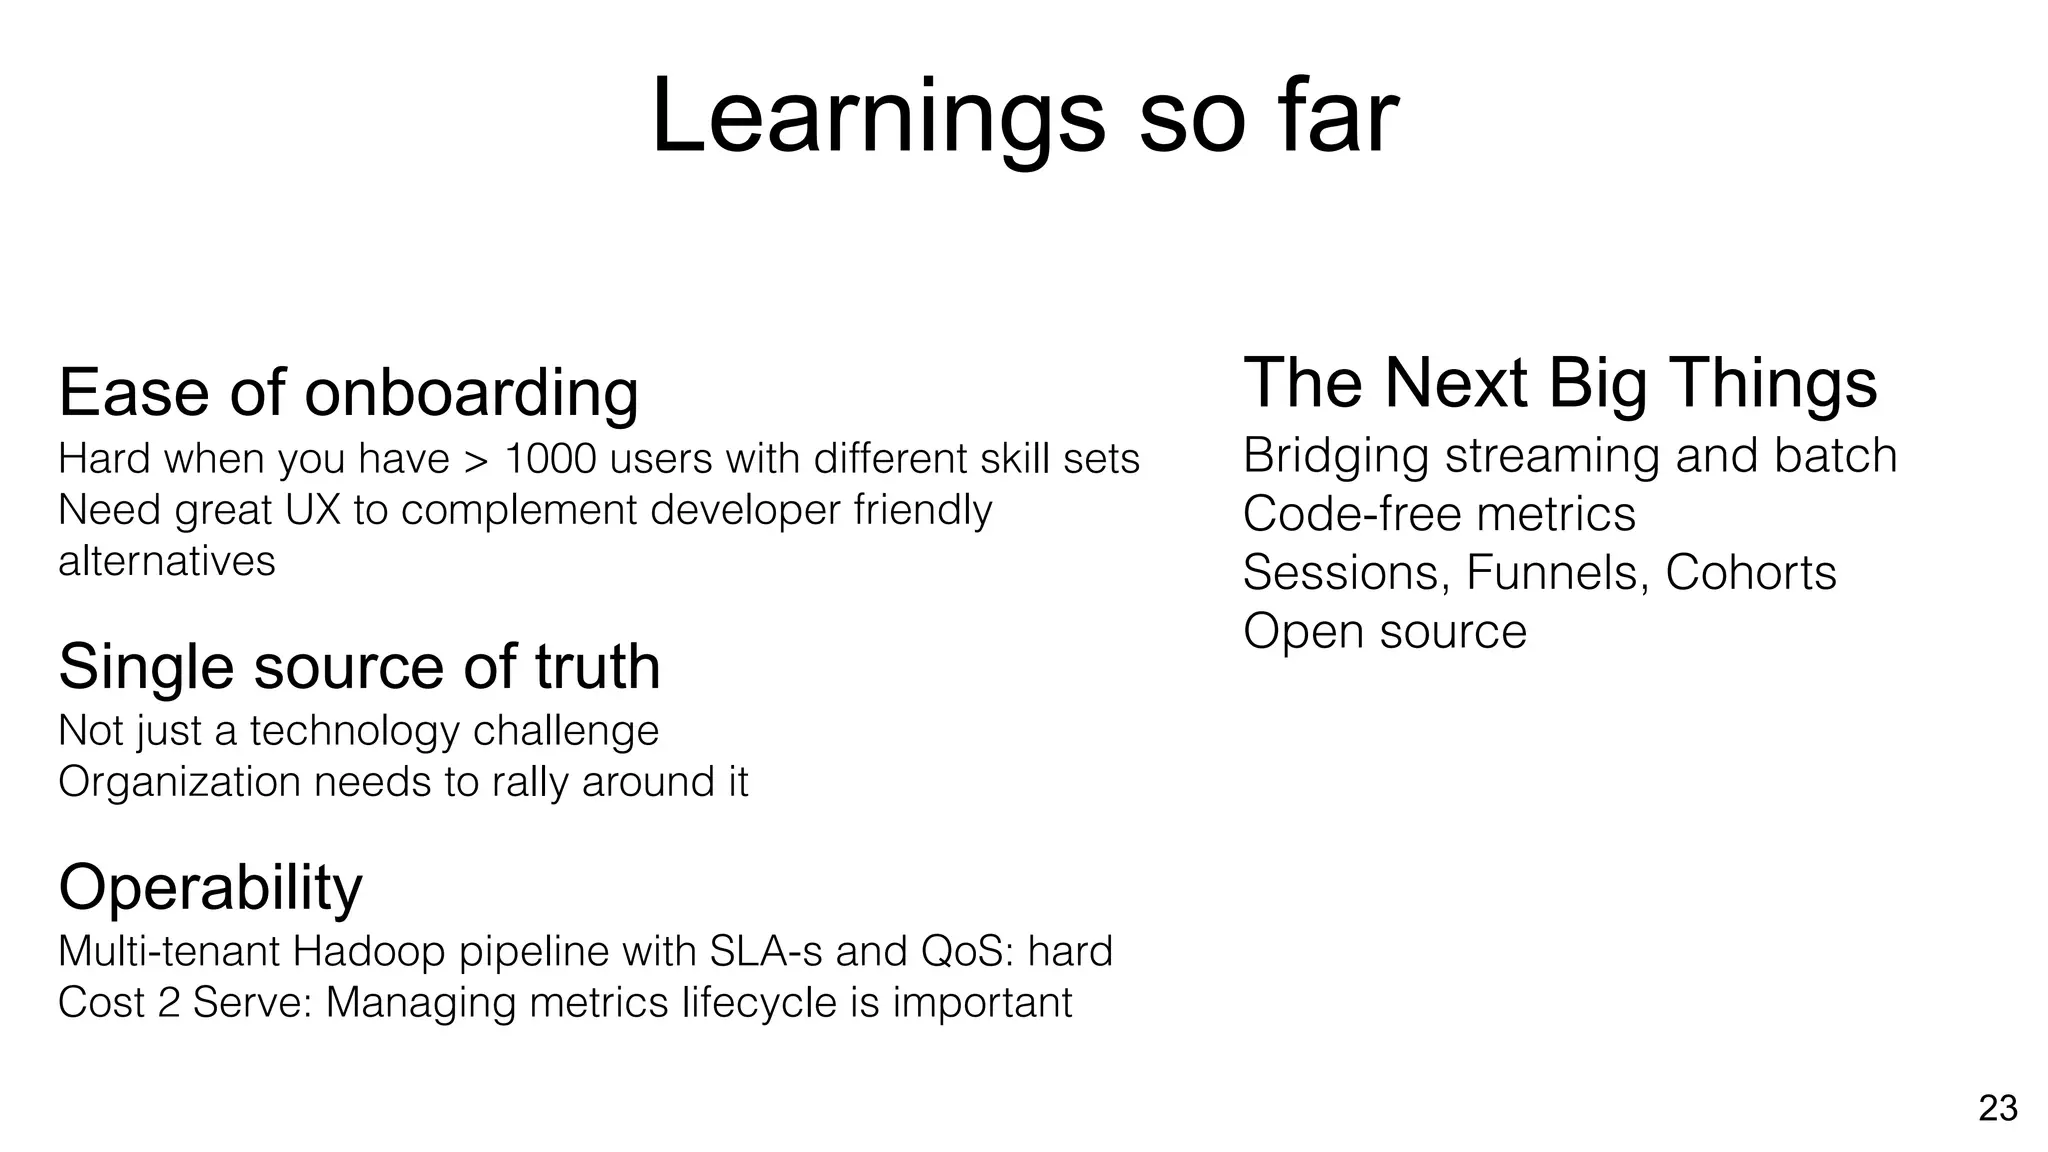
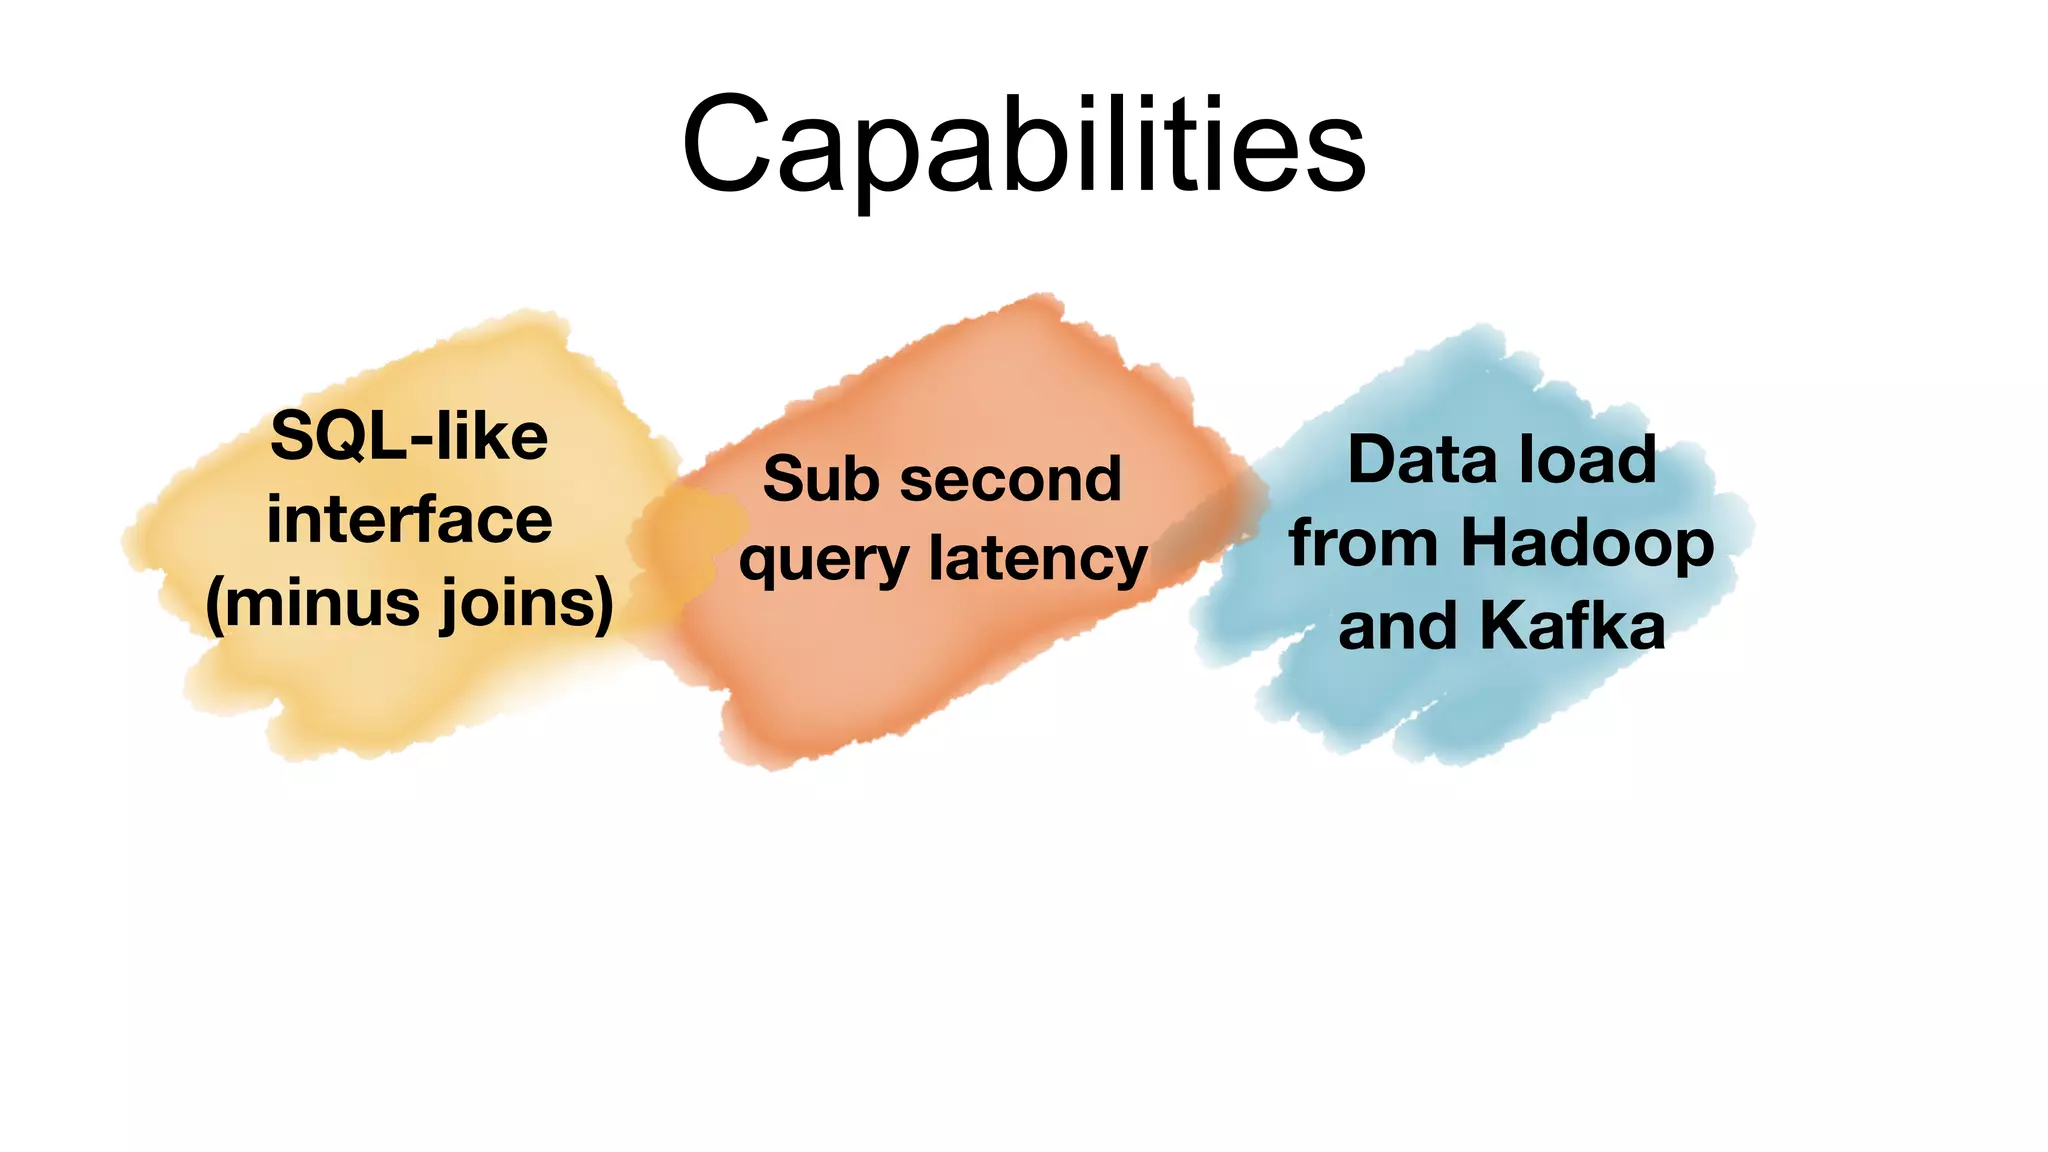
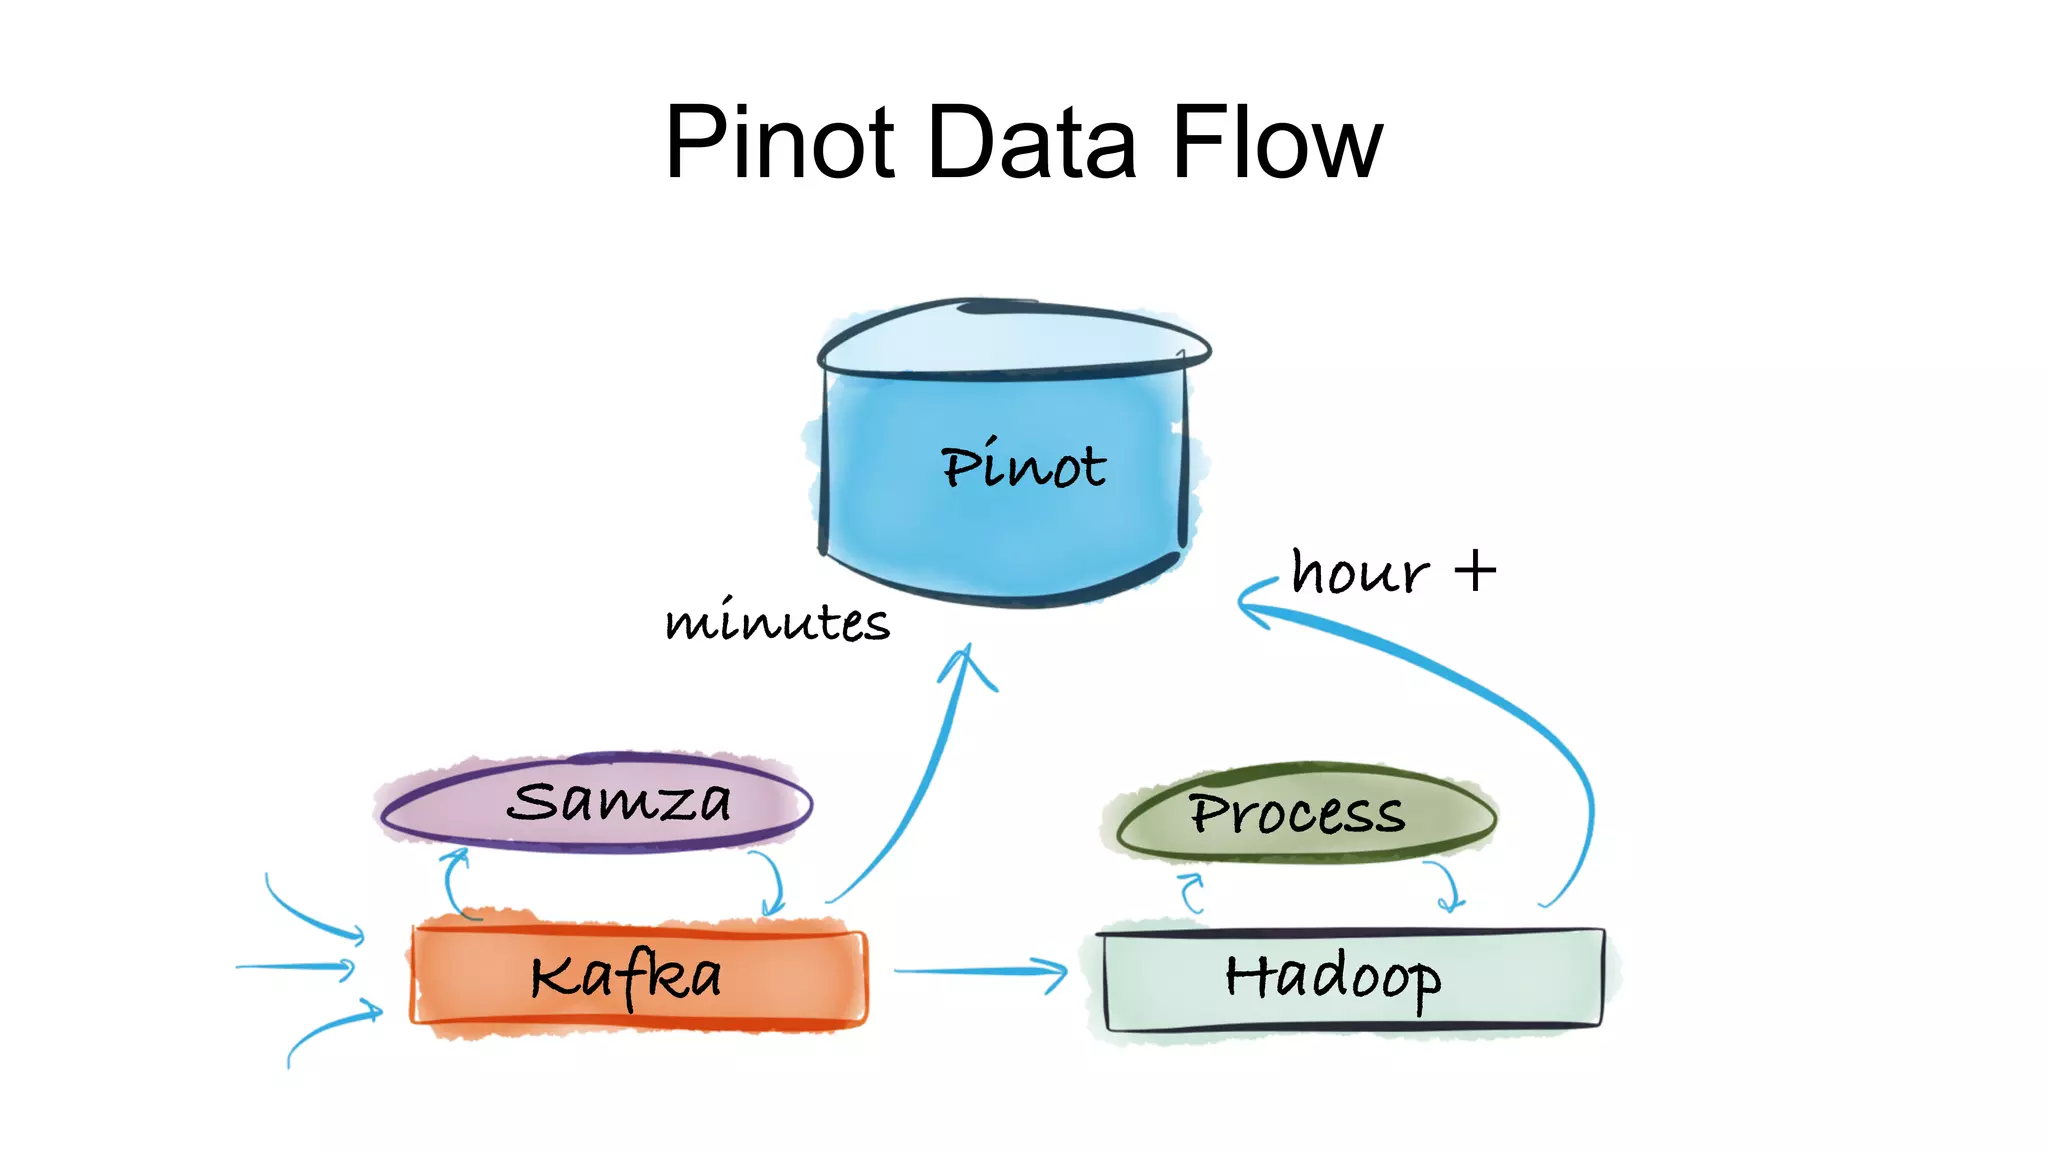
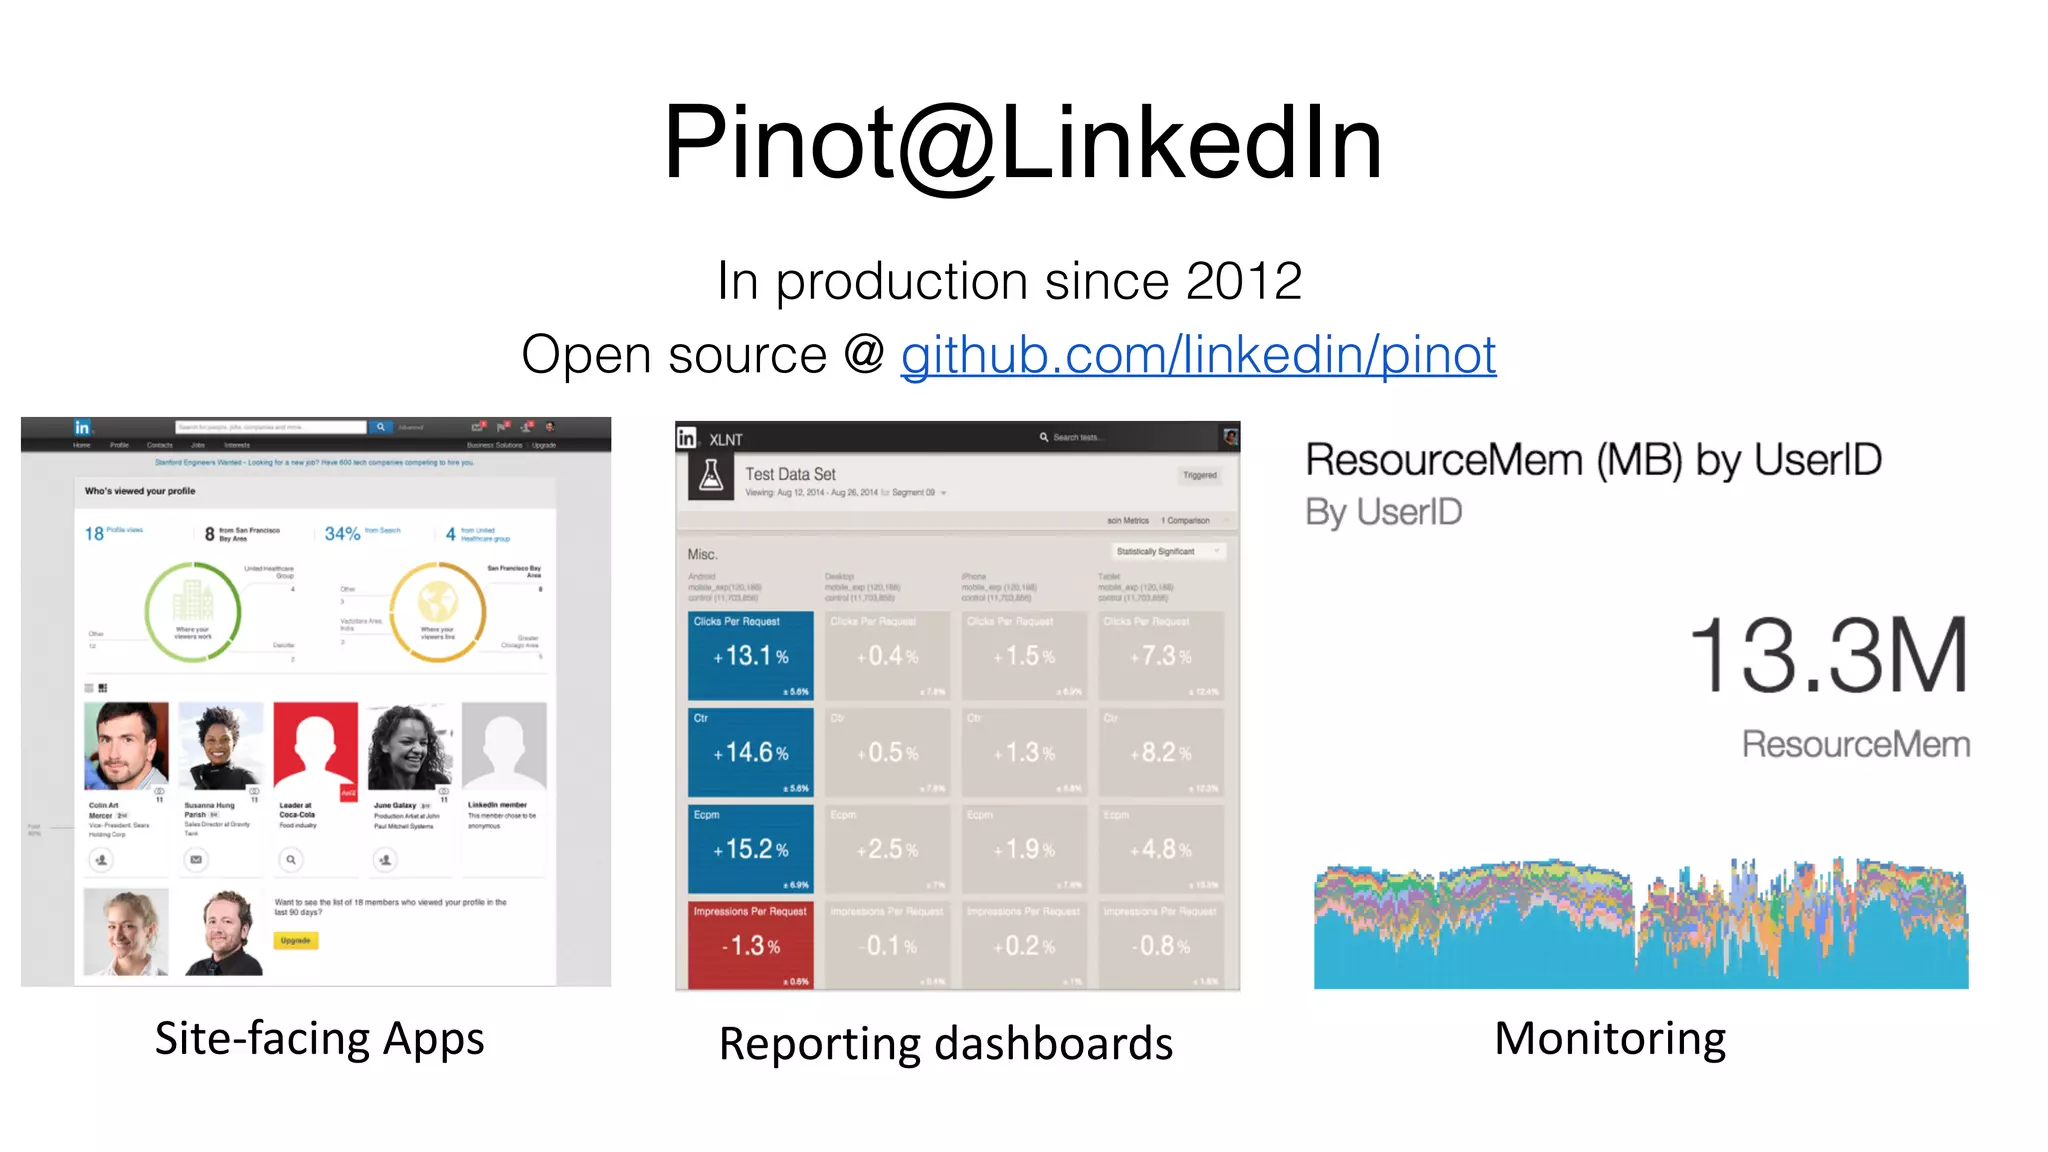
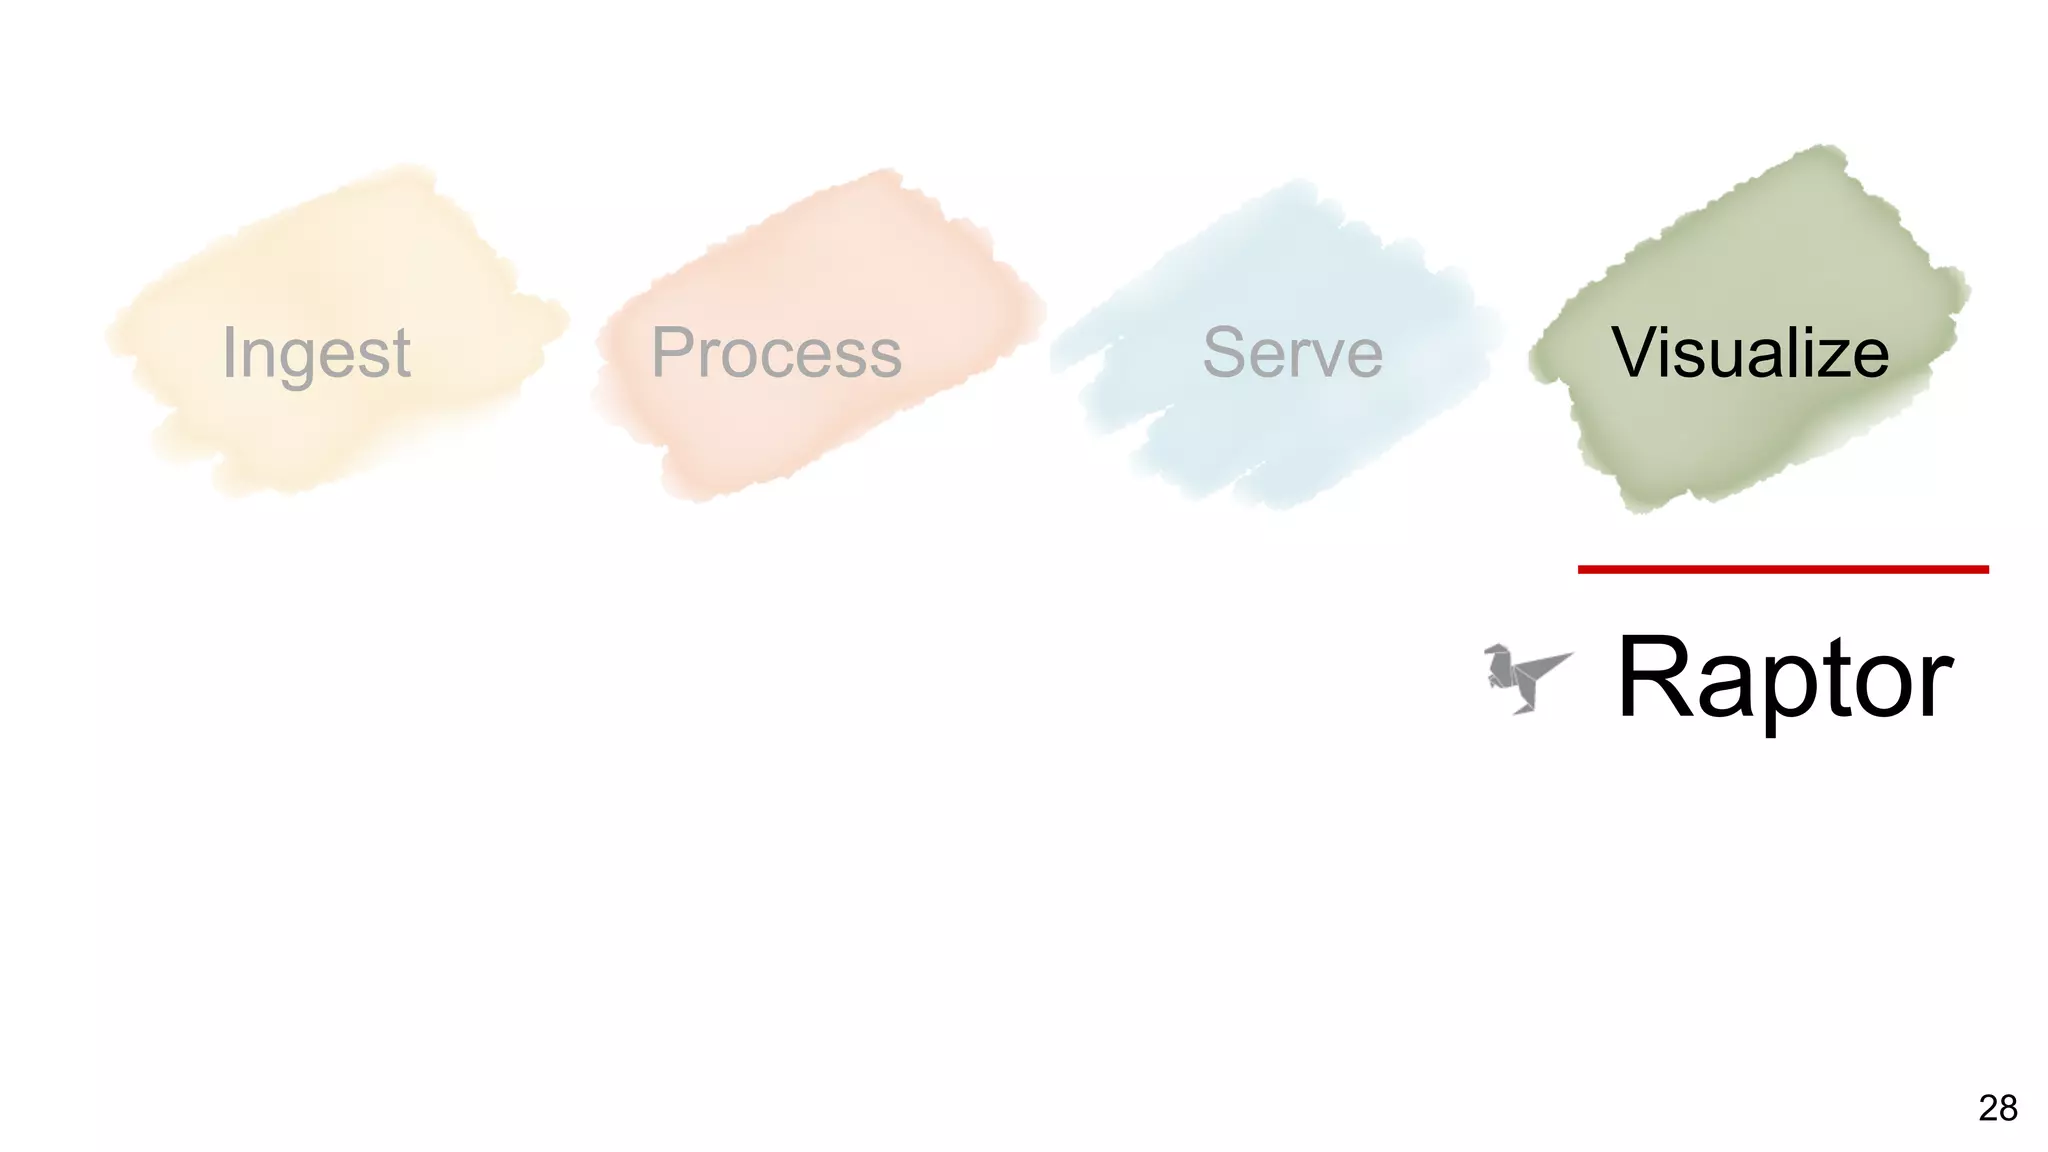

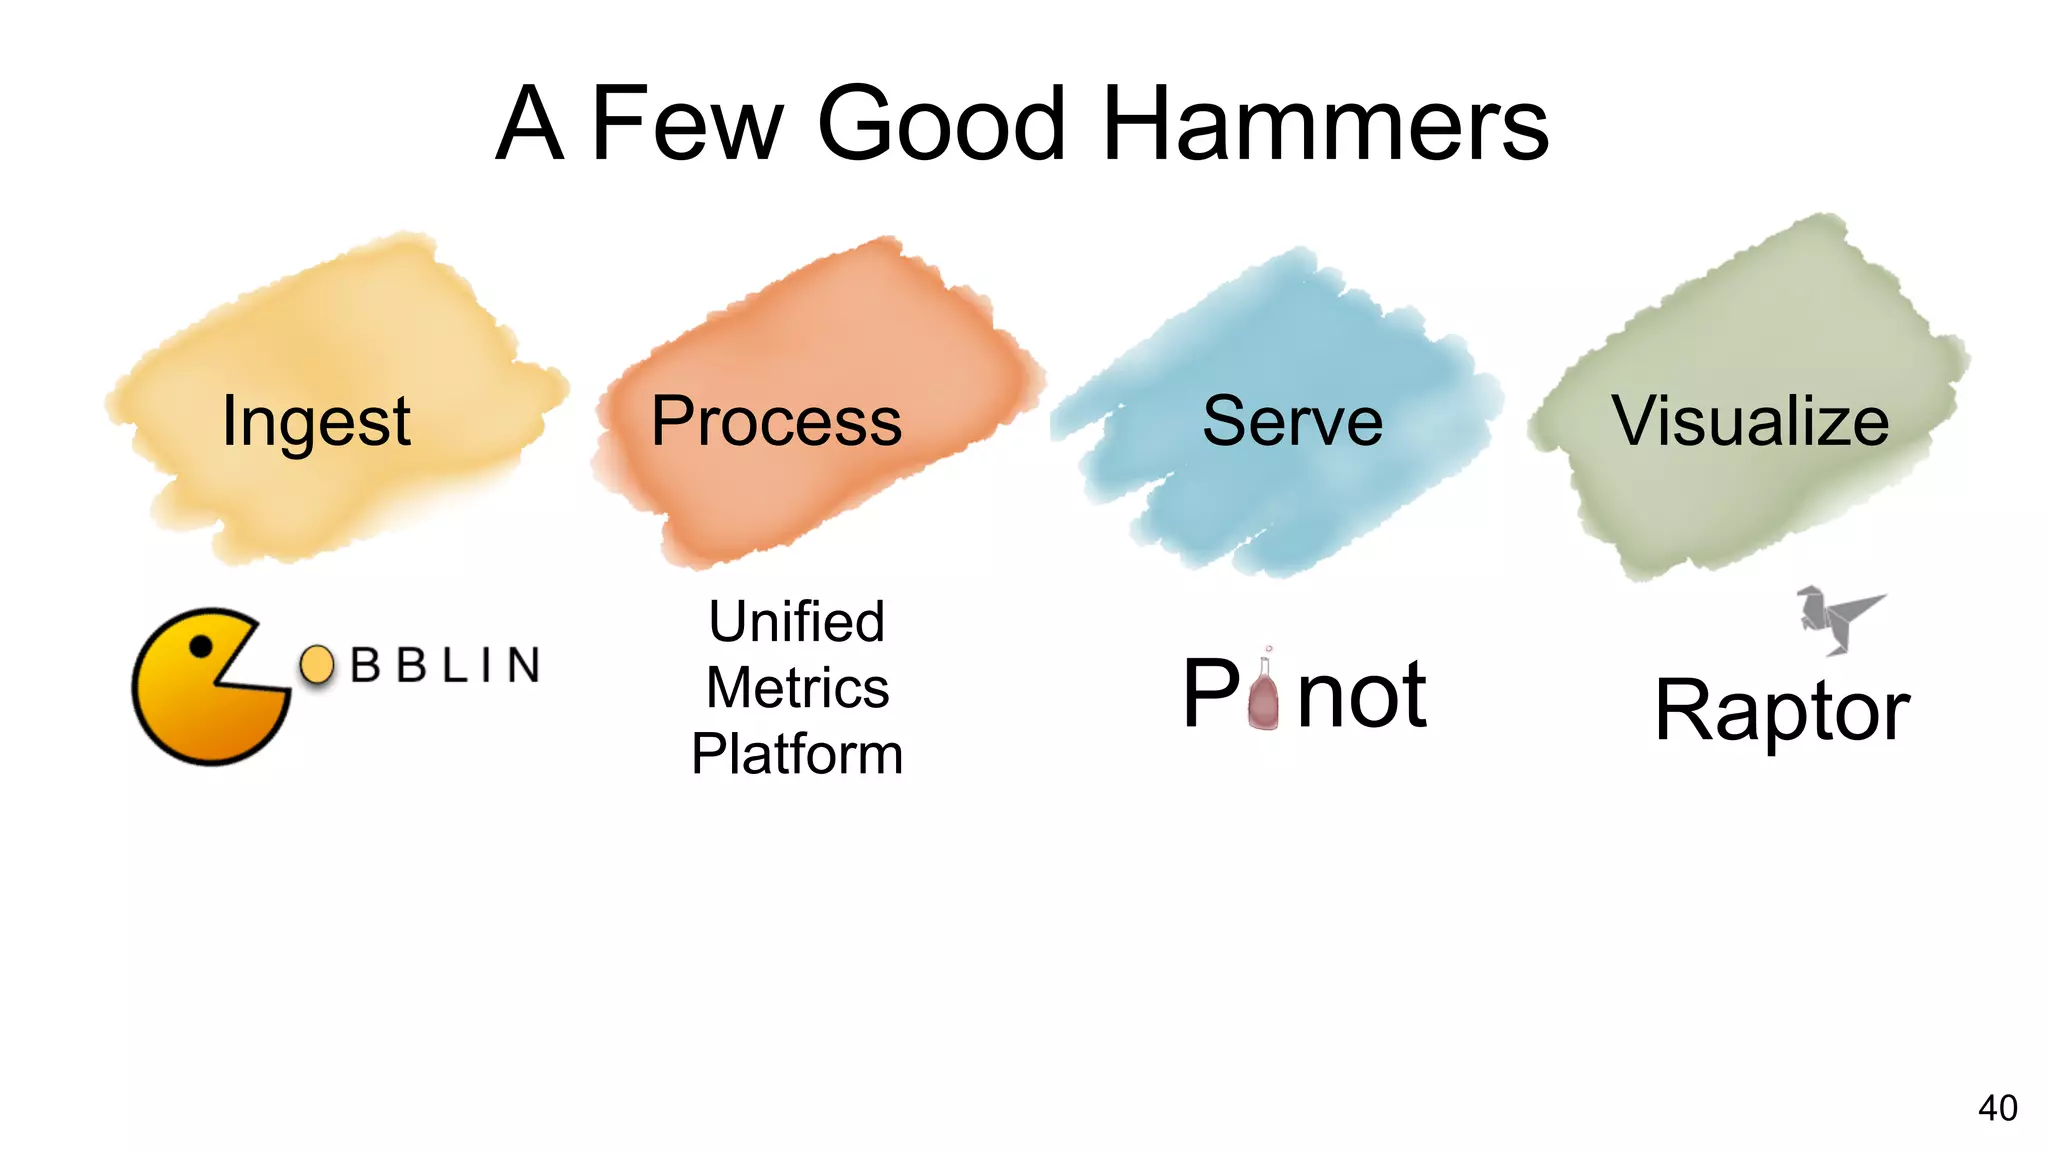
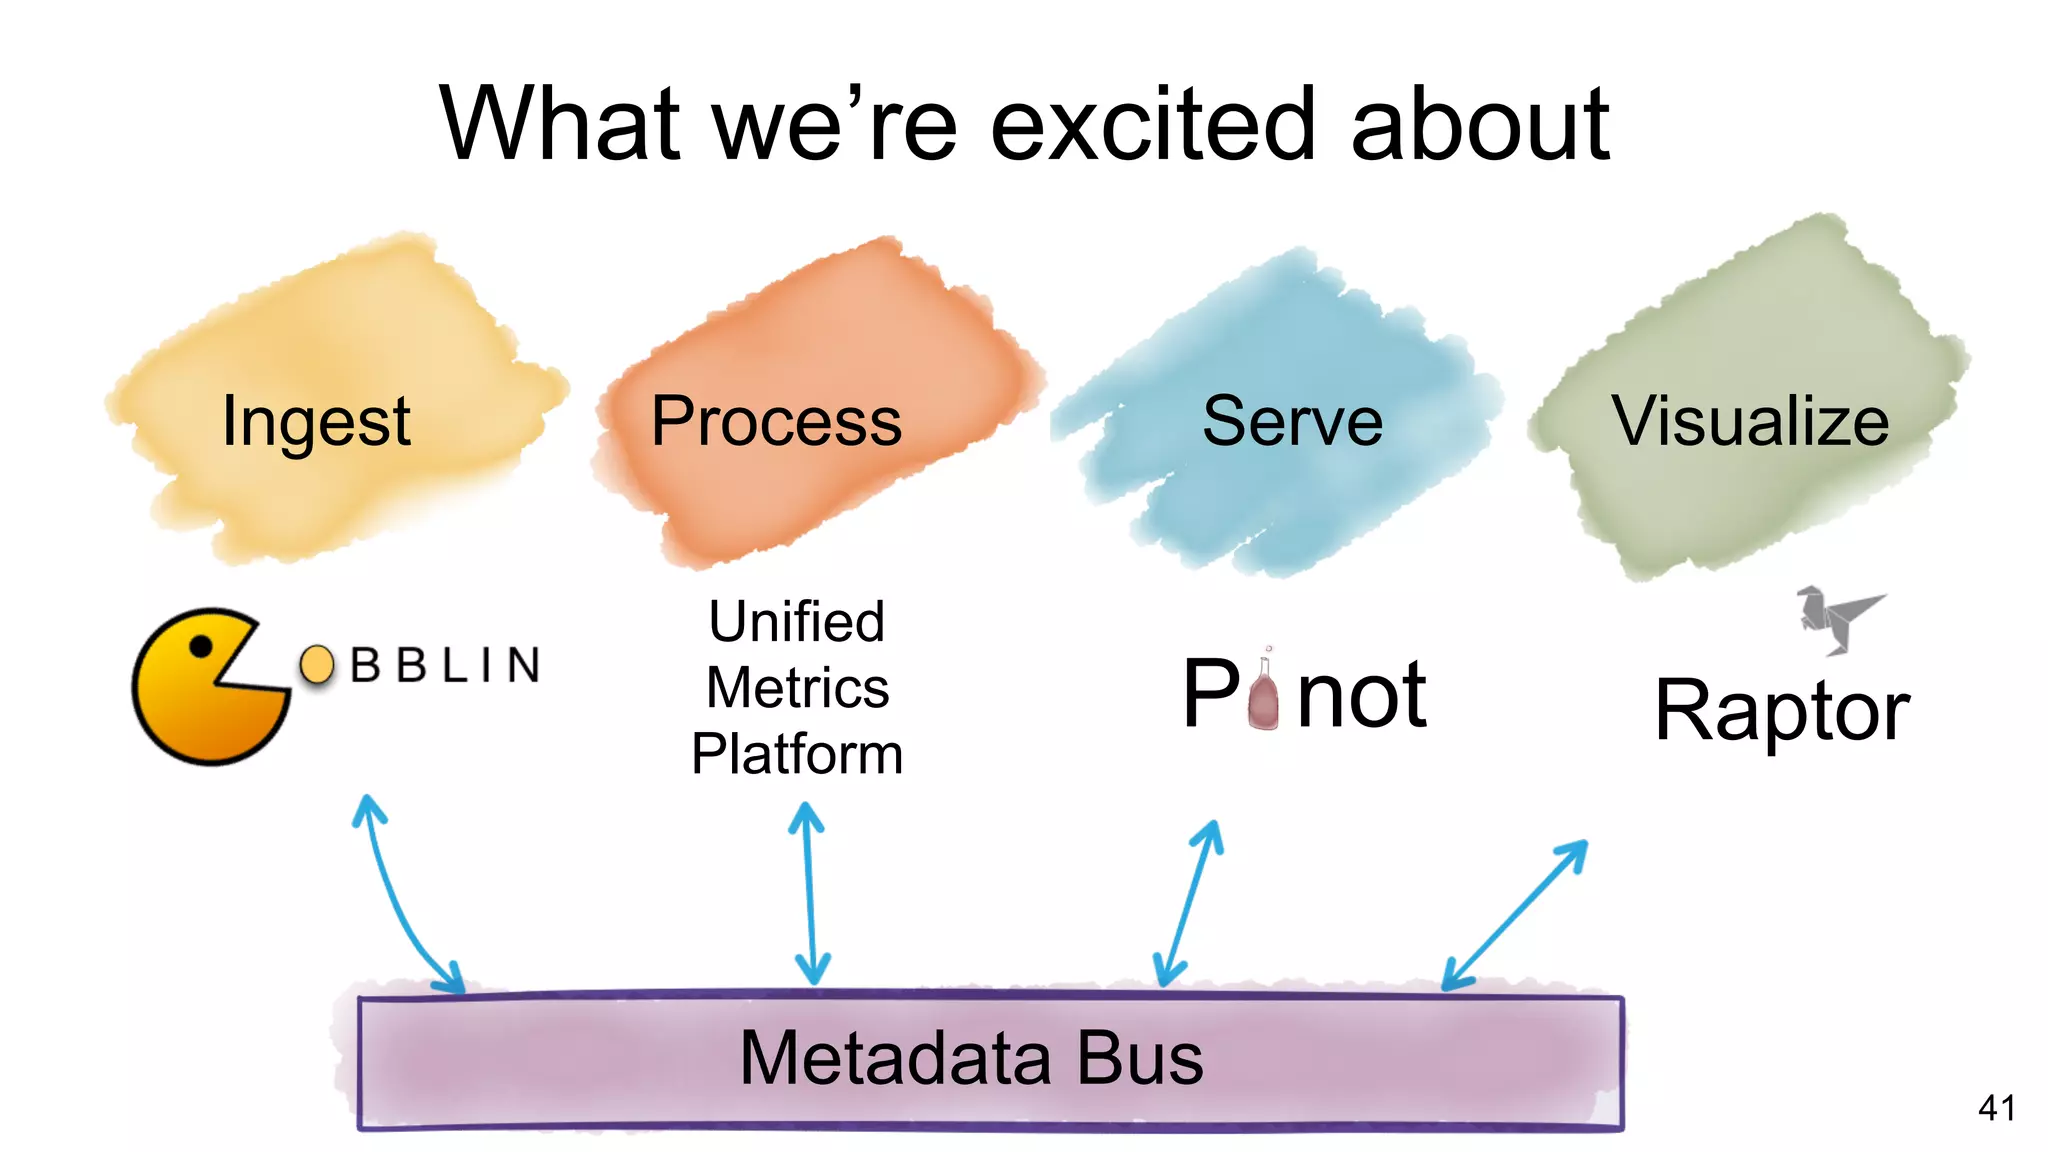

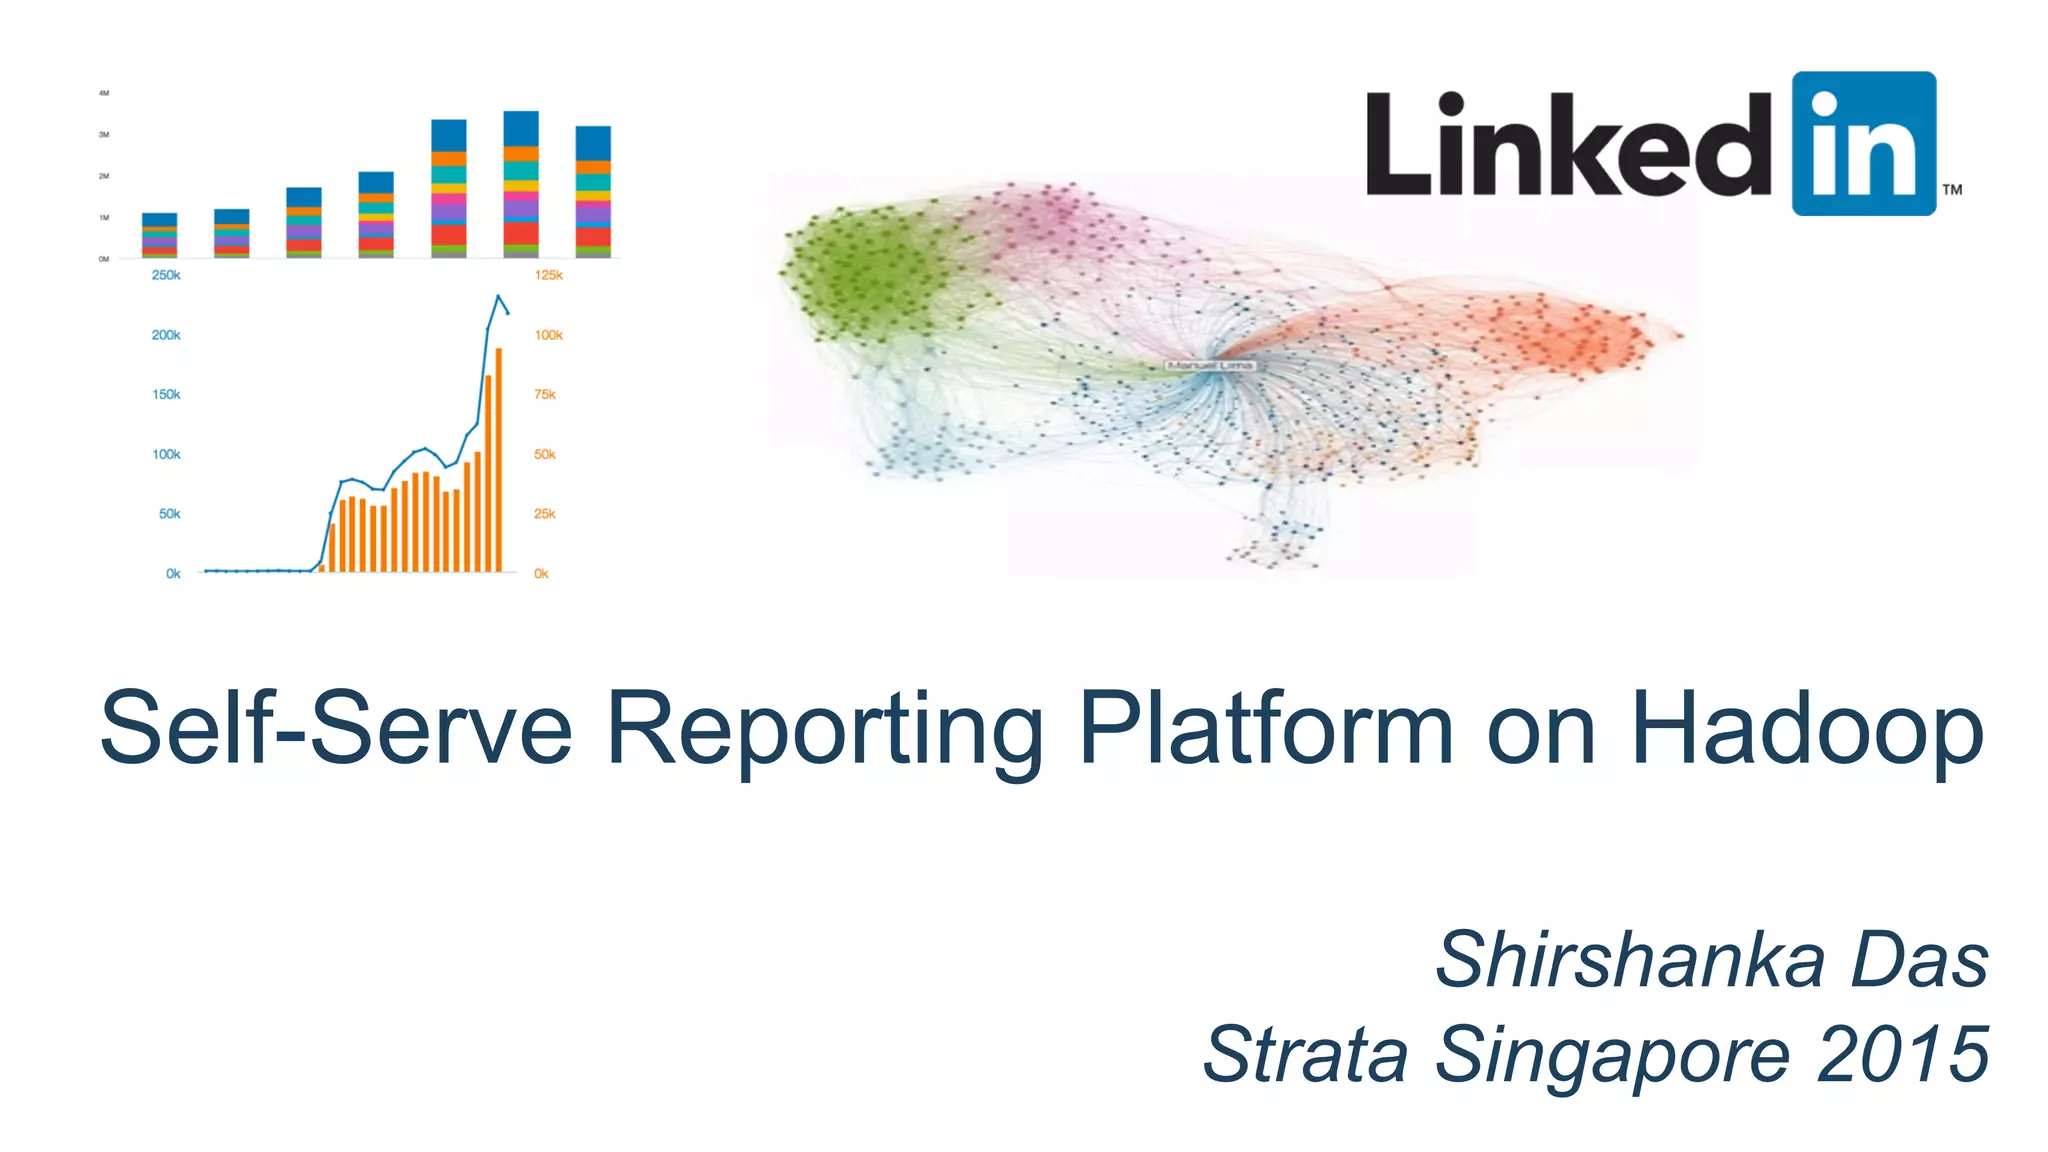
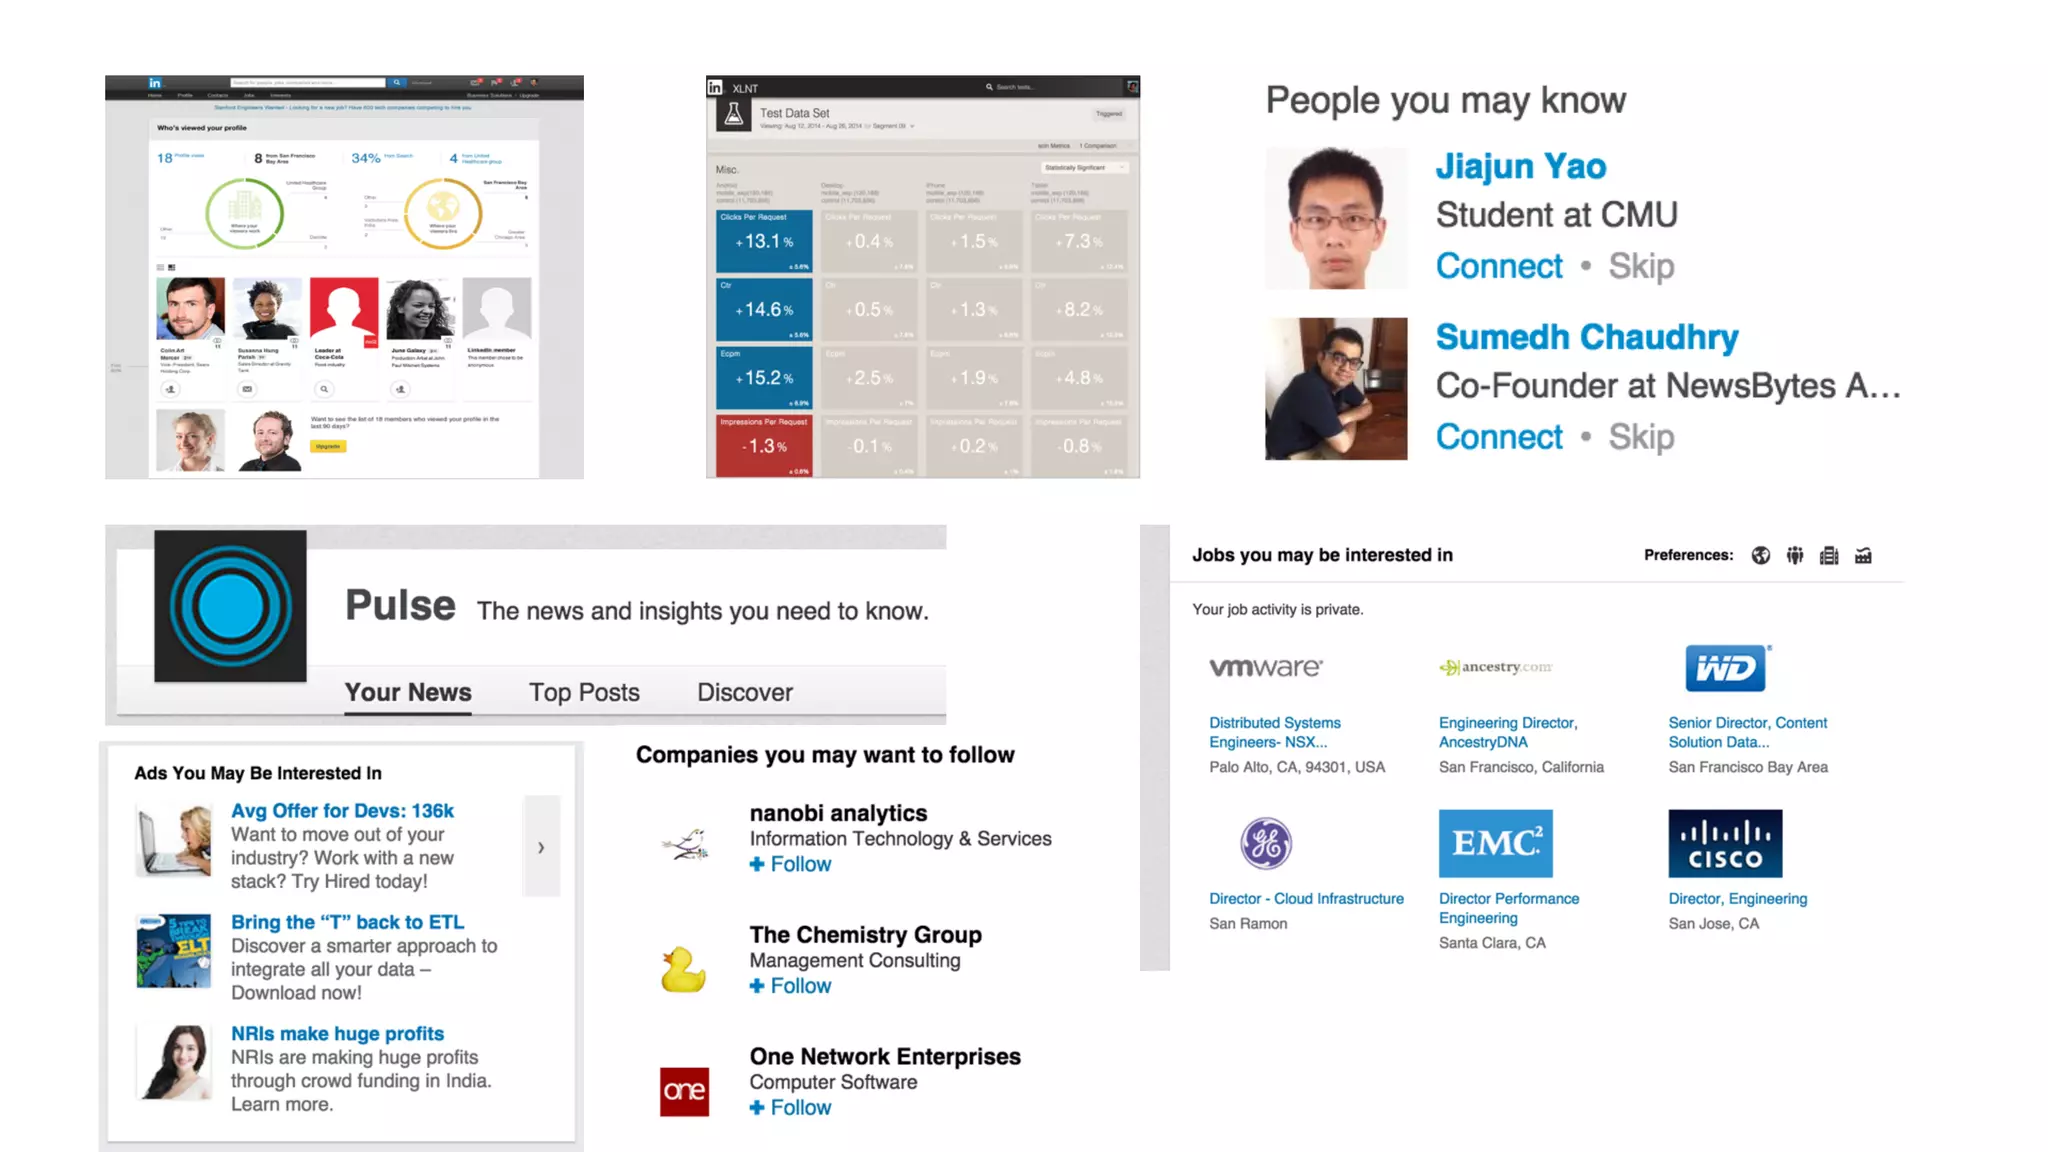
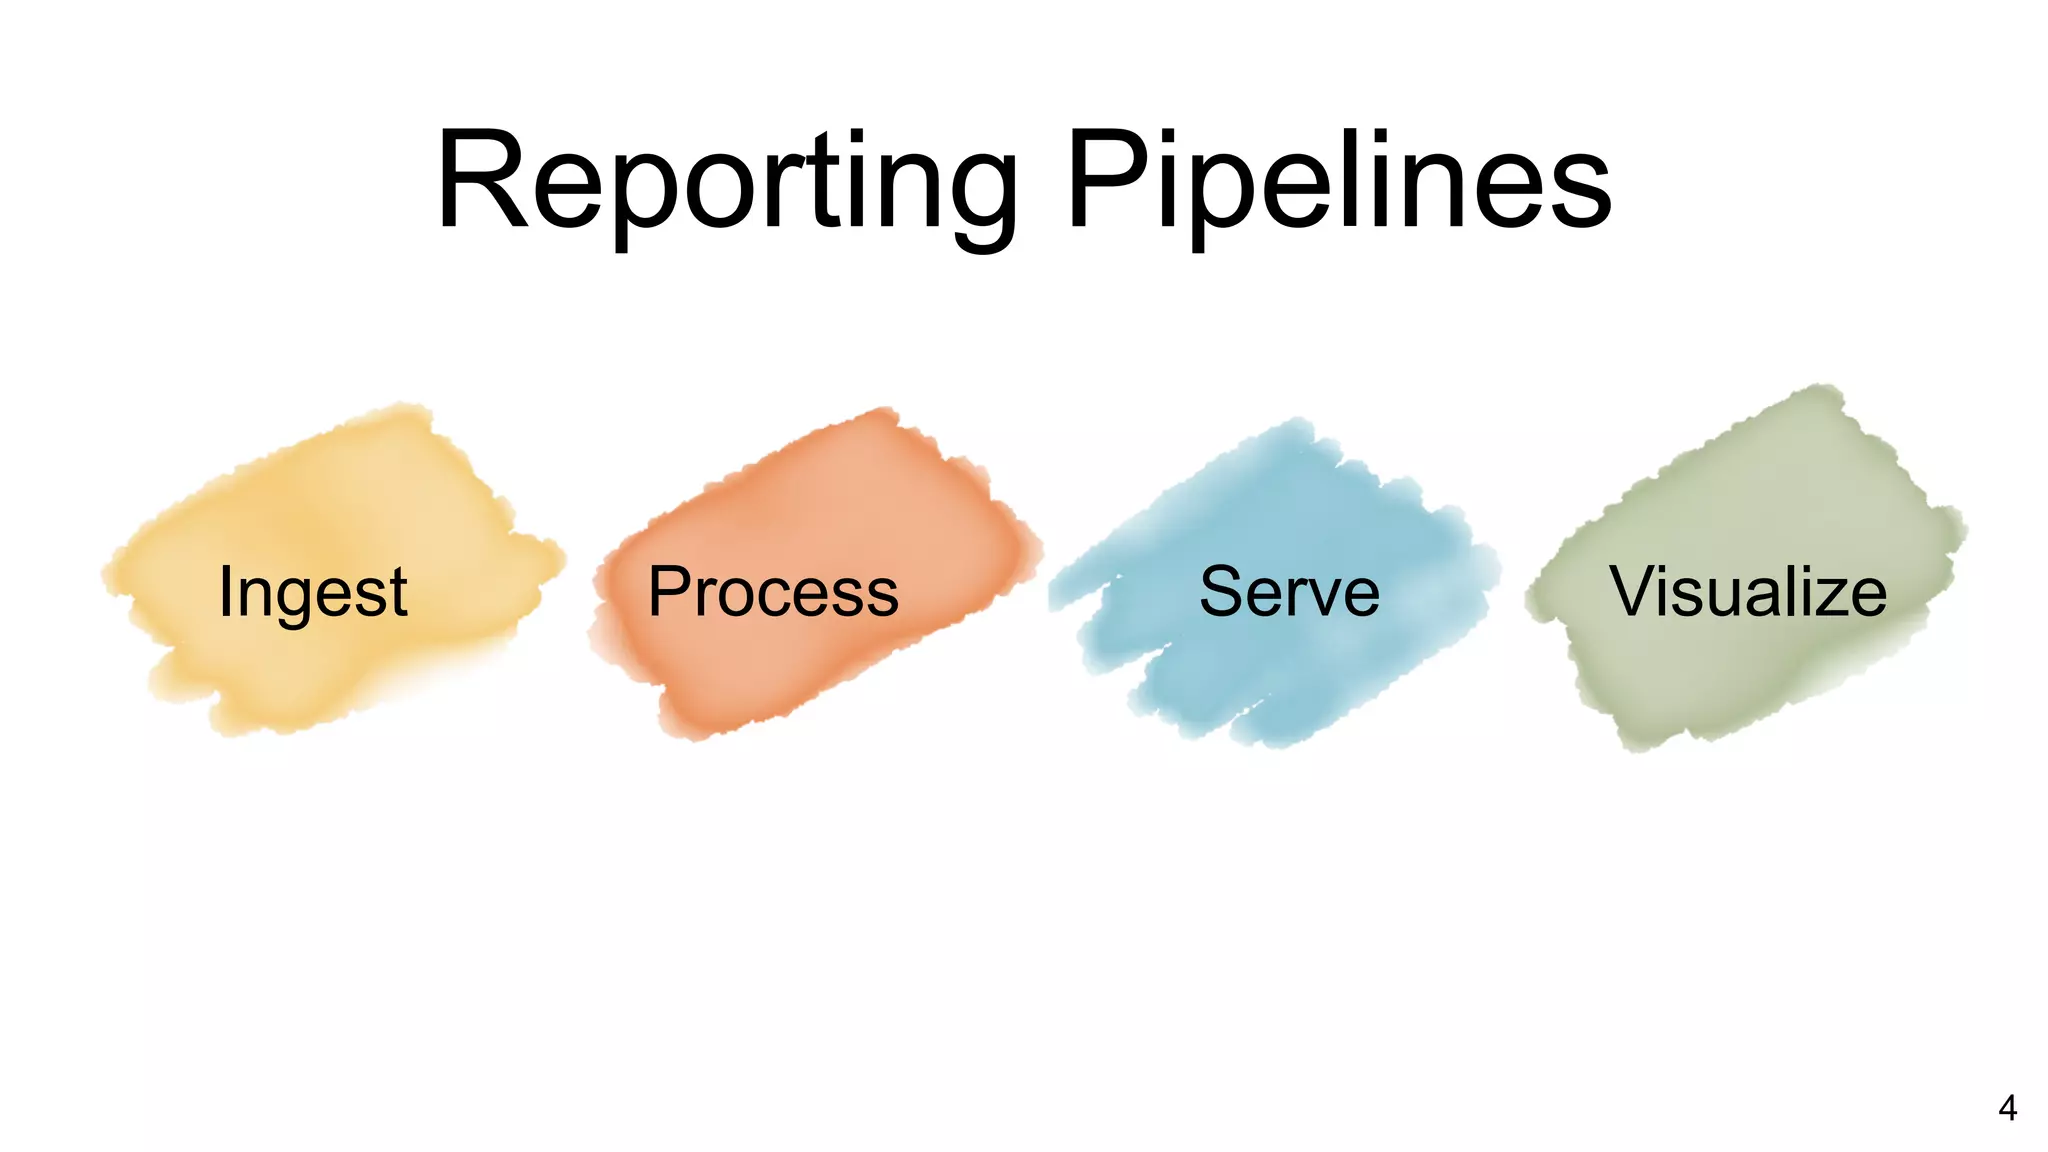
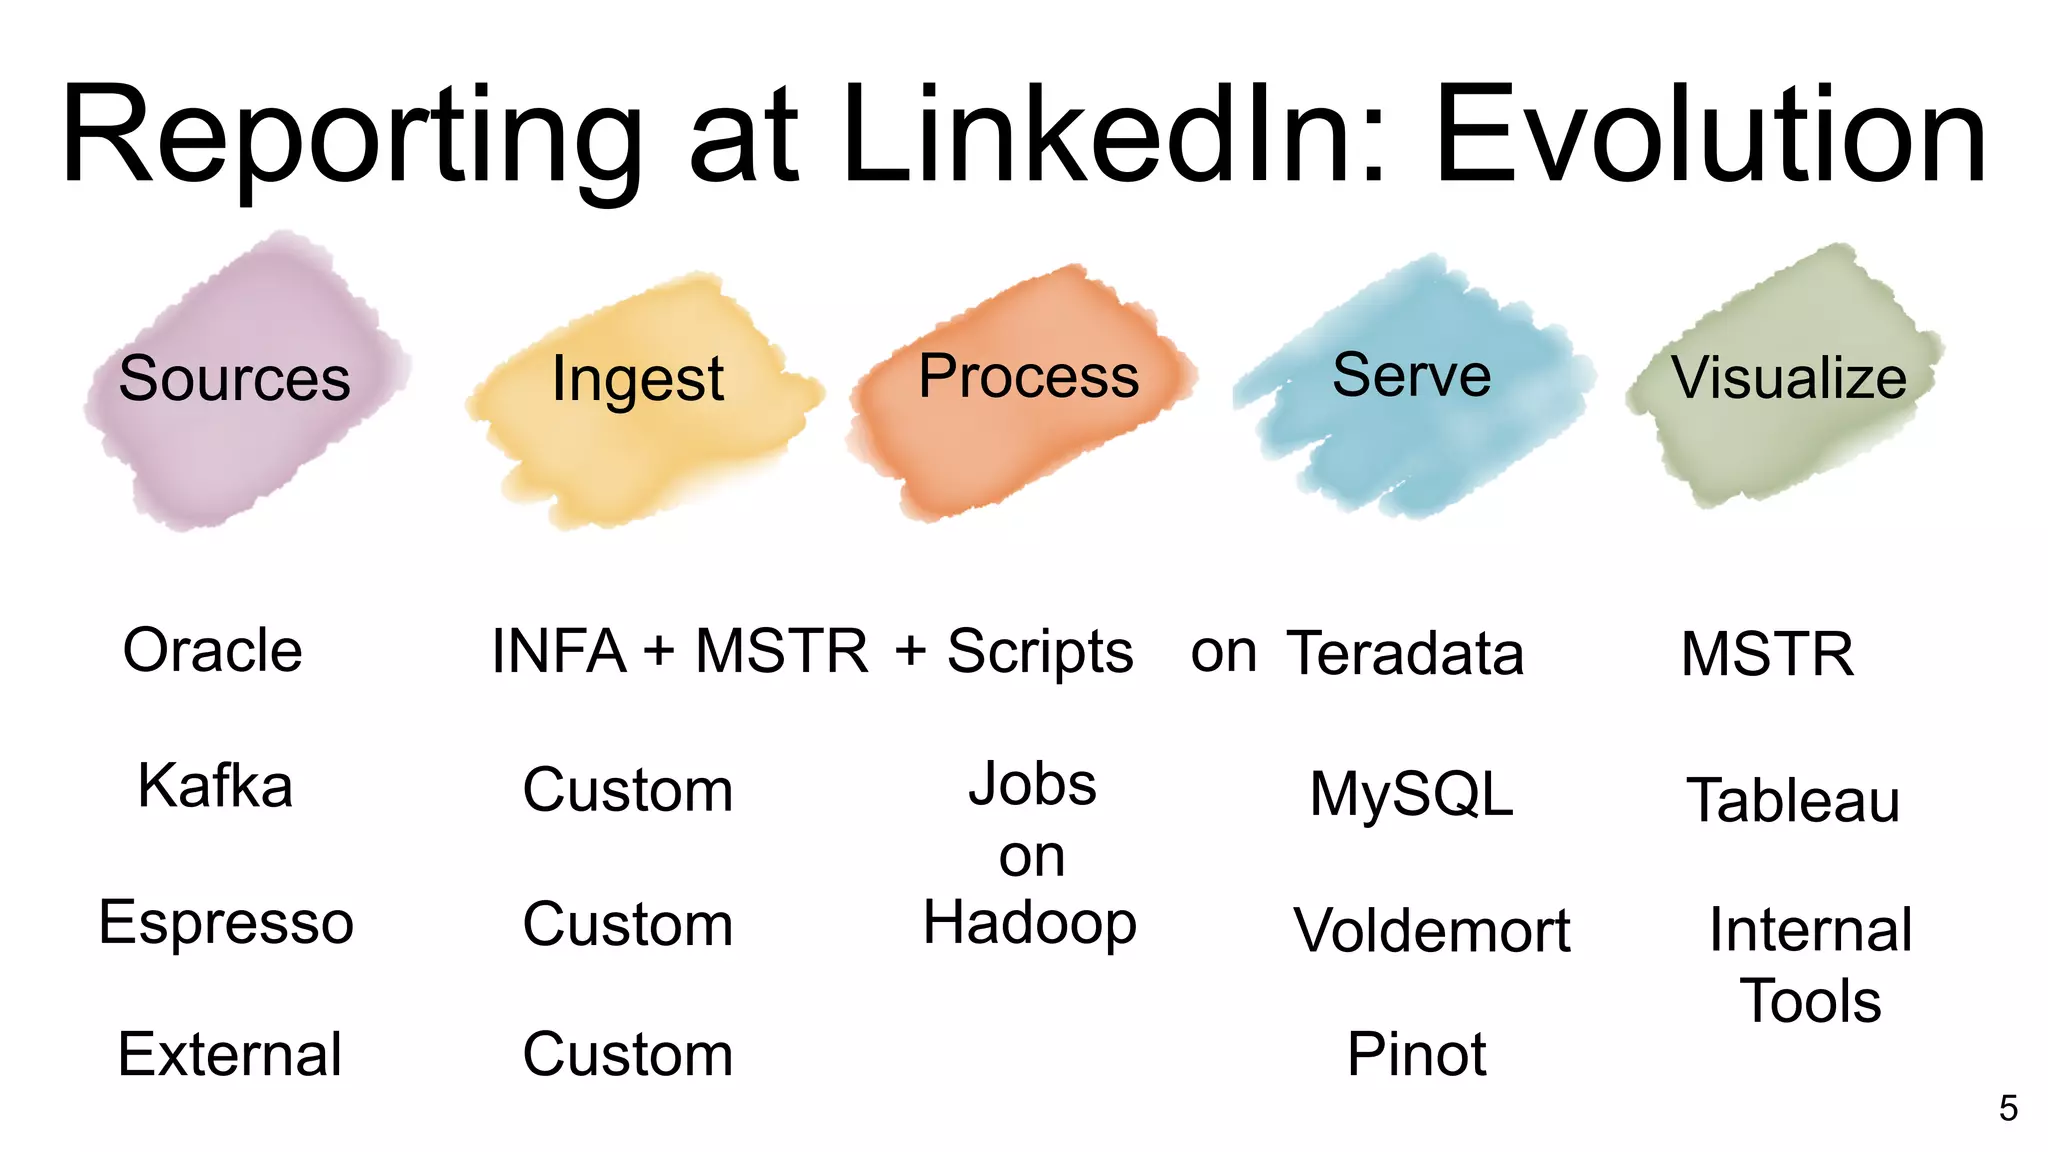
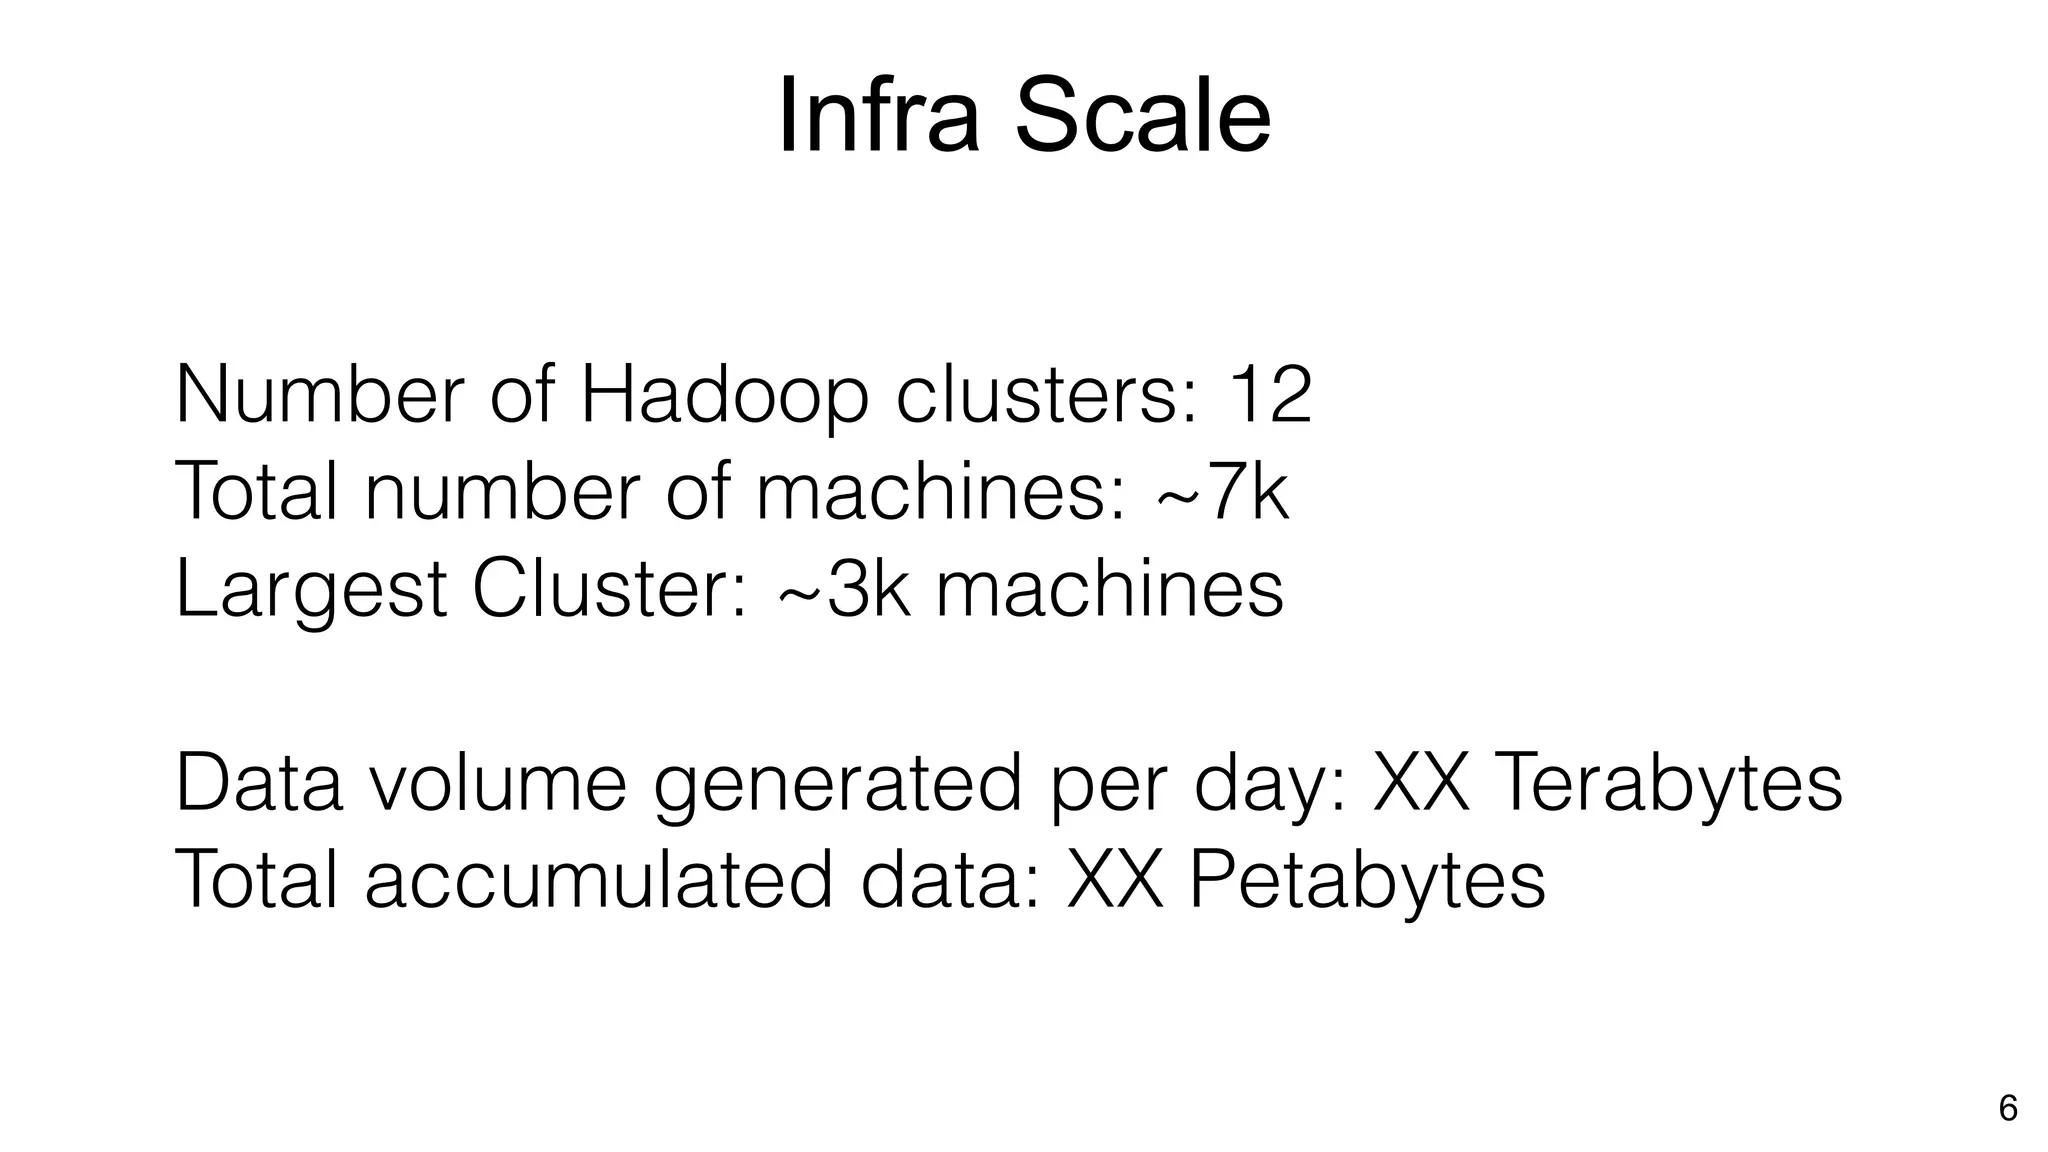
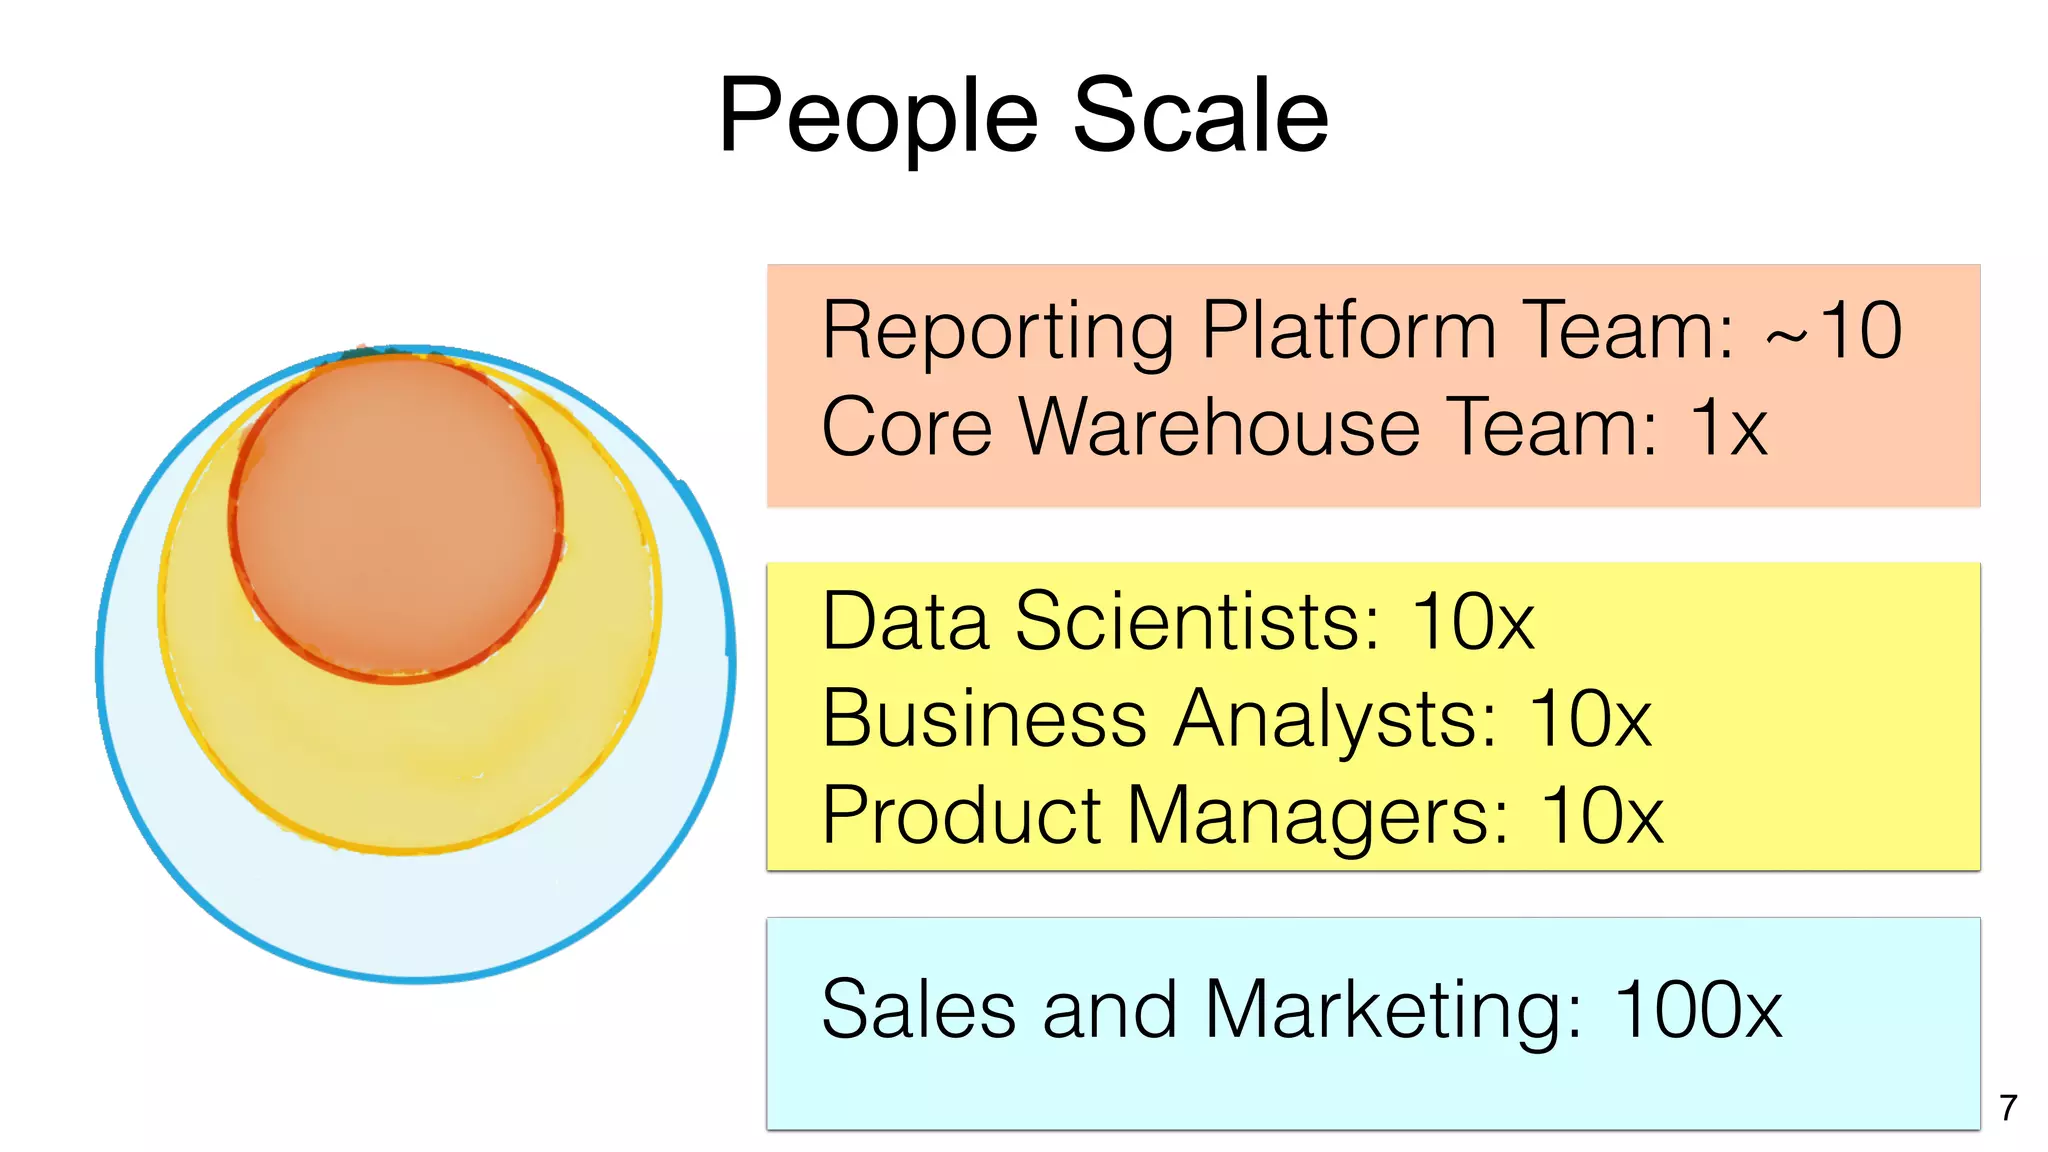
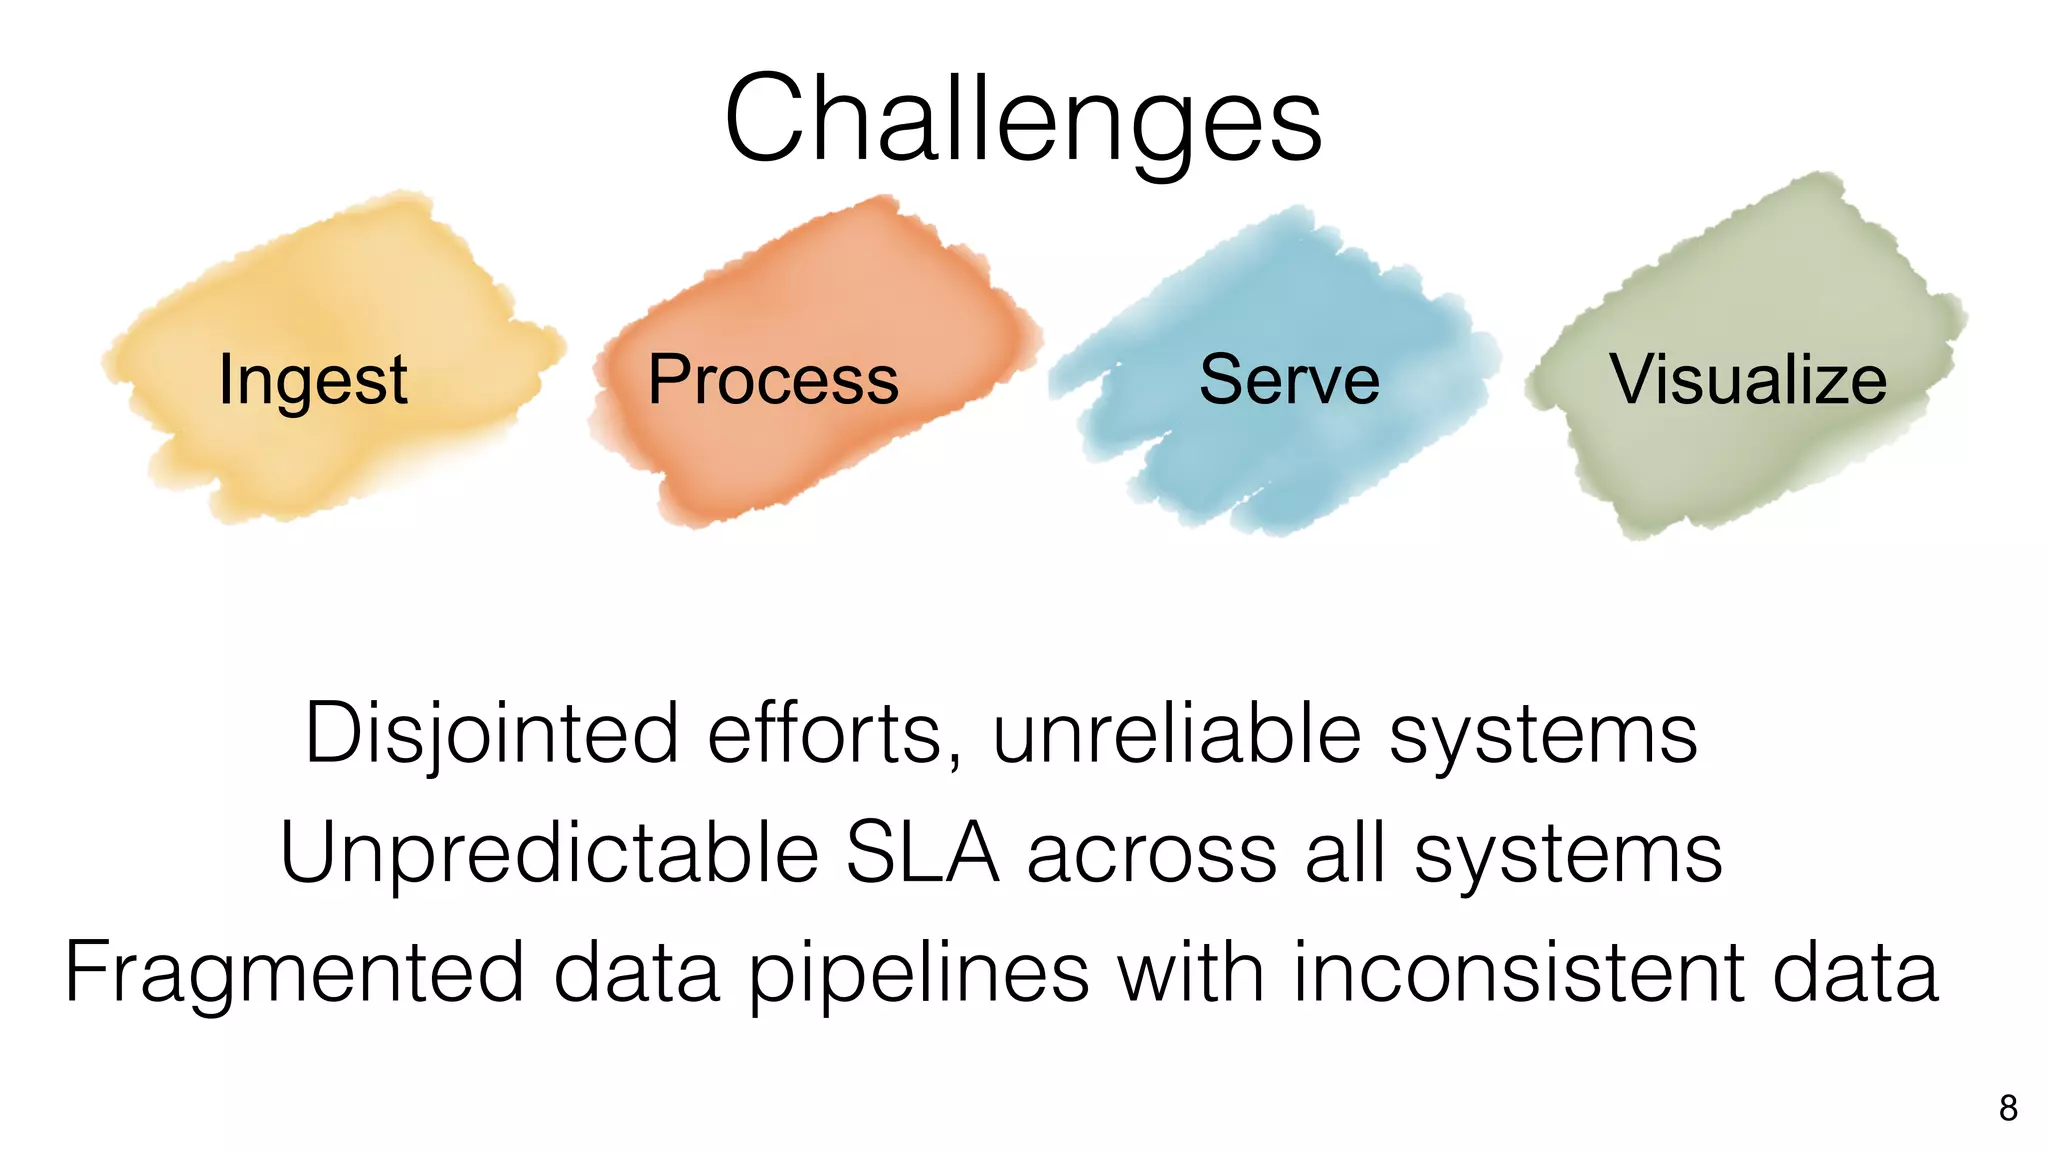
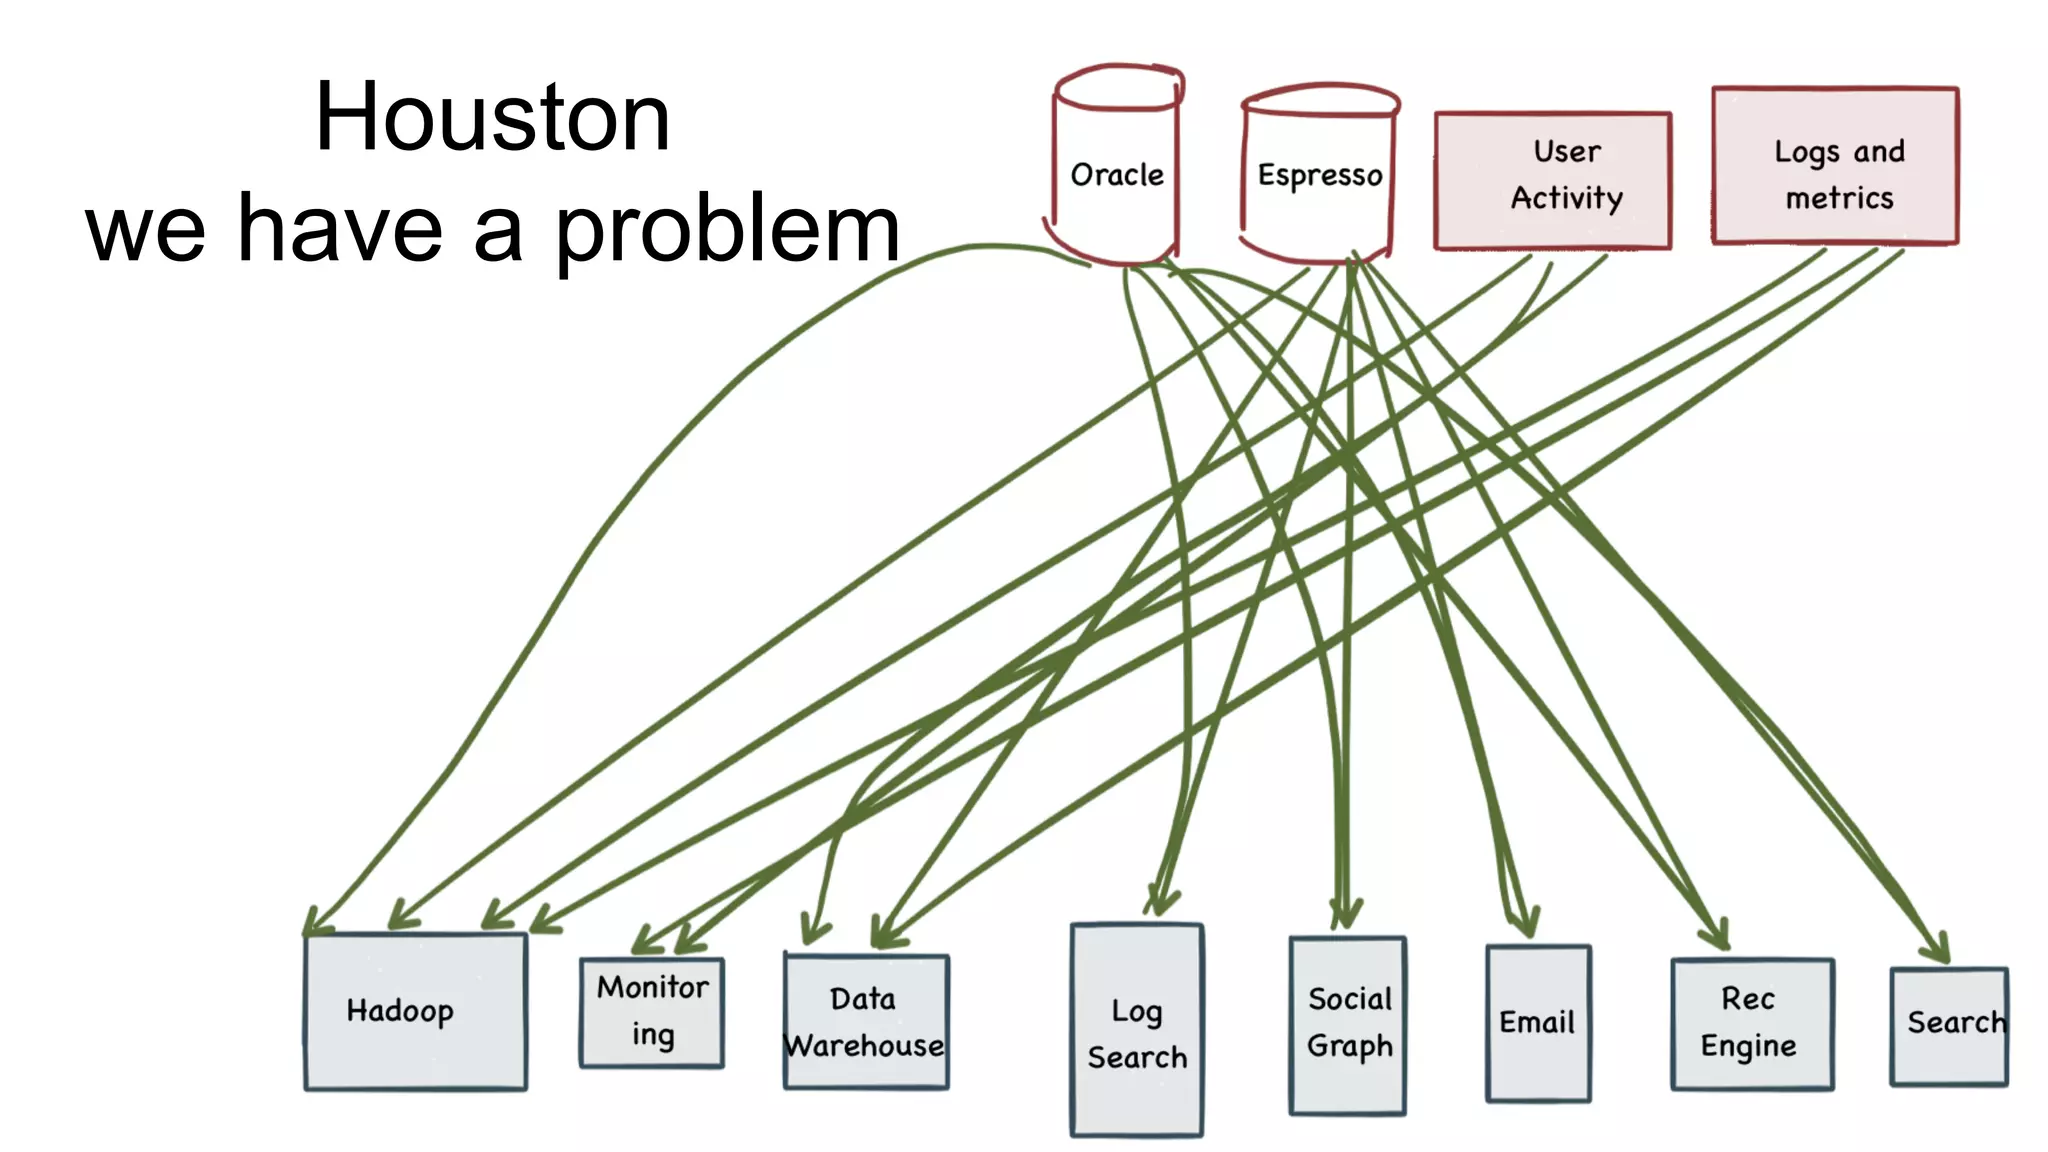
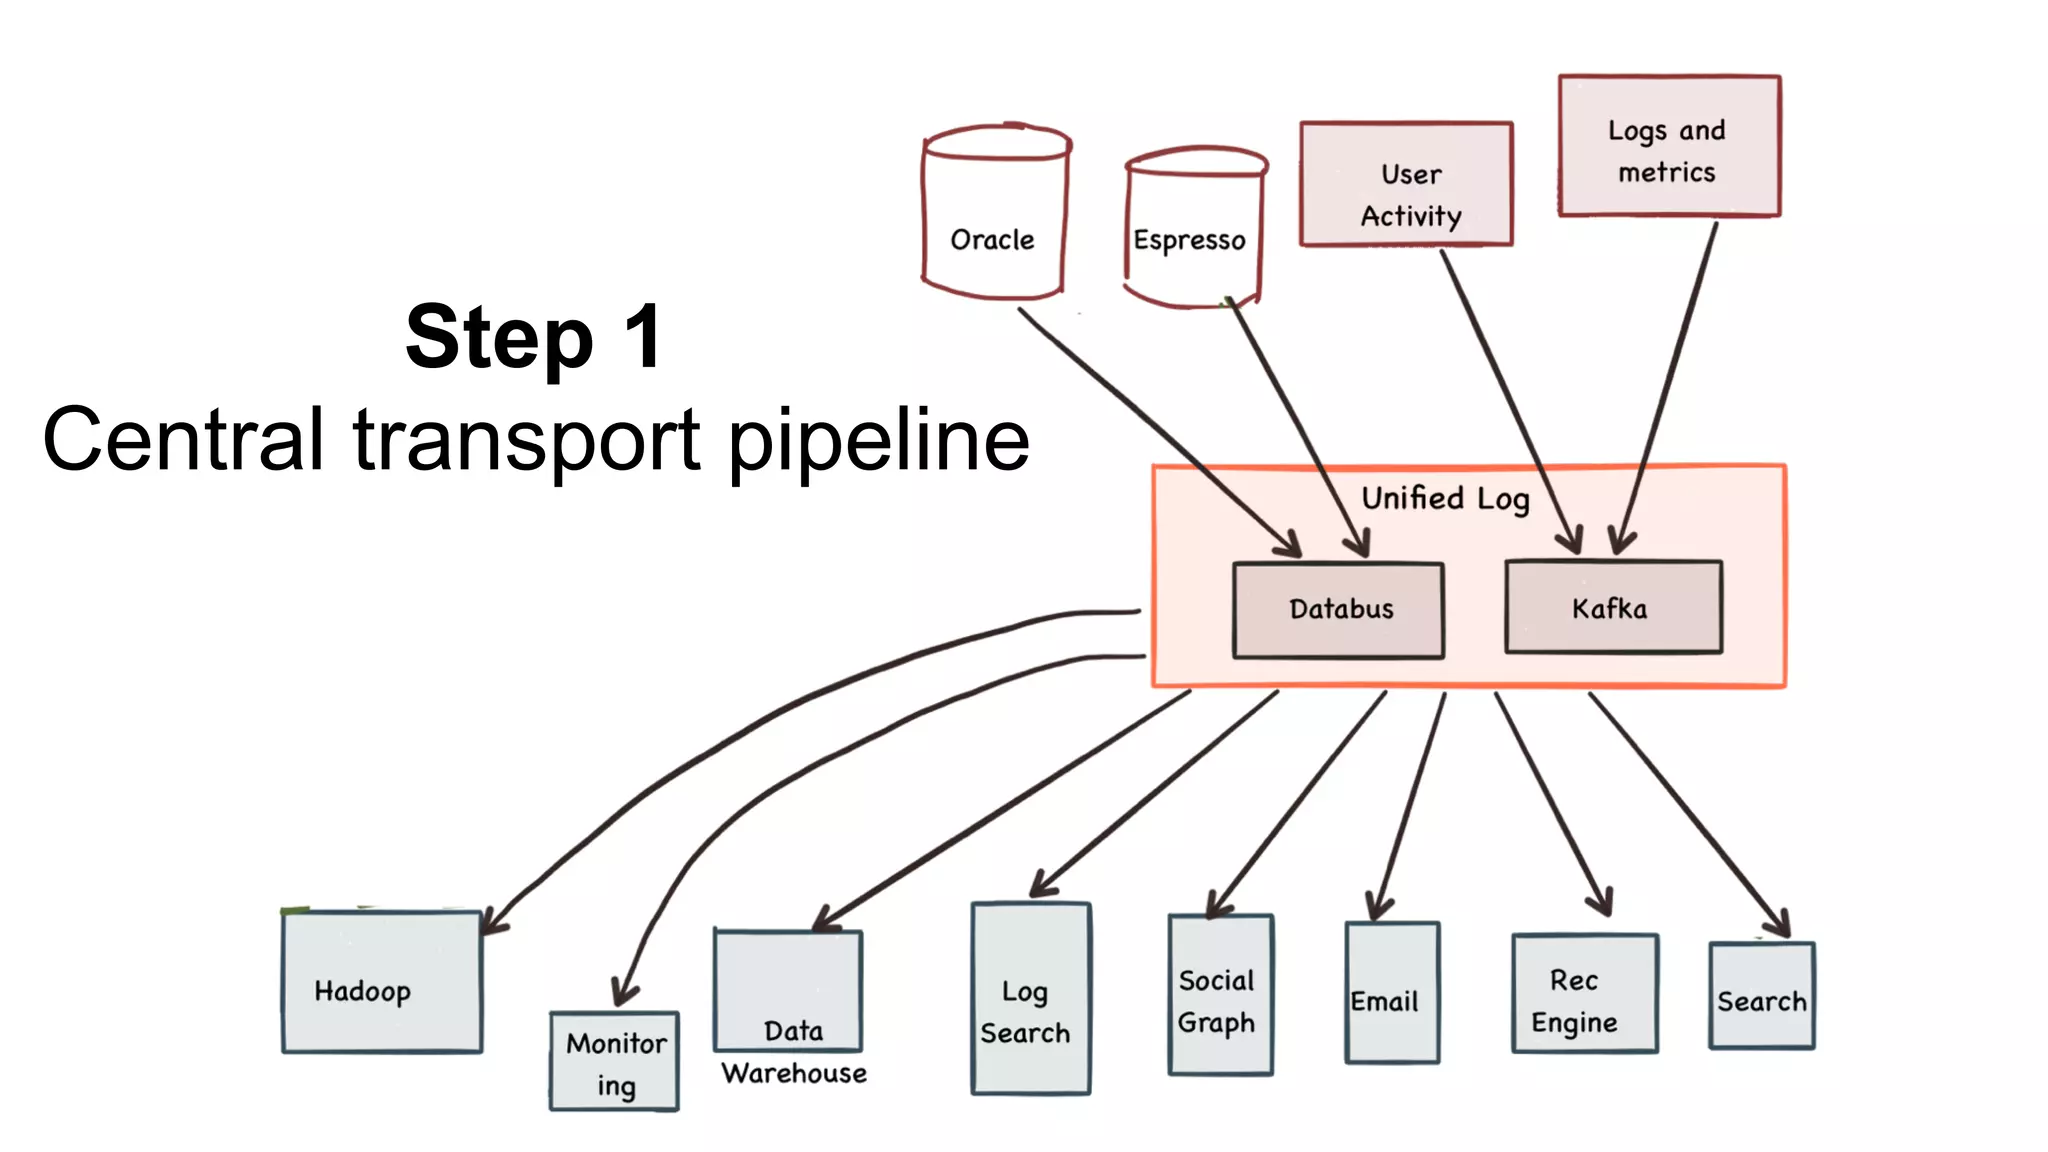
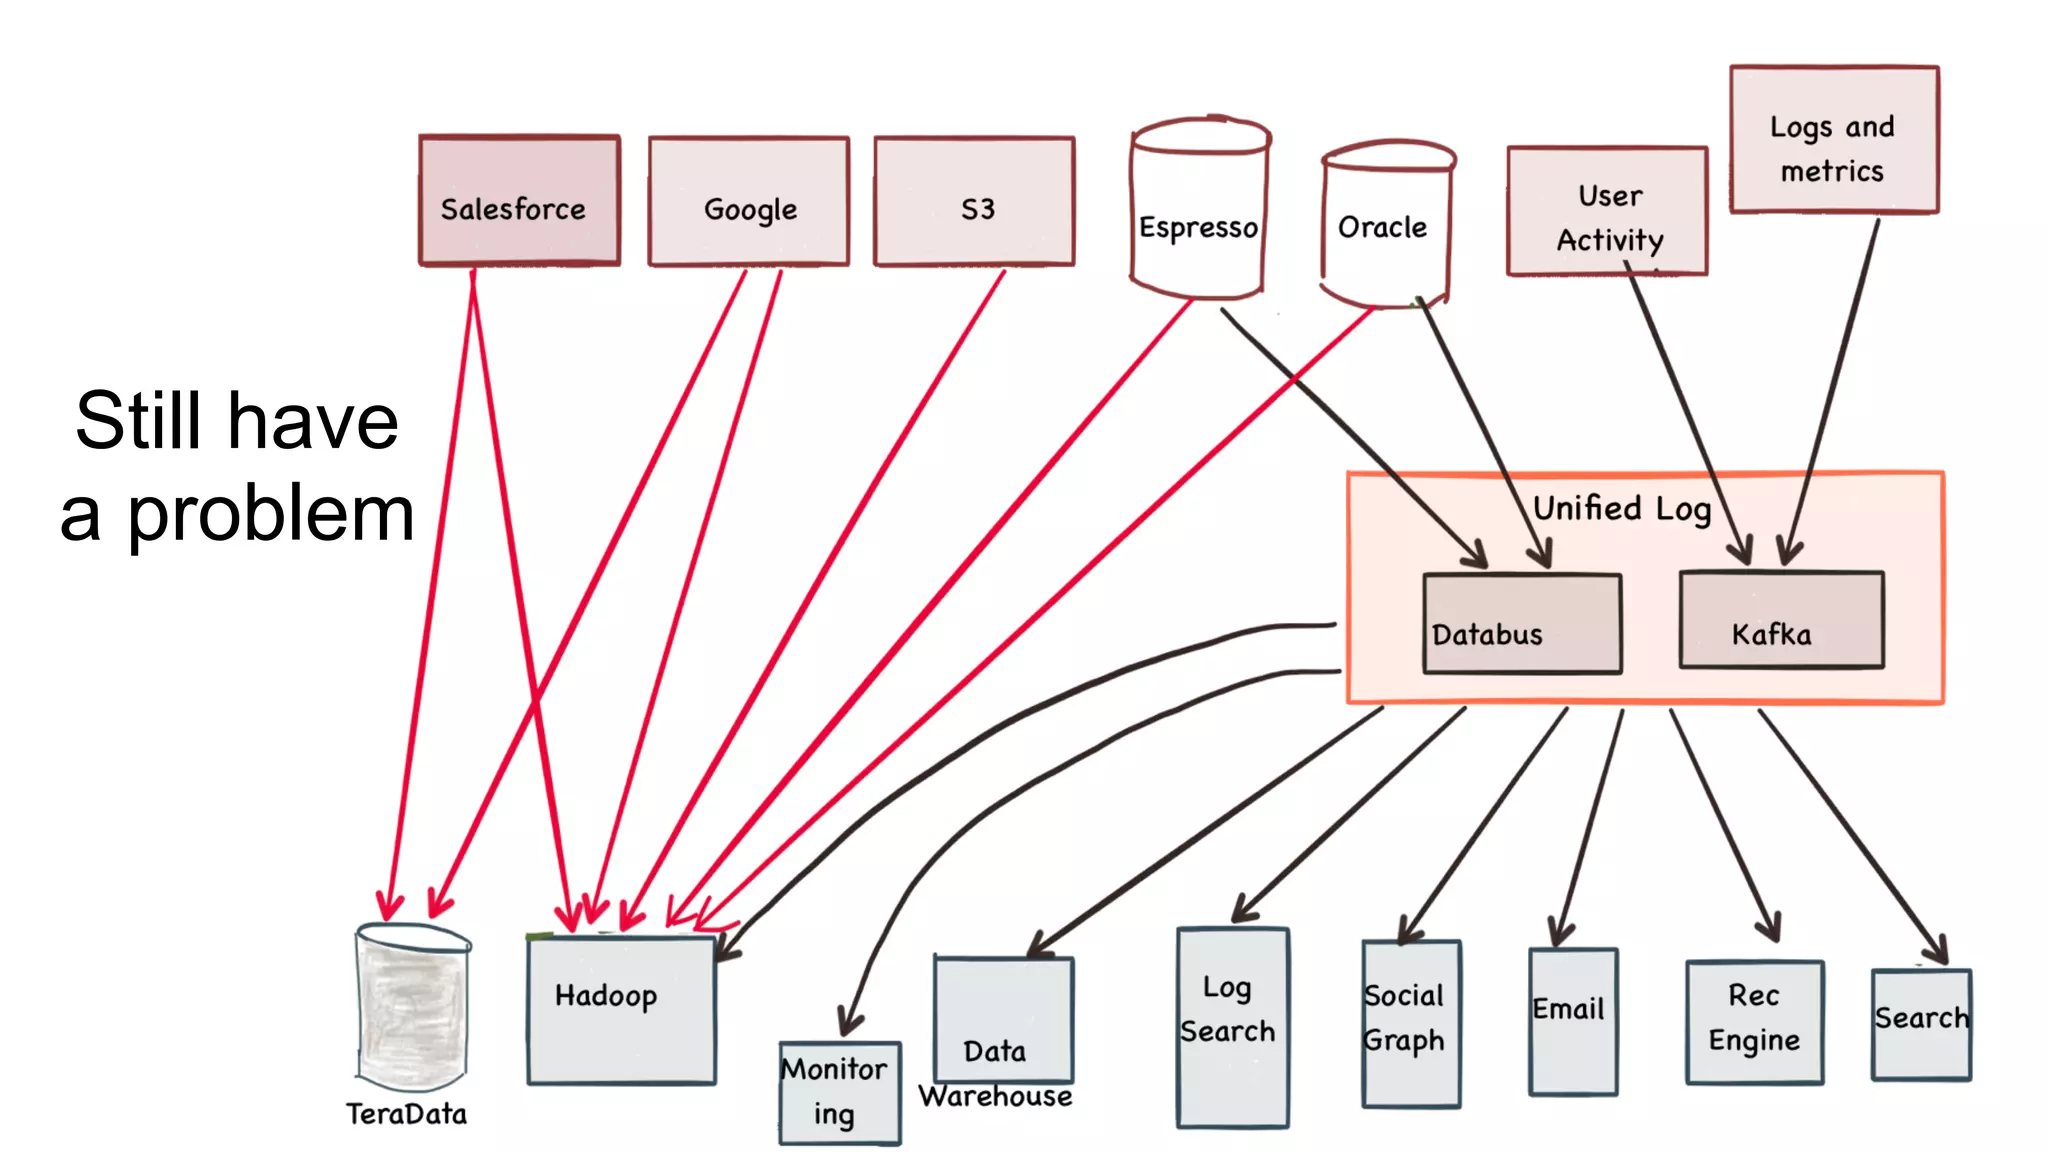
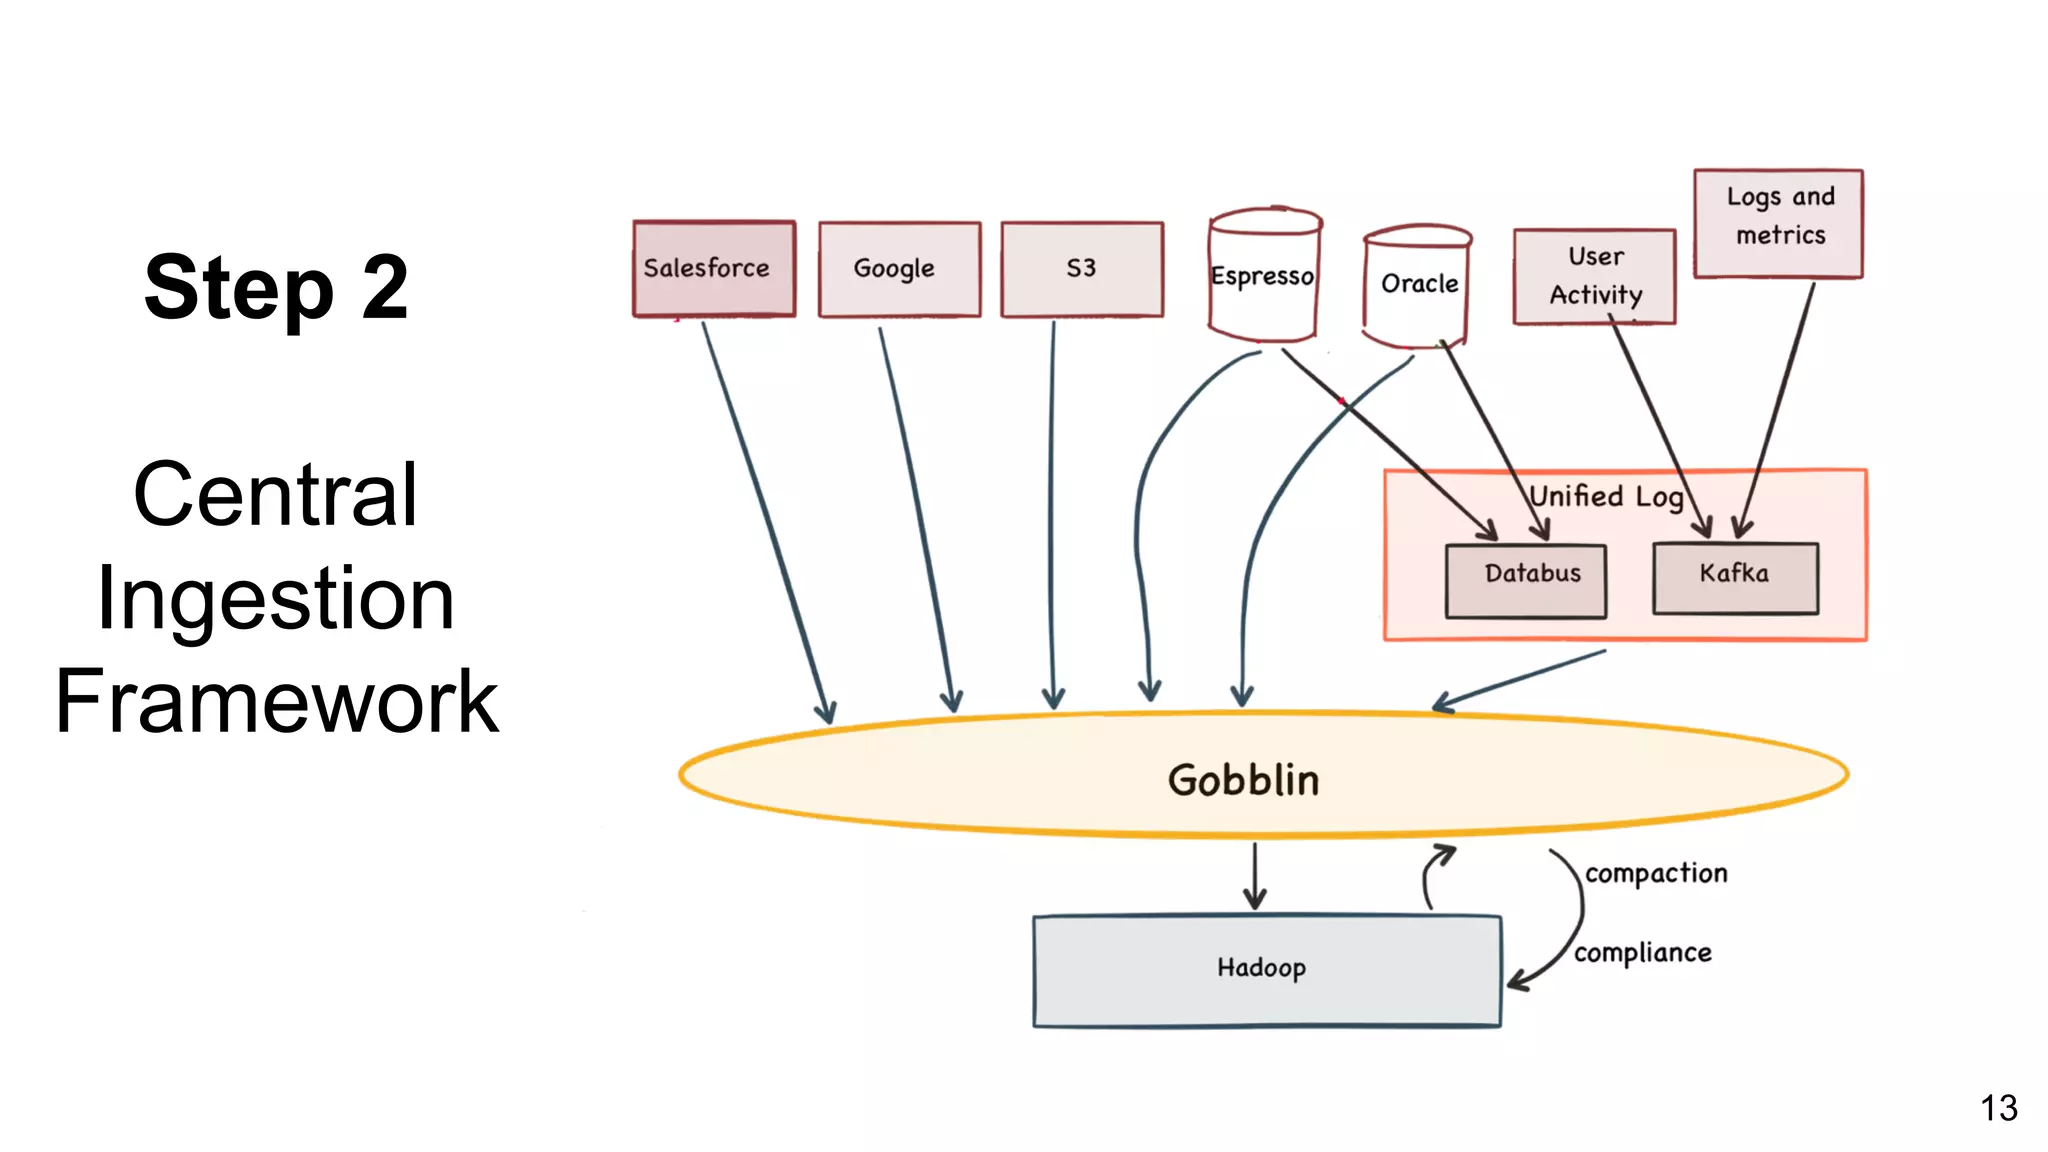
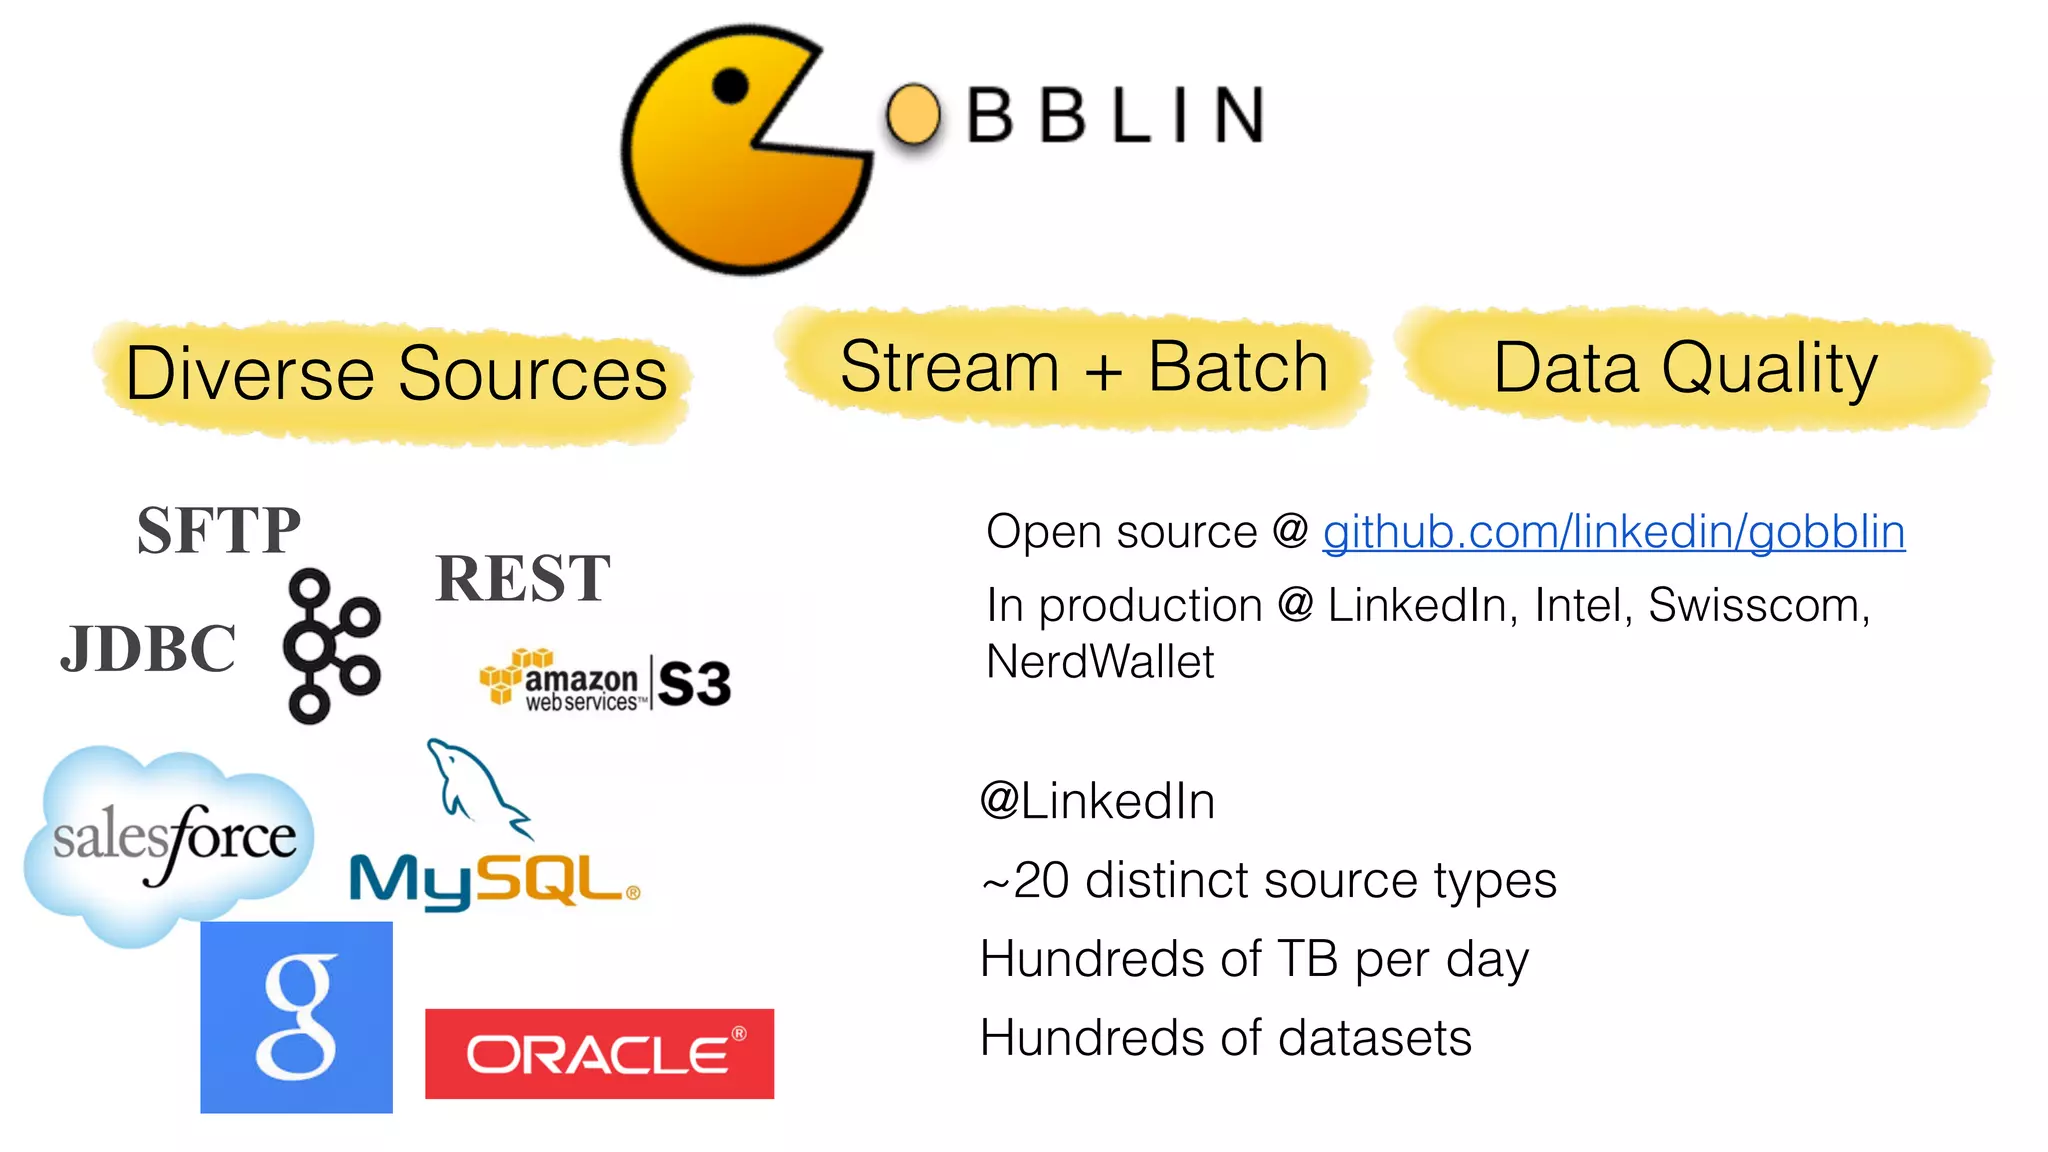
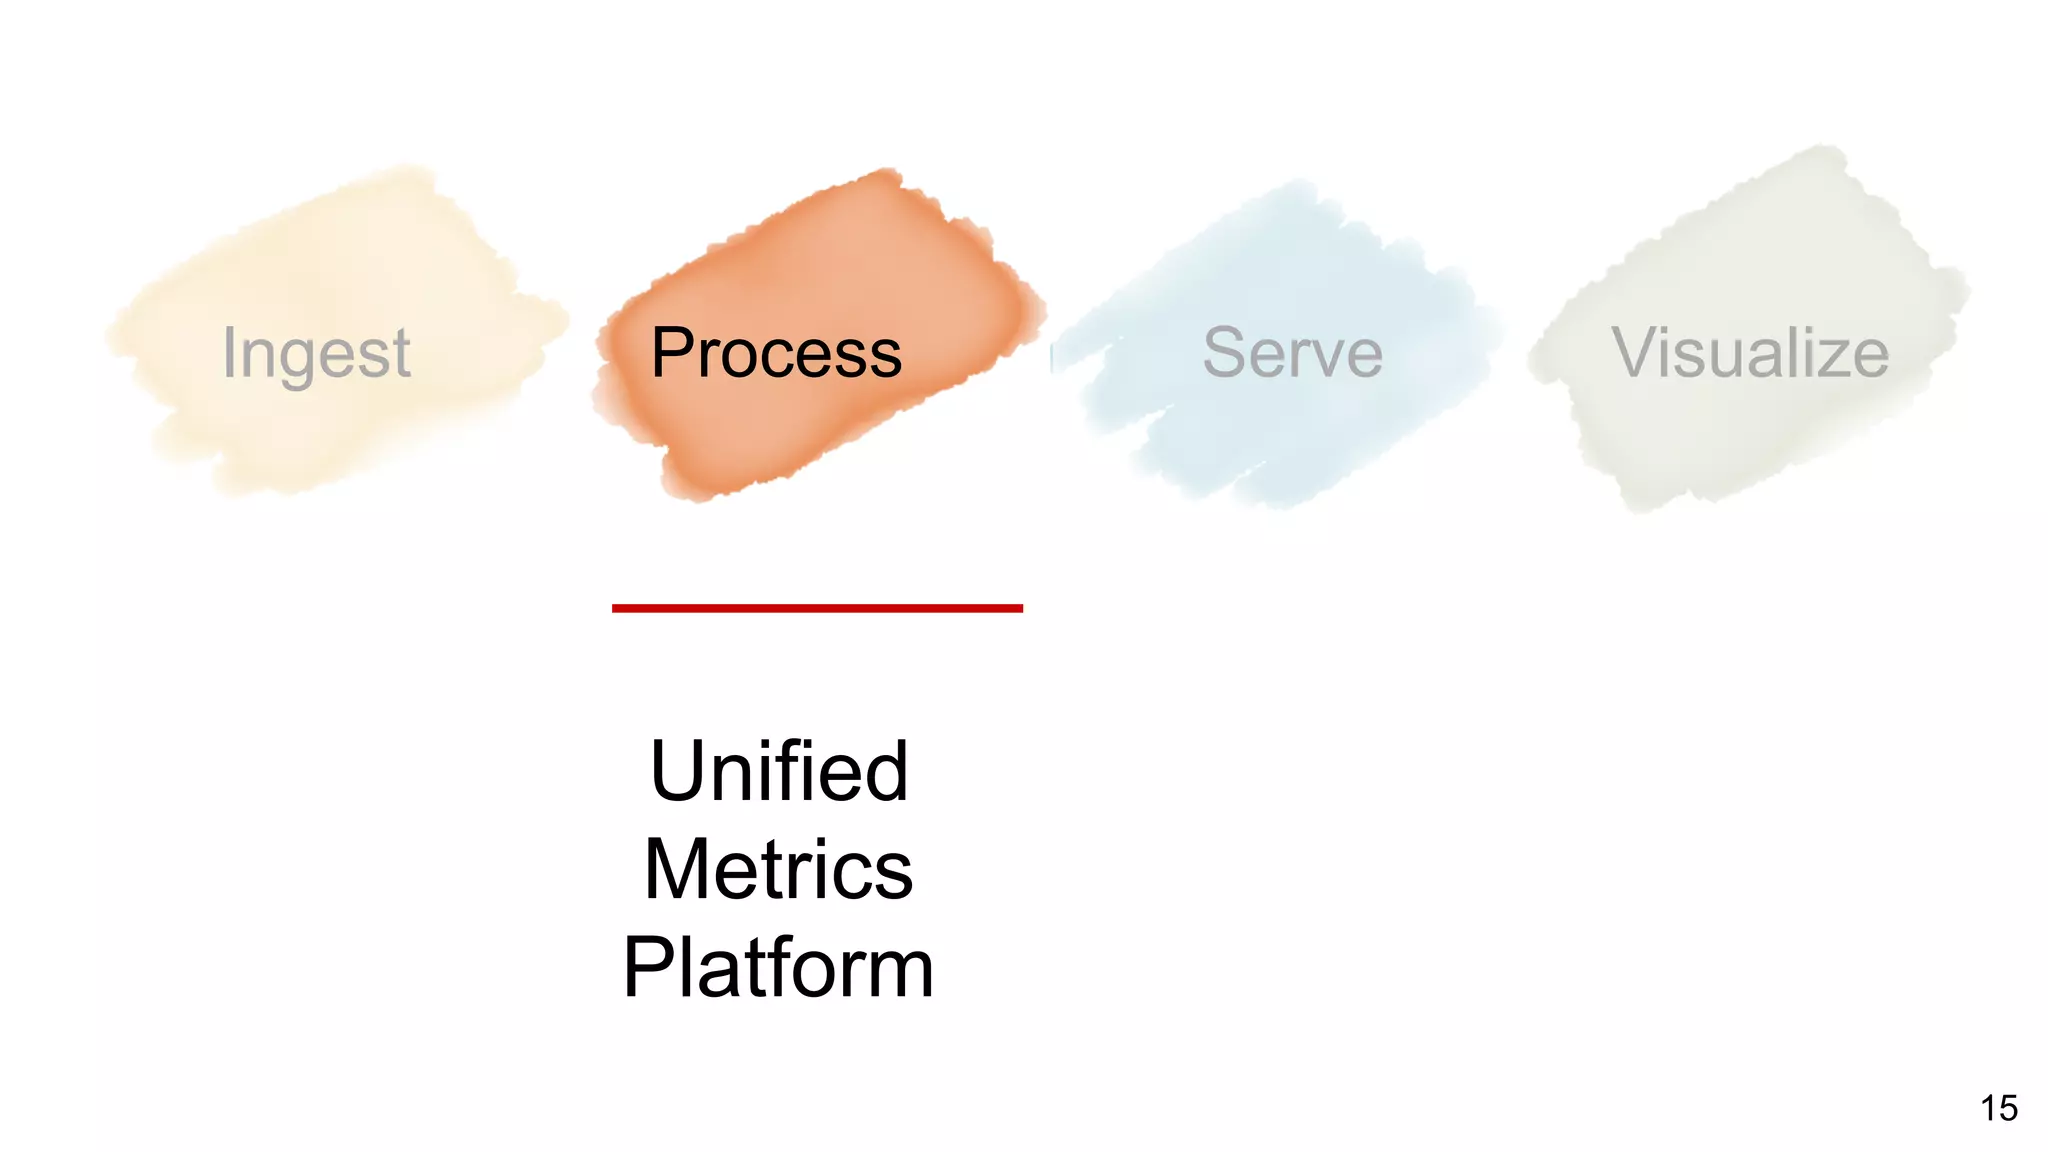
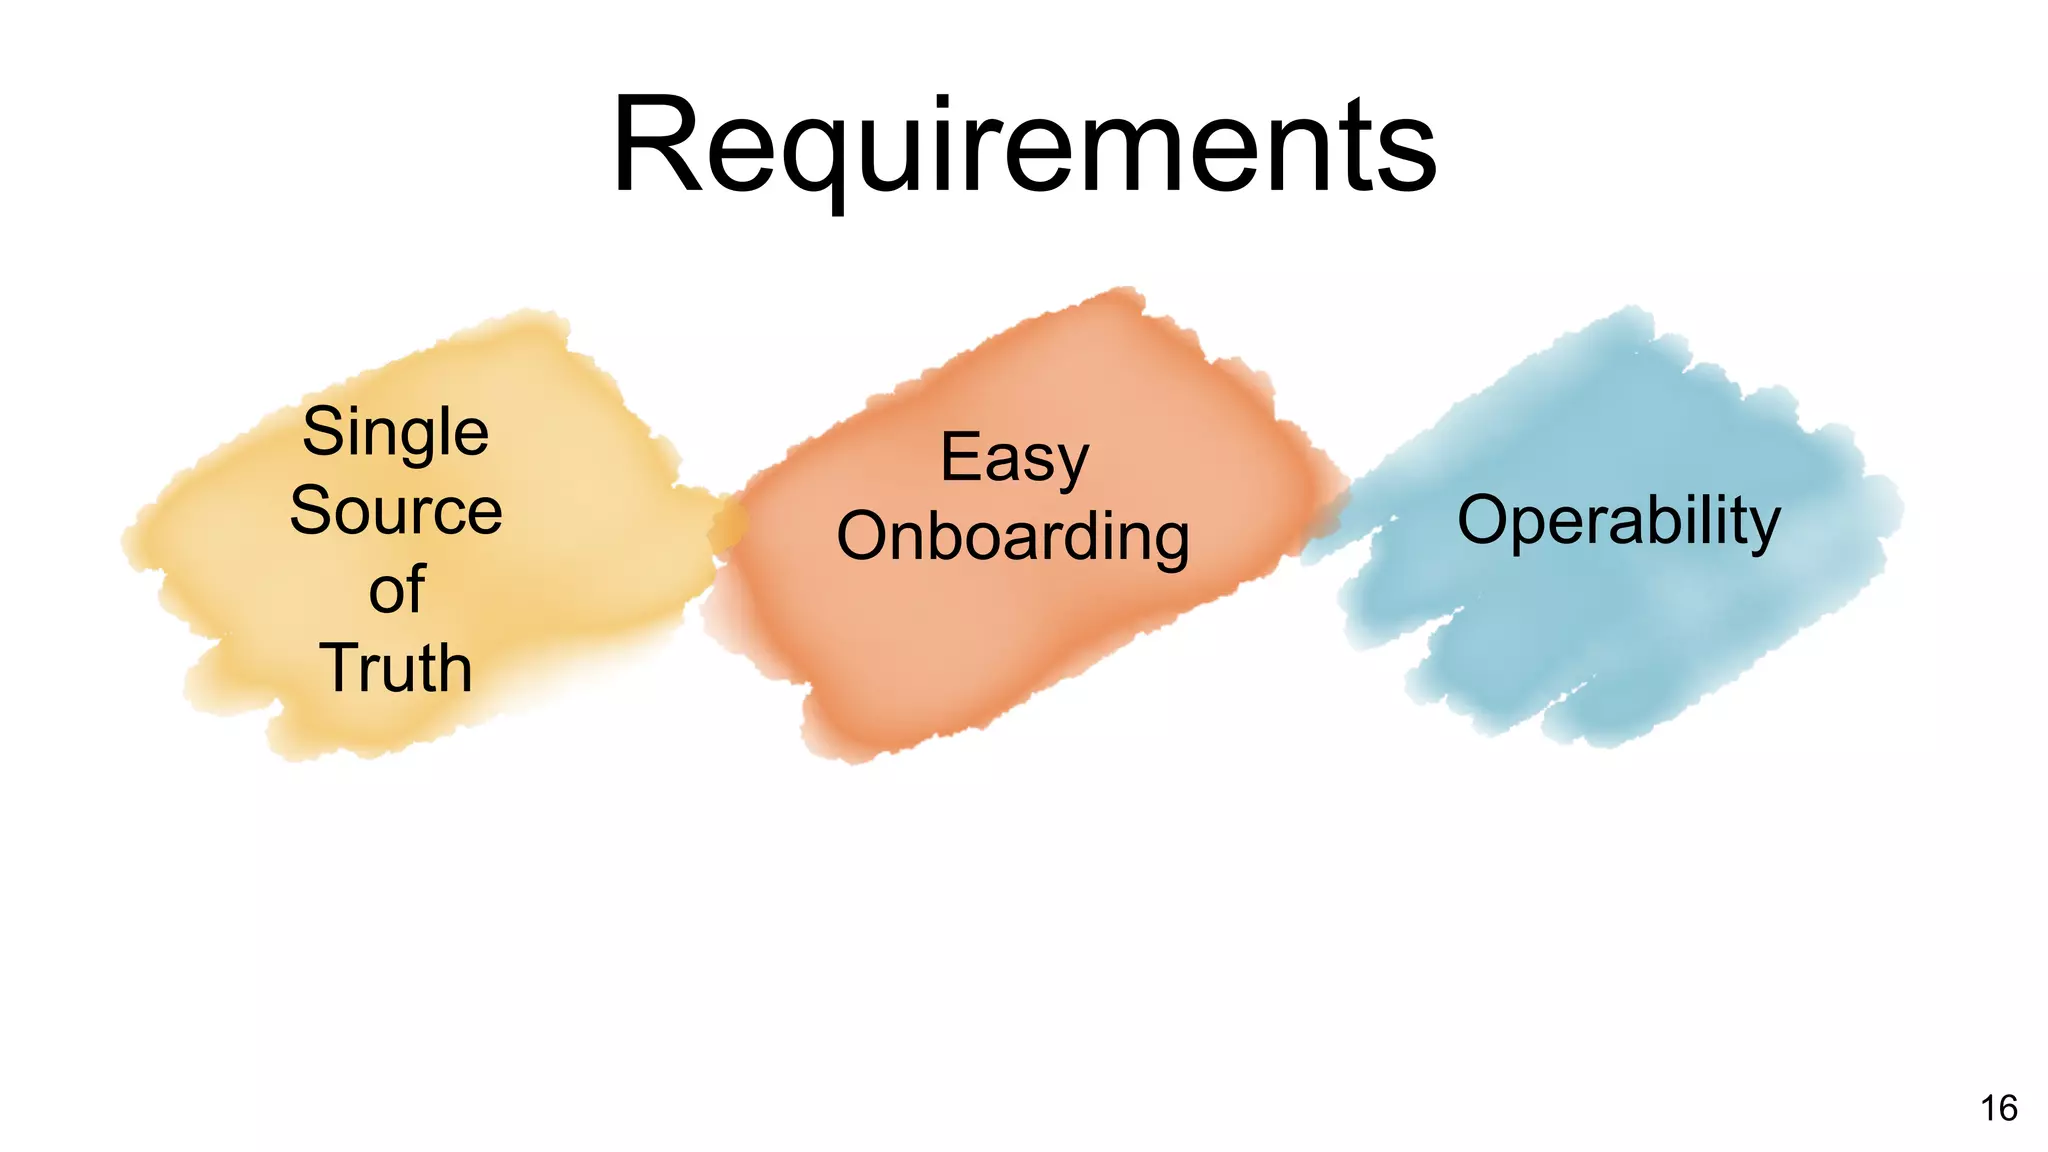
The document outlines the self-serve reporting platform developed at LinkedIn, primarily focusing on their Hadoop infrastructure and the various challenges faced in data ingestion and visualization processes. It details the structure of the reporting teams, data sources, and metrics involved, as well as the evolution of tools like the Unified Metrics Platform and Raptor for improved analytics. Key figures include significant data volumes handled daily and the collaborative efforts made to create a centralized source of truth for reporting metrics across the organization.


![[DSC Europe 25] Nikola Rajovic - Hardware Technologies Under the Hood: RISC-V...](https://cdn.slidesharecdn.com/ss_thumbnails/o2gptrmtoyqndgoshwgq-dsc2025-tenstorrent-rajovic-251205090438-814685f5-thumbnail.jpg?width=640&height=640&fit=bounds)
![[DSC Europe 25] Dragan Vucic - Building the Learning Organization - How AI Tr...](https://cdn.slidesharecdn.com/ss_thumbnails/8brigo2sbu6qur6gxrra-7-251205085715-6ae07d24-thumbnail.jpg?width=640&height=640&fit=bounds)


![[DSC Europe 25] Andy Cotgreave - Nothing is new in analytics.pptx](https://cdn.slidesharecdn.com/ss_thumbnails/mba4vzcurvoh5lfrd5zw-6-251205194645-341bbbbe-thumbnail.jpg?width=640&height=640&fit=bounds)
![[DSC Europe 25] Petar Zivanov - AI meets documents From chatbots to AI-powere...](https://cdn.slidesharecdn.com/ss_thumbnails/xer2bb6nrdc8pdpev0pc-8-251204082258-7c2fa4a1-thumbnail.jpg?width=640&height=640&fit=bounds)

![[DSC Europe 25] Goran Obradovic - The Rise of Sovereign AI: Building the Regi...](https://cdn.slidesharecdn.com/ss_thumbnails/7nw2xxixrxqdxvrb5wca-6-251205085714-ab09a2ac-thumbnail.jpg?width=640&height=640&fit=bounds)
![[DSC Europe 25] Bogdan Daniel Maruneac - AI - It starts with you.pptx](https://cdn.slidesharecdn.com/ss_thumbnails/odov3snhrcqs9hx5ny2n-4-251205085715-f1daacfe-thumbnail.jpg?width=640&height=640&fit=bounds)


![[DSC Europe 25] Vid Stimac - Policy Parsimony: Between Oversimplifying and Ov...](https://cdn.slidesharecdn.com/ss_thumbnails/eqlepagzqp2rhg3gbluh-dsc-stimac-251120-251205090438-059e7f54-thumbnail.jpg?width=640&height=640&fit=bounds)


