The document discusses an investment portfolio consisting of 10 stocks within the information technology sector. It aimed to achieve returns 2% higher than the S&P 500 index. However, less than optimal diversification initially skewed results, leaving a return of -0.082%. Despite underperforming market expectations with an alpha of -3.179%, the portfolio return was higher than the S&P 500 due to a depressed market. Analysis of individual stock prices, trends, and averages was conducted to select securities and determine investment amounts to balance risk.
Forward market, arbitrage, hedging and speculationMohit Singhal
Covers various aspects related to forward market, forward rate, long and short forward position, arbitrage, hedging and speculation along with various illustrative examples.
Forward market, arbitrage, hedging and speculationMohit Singhal
Covers various aspects related to forward market, forward rate, long and short forward position, arbitrage, hedging and speculation along with various illustrative examples.
A hedge is an investment position intended to offset potential losses/gains that
may be incurred by a companion investment. In simple language, a hedge is
used to reduce any substantial losses/gains suffered by an individual or an
organization.
A hedge can be constructed from many types of financial instruments, including
stocks, exchange-traded funds, insurance, forward contracts, swaps, options,
many types of over-the-counter and derivative products, and futures contracts.
Public futures markets were established in the 19th century[1] to allow
transparent, standardized, and efficient hedging of agricultural commodity
prices; they have since expanded to include futures contracts for hedging the
values of energy, precious metals, foreign currency, and interest rate
fluctuations.
This presentation gives you an overview of technical analysis. Technical Analysis basically suggests us "WHEN" to invest. This presentation will give a brief idea of Dow's Theory and different types of graphs used in share market to demonstrate a specific stock (5 types of graphs).
This slide set is a work in progress and is embedded in my Principles of Finance course that I teach to computer scientists and engineers.
http://awesome.weebly.com/
Operations Management Suite, the Penguins and the othersChristian Heitkamp
With the addition of the OMS Linux agent, OMS took a great leap forward by providing more functionalities than ever before. In this session, we will take a closer look at the Linux Agent and providers like the unified log data collector + others. If you have heard of Zabbix, Nagios, Icinga, you want to attend this session. We will do a live hands-on demo and integrate other Operations Management systems with OMS, elevating OMS to a real Operations Bridge with full analytics possibilities across IT management domains. To close off the session, we will spend some time on OMS and IOT too.
Christian Heitkamp (Germany)
Level 300
The battle to be your virtualization vendor is in full swing, and it
has important ramifications for the vendors involved, and for your
data center. The goal of this whitepaper is to analyze the
technical aspects of the two major choices: VMware vSphere 4
and Microsoft Hyper-V R2 (as part of Windows Server 2008 R2).
The two contenders are described in technical detail, and then
those details are compared head-to-head. Typical pricing in two
scenarios is included. Analysis of these tools, how they will
impact your datacenter virtualization, and what the future likely
holds is included. »
Эволюция службы эксплуатации «Spotify» / Лев Попов (Spotify)Ontico
Как службе эксплуатации справиться с интенсивным ростом компании? Как поставлять ПО быстро и безопасно в продукт с множеством зависимых компонентов? Как распространить ответственность за эксплуатацию среди инженерных подразделений? Я расскажу про опыт, который мы получили в Spotify, возможно это поможет ответить на данные вопросы.
What we've learn from 150+ azure deployments?
we will cover the following:
* Whats new in azure
* Know your portal
* Basic billing and subscription management
* From Servers to Services - IaaS to PaaS
* What we've learn from 150 azure deployments
* High Availability from the cost perspective - the SQL example
Amazon Web Service and Microsoft Azure are dominating the enterprise public cloud market, but how are they different? Here’s what you need to know.
There are plenty of differences between AWS and Azure, probably too many to mention in a single webinar. AWS and Azure take generally different approaches and offer some unique services. From our experience with enterprise customers, we found that the commoditized services are often the most important ones. Everybody has a solution for security, access and storage, but how are those solutions different? Will mastering one Cloud platform give me the knowledge I need to operate the other?
Join us in our upcoming webinar, all about the differences in some of the public cloud’s most basic (and vital) services. Watch this webinar to learn about:
The major players in today’s enterprise public cloud market
5 important differences between Azure and AWS
How a single pane of glass can compensate for these differences
www.scalr.com
http://www.scalr.com/lp/webinars/register/aws-vs-azure-5-differences-you-need-to-know-when-chosing-a-public-cloud-vendor
Обзор архитектуры и подсистем деплоя и мониторинга. Как инженеры делают систе...Ontico
1) Схема организации репозитория puppet.
Зачем мы сделали репозиторий публичным внутри компании?
Как мы "делим" puppet, и что делать, если все "пропало"?
Собственная реализация механизма puppet kick.
2) Как рассказать всем обо всем и никого не потерять.
"Черный мониторинг" (rbmon). Как мы собираем информацию о серверах и демонах.
Делимся логами с разработчиками. Почему написали "велосипед"?
3) Graphite - система сбора и визуализации данных.
Почему graphite?
1М метрик в минуту?
Какие метрики мы рисуем (nginx-graphite-module, rbmon plugins).
Визуализация работы проекта (Dashboard пульт).
DHCP Stands for Dynamic Host Configuration Protocol.
DHCP is a protocol that automatically provides an IP host with its IP address and other related configuration information ( subnet mask, default gateway,DNS etc. )
Works on Protocol UDP port no 67 and 68.
New highs in the equity markets prompt the questions, "Is it a good time to invest?" and "What is a good strategy?" Read on to see what Cornerstone Wealth Management's Chief Investment Officer Alan Skrainka, CFA, has to say.
Following several years of relatively benign capital market volatility, it appears wider swings may finally be upon us. January produced multiple moves up and down in excess of 3%. Market Perspectives explores the meaning behind the volatility and how we may seek to take advantage of it.
Following an impressive bounce back from February lows, the durability of the current bull market remains suspect. The benefits of the recent rally appear limited to the large cap, defensive sectors of the market. In prior market cycles, this has portended that the latter stages of a bull market are fast approaching and as such, caution is warranted.
Aurum Capital Newsletter - Mar 31 2023.pdfAurumCapital
The last Financial Year (Apr 2022-Mar 2023) has been a very tough year for Indian equity markets, on the back of a couple of very good years following the deep correction in the markets in Mar 2020 (CoVid meltdown). Markets were expected to be tough and we had indicated these in our previous newsletters. Despite all this we have managed a 24% return, significantly beating the benchmarks (explained in the charts below). We had calibrated our list of stocks in such a way to avoid big drawdowns and that is reflected from the fact that we currently have almost half of our stocks in largecaps from about 15% at the start of the year. We are fairly satisfied with the returns generated in our list of stocks.
Jeff Pesta • LPL Financial
- Is it time to retire your strategy, manager, fund, or ETF? by Dave Moenning
- Dollar strength has uncertain implications
- The Anchored Momentum Indicator by Ron Rowland
- Converting positive feedback into new business (Steve Molesky, Kalos Capital Inc.)
1. Nandan Raghavan
StockTrak Report
The ubiquitous spread and development of information technologies is a central
element of the 21st century, which has seen formerly fledgling firms such as Google and
Amazon ascend to positions of unrivaled value. Newer technological advancements have
only served to make the field of information technology more enticing. Informational
technologies are utilized across a variety of sectors to streamline business processes among a
host of other purposes. The prevalence of informational technologies has spawned numerous
lucrative investment opportunities within this sector. The management of investments within
this burgeoning sector serves as the basis of our fund.
Our management approach primarily involved passive asset management, and our
focus was to select reliable initial securities. We conducted a thorough and methodical search
process over a number of securities within technological sectors. In an additional effort to
minimize risk, we decided to invest exclusively in equities that were included in the S&P
500. Due to the consistency and reputation of this index we remained confident with our
security selections. When considering purchasing a stock, we closely studied the trend in
pricing within the 5 days and 1 month prior to the purchase date. Following this, we
conducted some research on the firm’s area of specialization to identify any systematic risk
factors.
The objective of our portfolio was initially to see a return of 5% higher than the S&P
500. However, during the early stages of investing, markets were down, so we settled on
what we felt was a more achievable rate of 2% higher than the S&P 500.
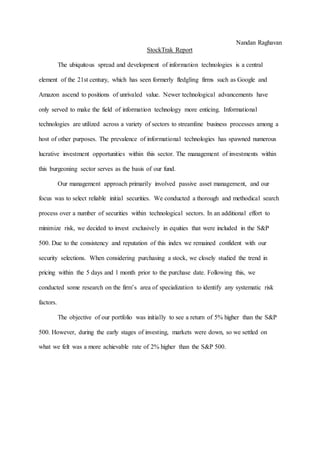
2. The above chart gives the final allocation of funds among the securities that we
invested in. It is important to note that this chart shows only the final allocation of assets.
When we started out, we only invested in Google. After a few days of trading, we invested in
additional securities. Since we did not diversify well enough initially, the portfolio returns
ended up being skewed by negative returns from a poorly diversified portfolio.
Looking at the beta values for the stocks that we invested, a number of them were
below the market average of 1. Yamana Gold, IBM, Verizon, and Wal-Mart all had beta
values lower than one, which made us believe that the systematic risk within our portfolio
would be decreased. However, this was negated by beta values considerably higher than 1 for
the rest of our equities, and the portfolio beta value was 1.003. Intuitively, one would believe
that the portfolio return would have been similar to the CAPM expected return, since beta
was very close to 1. As mentioned earlier, less than optimal portfolio diversification skewed
our results, leaving us with a return of -0.082%. On an interesting note, excising the first five
days of trading from the record, the return was -0.019%. The chart below shows the total
profit and loss for each stock in the portfolio.
3. Since the CAPM model provides an estimate for the portfolio return, we want to know
how much this expected return deviates from the actual realized return. This is where the
alpha term in the CAPM equation comes into use. Portfolios with a positive alpha term
perform better than the CAPM expectation, while portfolios with a negative alpha value are
viewed as underperforming. Our portfolio had an alpha of -3.179%, which indicated that it
4. severely underperformed the market expectation. Despite this, our portfolio return ended up
being higher than that of the S&P 500, as shown in the graph below. However, it seems likely
that this was mostly due to a depressed market. The Jensen ratio is the same as the alpha
value, and in this case, it just indicates that our portfolio underperformed market
expectations. A similar conclusion can be derived from the Sharpe ratio, which shows the
difference in returns for risky and risk free assets with respect to inherent risk. Our portfolio
consisted of ten equities, as is evidenced by the table below. When performing security
analysis, we examined how share price ran in the last 5 days as well as its trend for one
month. What’s more, the average price is another factor that we focus on. We need to make a
hypothesis that if this stock will return to the average price. Like IBM increase continually at
past, but the average price still stays in a low section. Since that, we cannot purchase a lot
because the risk for IBM is uninsurable. In addition, we should make the relationship
between the paid price and our asset be balance. We need to purchase at least 10 stocks and
the total asset we have is 500000 dollars. The most important thing for us is to analysis how
the risky degree that stock had and how many percent of our asset should us to invest for.
Because that the result we focus on is the total profit of all those 10 stocks. Stocks are the
things that running in our real world and there are so many uncertain factor happens every
day.