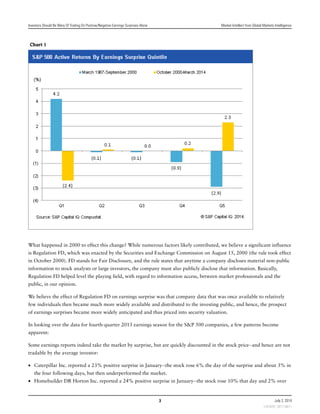
SlideShare a Scribd company logo
Investors Should Be Wary Of Trading On Positive/Negative
Earnings Surprises Alone
Global equity investors are correct to closely follow the quarterly corporate earnings cycle, since
in the end it is current reported, and more importantly, expected future earnings growth that
drives market psychology and the direction of stocks over the intermediate to long-run, in our
opinion. Put another way, where the outlook for profitability and the outlook for the direction
of the stock market is concerned, as we like to say, "you can't really know where you are going
unless you know where you have been." As companies report their results, the focus very often
becomes whether companies beat, missed, or met their consensus earnings "number." But are
investors well-advised to invest or even trade on reported quarterly earnings based on whether
any given company was able to "beat the Street" in any given particular quarter? The Global
Markets Intelligence (GMI) team at S&P Capital IQ decided to investigate this question, and
determined the following:
• We believe that earnings surprise, a widely followed indicator of company performance,
should not be used as the sole basis for either trading or investing decisions.
• We show that positive earnings surprises, as a basis for trading, has not produced higher
excess returns in recent years for S&P 500 or S&P 600 index member stocks.
• Likewise, using negative earnings surprise as a basis for selling shares does not result in
underperformance versus the market for either index.
• However, on a qualitative basis, we view earnings surprise as a good indicator of a
company's ability (or inability) to generate earnings in excess of expectations, and hence of
the general health of a company's operations, especially when a company is able to post a
string of positive surprises (or when a company is consistently unable to meet estimates and
posts a series of negative surprises).
• In addition, we'd suggest that when evaluating performance, investors consider earnings
surprise within the context of earnings growth. A modestly negative surprise or two within a
strong earnings growth trend is not necessarily fatal in our view, while a slightly positive
surprise with earnings per share (EPS) declining is not necessarily a call for celebration.
• Further, as with much in the market, moderation is often a good thing: a string of moderate
earnings surprises amid moderate earnings growth can often mark a stable and sustainable
earnings growth trajectory for a company--and one that might well be profitable to the
Market Intellect
from Global Markets Intelligence
July 2, 2014
Robert A Keiser
Vice President
Global Markets Intelligence
(1) 212-438-3540
robert.keiser@spcapitaliq.com
Jaseem Hasib
Vice President, Quantitative Research
Global Markets Intelligence
(1) 212-438-1158
jaseem.hasib@spcapitaliq.com
This report was prepared by the S&P
Capital IQ Global Markets Intelligence
group. This group is analytically and
editorially independent from any other
analytical group at S&P. The objective
of this group is to provide unique
financial intelligence by analyzing
relationships across multiple asset
classes and markets. Enabled with
cutting-edge S&P Capital IQ and
third-party applications and data, the
group offers investors valuable new
sources for alpha discovery and
"out-of-the-box" thinking through
robust data exploration and analysis.
The research provides investors with
actionable and topical market
perspectives that can offer innovative
ways to leverage credit and risk
intelligence.
1341026 | 301116611
investor, given attractive valuations.
Can investors outperform the broader market by reacting to earnings surprises?
Looking at the S&P 500 and S&P 600 indexes, the answer to the above question seems clear based on the empirical data.
In aggregate and over an extended period, companies that report positive earnings surprises do not subsequently see their
stocks outperform the market, and stocks that surprise negatively, conversely, do not underperform. However, our
time-series analysis reveals that earnings surprises have previously helped generate alpha, but the correlation has ceased to
exist since the year 2000, presumably as investors have become smarter and more efficient in evaluating the sustainability
and true value of earnings surprises.
Methodology
EPS estimates and actual analyst-adjusted values were gathered for S&P 500 companies on a quarterly basis from 1987
through early 2014. The consensus estimate was compared with the actual "operating" earnings, as reported by the
company, to define the earnings surprise. Companies with the highest positive surprises were placed into quintile one (Q1)
and those with the highest negative surprises were placed in quintile five (Q5).
Analysis
The monthly returns of the five quintile-based portfolios are presented in Chart 1, arranged from highest positive surprise
(Q1) to highest negative surprise (Q5). Portfolios are rebalanced monthly, and forward returns are calculated for the
succeeding month.
The blue bars represent performance results (total returns) from March 1987 to September 2000. Note that companies
with the highest earnings surprises did outperform the S&P 500 by a 4.2% annual average over this period. Likewise, the
companies with the highest negative earnings surprises over the 1987-2000 period underperformed the S&P 500 by 2.9%
on average.
However, beginning in September 2000, the relationship between earnings surprise and stock performance changes
dramatically. The yellow bars represent results from September 2000 to March 2014. Over this period, companies with
the highest positive earnings surprises (Q1) underperform the S&P 500 by 2.4% on average and those with the highest
negative surprises (Q5) outperform by 2.3% on average.
Note: "Active" returns mean total returns (with dividends reinvested) in excess of an index benchmark, which is the S&P
500 in this case.
Investors Should Be Wary Of Trading On Positive/Negative Earnings Surprises Alone Market Intellect from Global Markets Intelligence
2 July 2, 2014
1341026 | 301116611
Chart 1
What happened in 2000 to effect this change? While numerous factors likely contributed, we believe a significant influence
is Regulation FD, which was enacted by the Securities and Exchange Commission on August 15, 2000 (the rule took effect
in October 2000). FD stands for Fair Disclosure, and the rule states that anytime a company discloses material non-public
information to stock analysts or large investors, the company must also publicly disclose that information. Basically,
Regulation FD helped level the playing field, with regard to information access, between market professionals and the
public, in our opinion.
We believe the effect of Regulation FD on earnings surprise was that company data that was once available to relatively
few individuals then became much more widely available and distributed to the investing public, and hence, the prospect
of earnings surprises became more widely anticipated and thus priced into security valuation.
In looking over the data for fourth-quarter 2013 earnings season for the S&P 500 companies, a few patterns become
apparent:
Some earnings reports indeed take the market by surprise, but are quickly discounted in the stock price--and hence are not
tradable by the average investor:
• Caterpillar Inc. reported a 23% positive surprise in January--the stock rose 6% the day of the surprise and about 3% in
the four following days, but then underperformed the market.
• Homebuilder DR Horton Inc. reported a 24% positive surprise in January--the stock rose 10% that day and 2% over
Investors Should Be Wary Of Trading On Positive/Negative Earnings Surprises Alone Market Intellect from Global Markets Intelligence
3 July 2, 2014
1341026 | 301116611
the following three days, but then became a market performer.
Some earnings reports result in "surprises" that are ignored by the market--other factors are deemed more significant (e.g.,
forward guidance).
• Vertex Pharmaceuticals Inc. reported a 144% positive surprise in late January--the stock rose 4% on the day, but
underperformed the S&P 500 by 2% in February and 13% in March.
• Broadcom Corp. reported a 5% surprise in late January--the stock rose 2% on the day, but then underperformed for
the month of February.
Sometimes positive earnings surprises result in a pop in the stock price on the day of earnings followed by continued
outperformance. Although this type of surprise is tradable, we don't see a good way for the average investor to
differentiate it from other types of EPS surprise.
• Eastman Chemical Co. reported an 8% positive surprise in late January, rose 3% on the day, and outperformed the
market by 8% in February.
• Wynn Resorts Ltd. reported a 31% positive surprise in late January--the stock rose 4% on the day and outperformed
by 9% in February and 9% in March.
A positive surprise is sometimes met by investor selling, but the stock is then reevaluated, turns around and rises strongly.
Again, we see no easy way to tell when this will occur. Also, it is possible that factors other than the surprise are driving
the turnaround in the stock.
• Phillips 66 reported a 26% positive surprise in late January and the stock declined for five days. It then went on to
outperform the S&P 500 by 2% in both February and March.
• KLA-Tencor Corp. reported a 6% positive surprise on January 23.The stock fell by 6% over the following several days,
but then outperformed by 2% in February and 5% in March.
In sum, for the S&P 500, positive earnings surprises are generally a sign that things are progressing well for the company,
but, profiting from the earnings surprise alone is difficult.
Even for small cap stocks, earnings surprise alone as a strategy has been a tough one in recent years. Chart 2 shows active
returns by earnings surprise quintile for the S&P 600. (Active returns mean returns in excess of the S&P 600 index
average)
From 1994 (index inception) until April 2006, the earnings surprise strategy worked very well for S&P 600 companies
(blue bars). However, the strategy stopped working (or worked in reverse) from that point until the present. We believe
that, like the S&P 500 stocks, the S&P 600 stocks became more efficient at discounting positive and negative news over
time.
Note: Results for the S&P 400 were very similar to S&P 500 results, with outperformance by the top quintile (highest
earnings surprise) ending in August 2000. Due to this similarity we have not presented S&P 400 results here.
Investors Should Be Wary Of Trading On Positive/Negative Earnings Surprises Alone Market Intellect from Global Markets Intelligence
4 July 2, 2014
1341026 | 301116611
Chart 2
Contact Information: Richard Tortoriello, Director, Quantitative Research—Global Markets
Intelligence, Richard_Tortoriello@spcapitaliq.com
Investors Should Be Wary Of Trading On Positive/Negative Earnings Surprises Alone Market Intellect from Global Markets Intelligence
5 July 2, 2014
1341026 | 301116611
S&P may receive compensation for its ratings and certain analyses, normally from issuers or underwriters of securities or from obligors. S&P reserves the right to disseminate
its opinions and analyses. S&P's public ratings and analyses are made available on its Web sites, www.standardandpoors.com (free of charge), and www.ratingsdirect.com
and www.globalcreditportal.com (subscription) and www.spcapitaliq.com (subscription) and may be distributed through other means, including via S&P publications and third-
party redistributors. Additional information about our ratings fees is available at www.standardandpoors.com/usratingsfees.
S&P keeps certain activities of its business units separate from each other in order to preserve the independence and objectivity of their respective activities. As a result,
certain business units of S&P may have information that is not available to other S&P business units. S&P has established policies and procedures to maintain the
confidentiality of certain nonpublic information received in connection with each analytical process.
To the extent that regulatory authorities allow a rating agency to acknowledge in one jurisdiction a rating issued in another jurisdiction for certain regulatory purposes, S&P
reserves the right to assign, withdraw, or suspend such acknowledgement at any time and in its sole discretion. S&P Parties disclaim any duty whatsoever arising out of the
assignment, withdrawal, or suspension of an acknowledgment as well as any liability for any damage alleged to have been suffered on account thereof.
Credit-related and other analyses, including ratings, and statements in the Content are statements of opinion as of the date they are expressed and not statements of fact.
S&P's opinions, analyses, and rating acknowledgment decisions (described below) are not recommendations to purchase, hold, or sell any securities or to make any
investment decisions, and do not address the suitability of any security. S&P assumes no obligation to update the Content following publication in any form or format. The
Content should not be relied on and is not a substitute for the skill, judgment and experience of the user, its management, employees, advisors and/or clients when making
investment and other business decisions. S&P does not act as a fiduciary or an investment advisor except where registered as such. While S&P has obtained information from
sources it believes to be reliable, S&P does not perform an audit and undertakes no duty of due diligence or independent verification of any information it receives.
No content (including ratings, credit-related analyses and data, model, software or other application or output therefrom) or any part thereof (Content) may be modified,
reverse engineered, reproduced or distributed in any form by any means, or stored in a database or retrieval system, without the prior written permission of Standard & Poor's
Financial Services LLC or its affiliates (collectively, S&P). The Content shall not be used for any unlawful or unauthorized purposes. S&P and any third-party providers, as well
as their directors, officers, shareholders, employees or agents (collectively S&P Parties) do not guarantee the accuracy, completeness, timeliness or availability of the
Content. S&P Parties are not responsible for any errors or omissions (negligent or otherwise), regardless of the cause, for the results obtained from the use of the Content, or
for the security or maintenance of any data input by the user. The Content is provided on an "as is" basis. S&P PARTIES DISCLAIM ANY AND ALL EXPRESS OR IMPLIED
WARRANTIES, INCLUDING, BUT NOT LIMITED TO, ANY WARRANTIES OF MERCHANTABILITY OR FITNESS FOR A PARTICULAR PURPOSE OR USE, FREEDOM FROM BUGS,
SOFTWARE ERRORS OR DEFECTS, THAT THE CONTENT'S FUNCTIONING WILL BE UNINTERRUPTED, OR THAT THE CONTENT WILL OPERATE WITH ANY SOFTWARE OR
HARDWARE CONFIGURATION. In no event shall S&P Parties be liable to any party for any direct, indirect, incidental, exemplary, compensatory, punitive, special or
consequential damages, costs, expenses, legal fees, or losses (including, without limitation, lost income or lost profits and opportunity costs or losses caused by negligence)
in connection with any use of the Content even if advised of the possibility of such damages.
This report was prepared by the S&P Capital IQ Global Markets Intelligence group. This group is analytically and editorially independent from any other analytical group at
S&P.
Copyright © 2016 Standard & Poor's Financial Services LLC, a part of McGraw Hill Financial. All rights reserved.
6
July 2, 2014
1341026 | 301116611

More Related Content

What's hot

Morning tea 01 12-2016
Morning tea 01 12-2016Morning tea 01 12-2016
Morning tea 01 12-2016
Choice Equity
 
Key questions for the long term investor
Key questions for the long term investorKey questions for the long term investor
Key questions for the long term investor
Better Financial Education
 
Putnam Equity Income Fund Q&A Q2 2013
Putnam Equity Income Fund Q&A Q2 2013Putnam Equity Income Fund Q&A Q2 2013
Putnam Equity Income Fund Q&A Q2 2013
Putnam Investments
 
Choice Morning-Tea
Choice Morning-TeaChoice Morning-Tea
Choice Morning-Tea
choice broking
 
Meb Faber at QuantCon 2016
Meb Faber at QuantCon 2016Meb Faber at QuantCon 2016
Meb Faber at QuantCon 2016
Quantopian
 
Monthly Market Perspective - June 2016
Monthly Market Perspective - June 2016Monthly Market Perspective - June 2016
Monthly Market Perspective - June 2016
David Berger
 
Debt market what to expect in November 2021?
Debt market   what to expect in November 2021?Debt market   what to expect in November 2021?
Debt market what to expect in November 2021?
Vinod Prajapati
 
Equity market what to expect in November 2021
Equity market what to expect in November 2021Equity market what to expect in November 2021
Equity market what to expect in November 2021
Vinod Prajapati
 
Morning tea 02 01-2017
Morning tea 02 01-2017Morning tea 02 01-2017
Morning tea 02 01-2017
Choice Equity
 
Morning tea 07 03-2017
Morning tea 07 03-2017Morning tea 07 03-2017
Morning tea 07 03-2017
choice broking
 
Morning tea 06 09-2016
Morning tea 06 09-2016Morning tea 06 09-2016
Morning tea 06 09-2016
Choice Equity
 
ASSET ALLOCATION AND DIVERSIFICATION STRATEGIES:KEY FACTORS TO CONSIDER - Ste...
ASSET ALLOCATION AND DIVERSIFICATION STRATEGIES:KEY FACTORS TO CONSIDER - Ste...ASSET ALLOCATION AND DIVERSIFICATION STRATEGIES:KEY FACTORS TO CONSIDER - Ste...
ASSET ALLOCATION AND DIVERSIFICATION STRATEGIES:KEY FACTORS TO CONSIDER - Ste...
IFG Network marcus evans
 
Right team, right story, right price
Right team, right story, right priceRight team, right story, right price
Right team, right story, right priceMaria Pinelli
 
Morning tea 23 12-2016
Morning tea 23 12-2016Morning tea 23 12-2016
Morning tea 23 12-2016
Choice Equity
 
Morning tea 30 11-2016
Morning tea 30 11-2016Morning tea 30 11-2016
Morning tea 30 11-2016
Choice Equity
 
Equity Market - What to expect in August 2021?
Equity Market - What to expect in August 2021?Equity Market - What to expect in August 2021?
Equity Market - What to expect in August 2021?
Vinod Prajapati
 
The Sustainable Active Investing Framework: Simple, but Not Easy by Wesley Gr...
The Sustainable Active Investing Framework: Simple, but Not Easy by Wesley Gr...The Sustainable Active Investing Framework: Simple, but Not Easy by Wesley Gr...
The Sustainable Active Investing Framework: Simple, but Not Easy by Wesley Gr...
Quantopian
 
Jeff Pesta, LUTCF – Proactive Advisor Magazine – Volume 5 Issue 11
Jeff Pesta, LUTCF – Proactive Advisor Magazine – Volume 5 Issue 11Jeff Pesta, LUTCF – Proactive Advisor Magazine – Volume 5 Issue 11
Jeff Pesta, LUTCF – Proactive Advisor Magazine – Volume 5 Issue 11
Proactive Advisor Magazine
 
Morning tea 23 11-2016
Morning tea 23 11-2016Morning tea 23 11-2016
Morning tea 23 11-2016
Choice Equity
 
Morning tea 01 08-2016
Morning tea 01 08-2016Morning tea 01 08-2016
Morning tea 01 08-2016
Choice Equity
 

What's hot (20)

Morning tea 01 12-2016
Morning tea 01 12-2016Morning tea 01 12-2016
Morning tea 01 12-2016
 
Key questions for the long term investor
Key questions for the long term investorKey questions for the long term investor
Key questions for the long term investor
 
Putnam Equity Income Fund Q&A Q2 2013
Putnam Equity Income Fund Q&A Q2 2013Putnam Equity Income Fund Q&A Q2 2013
Putnam Equity Income Fund Q&A Q2 2013
 
Choice Morning-Tea
Choice Morning-TeaChoice Morning-Tea
Choice Morning-Tea
 
Meb Faber at QuantCon 2016
Meb Faber at QuantCon 2016Meb Faber at QuantCon 2016
Meb Faber at QuantCon 2016
 
Monthly Market Perspective - June 2016
Monthly Market Perspective - June 2016Monthly Market Perspective - June 2016
Monthly Market Perspective - June 2016
 
Debt market what to expect in November 2021?
Debt market   what to expect in November 2021?Debt market   what to expect in November 2021?
Debt market what to expect in November 2021?
 
Equity market what to expect in November 2021
Equity market what to expect in November 2021Equity market what to expect in November 2021
Equity market what to expect in November 2021
 
Morning tea 02 01-2017
Morning tea 02 01-2017Morning tea 02 01-2017
Morning tea 02 01-2017
 
Morning tea 07 03-2017
Morning tea 07 03-2017Morning tea 07 03-2017
Morning tea 07 03-2017
 
Morning tea 06 09-2016
Morning tea 06 09-2016Morning tea 06 09-2016
Morning tea 06 09-2016
 
ASSET ALLOCATION AND DIVERSIFICATION STRATEGIES:KEY FACTORS TO CONSIDER - Ste...
ASSET ALLOCATION AND DIVERSIFICATION STRATEGIES:KEY FACTORS TO CONSIDER - Ste...ASSET ALLOCATION AND DIVERSIFICATION STRATEGIES:KEY FACTORS TO CONSIDER - Ste...
ASSET ALLOCATION AND DIVERSIFICATION STRATEGIES:KEY FACTORS TO CONSIDER - Ste...
 
Right team, right story, right price
Right team, right story, right priceRight team, right story, right price
Right team, right story, right price
 
Morning tea 23 12-2016
Morning tea 23 12-2016Morning tea 23 12-2016
Morning tea 23 12-2016
 
Morning tea 30 11-2016
Morning tea 30 11-2016Morning tea 30 11-2016
Morning tea 30 11-2016
 
Equity Market - What to expect in August 2021?
Equity Market - What to expect in August 2021?Equity Market - What to expect in August 2021?
Equity Market - What to expect in August 2021?
 
The Sustainable Active Investing Framework: Simple, but Not Easy by Wesley Gr...
The Sustainable Active Investing Framework: Simple, but Not Easy by Wesley Gr...The Sustainable Active Investing Framework: Simple, but Not Easy by Wesley Gr...
The Sustainable Active Investing Framework: Simple, but Not Easy by Wesley Gr...
 
Jeff Pesta, LUTCF – Proactive Advisor Magazine – Volume 5 Issue 11
Jeff Pesta, LUTCF – Proactive Advisor Magazine – Volume 5 Issue 11Jeff Pesta, LUTCF – Proactive Advisor Magazine – Volume 5 Issue 11
Jeff Pesta, LUTCF – Proactive Advisor Magazine – Volume 5 Issue 11
 
Morning tea 23 11-2016
Morning tea 23 11-2016Morning tea 23 11-2016
Morning tea 23 11-2016
 
Morning tea 01 08-2016
Morning tea 01 08-2016Morning tea 01 08-2016
Morning tea 01 08-2016
 

Viewers also liked

Central de joyas
Central de joyasCentral de joyas
Central de joyas
rafacer12
 
38745 aprendiendo a leer con las tic
38745 aprendiendo a leer con las tic38745 aprendiendo a leer con las tic
38745 aprendiendo a leer con las ticangelmanuel22
 
Unesco 2
Unesco 2Unesco 2
Unesco 2
yutende
 
Colegio nicolas esguerra
Colegio nicolas esguerraColegio nicolas esguerra
Colegio nicolas esguerraALVARO014
 
Fichas políticas (primer periodo)
Fichas políticas (primer periodo)Fichas políticas (primer periodo)
Fichas políticas (primer periodo)Natalia Rincon
 
M-Gov na prática: o case da Central de Atendimento 1746 no Rio de Janeiro | G...
M-Gov na prática: o case da Central de Atendimento 1746 no Rio de Janeiro | G...M-Gov na prática: o case da Central de Atendimento 1746 no Rio de Janeiro | G...
M-Gov na prática: o case da Central de Atendimento 1746 no Rio de Janeiro | G...
Lumis
 
Apresentacao Churchtech Expo
Apresentacao Churchtech ExpoApresentacao Churchtech Expo
Apresentacao Churchtech Expo
Gustavo Serafim
 
La buena palabra
La buena palabraLa buena palabra
La buena palabraDADY80
 
Tic´s en la docencia
Tic´s en la docenciaTic´s en la docencia
Tic´s en la docencia
Edith Mendez
 
Centro Eucaristia
Centro EucaristiaCentro Eucaristia
Centro Eucaristia
Adriano de Paula
 
Apresentacao Forum
Apresentacao ForumApresentacao Forum
Apresentacao Forum
Fórum Espírita
 

Viewers also liked (20)

Paulinho latino
Paulinho latinoPaulinho latino
Paulinho latino
 
Evolucion de la medicinayv
Evolucion de la medicinayvEvolucion de la medicinayv
Evolucion de la medicinayv
 
Sin título 1
Sin título 1Sin título 1
Sin título 1
 
Central de joyas
Central de joyasCentral de joyas
Central de joyas
 
Coelgio moda
Coelgio modaCoelgio moda
Coelgio moda
 
Emii
EmiiEmii
Emii
 
38745 aprendiendo a leer con las tic
38745 aprendiendo a leer con las tic38745 aprendiendo a leer con las tic
38745 aprendiendo a leer con las tic
 
Coelgio moda
Coelgio modaCoelgio moda
Coelgio moda
 
Unesco 2
Unesco 2Unesco 2
Unesco 2
 
Blog de prueba
Blog de pruebaBlog de prueba
Blog de prueba
 
Colegio nicolas esguerra
Colegio nicolas esguerraColegio nicolas esguerra
Colegio nicolas esguerra
 
Fichas políticas (primer periodo)
Fichas políticas (primer periodo)Fichas políticas (primer periodo)
Fichas políticas (primer periodo)
 
Fichas politicas
Fichas politicasFichas politicas
Fichas politicas
 
M-Gov na prática: o case da Central de Atendimento 1746 no Rio de Janeiro | G...
M-Gov na prática: o case da Central de Atendimento 1746 no Rio de Janeiro | G...M-Gov na prática: o case da Central de Atendimento 1746 no Rio de Janeiro | G...
M-Gov na prática: o case da Central de Atendimento 1746 no Rio de Janeiro | G...
 
Mundo Experto
Mundo ExpertoMundo Experto
Mundo Experto
 
Apresentacao Churchtech Expo
Apresentacao Churchtech ExpoApresentacao Churchtech Expo
Apresentacao Churchtech Expo
 
La buena palabra
La buena palabraLa buena palabra
La buena palabra
 
Tic´s en la docencia
Tic´s en la docenciaTic´s en la docencia
Tic´s en la docencia
 
Centro Eucaristia
Centro EucaristiaCentro Eucaristia
Centro Eucaristia
 
Apresentacao Forum
Apresentacao ForumApresentacao Forum
Apresentacao Forum
 

Similar to earnings_surprises

Investment Insights for September, 2017
Investment Insights for September, 2017Investment Insights for September, 2017
Investment Insights for September, 2017
Cornerstone Wealth Management MWP
 
Investment Insights - Is it a Good Time to Invest?
Investment Insights - Is it a Good Time to Invest?Investment Insights - Is it a Good Time to Invest?
Investment Insights - Is it a Good Time to Invest?
Mark Beckrich
 
Market Perspective February 2015
Market Perspective February 2015Market Perspective February 2015
Market Perspective February 2015
David Berger
 
Biegel Waller Investment Advisory March 2014 Commentary
Biegel Waller Investment Advisory March 2014 CommentaryBiegel Waller Investment Advisory March 2014 Commentary
Biegel Waller Investment Advisory March 2014 Commentary
David Berger
 
Market Perspectives - May 2019
Market Perspectives - May 2019Market Perspectives - May 2019
Market Perspectives - May 2019
Mark Biegel
 
Seasons earnings jan_18_13
Seasons earnings jan_18_13Seasons earnings jan_18_13
Seasons earnings jan_18_13
theretirementengineer
 
Tamohara investment newsletter September 2015
Tamohara investment newsletter  September 2015Tamohara investment newsletter  September 2015
Tamohara investment newsletter September 2015
tamohara
 
New Market Highs and Positive Expected Returns
New Market Highs and Positive Expected ReturnsNew Market Highs and Positive Expected Returns
New Market Highs and Positive Expected Returns
Kenneth Baer, CFP®
 
Market Perspective March 2016
Market Perspective March 2016Market Perspective March 2016
Market Perspective March 2016
David Berger
 
Market Perspective May 2016
Market Perspective  May 2016Market Perspective  May 2016
Market Perspective May 2016
David Berger
 
New market highs and positive expected returns
New market highs and positive expected returnsNew market highs and positive expected returns
New market highs and positive expected returns
Mark Stern
 
2016Q1 SCFG Commentary with Snapshot
2016Q1 SCFG Commentary with Snapshot2016Q1 SCFG Commentary with Snapshot
2016Q1 SCFG Commentary with SnapshotDrew Beja
 
Rules of Thumb for a Volatile Market
Rules of Thumb for a Volatile MarketRules of Thumb for a Volatile Market
Rules of Thumb for a Volatile Market
Marqus J Freeman
 
Indian economic growth and share market
Indian economic growth and share marketIndian economic growth and share market
Indian economic growth and share market
Saloni Pandit
 
Avant garde wealth mgmt - Quarterly letter - 1306
Avant garde wealth mgmt - Quarterly letter - 1306Avant garde wealth mgmt - Quarterly letter - 1306
Avant garde wealth mgmt - Quarterly letter - 1306
Gaurav Jalan
 
Investment Insights for August, 2017
Investment Insights for August, 2017Investment Insights for August, 2017
Investment Insights for August, 2017
Cornerstone Wealth Management MWP
 
Investment Insights - Expectations for Capital Market Returns
Investment Insights - Expectations for Capital Market ReturnsInvestment Insights - Expectations for Capital Market Returns
Investment Insights - Expectations for Capital Market Returns
Mark Beckrich
 
Market Perspectives - November 2019
Market Perspectives - November 2019Market Perspectives - November 2019
Market Perspectives - November 2019
Mark Biegel
 
Certitude Global Investing Insights - May 2013
Certitude Global Investing Insights - May 2013Certitude Global Investing Insights - May 2013
Certitude Global Investing Insights - May 2013
certitudeglobal
 

Similar to earnings_surprises (20)

Investment Insights for September, 2017
Investment Insights for September, 2017Investment Insights for September, 2017
Investment Insights for September, 2017
 
Investment Insights - Is it a Good Time to Invest?
Investment Insights - Is it a Good Time to Invest?Investment Insights - Is it a Good Time to Invest?
Investment Insights - Is it a Good Time to Invest?
 
Market Perspective February 2015
Market Perspective February 2015Market Perspective February 2015
Market Perspective February 2015
 
Biegel Waller Investment Advisory March 2014 Commentary
Biegel Waller Investment Advisory March 2014 CommentaryBiegel Waller Investment Advisory March 2014 Commentary
Biegel Waller Investment Advisory March 2014 Commentary
 
Market Perspectives - May 2019
Market Perspectives - May 2019Market Perspectives - May 2019
Market Perspectives - May 2019
 
Seasons earnings jan_18_13
Seasons earnings jan_18_13Seasons earnings jan_18_13
Seasons earnings jan_18_13
 
Tamohara investment newsletter September 2015
Tamohara investment newsletter  September 2015Tamohara investment newsletter  September 2015
Tamohara investment newsletter September 2015
 
New Market Highs and Positive Expected Returns
New Market Highs and Positive Expected ReturnsNew Market Highs and Positive Expected Returns
New Market Highs and Positive Expected Returns
 
Market Perspective March 2016
Market Perspective March 2016Market Perspective March 2016
Market Perspective March 2016
 
May 8th
May 8thMay 8th
May 8th
 
Market Perspective May 2016
Market Perspective  May 2016Market Perspective  May 2016
Market Perspective May 2016
 
New market highs and positive expected returns
New market highs and positive expected returnsNew market highs and positive expected returns
New market highs and positive expected returns
 
2016Q1 SCFG Commentary with Snapshot
2016Q1 SCFG Commentary with Snapshot2016Q1 SCFG Commentary with Snapshot
2016Q1 SCFG Commentary with Snapshot
 
Rules of Thumb for a Volatile Market
Rules of Thumb for a Volatile MarketRules of Thumb for a Volatile Market
Rules of Thumb for a Volatile Market
 
Indian economic growth and share market
Indian economic growth and share marketIndian economic growth and share market
Indian economic growth and share market
 
Avant garde wealth mgmt - Quarterly letter - 1306
Avant garde wealth mgmt - Quarterly letter - 1306Avant garde wealth mgmt - Quarterly letter - 1306
Avant garde wealth mgmt - Quarterly letter - 1306
 
Investment Insights for August, 2017
Investment Insights for August, 2017Investment Insights for August, 2017
Investment Insights for August, 2017
 
Investment Insights - Expectations for Capital Market Returns
Investment Insights - Expectations for Capital Market ReturnsInvestment Insights - Expectations for Capital Market Returns
Investment Insights - Expectations for Capital Market Returns
 
Market Perspectives - November 2019
Market Perspectives - November 2019Market Perspectives - November 2019
Market Perspectives - November 2019
 
Certitude Global Investing Insights - May 2013
Certitude Global Investing Insights - May 2013Certitude Global Investing Insights - May 2013
Certitude Global Investing Insights - May 2013
 

earnings_surprises

  • 1. Investors Should Be Wary Of Trading On Positive/Negative Earnings Surprises Alone Global equity investors are correct to closely follow the quarterly corporate earnings cycle, since in the end it is current reported, and more importantly, expected future earnings growth that drives market psychology and the direction of stocks over the intermediate to long-run, in our opinion. Put another way, where the outlook for profitability and the outlook for the direction of the stock market is concerned, as we like to say, "you can't really know where you are going unless you know where you have been." As companies report their results, the focus very often becomes whether companies beat, missed, or met their consensus earnings "number." But are investors well-advised to invest or even trade on reported quarterly earnings based on whether any given company was able to "beat the Street" in any given particular quarter? The Global Markets Intelligence (GMI) team at S&P Capital IQ decided to investigate this question, and determined the following: • We believe that earnings surprise, a widely followed indicator of company performance, should not be used as the sole basis for either trading or investing decisions. • We show that positive earnings surprises, as a basis for trading, has not produced higher excess returns in recent years for S&P 500 or S&P 600 index member stocks. • Likewise, using negative earnings surprise as a basis for selling shares does not result in underperformance versus the market for either index. • However, on a qualitative basis, we view earnings surprise as a good indicator of a company's ability (or inability) to generate earnings in excess of expectations, and hence of the general health of a company's operations, especially when a company is able to post a string of positive surprises (or when a company is consistently unable to meet estimates and posts a series of negative surprises). • In addition, we'd suggest that when evaluating performance, investors consider earnings surprise within the context of earnings growth. A modestly negative surprise or two within a strong earnings growth trend is not necessarily fatal in our view, while a slightly positive surprise with earnings per share (EPS) declining is not necessarily a call for celebration. • Further, as with much in the market, moderation is often a good thing: a string of moderate earnings surprises amid moderate earnings growth can often mark a stable and sustainable earnings growth trajectory for a company--and one that might well be profitable to the Market Intellect from Global Markets Intelligence July 2, 2014 Robert A Keiser Vice President Global Markets Intelligence (1) 212-438-3540 robert.keiser@spcapitaliq.com Jaseem Hasib Vice President, Quantitative Research Global Markets Intelligence (1) 212-438-1158 jaseem.hasib@spcapitaliq.com This report was prepared by the S&P Capital IQ Global Markets Intelligence group. This group is analytically and editorially independent from any other analytical group at S&P. The objective of this group is to provide unique financial intelligence by analyzing relationships across multiple asset classes and markets. Enabled with cutting-edge S&P Capital IQ and third-party applications and data, the group offers investors valuable new sources for alpha discovery and "out-of-the-box" thinking through robust data exploration and analysis. The research provides investors with actionable and topical market perspectives that can offer innovative ways to leverage credit and risk intelligence. 1341026 | 301116611
  • 2. investor, given attractive valuations. Can investors outperform the broader market by reacting to earnings surprises? Looking at the S&P 500 and S&P 600 indexes, the answer to the above question seems clear based on the empirical data. In aggregate and over an extended period, companies that report positive earnings surprises do not subsequently see their stocks outperform the market, and stocks that surprise negatively, conversely, do not underperform. However, our time-series analysis reveals that earnings surprises have previously helped generate alpha, but the correlation has ceased to exist since the year 2000, presumably as investors have become smarter and more efficient in evaluating the sustainability and true value of earnings surprises. Methodology EPS estimates and actual analyst-adjusted values were gathered for S&P 500 companies on a quarterly basis from 1987 through early 2014. The consensus estimate was compared with the actual "operating" earnings, as reported by the company, to define the earnings surprise. Companies with the highest positive surprises were placed into quintile one (Q1) and those with the highest negative surprises were placed in quintile five (Q5). Analysis The monthly returns of the five quintile-based portfolios are presented in Chart 1, arranged from highest positive surprise (Q1) to highest negative surprise (Q5). Portfolios are rebalanced monthly, and forward returns are calculated for the succeeding month. The blue bars represent performance results (total returns) from March 1987 to September 2000. Note that companies with the highest earnings surprises did outperform the S&P 500 by a 4.2% annual average over this period. Likewise, the companies with the highest negative earnings surprises over the 1987-2000 period underperformed the S&P 500 by 2.9% on average. However, beginning in September 2000, the relationship between earnings surprise and stock performance changes dramatically. The yellow bars represent results from September 2000 to March 2014. Over this period, companies with the highest positive earnings surprises (Q1) underperform the S&P 500 by 2.4% on average and those with the highest negative surprises (Q5) outperform by 2.3% on average. Note: "Active" returns mean total returns (with dividends reinvested) in excess of an index benchmark, which is the S&P 500 in this case. Investors Should Be Wary Of Trading On Positive/Negative Earnings Surprises Alone Market Intellect from Global Markets Intelligence 2 July 2, 2014 1341026 | 301116611
  • 3. Chart 1 What happened in 2000 to effect this change? While numerous factors likely contributed, we believe a significant influence is Regulation FD, which was enacted by the Securities and Exchange Commission on August 15, 2000 (the rule took effect in October 2000). FD stands for Fair Disclosure, and the rule states that anytime a company discloses material non-public information to stock analysts or large investors, the company must also publicly disclose that information. Basically, Regulation FD helped level the playing field, with regard to information access, between market professionals and the public, in our opinion. We believe the effect of Regulation FD on earnings surprise was that company data that was once available to relatively few individuals then became much more widely available and distributed to the investing public, and hence, the prospect of earnings surprises became more widely anticipated and thus priced into security valuation. In looking over the data for fourth-quarter 2013 earnings season for the S&P 500 companies, a few patterns become apparent: Some earnings reports indeed take the market by surprise, but are quickly discounted in the stock price--and hence are not tradable by the average investor: • Caterpillar Inc. reported a 23% positive surprise in January--the stock rose 6% the day of the surprise and about 3% in the four following days, but then underperformed the market. • Homebuilder DR Horton Inc. reported a 24% positive surprise in January--the stock rose 10% that day and 2% over Investors Should Be Wary Of Trading On Positive/Negative Earnings Surprises Alone Market Intellect from Global Markets Intelligence 3 July 2, 2014 1341026 | 301116611
  • 4. the following three days, but then became a market performer. Some earnings reports result in "surprises" that are ignored by the market--other factors are deemed more significant (e.g., forward guidance). • Vertex Pharmaceuticals Inc. reported a 144% positive surprise in late January--the stock rose 4% on the day, but underperformed the S&P 500 by 2% in February and 13% in March. • Broadcom Corp. reported a 5% surprise in late January--the stock rose 2% on the day, but then underperformed for the month of February. Sometimes positive earnings surprises result in a pop in the stock price on the day of earnings followed by continued outperformance. Although this type of surprise is tradable, we don't see a good way for the average investor to differentiate it from other types of EPS surprise. • Eastman Chemical Co. reported an 8% positive surprise in late January, rose 3% on the day, and outperformed the market by 8% in February. • Wynn Resorts Ltd. reported a 31% positive surprise in late January--the stock rose 4% on the day and outperformed by 9% in February and 9% in March. A positive surprise is sometimes met by investor selling, but the stock is then reevaluated, turns around and rises strongly. Again, we see no easy way to tell when this will occur. Also, it is possible that factors other than the surprise are driving the turnaround in the stock. • Phillips 66 reported a 26% positive surprise in late January and the stock declined for five days. It then went on to outperform the S&P 500 by 2% in both February and March. • KLA-Tencor Corp. reported a 6% positive surprise on January 23.The stock fell by 6% over the following several days, but then outperformed by 2% in February and 5% in March. In sum, for the S&P 500, positive earnings surprises are generally a sign that things are progressing well for the company, but, profiting from the earnings surprise alone is difficult. Even for small cap stocks, earnings surprise alone as a strategy has been a tough one in recent years. Chart 2 shows active returns by earnings surprise quintile for the S&P 600. (Active returns mean returns in excess of the S&P 600 index average) From 1994 (index inception) until April 2006, the earnings surprise strategy worked very well for S&P 600 companies (blue bars). However, the strategy stopped working (or worked in reverse) from that point until the present. We believe that, like the S&P 500 stocks, the S&P 600 stocks became more efficient at discounting positive and negative news over time. Note: Results for the S&P 400 were very similar to S&P 500 results, with outperformance by the top quintile (highest earnings surprise) ending in August 2000. Due to this similarity we have not presented S&P 400 results here. Investors Should Be Wary Of Trading On Positive/Negative Earnings Surprises Alone Market Intellect from Global Markets Intelligence 4 July 2, 2014 1341026 | 301116611
  • 5. Chart 2 Contact Information: Richard Tortoriello, Director, Quantitative Research—Global Markets Intelligence, Richard_Tortoriello@spcapitaliq.com Investors Should Be Wary Of Trading On Positive/Negative Earnings Surprises Alone Market Intellect from Global Markets Intelligence 5 July 2, 2014 1341026 | 301116611
  • 6. S&P may receive compensation for its ratings and certain analyses, normally from issuers or underwriters of securities or from obligors. S&P reserves the right to disseminate its opinions and analyses. S&P's public ratings and analyses are made available on its Web sites, www.standardandpoors.com (free of charge), and www.ratingsdirect.com and www.globalcreditportal.com (subscription) and www.spcapitaliq.com (subscription) and may be distributed through other means, including via S&P publications and third- party redistributors. Additional information about our ratings fees is available at www.standardandpoors.com/usratingsfees. S&P keeps certain activities of its business units separate from each other in order to preserve the independence and objectivity of their respective activities. As a result, certain business units of S&P may have information that is not available to other S&P business units. S&P has established policies and procedures to maintain the confidentiality of certain nonpublic information received in connection with each analytical process. To the extent that regulatory authorities allow a rating agency to acknowledge in one jurisdiction a rating issued in another jurisdiction for certain regulatory purposes, S&P reserves the right to assign, withdraw, or suspend such acknowledgement at any time and in its sole discretion. S&P Parties disclaim any duty whatsoever arising out of the assignment, withdrawal, or suspension of an acknowledgment as well as any liability for any damage alleged to have been suffered on account thereof. Credit-related and other analyses, including ratings, and statements in the Content are statements of opinion as of the date they are expressed and not statements of fact. S&P's opinions, analyses, and rating acknowledgment decisions (described below) are not recommendations to purchase, hold, or sell any securities or to make any investment decisions, and do not address the suitability of any security. S&P assumes no obligation to update the Content following publication in any form or format. The Content should not be relied on and is not a substitute for the skill, judgment and experience of the user, its management, employees, advisors and/or clients when making investment and other business decisions. S&P does not act as a fiduciary or an investment advisor except where registered as such. While S&P has obtained information from sources it believes to be reliable, S&P does not perform an audit and undertakes no duty of due diligence or independent verification of any information it receives. No content (including ratings, credit-related analyses and data, model, software or other application or output therefrom) or any part thereof (Content) may be modified, reverse engineered, reproduced or distributed in any form by any means, or stored in a database or retrieval system, without the prior written permission of Standard & Poor's Financial Services LLC or its affiliates (collectively, S&P). The Content shall not be used for any unlawful or unauthorized purposes. S&P and any third-party providers, as well as their directors, officers, shareholders, employees or agents (collectively S&P Parties) do not guarantee the accuracy, completeness, timeliness or availability of the Content. S&P Parties are not responsible for any errors or omissions (negligent or otherwise), regardless of the cause, for the results obtained from the use of the Content, or for the security or maintenance of any data input by the user. The Content is provided on an "as is" basis. S&P PARTIES DISCLAIM ANY AND ALL EXPRESS OR IMPLIED WARRANTIES, INCLUDING, BUT NOT LIMITED TO, ANY WARRANTIES OF MERCHANTABILITY OR FITNESS FOR A PARTICULAR PURPOSE OR USE, FREEDOM FROM BUGS, SOFTWARE ERRORS OR DEFECTS, THAT THE CONTENT'S FUNCTIONING WILL BE UNINTERRUPTED, OR THAT THE CONTENT WILL OPERATE WITH ANY SOFTWARE OR HARDWARE CONFIGURATION. In no event shall S&P Parties be liable to any party for any direct, indirect, incidental, exemplary, compensatory, punitive, special or consequential damages, costs, expenses, legal fees, or losses (including, without limitation, lost income or lost profits and opportunity costs or losses caused by negligence) in connection with any use of the Content even if advised of the possibility of such damages. This report was prepared by the S&P Capital IQ Global Markets Intelligence group. This group is analytically and editorially independent from any other analytical group at S&P. Copyright © 2016 Standard & Poor's Financial Services LLC, a part of McGraw Hill Financial. All rights reserved. 6 July 2, 2014 1341026 | 301116611