Download as PDF, PPTX


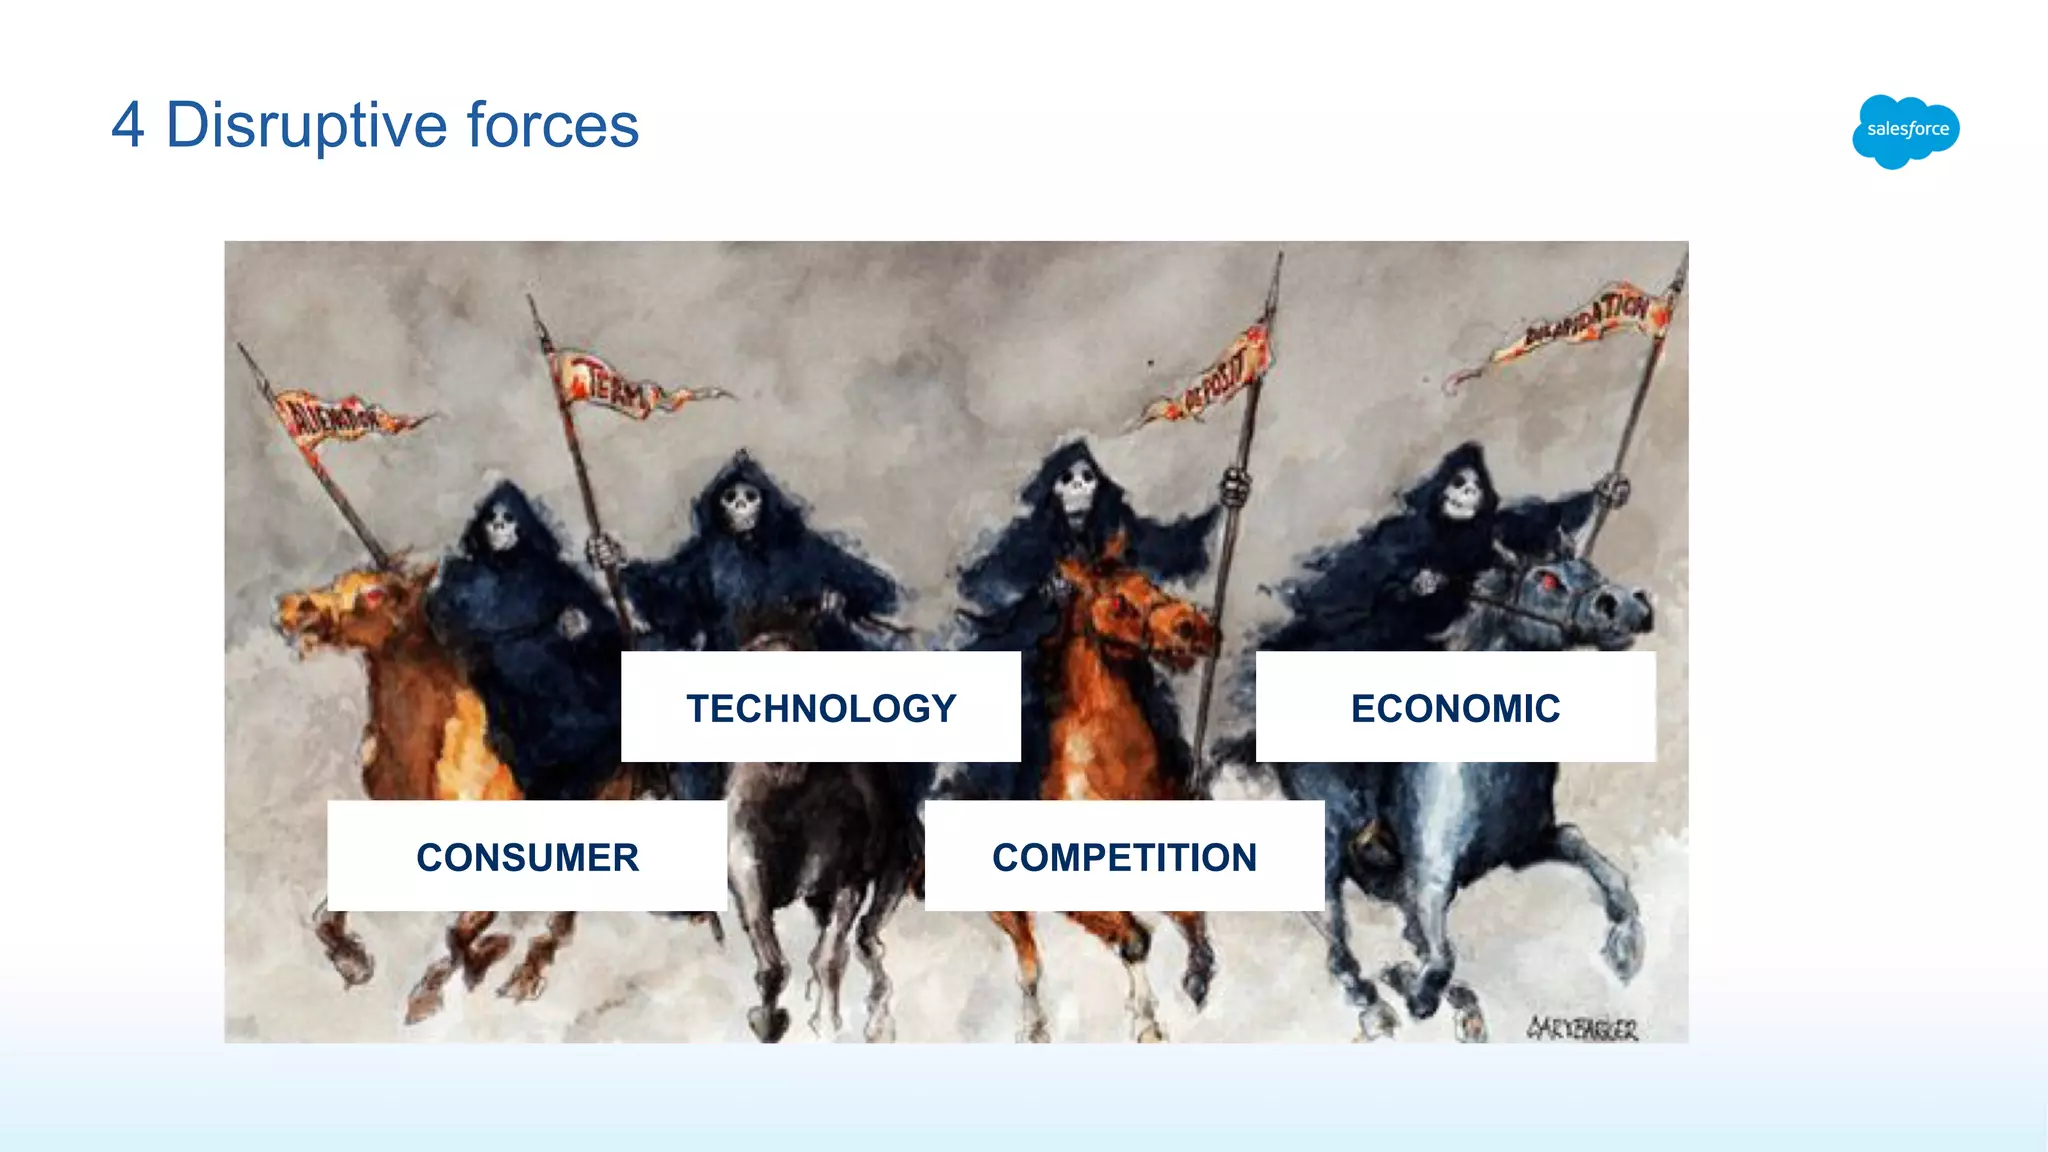

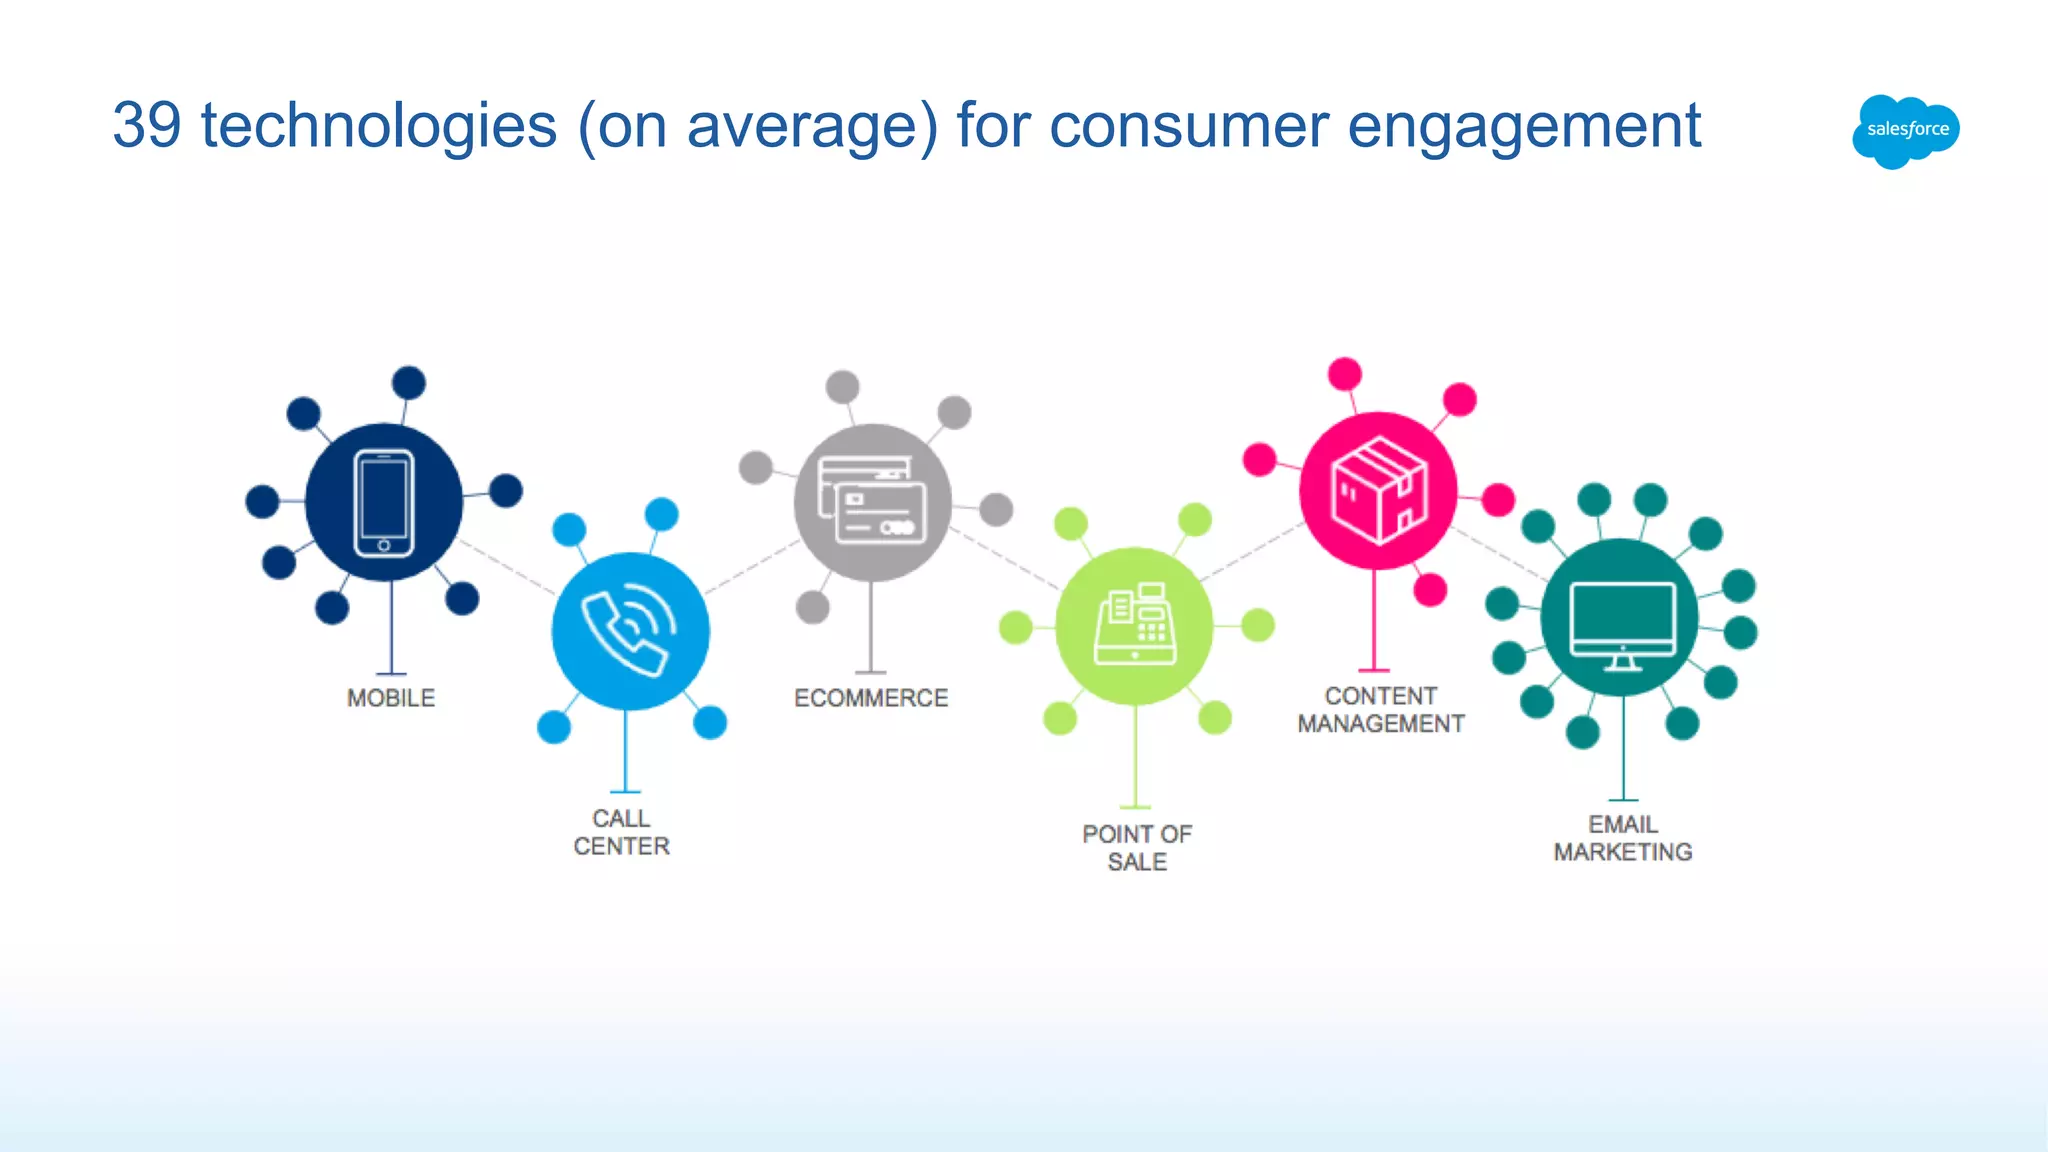
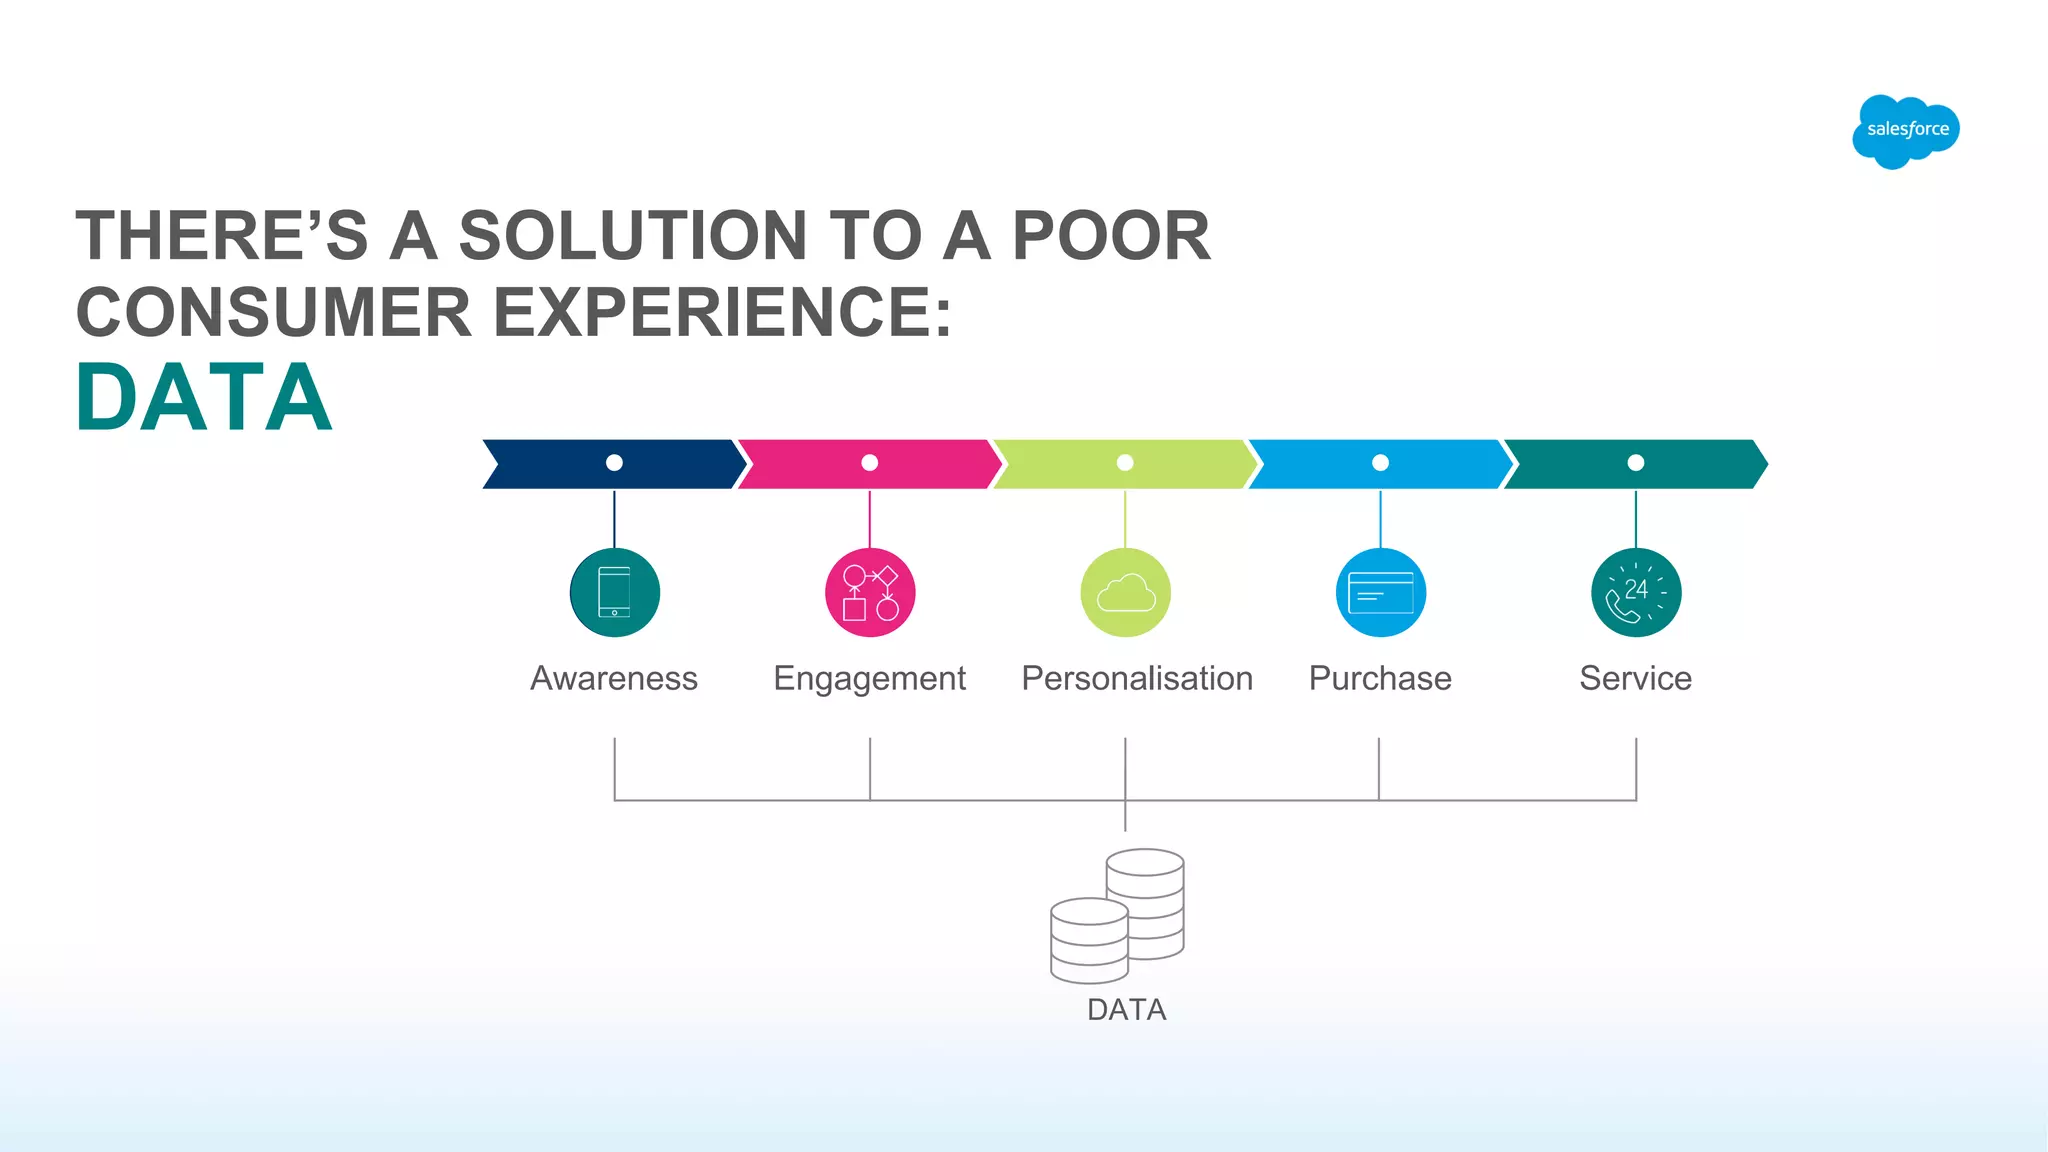
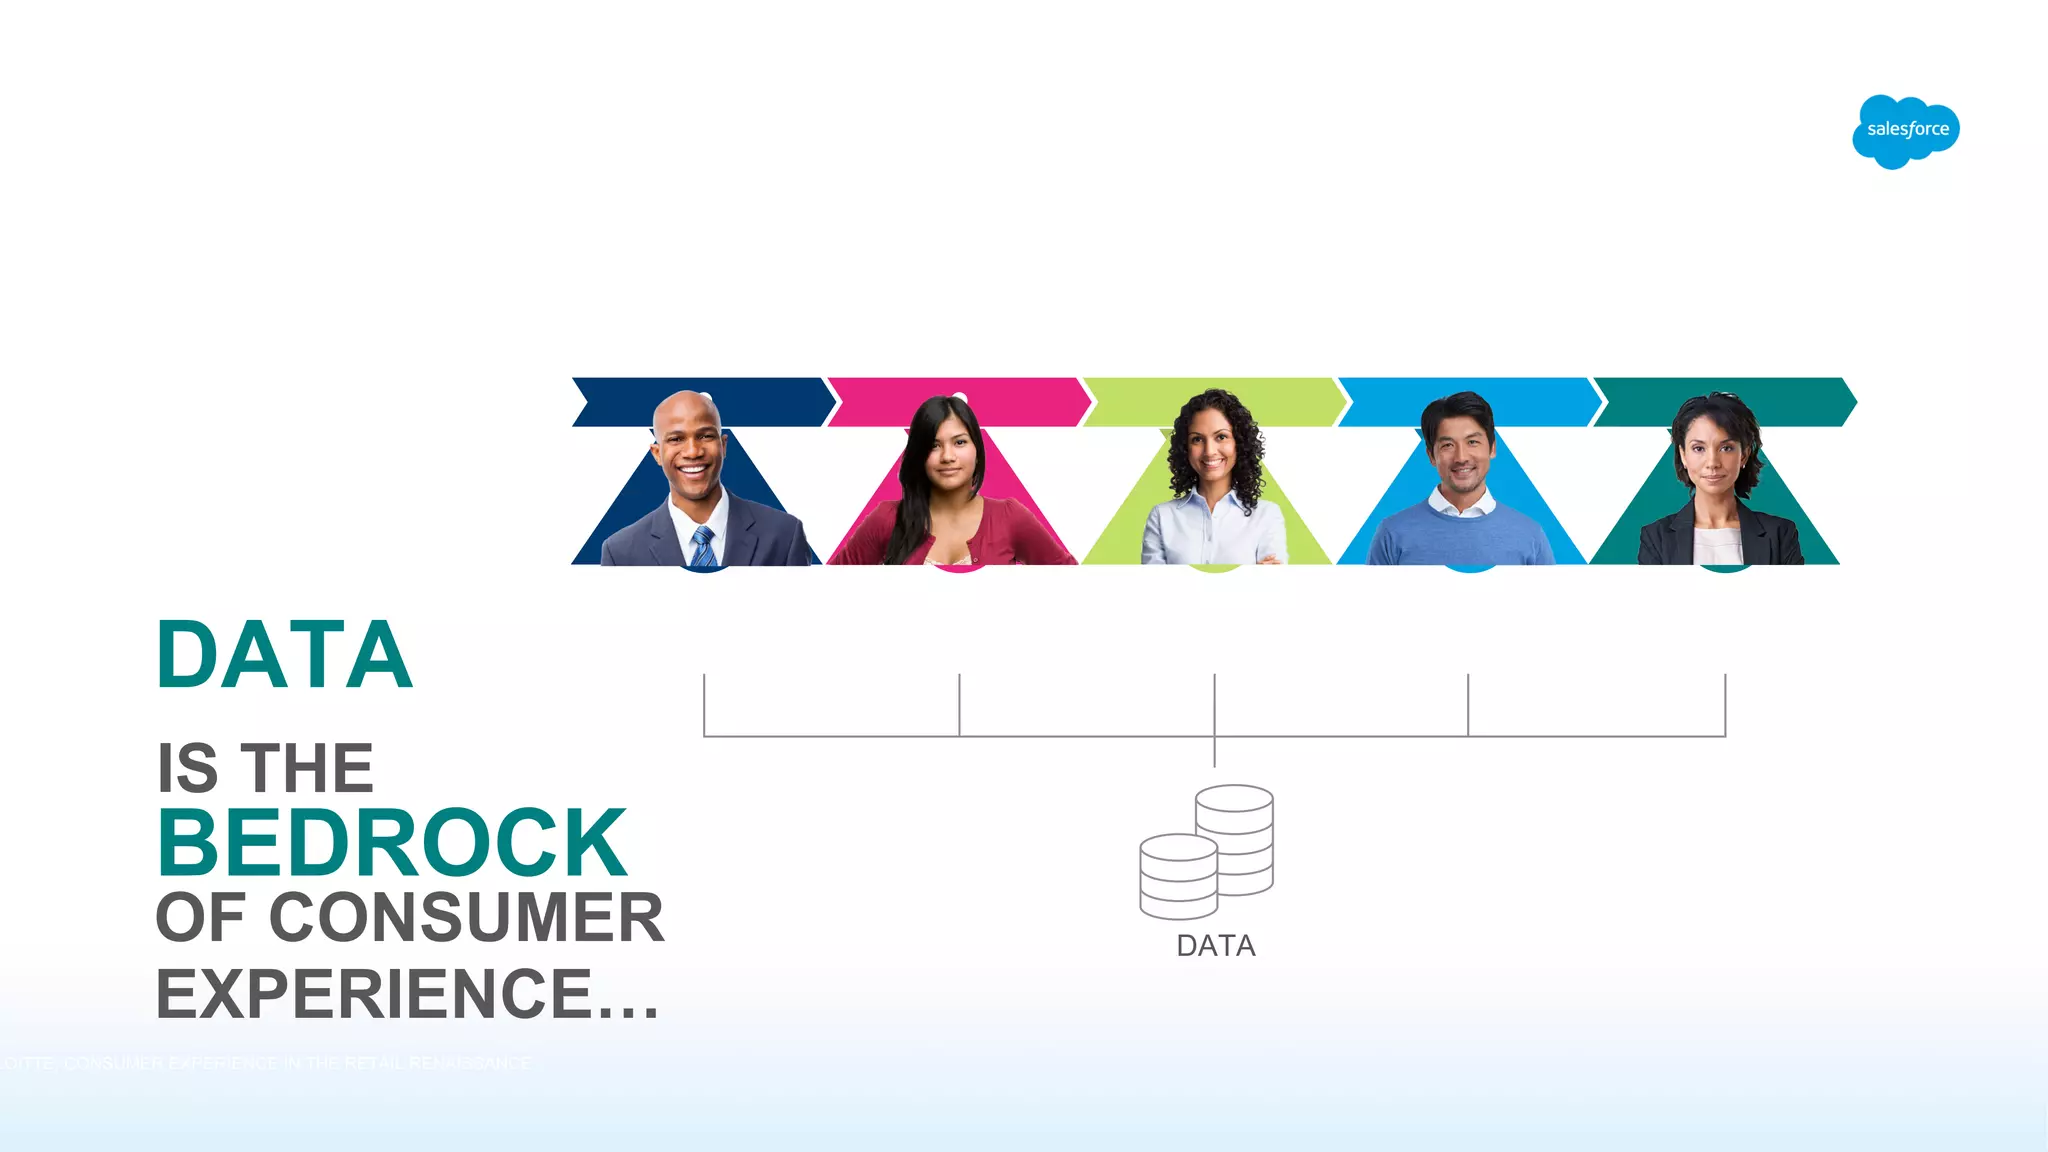
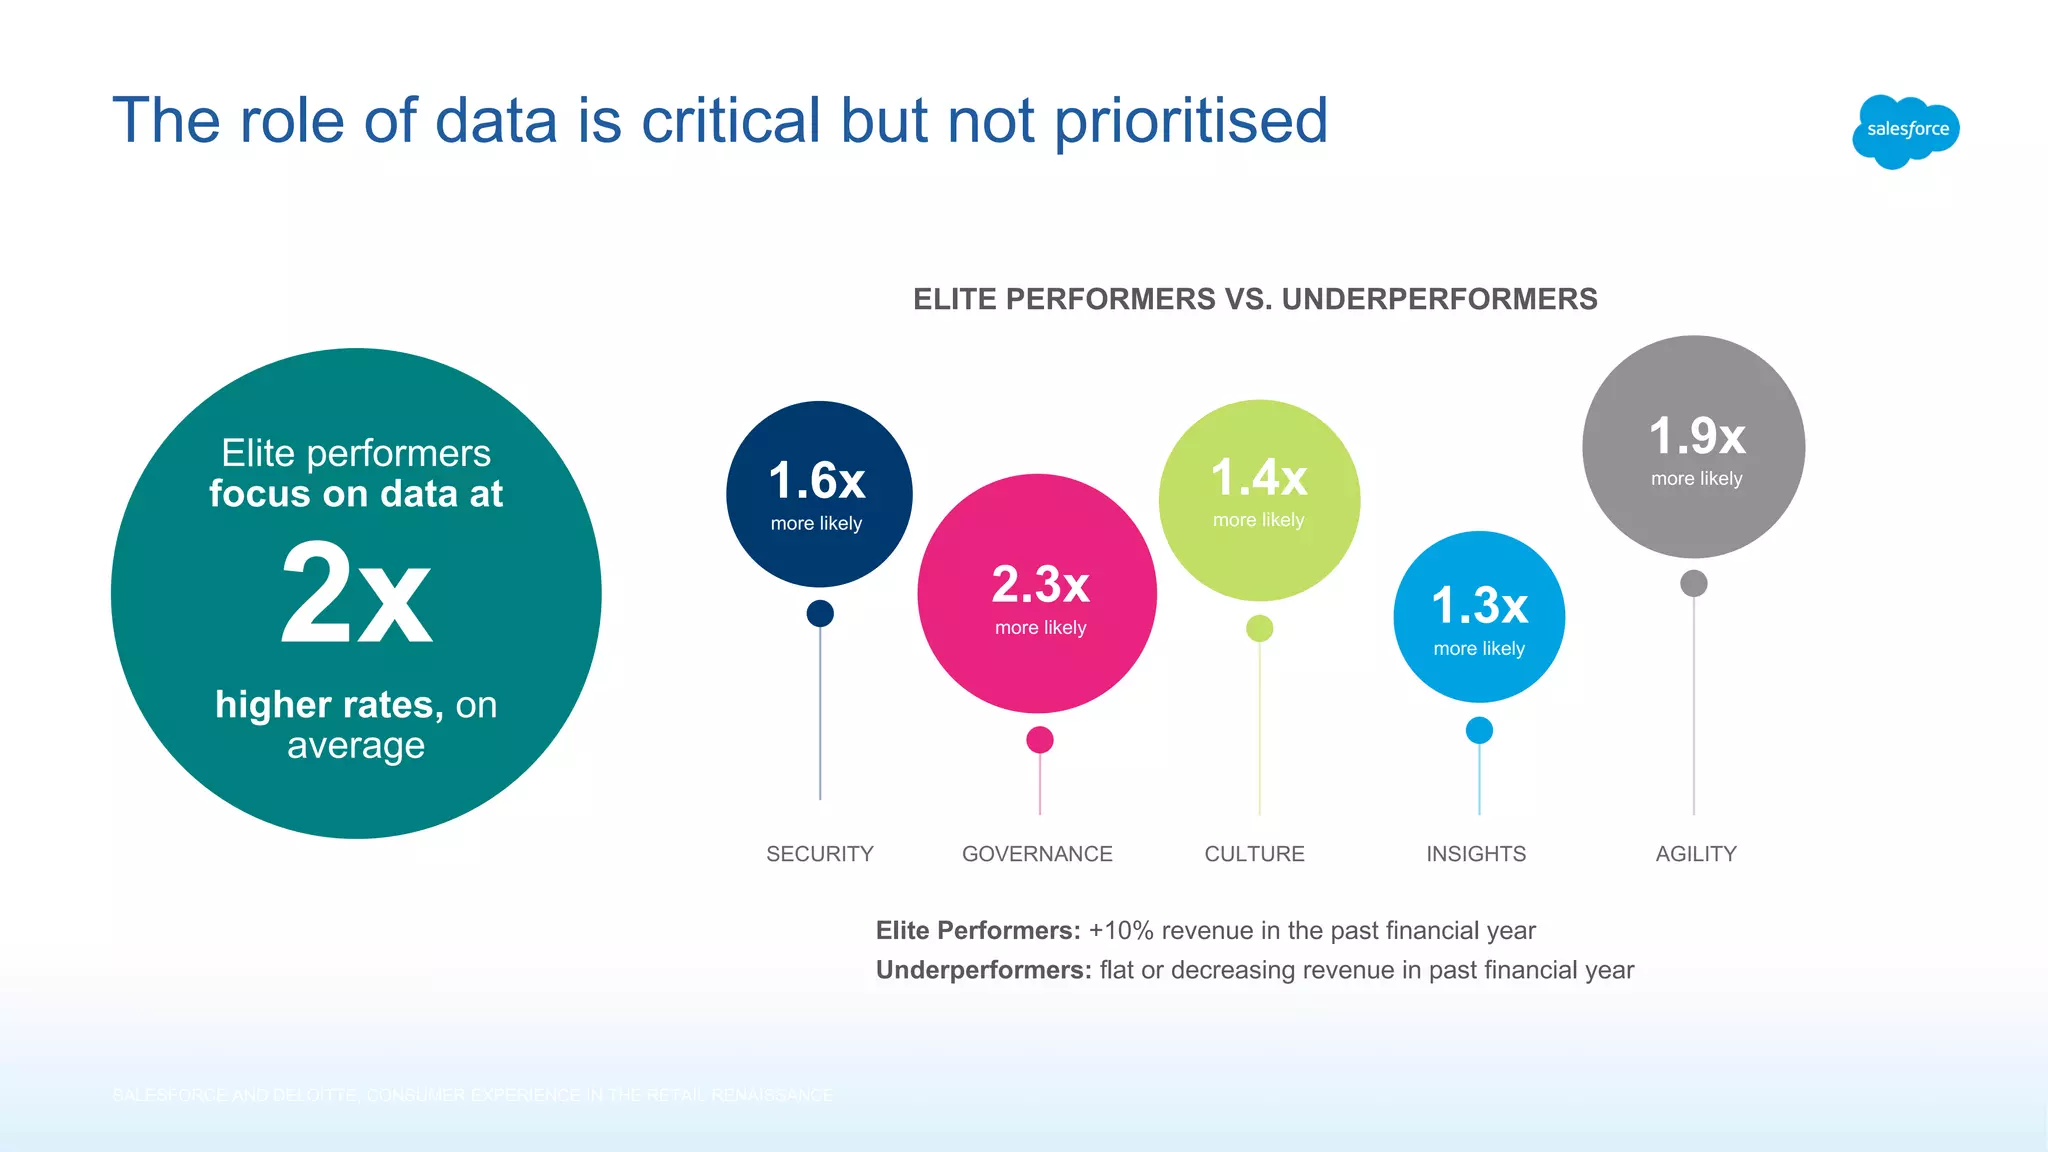
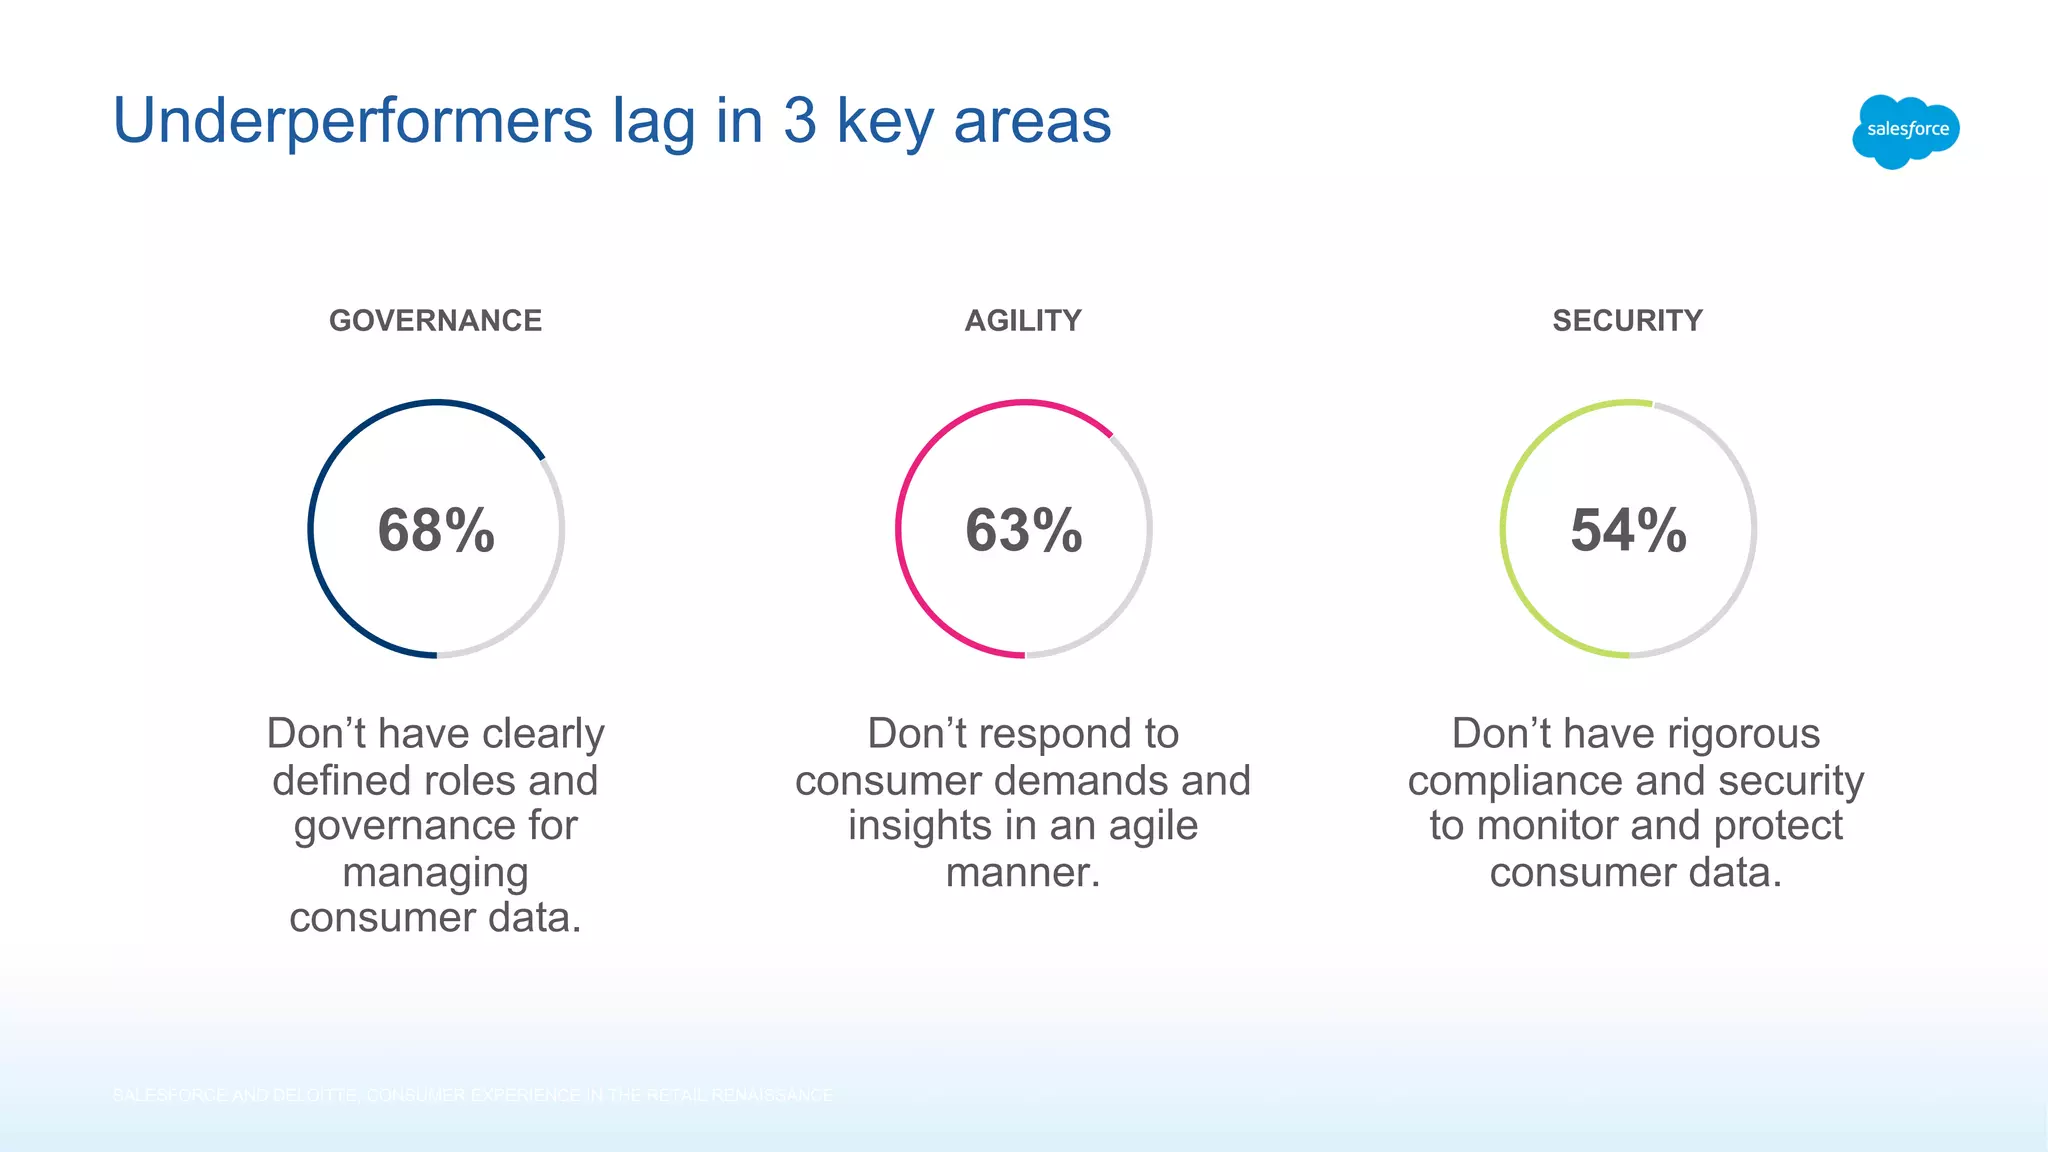


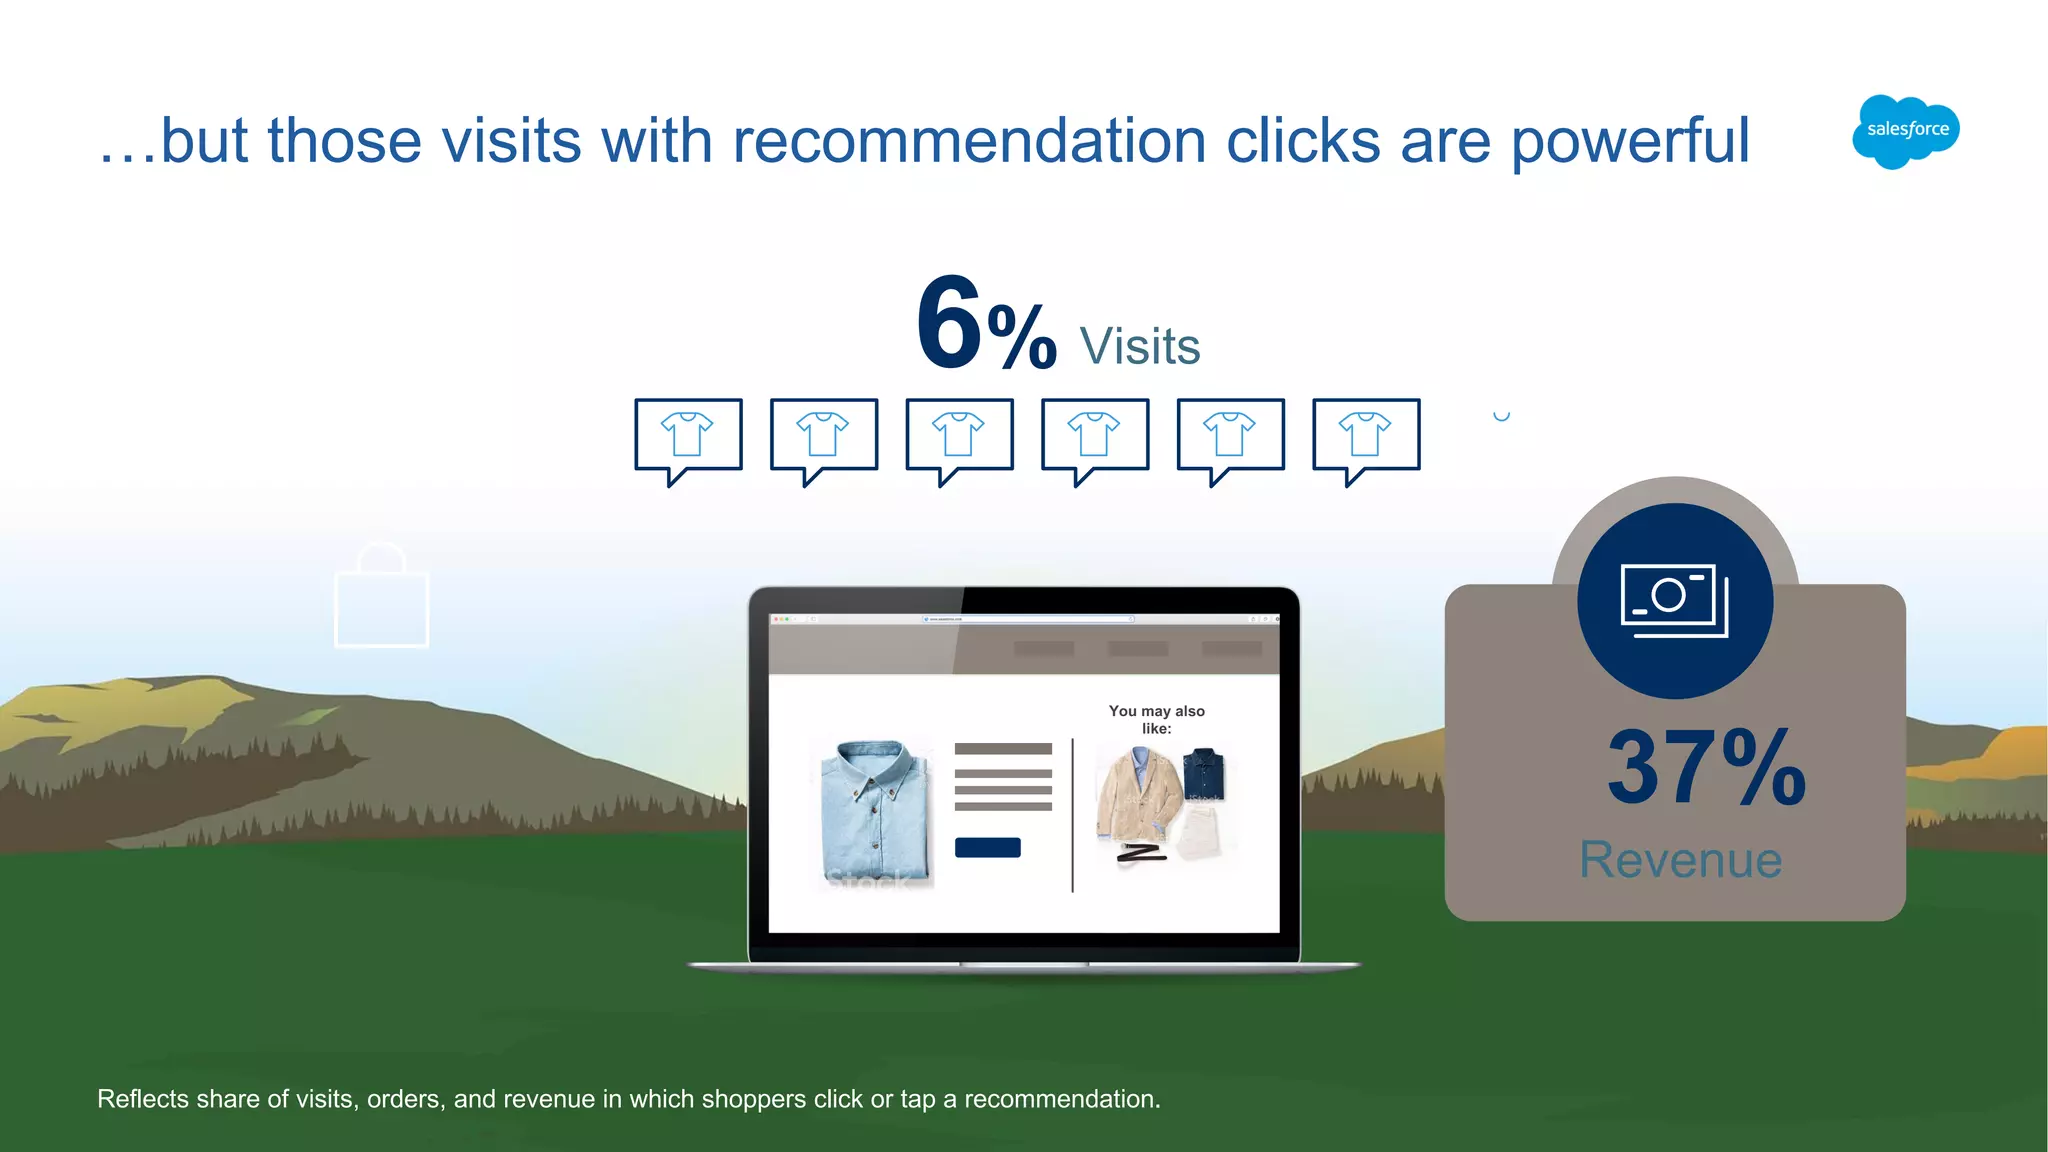
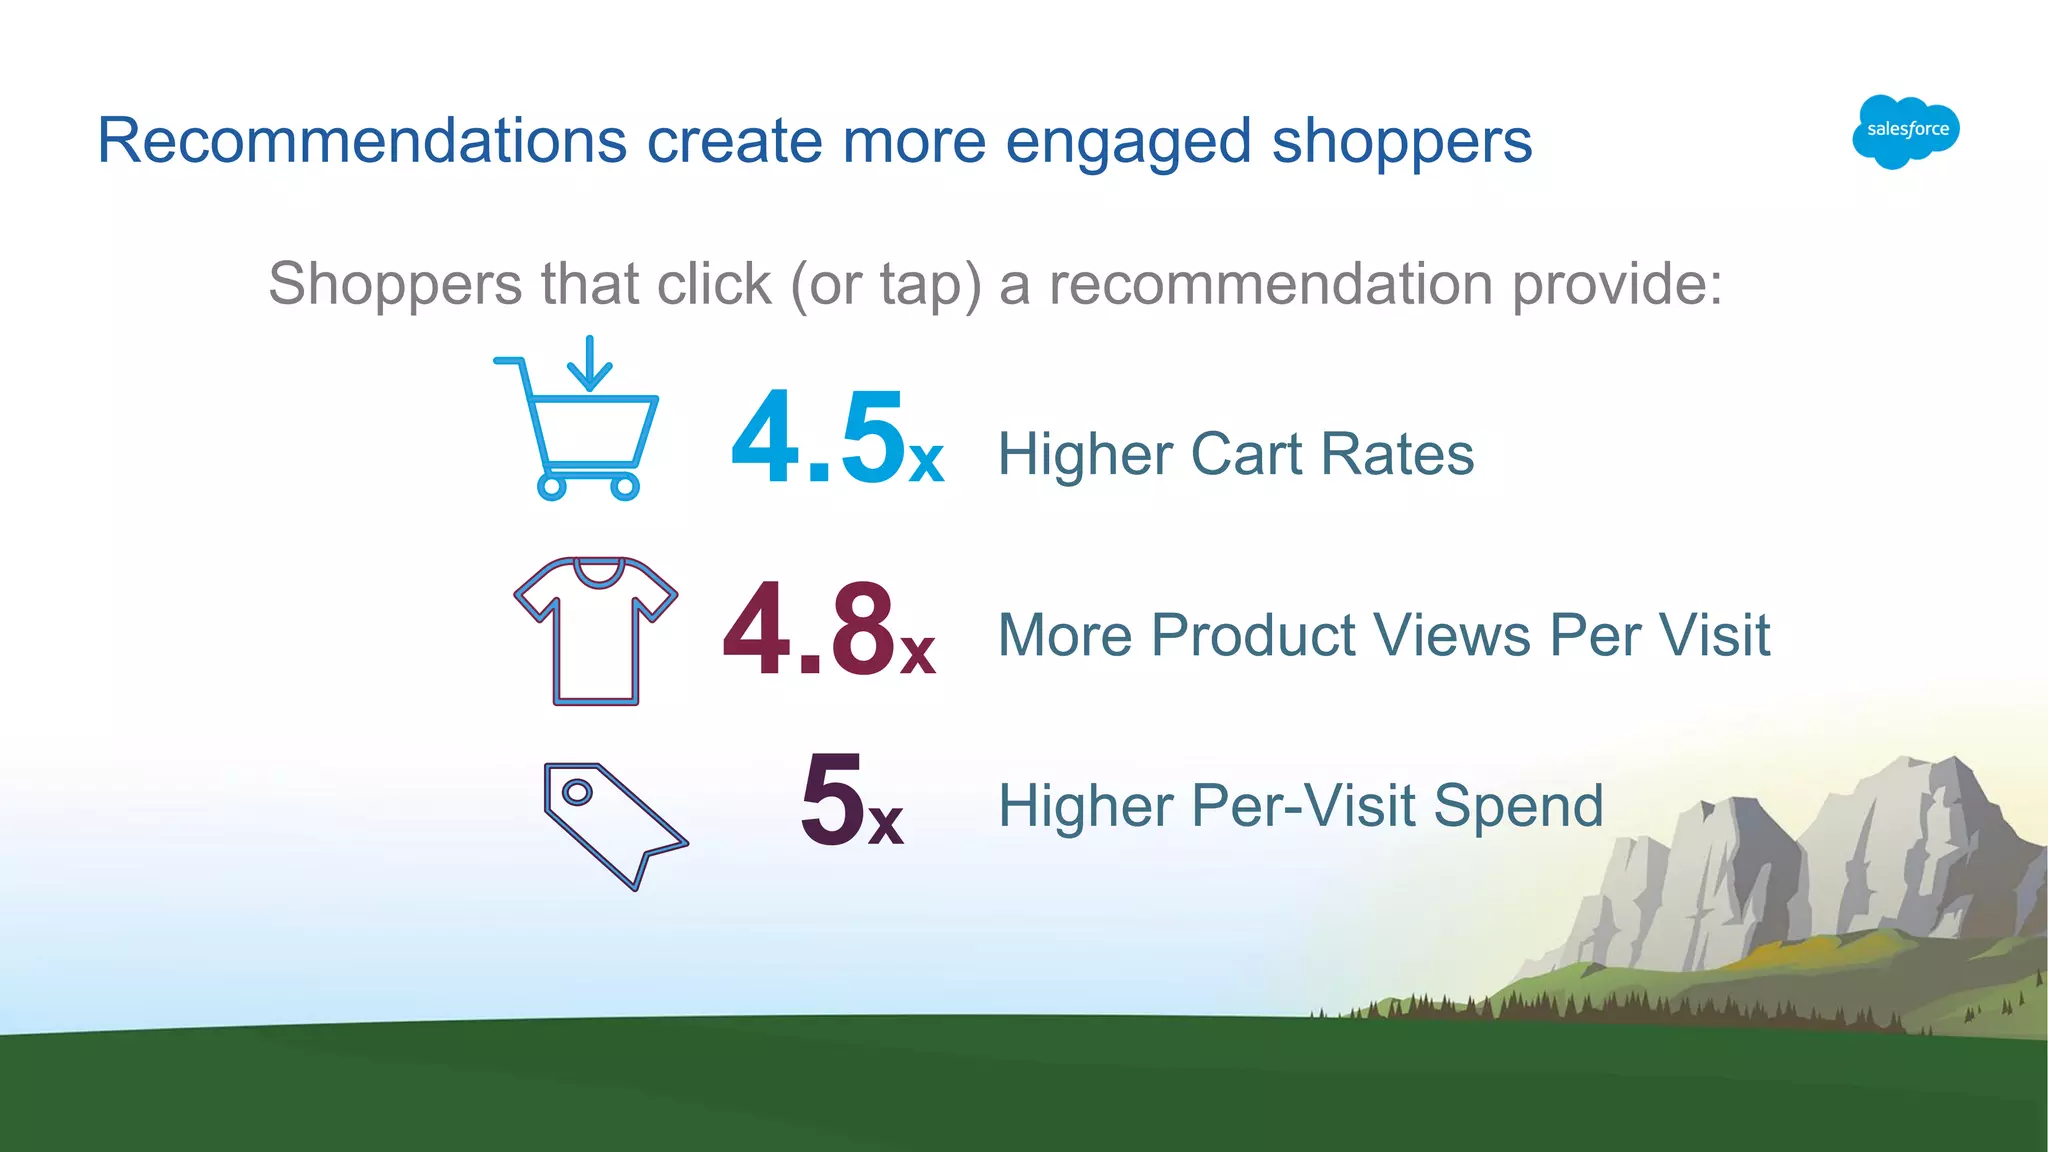

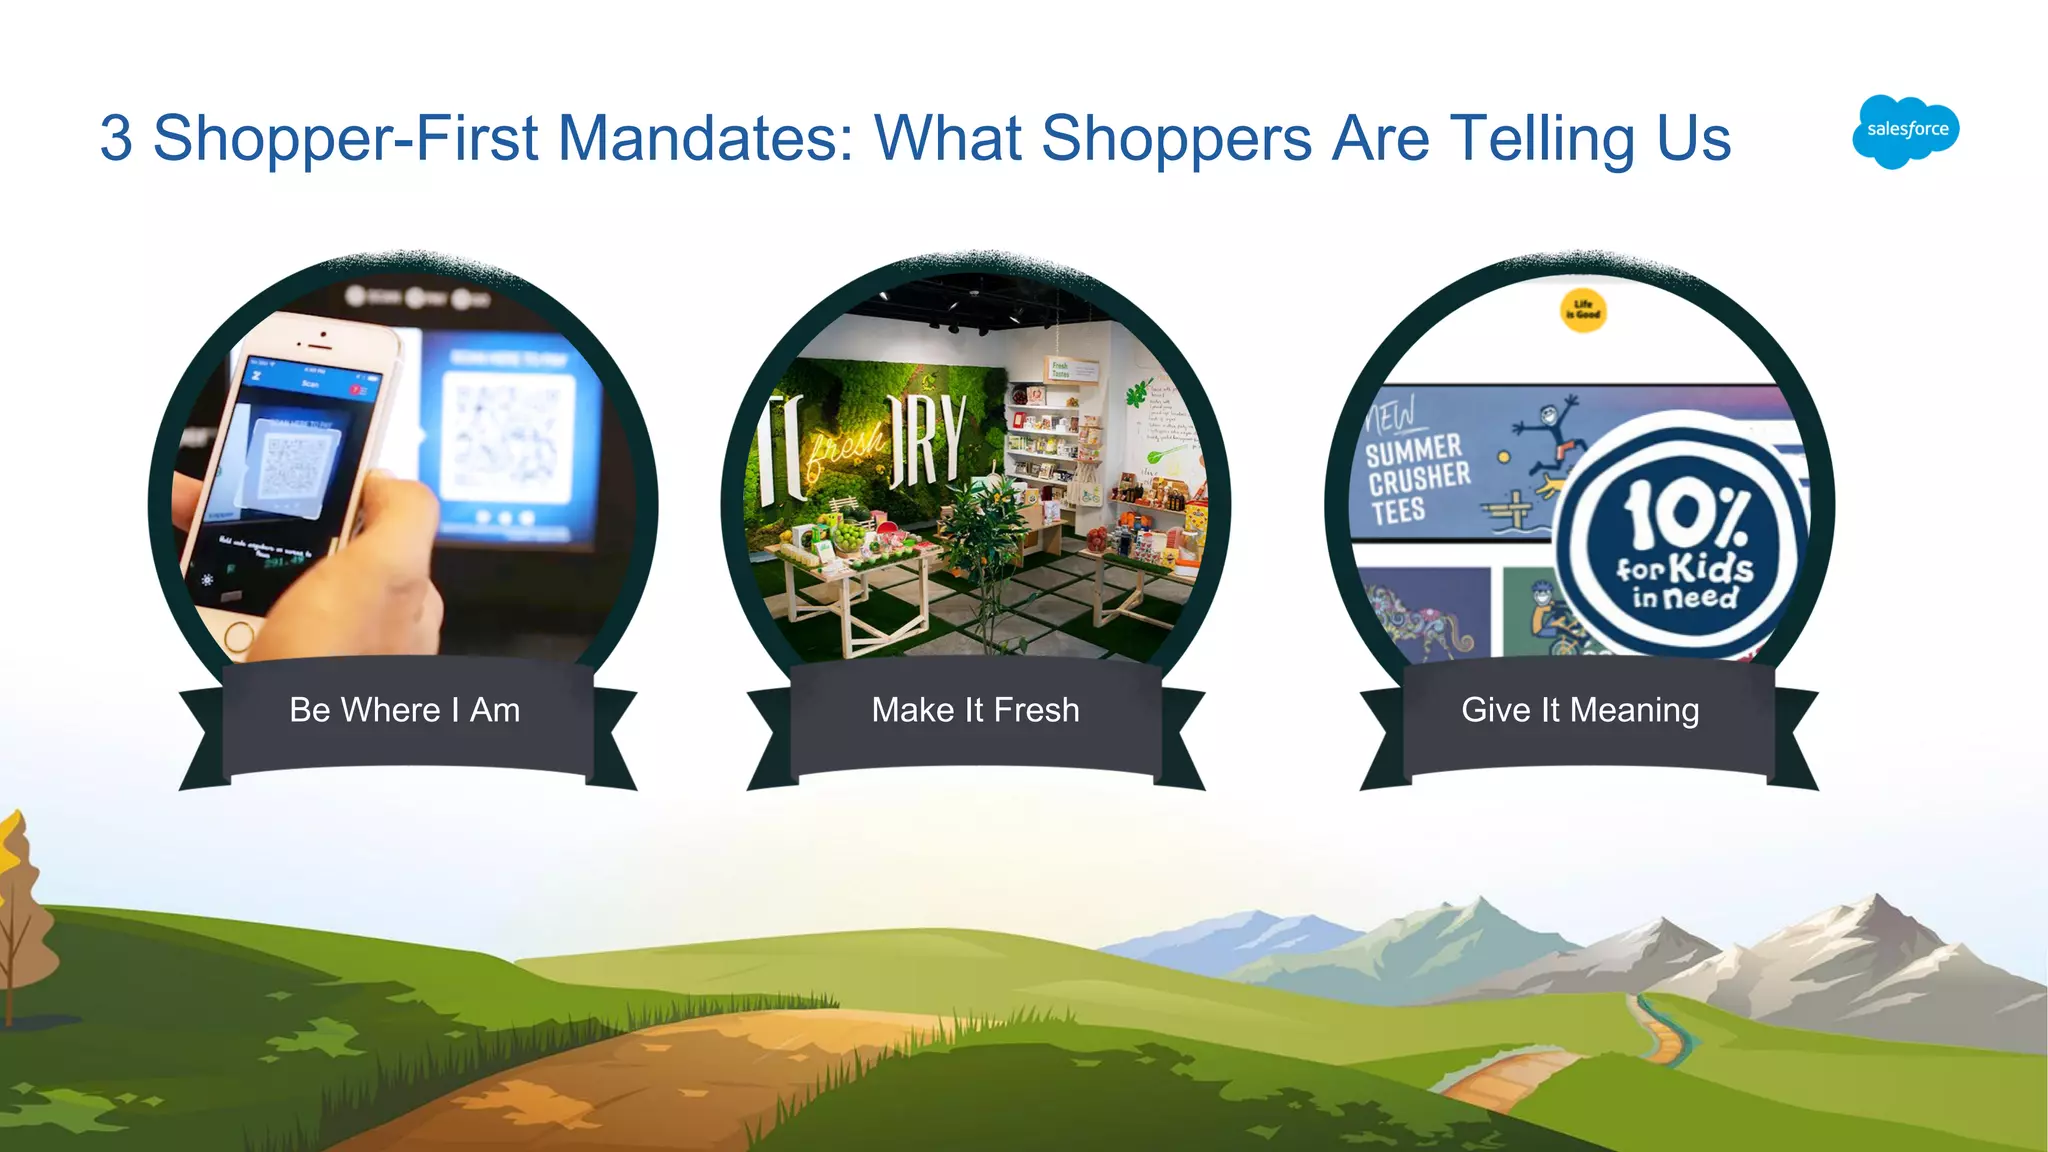
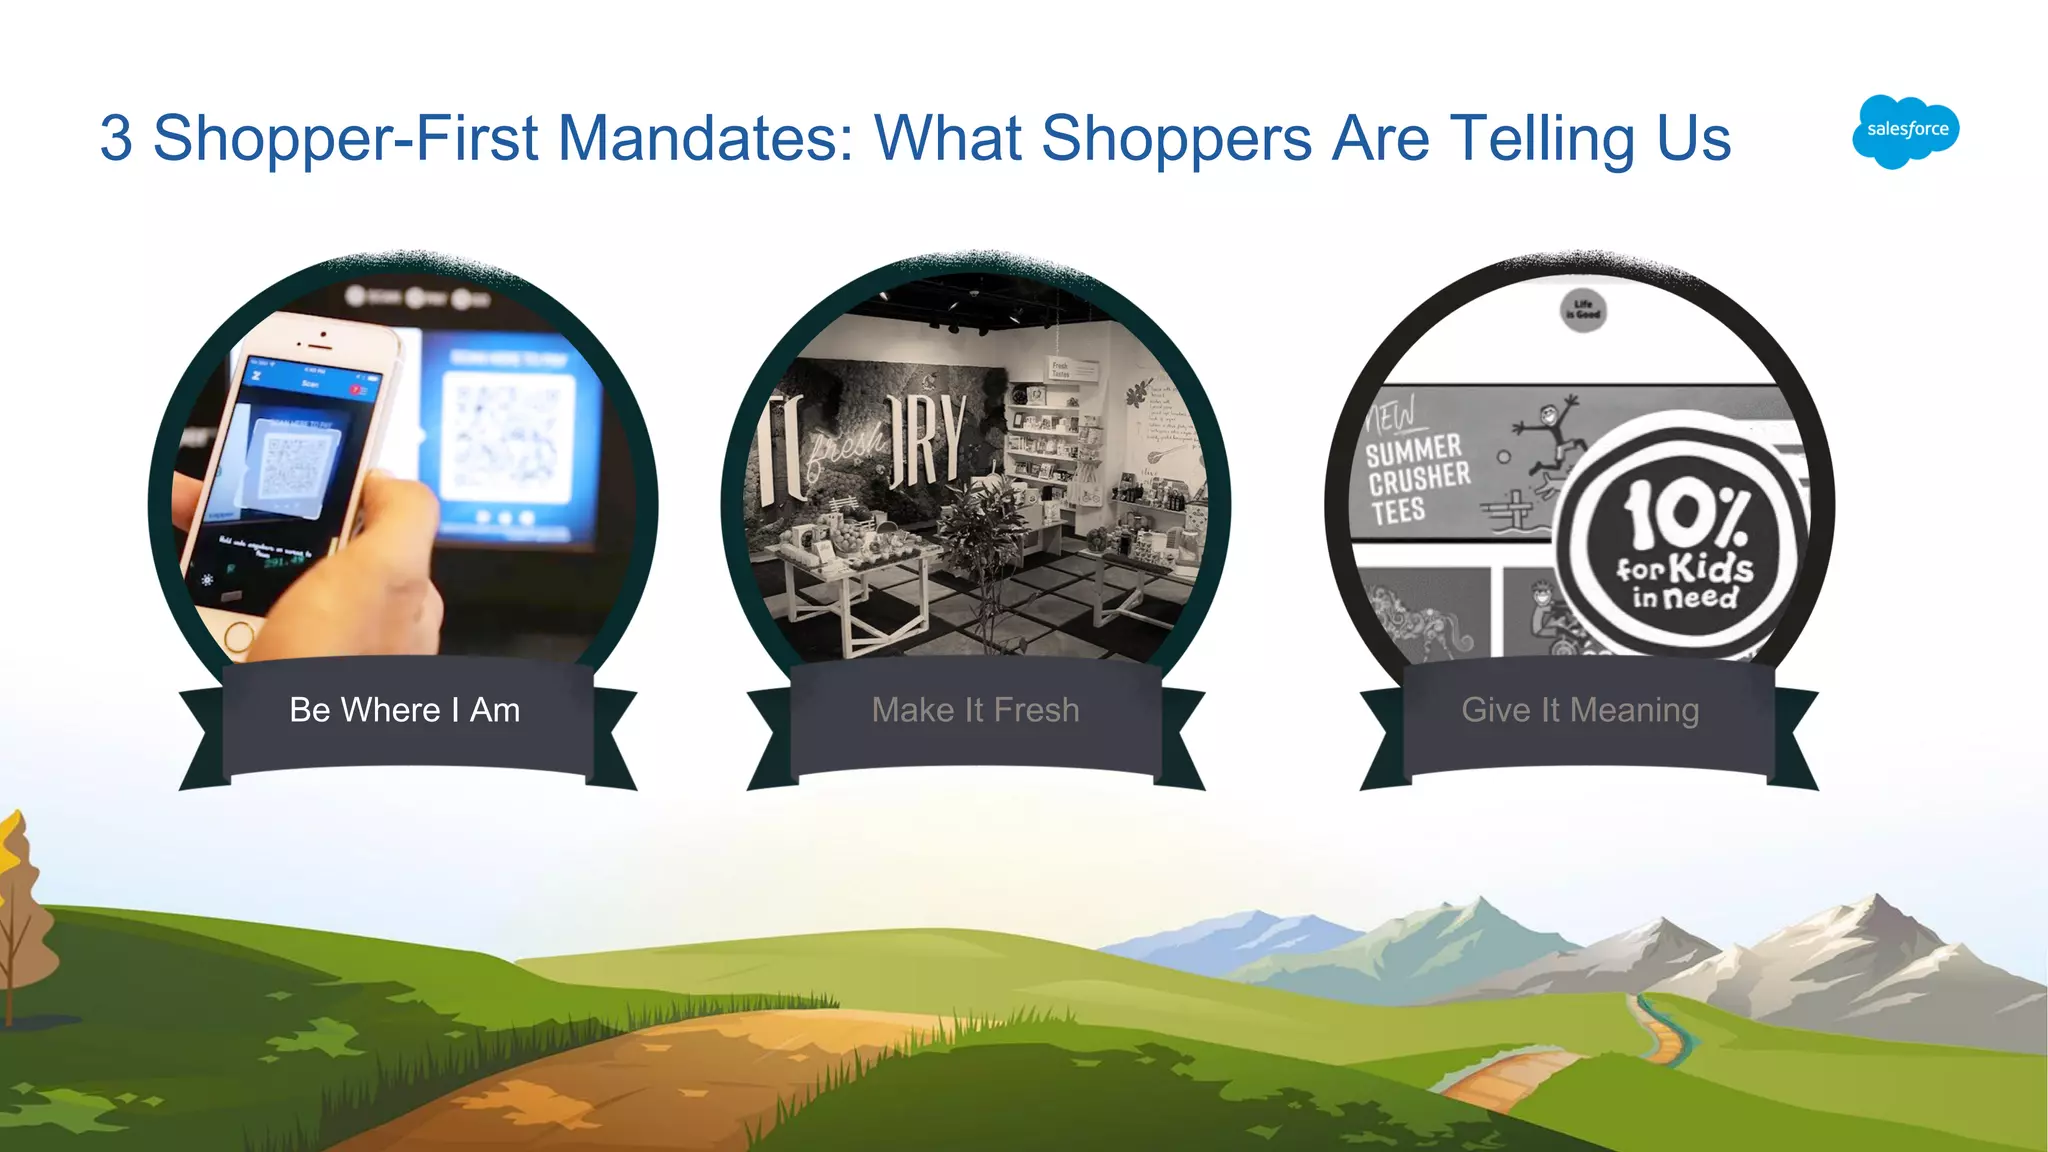


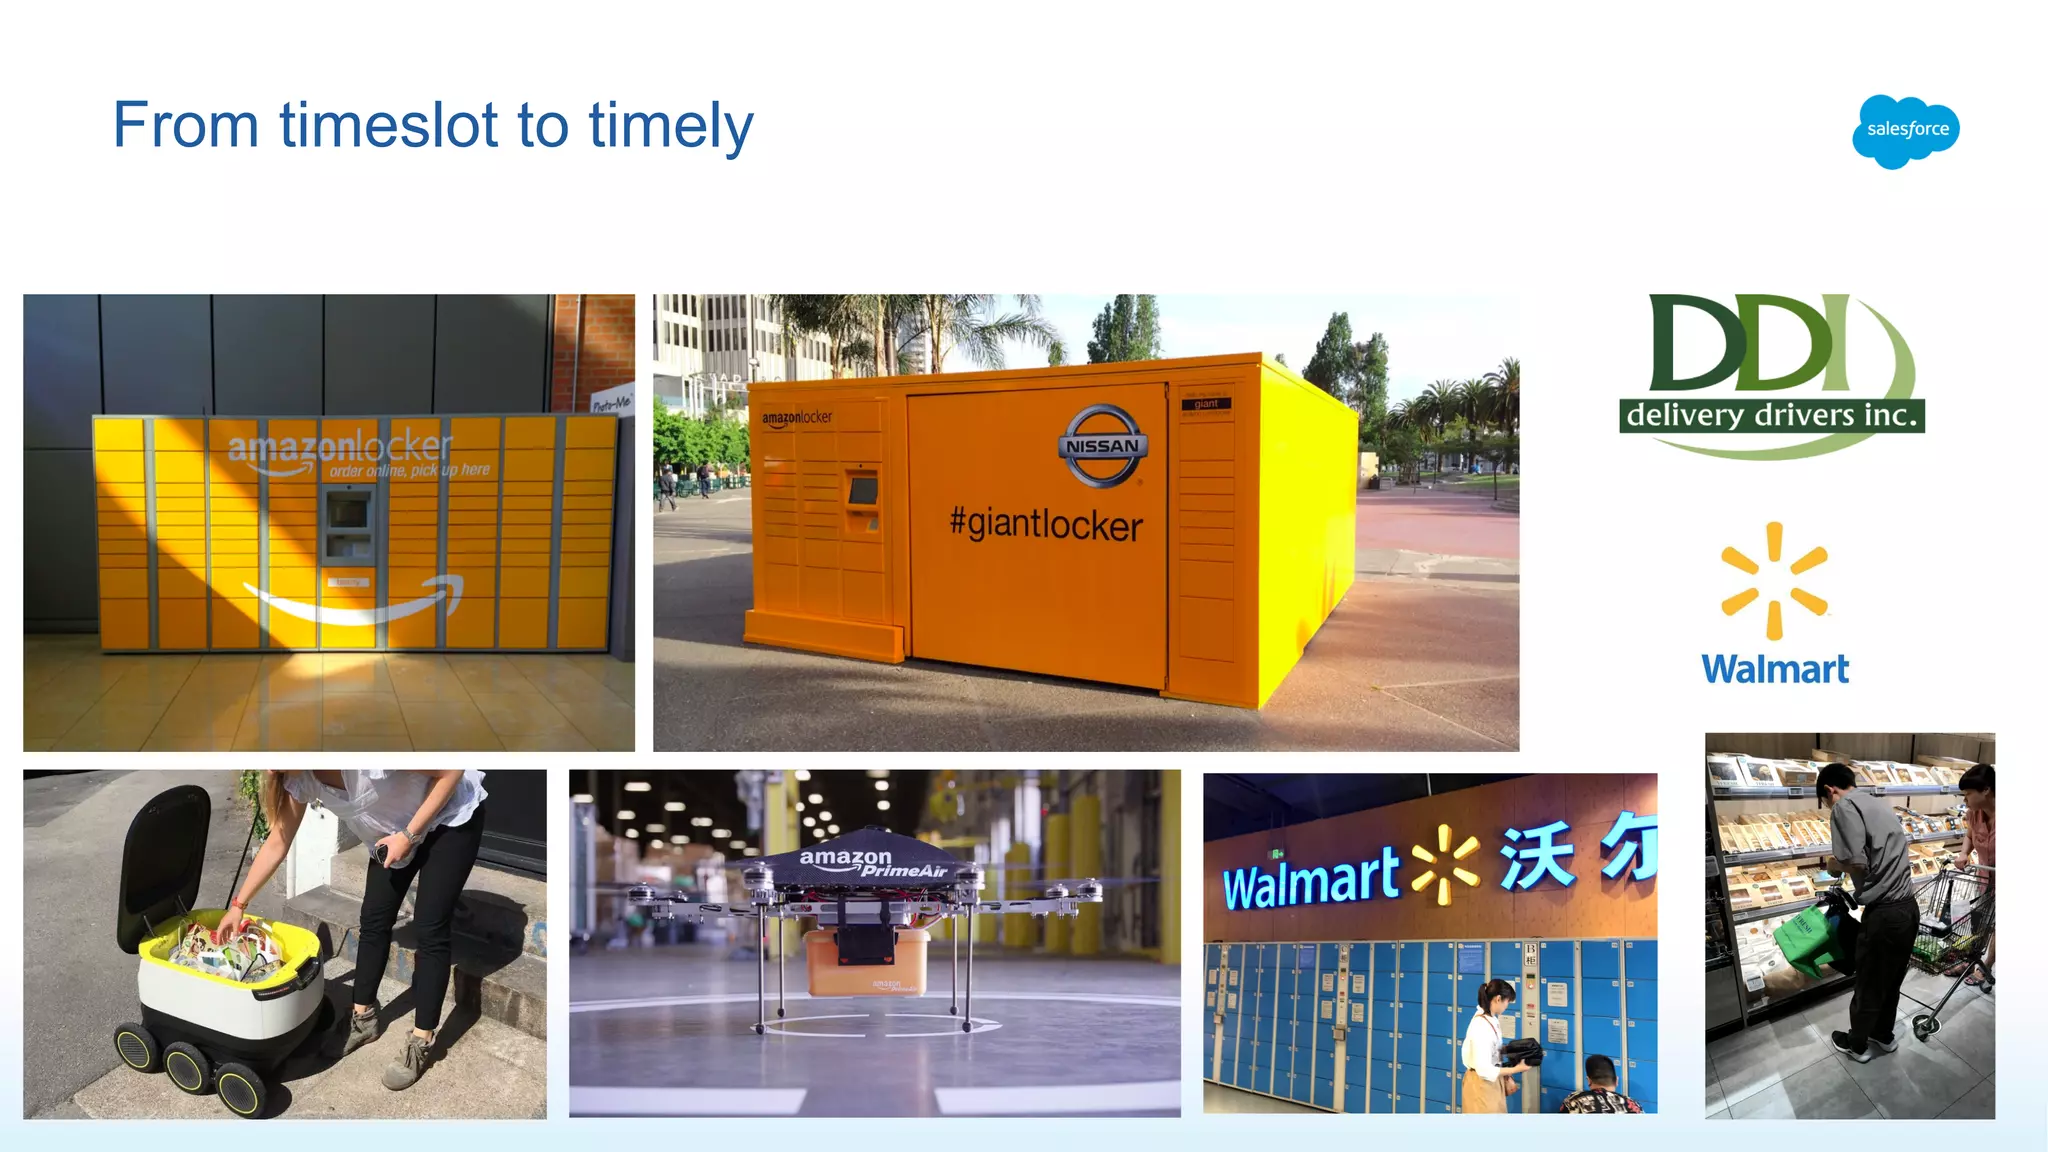
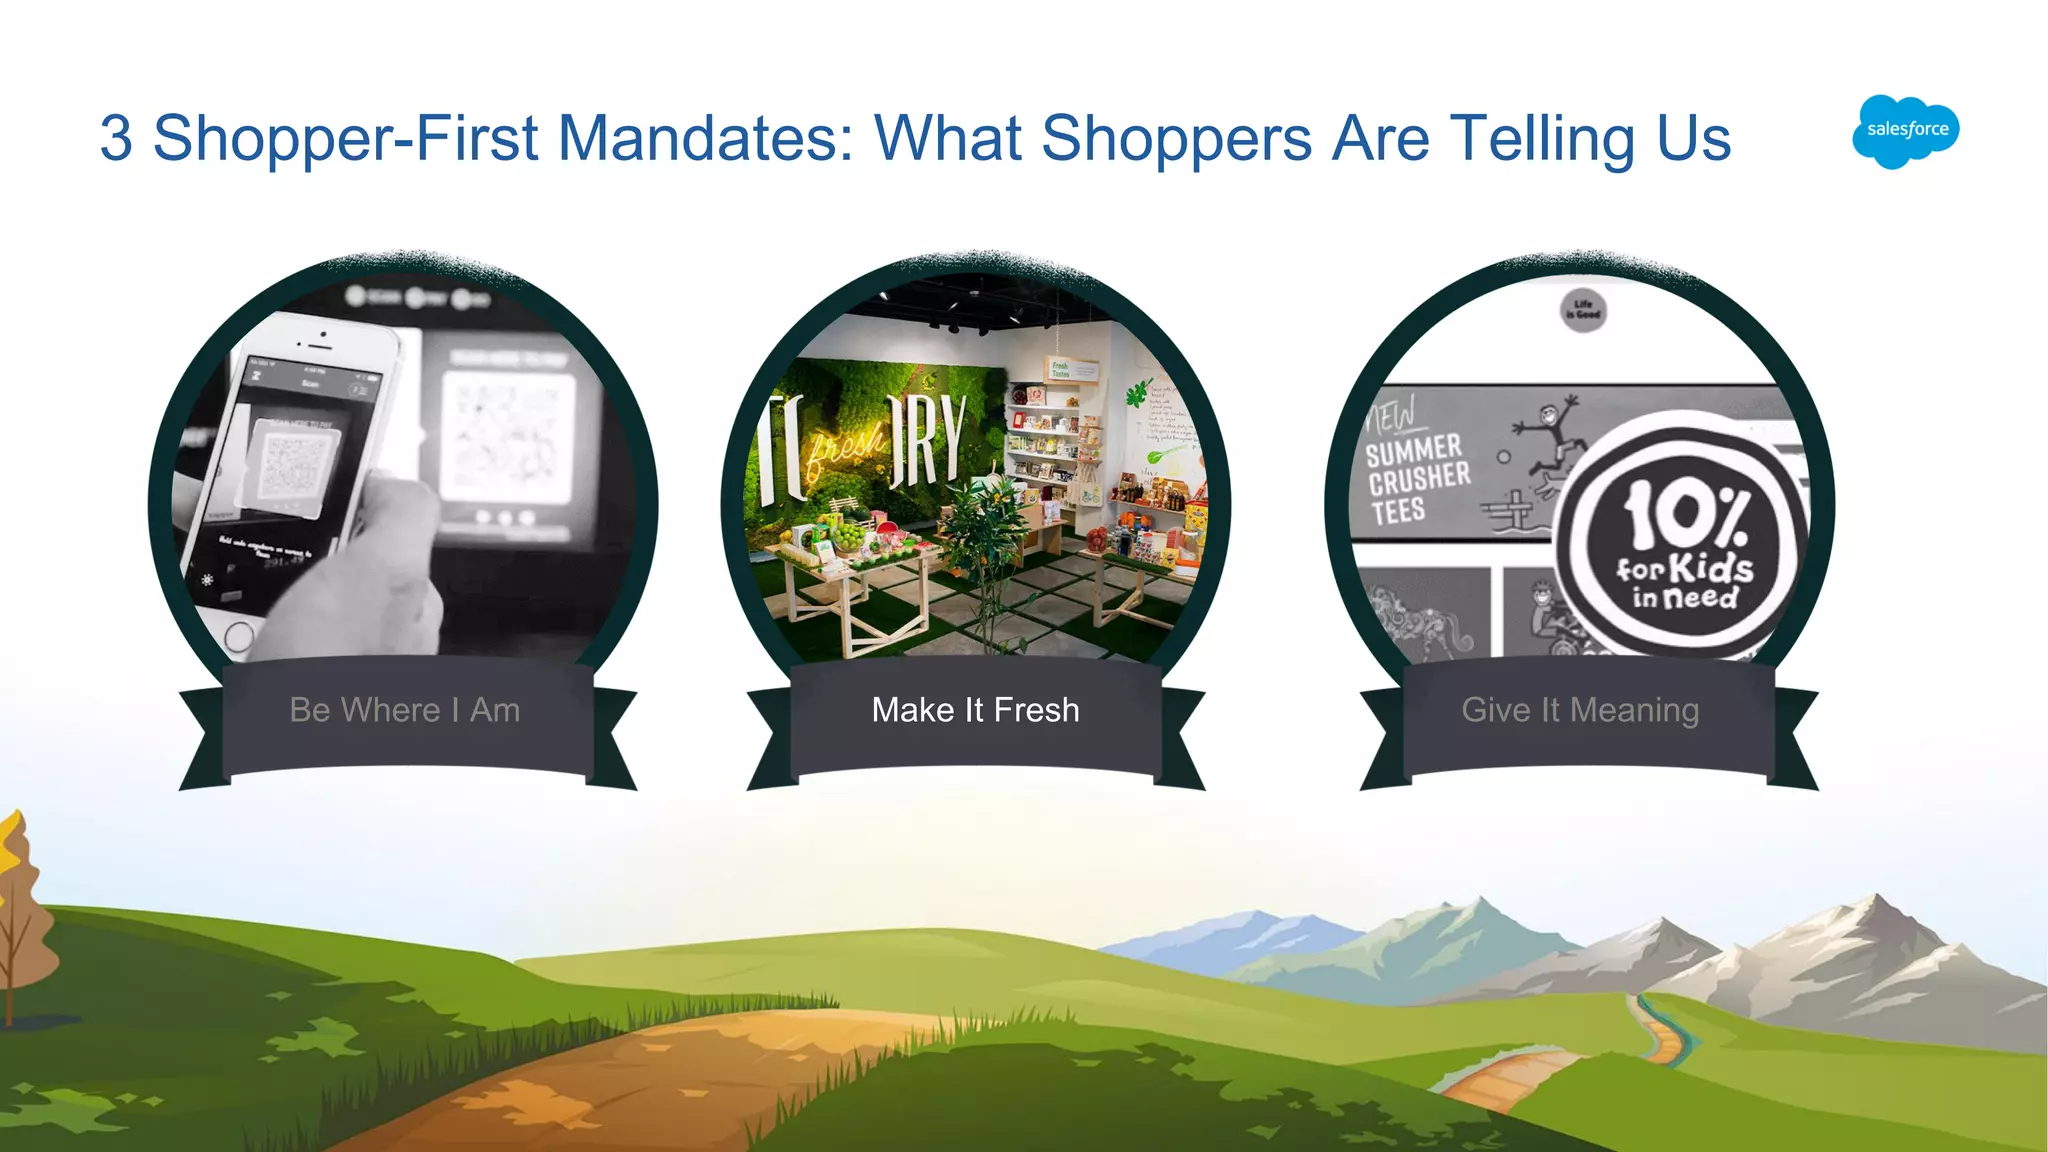
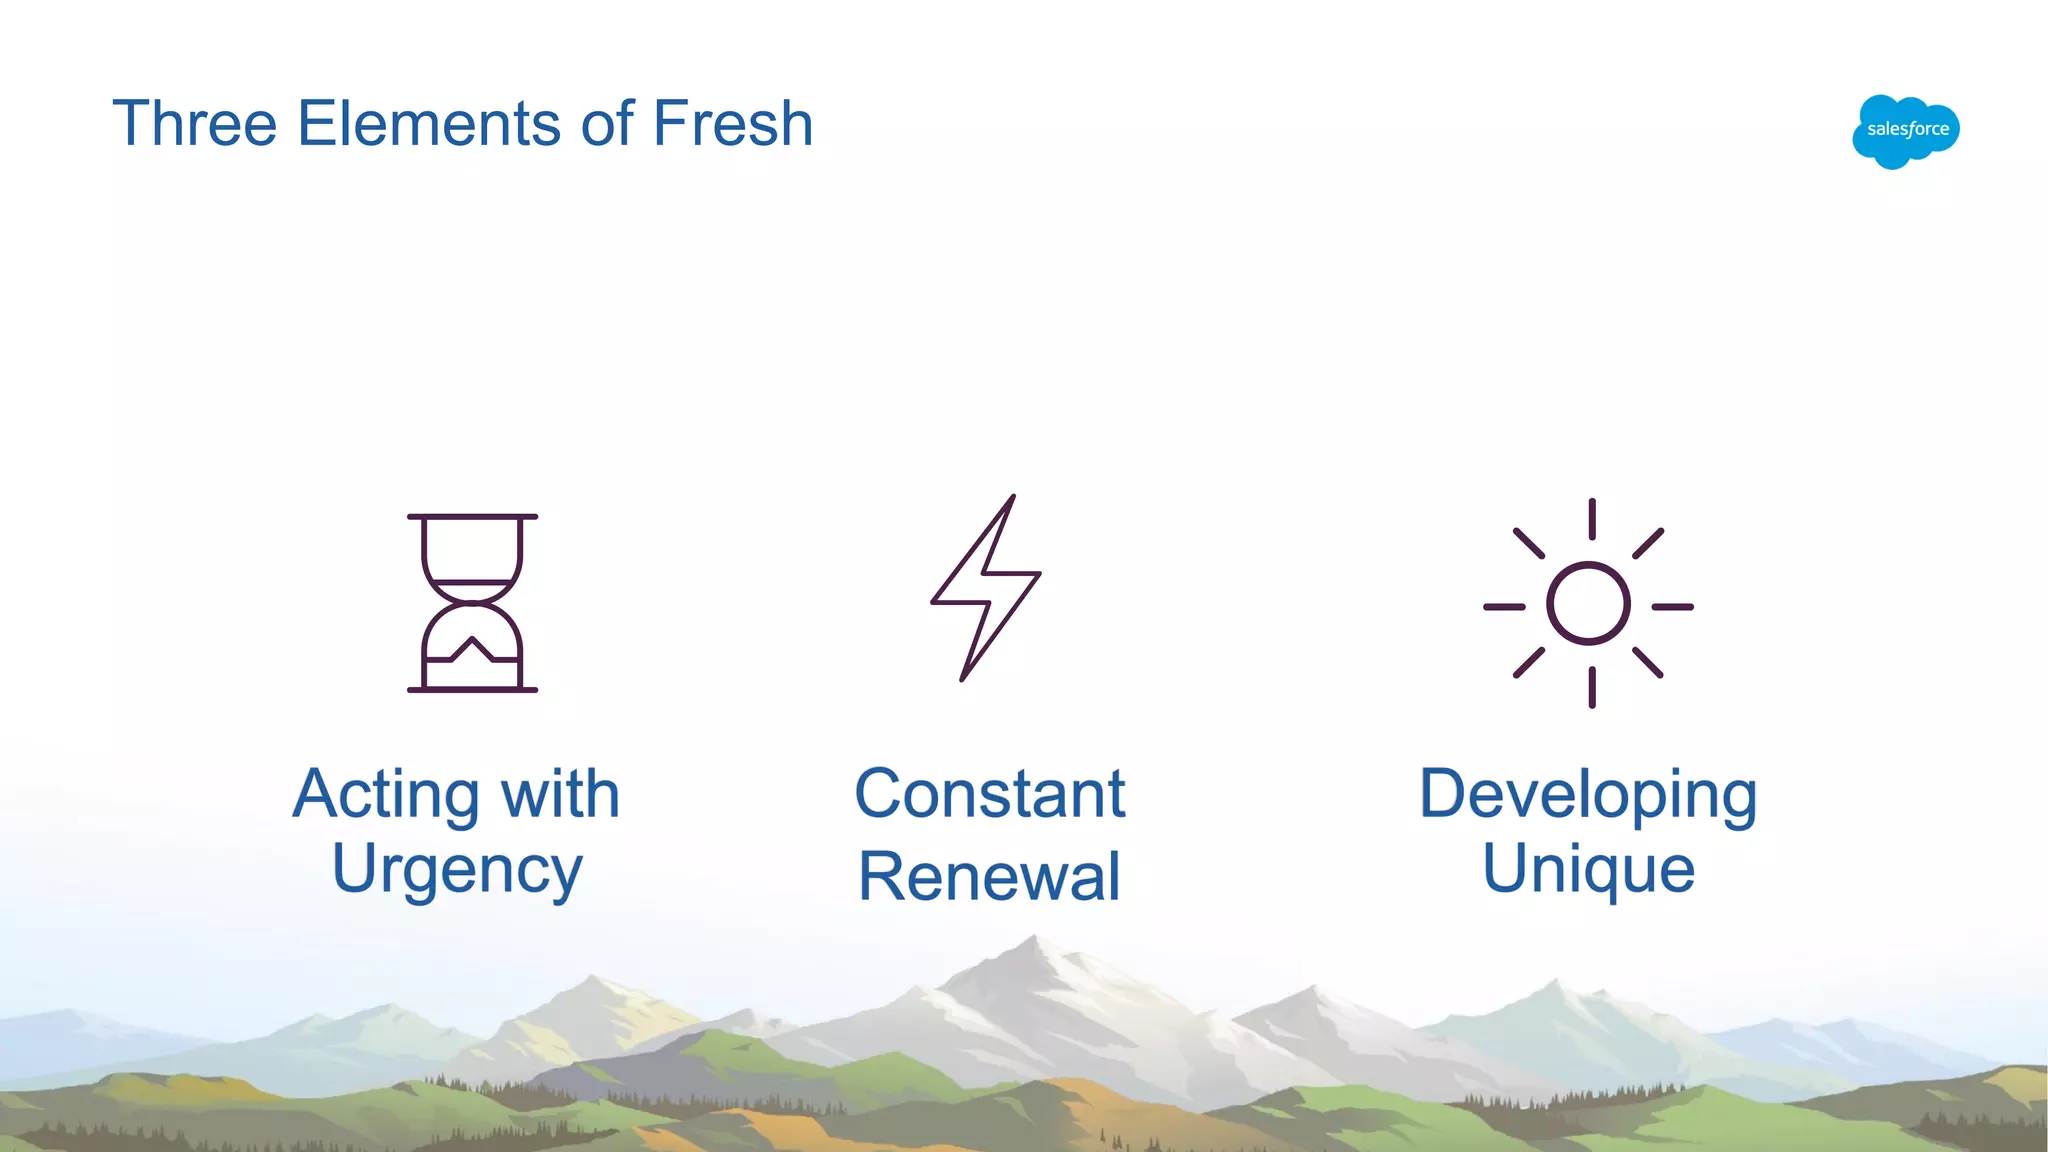
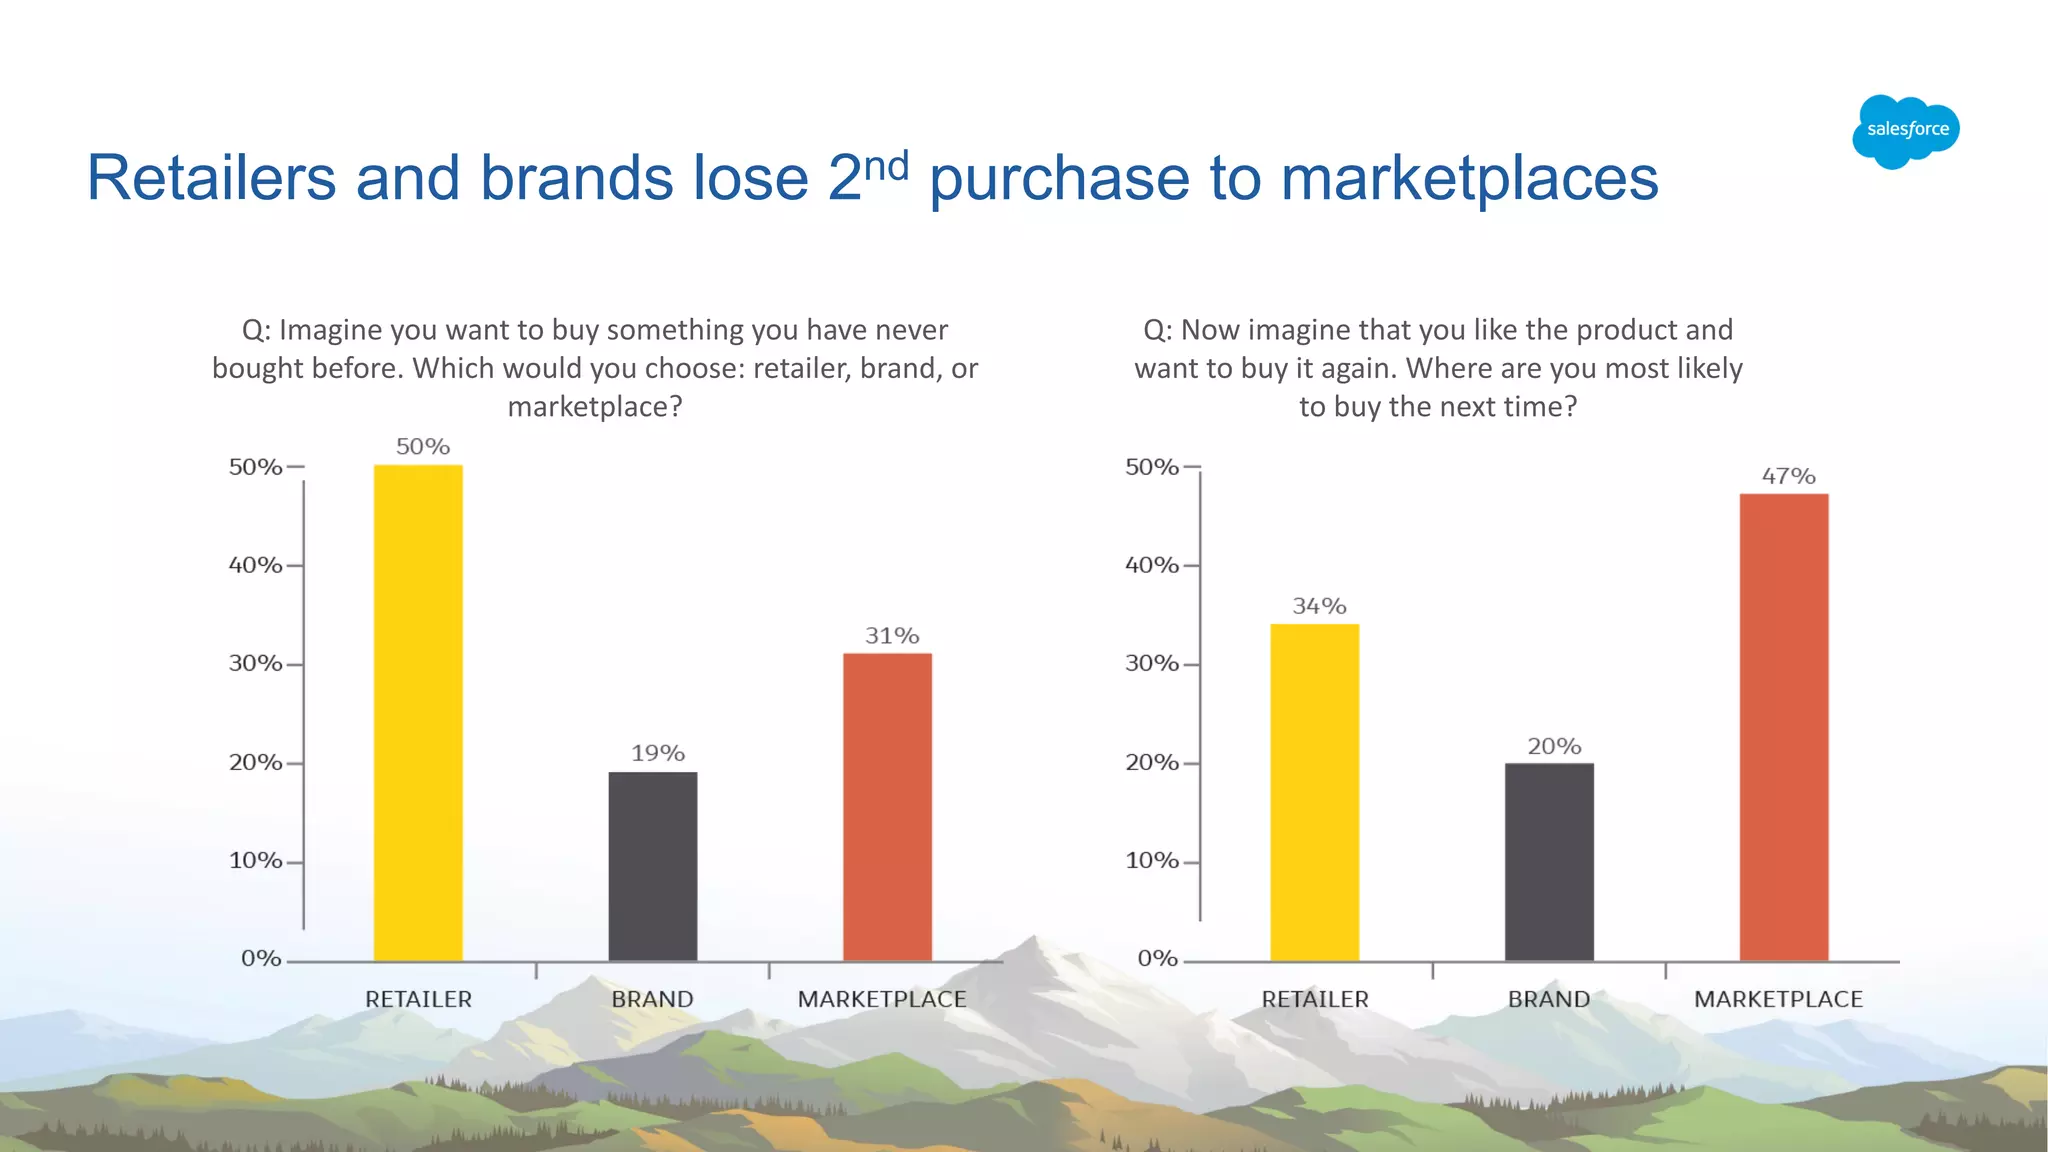
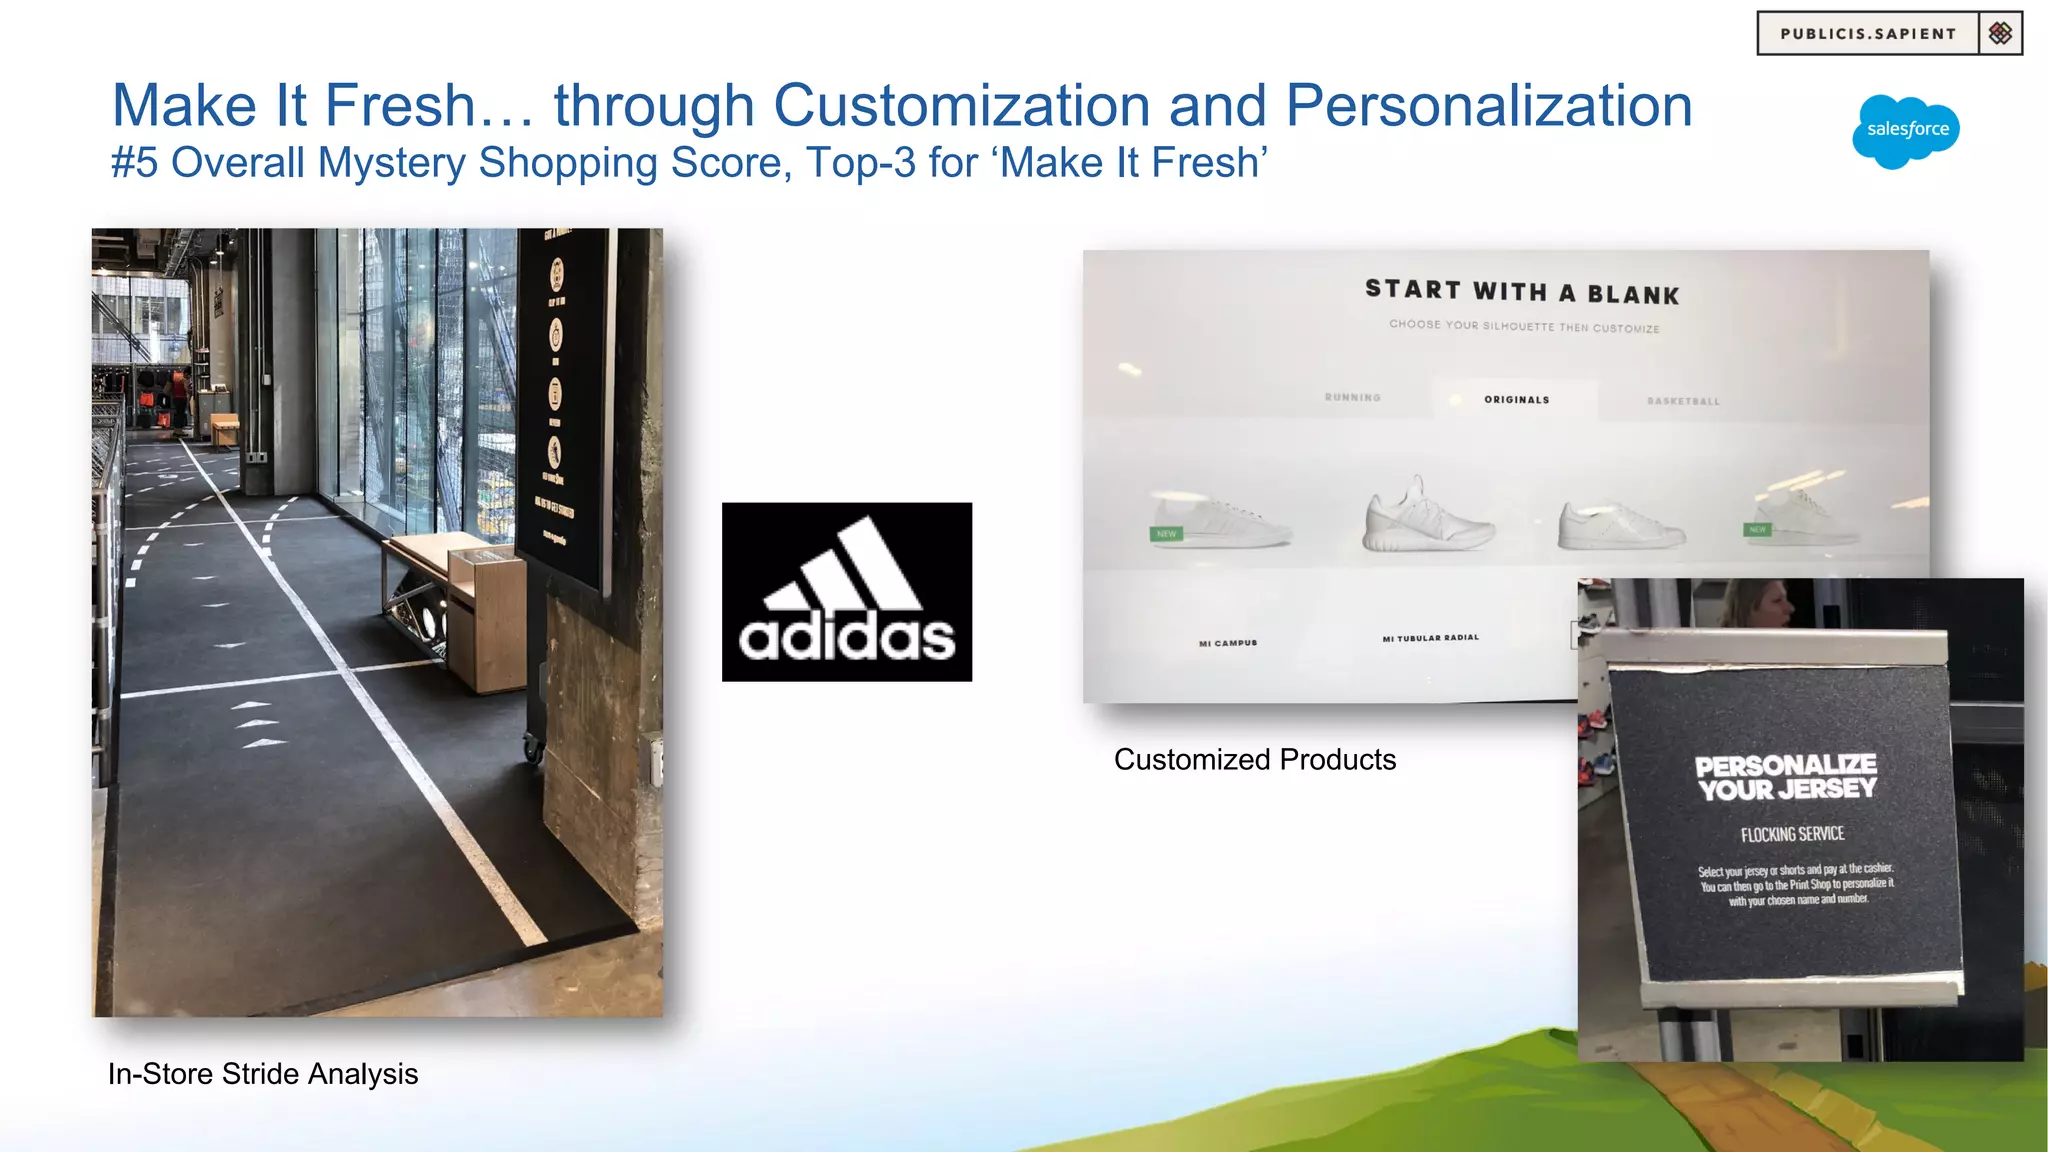
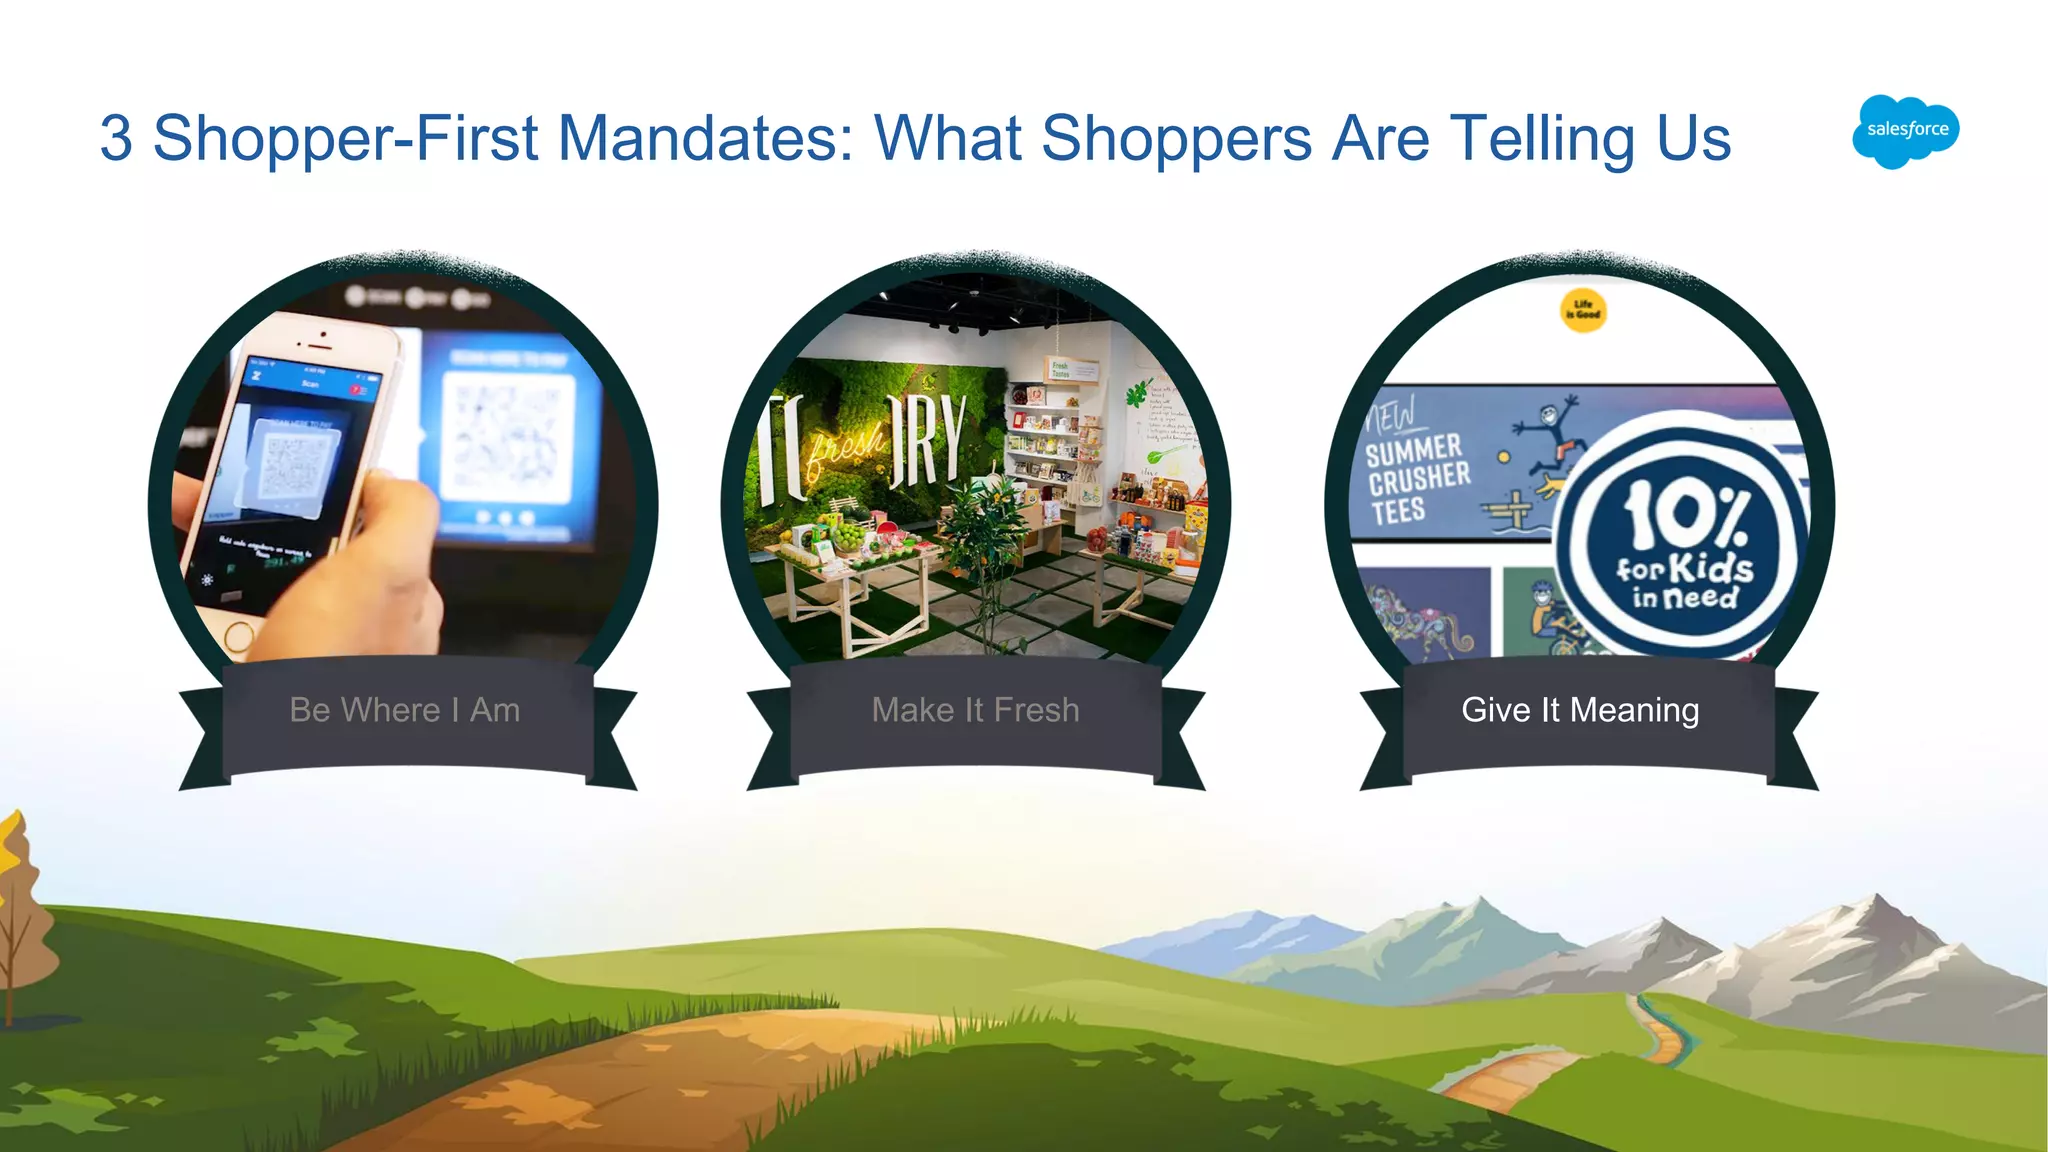
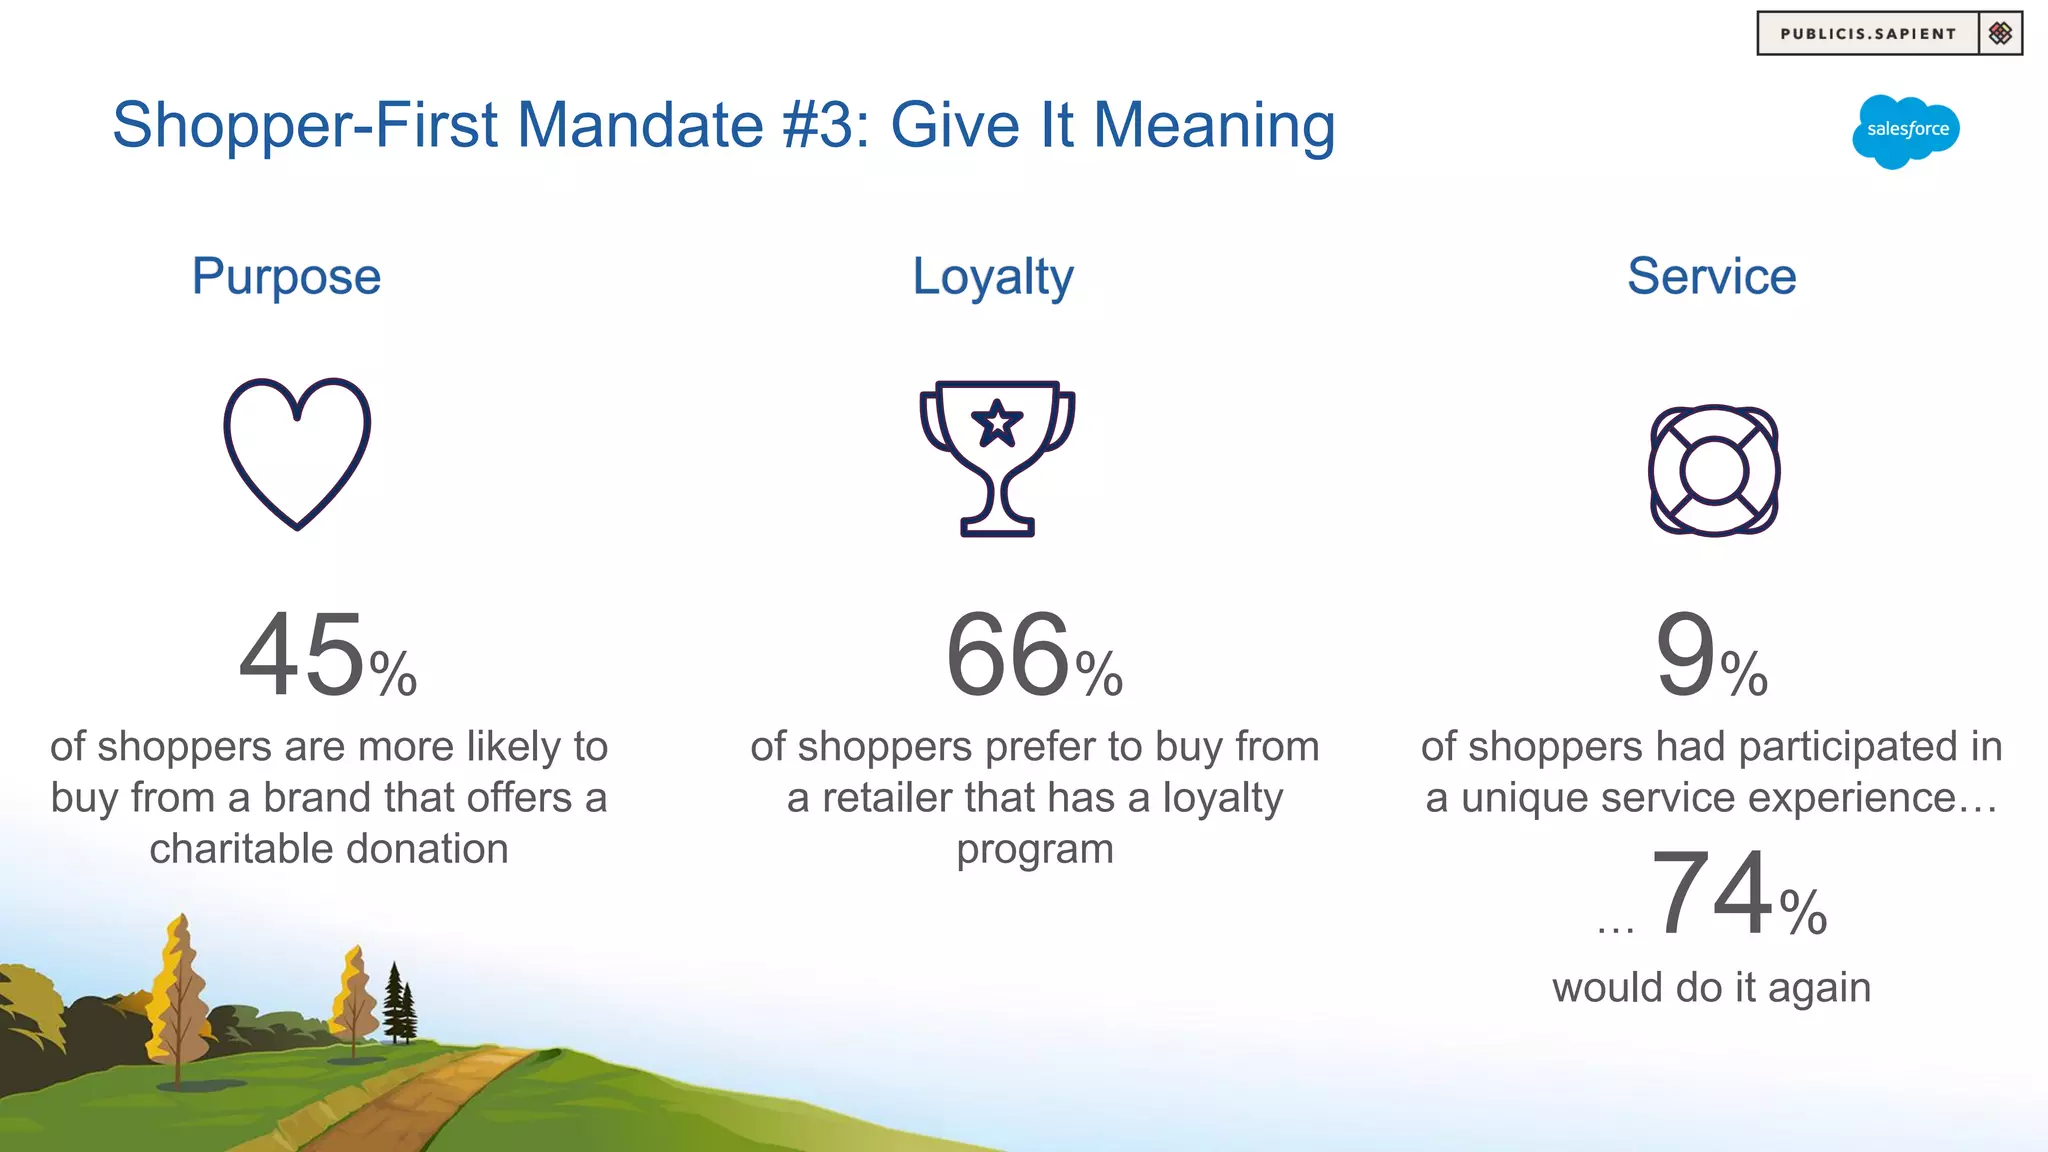
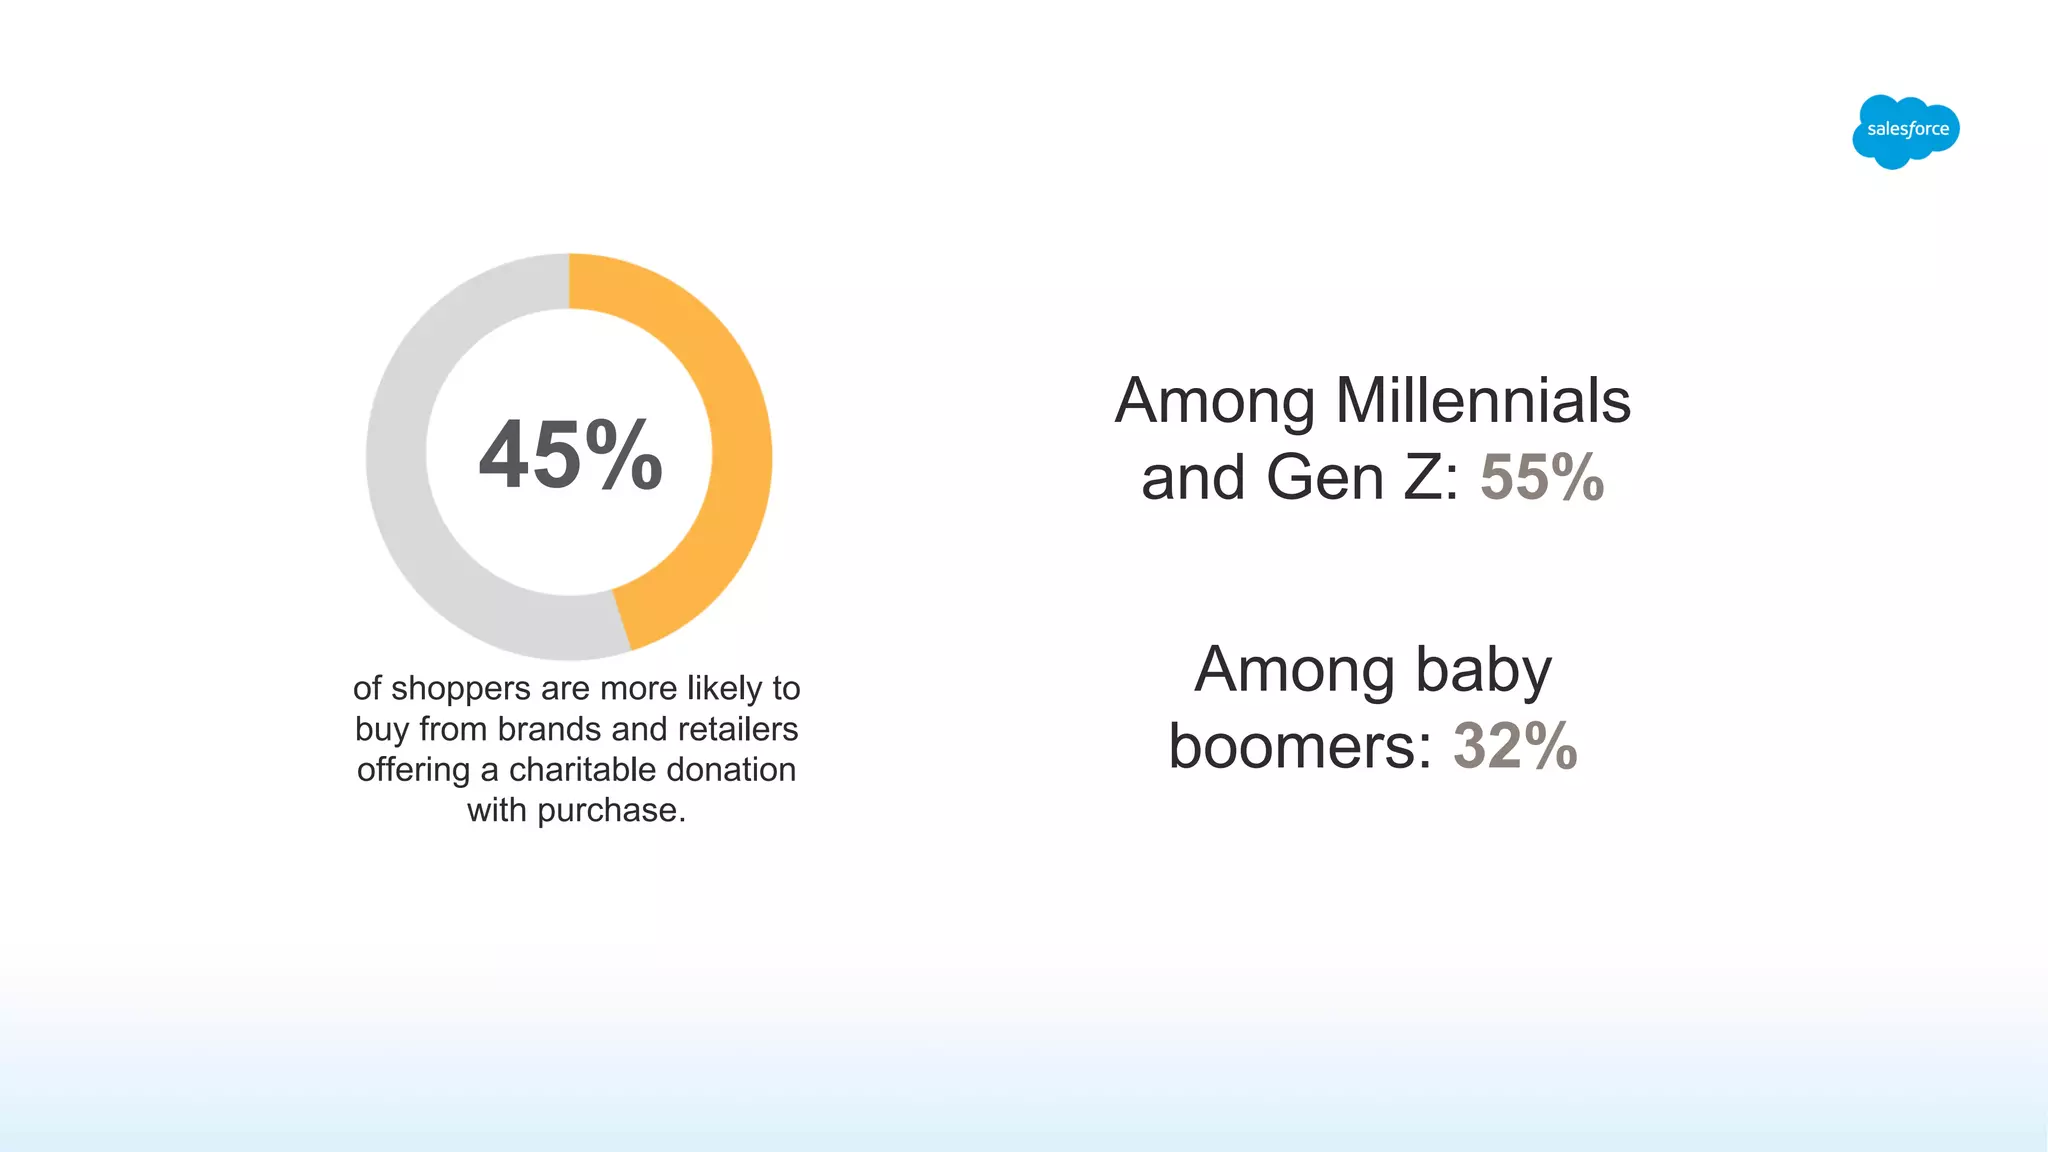
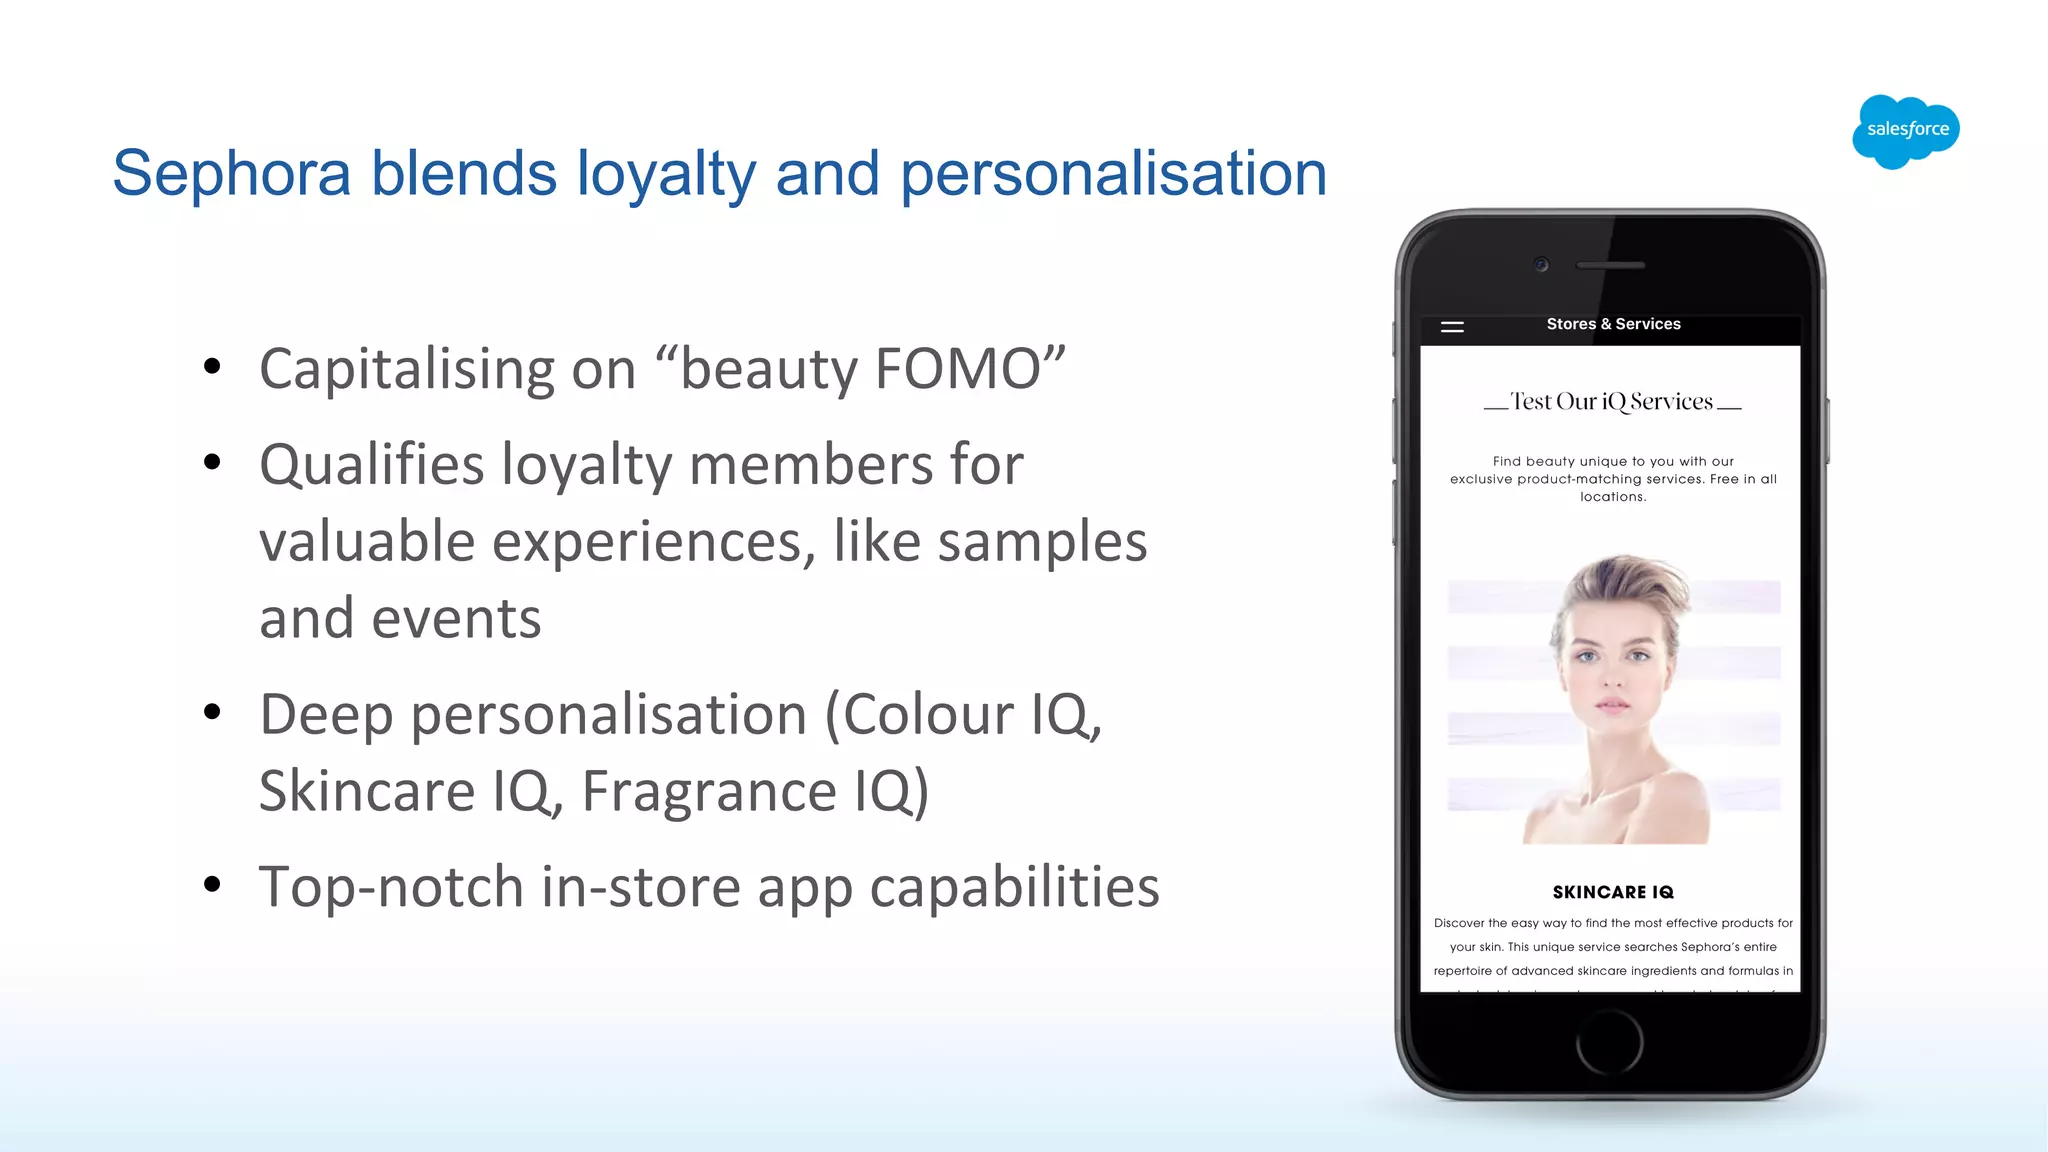
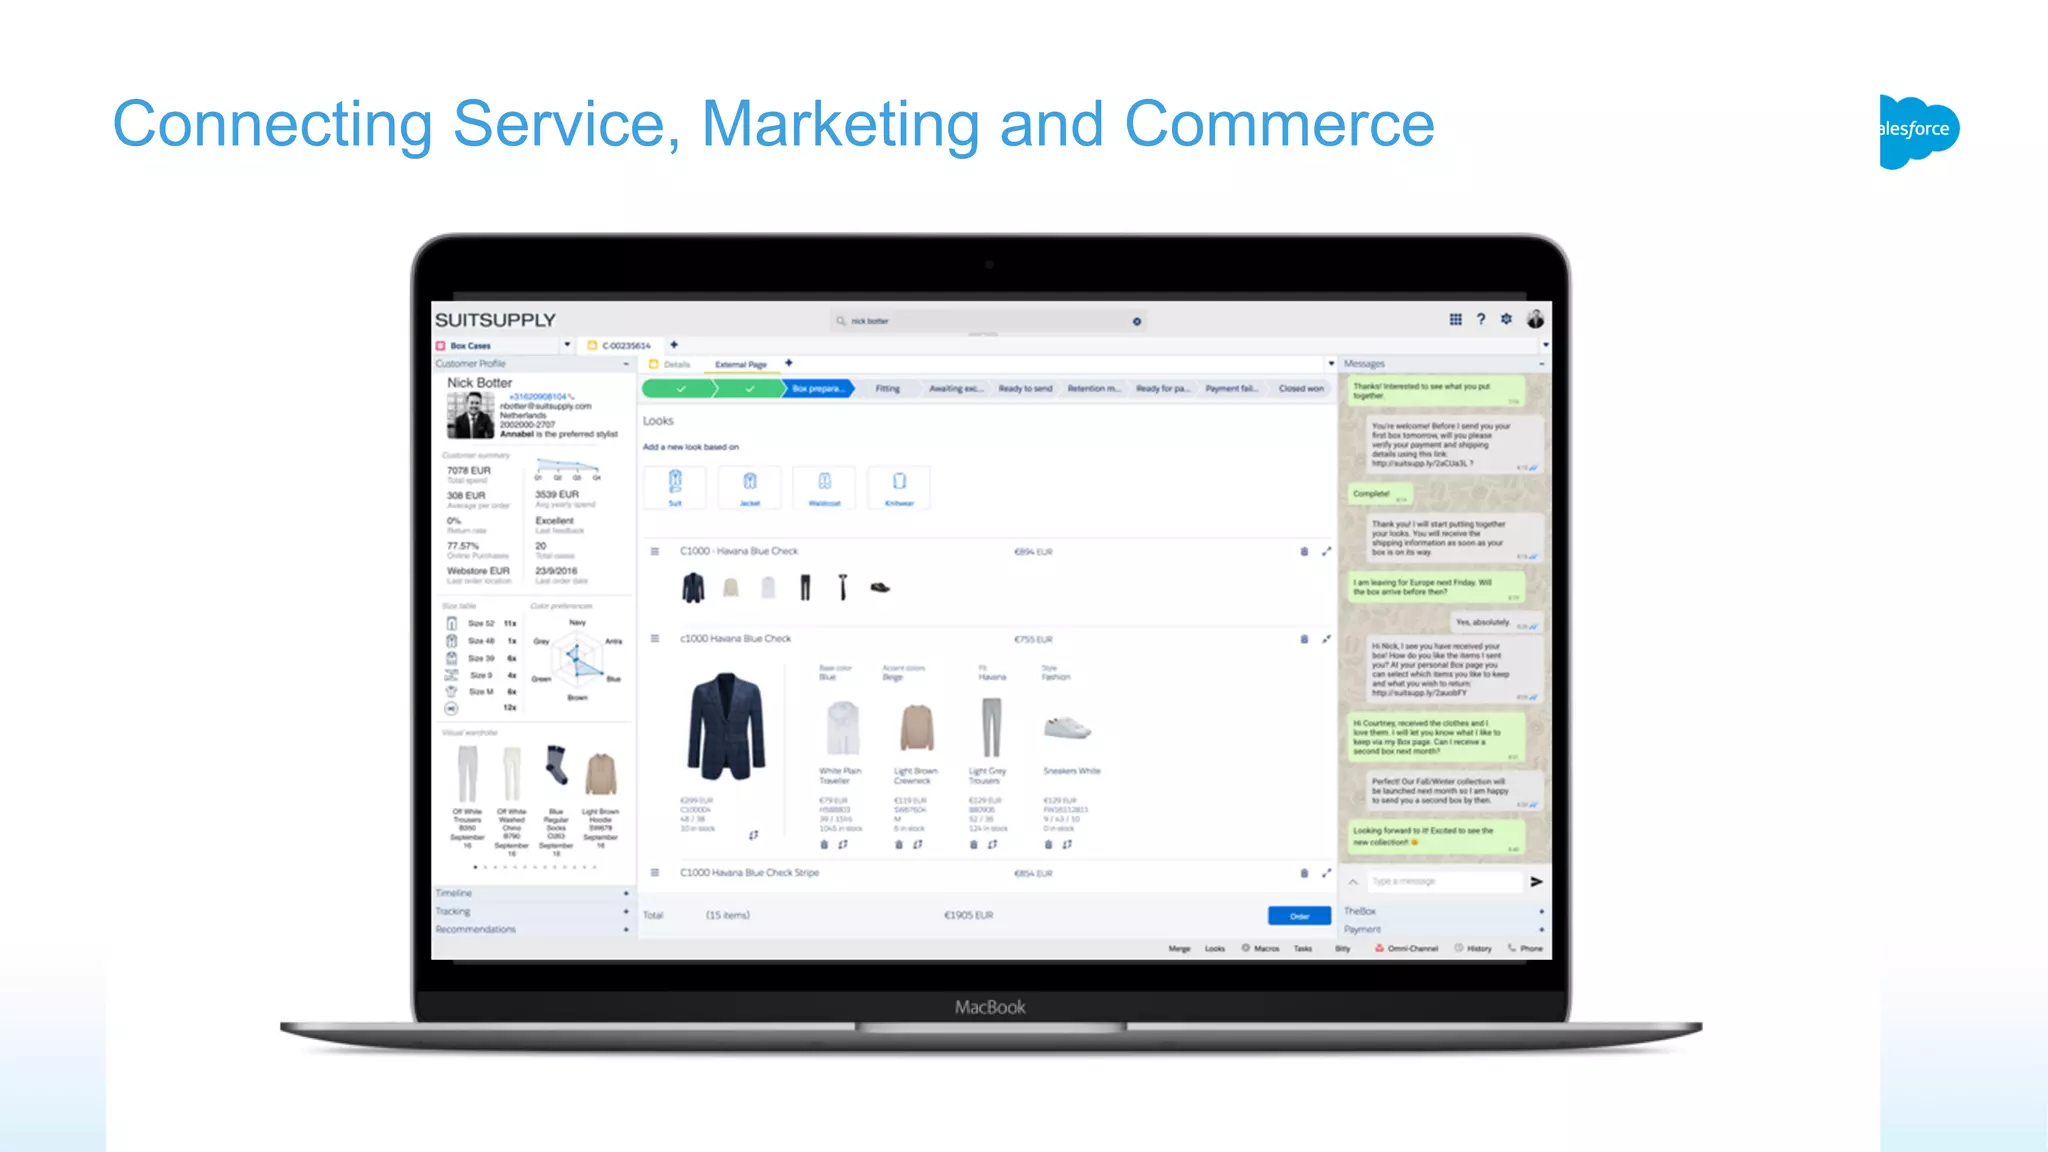

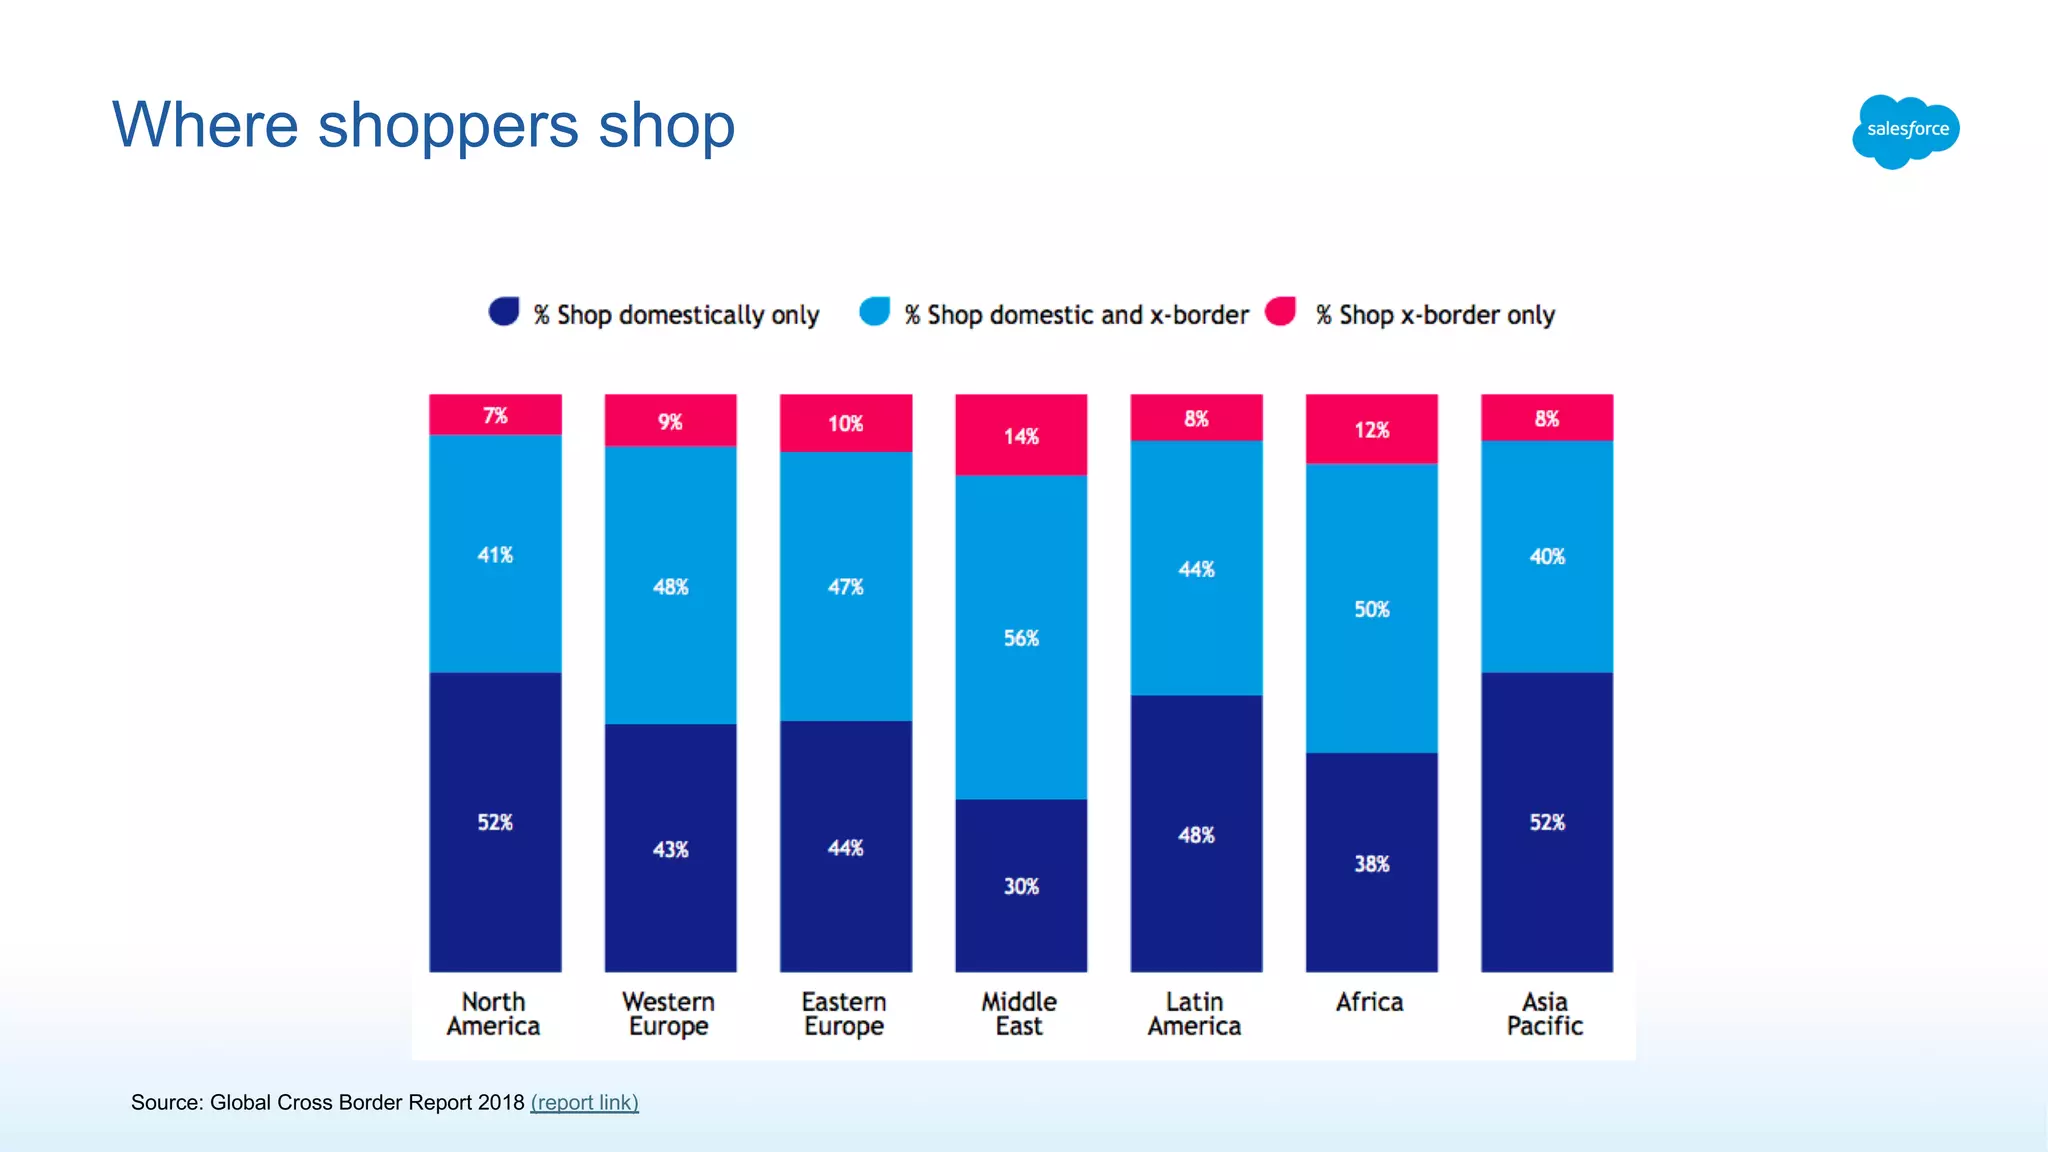
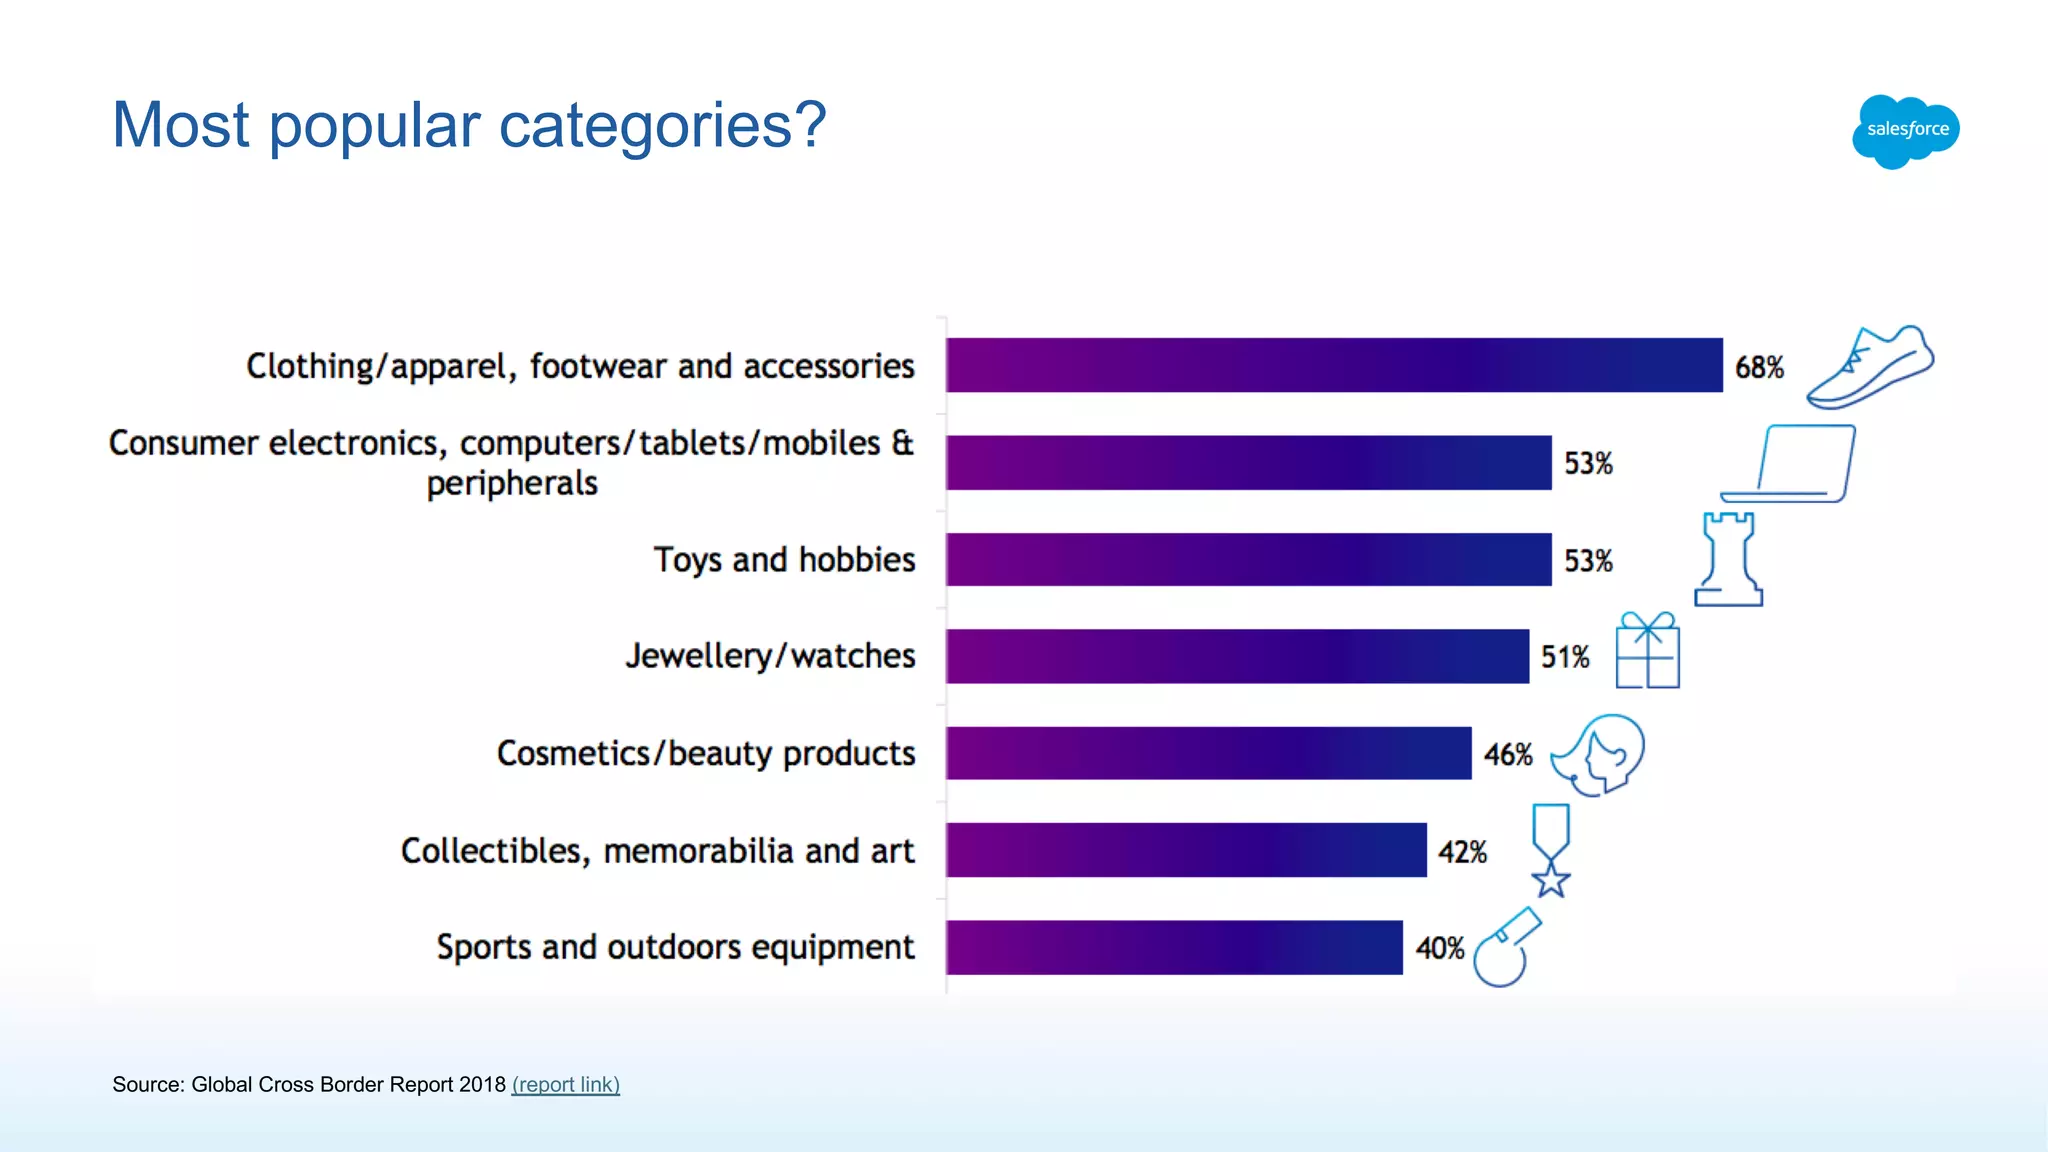


1) The document discusses how data is the bedrock of consumer experience and how retailers can use data to personalize experiences for shoppers. 2) It notes that high performing retailers are more likely than underperformers to prioritize data in key areas like governance, agility, and security. 3) The document advocates that retailers adopt three "shopper-first mandates" - make it fresh by constantly renewing offerings, be where shoppers are through omnichannel presence, and give shopping meaning through loyalty programs and charitable initiatives.


