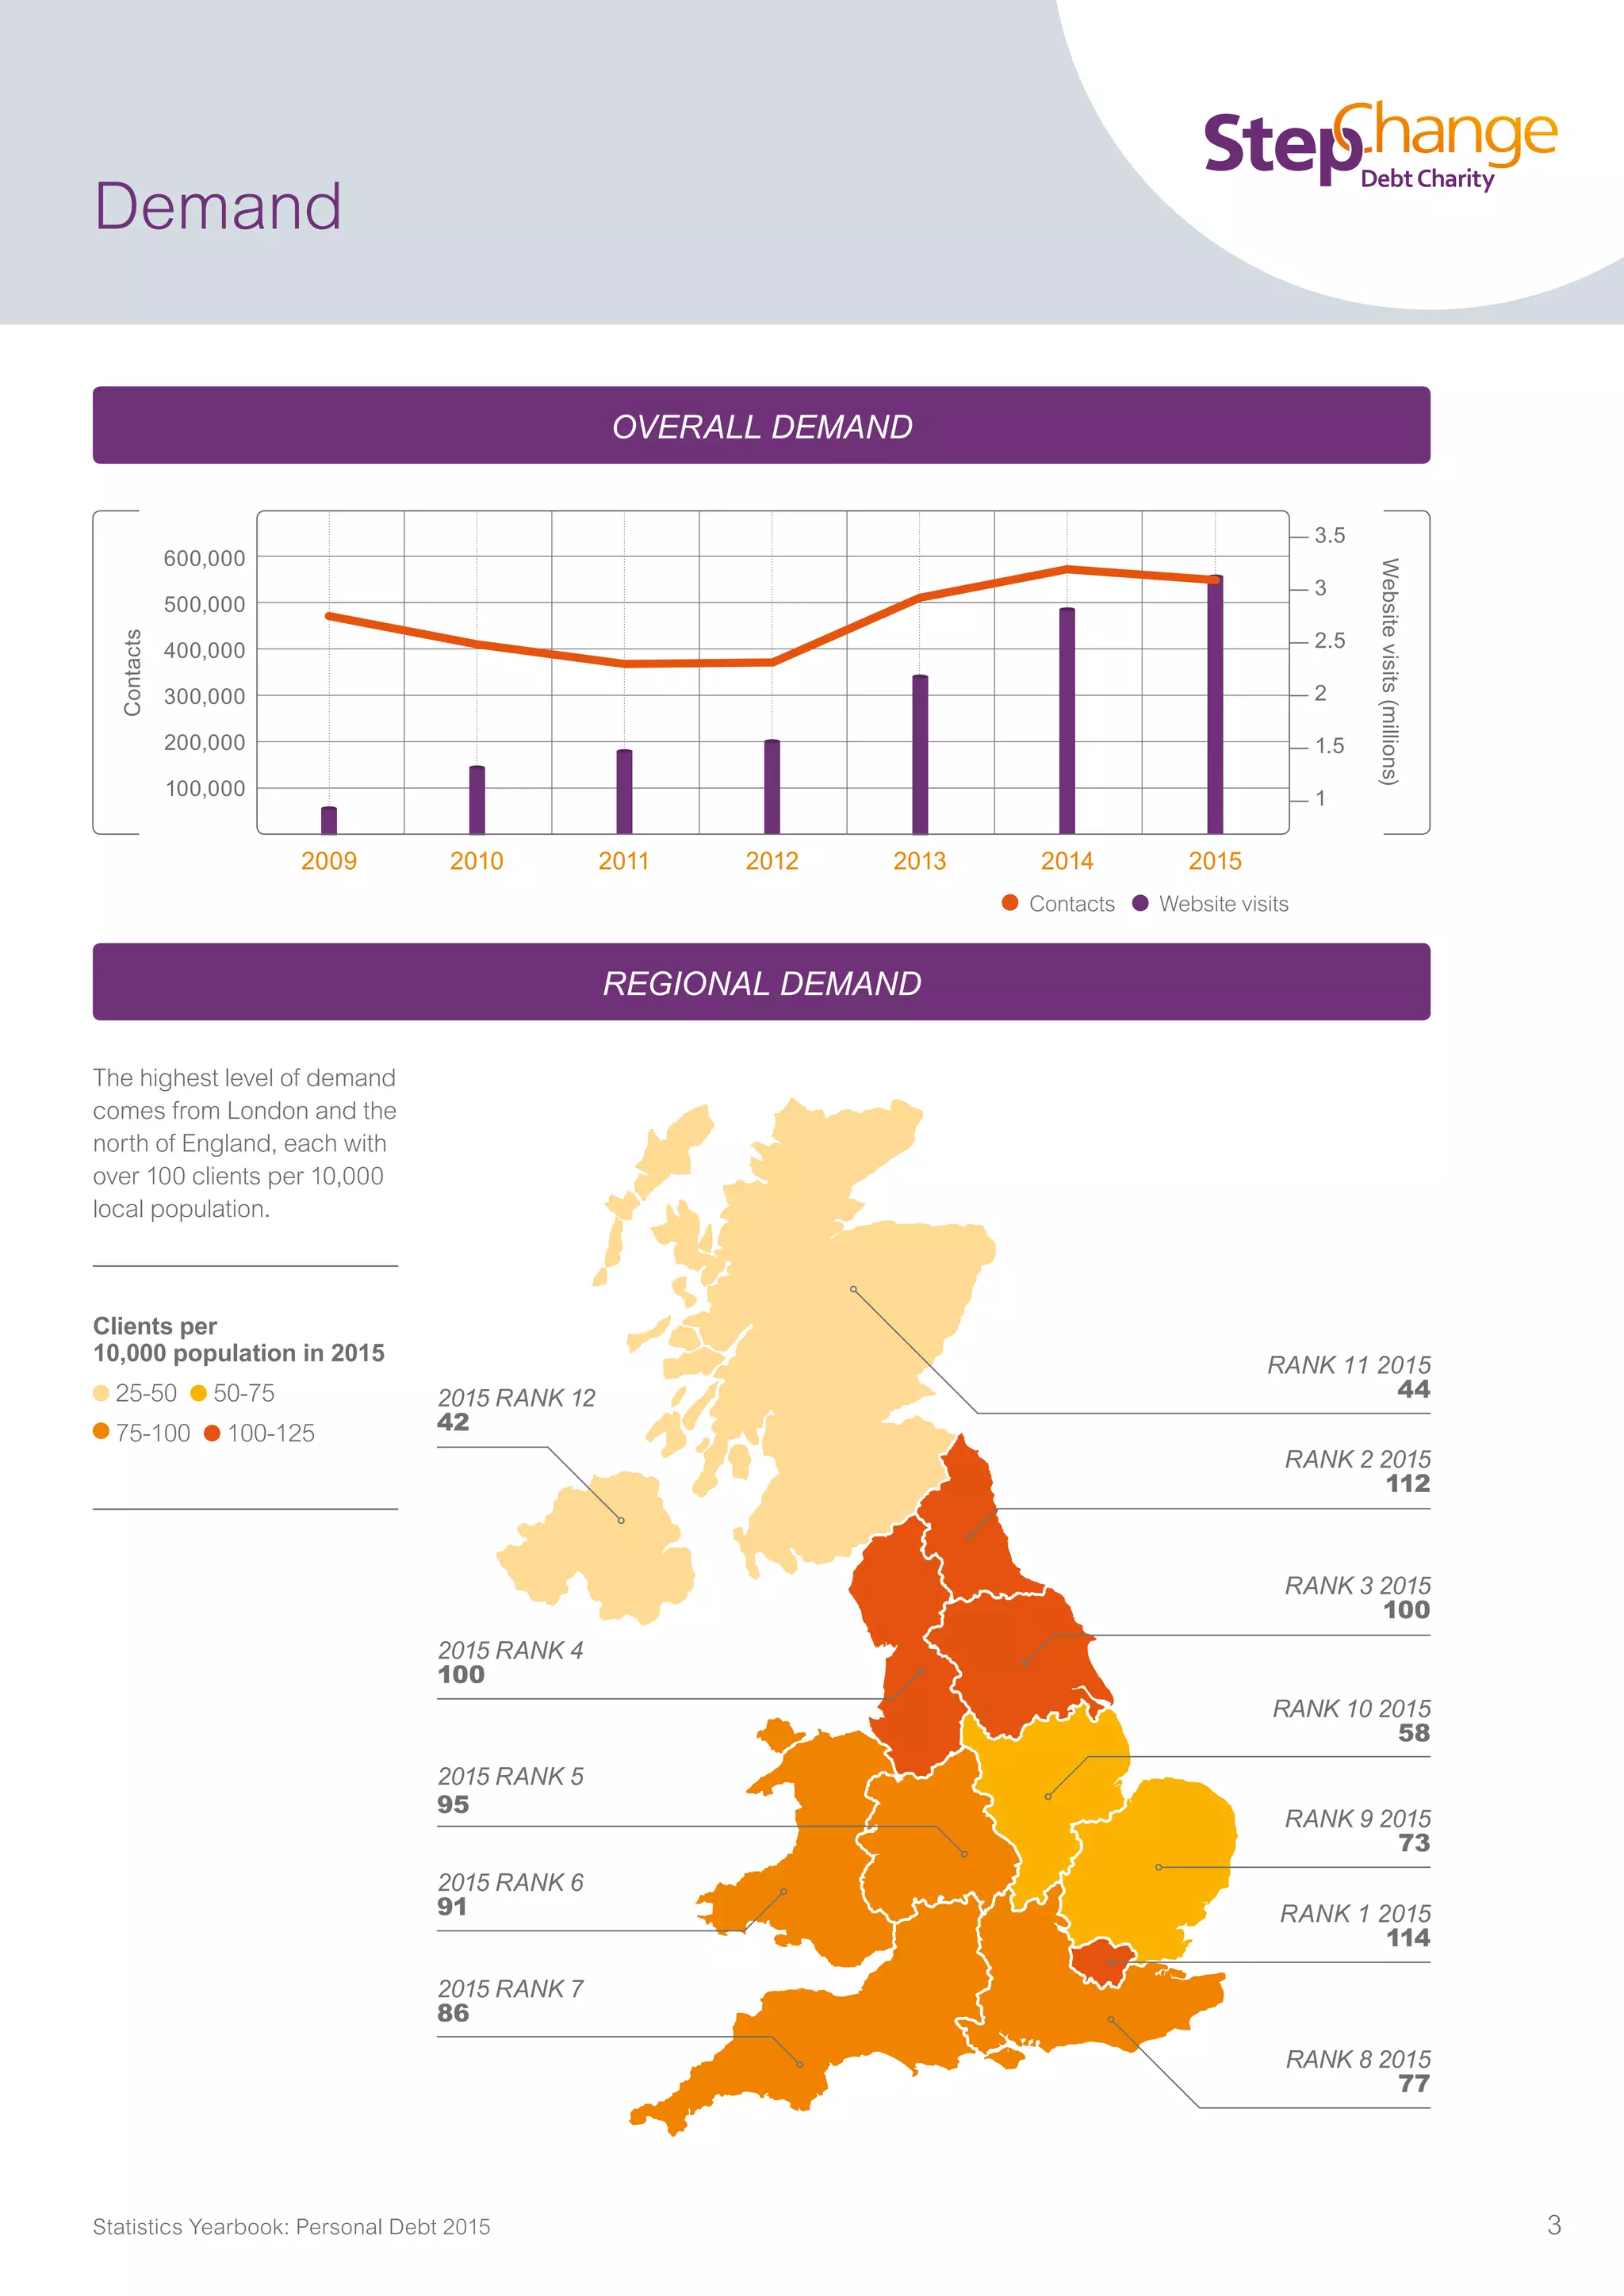
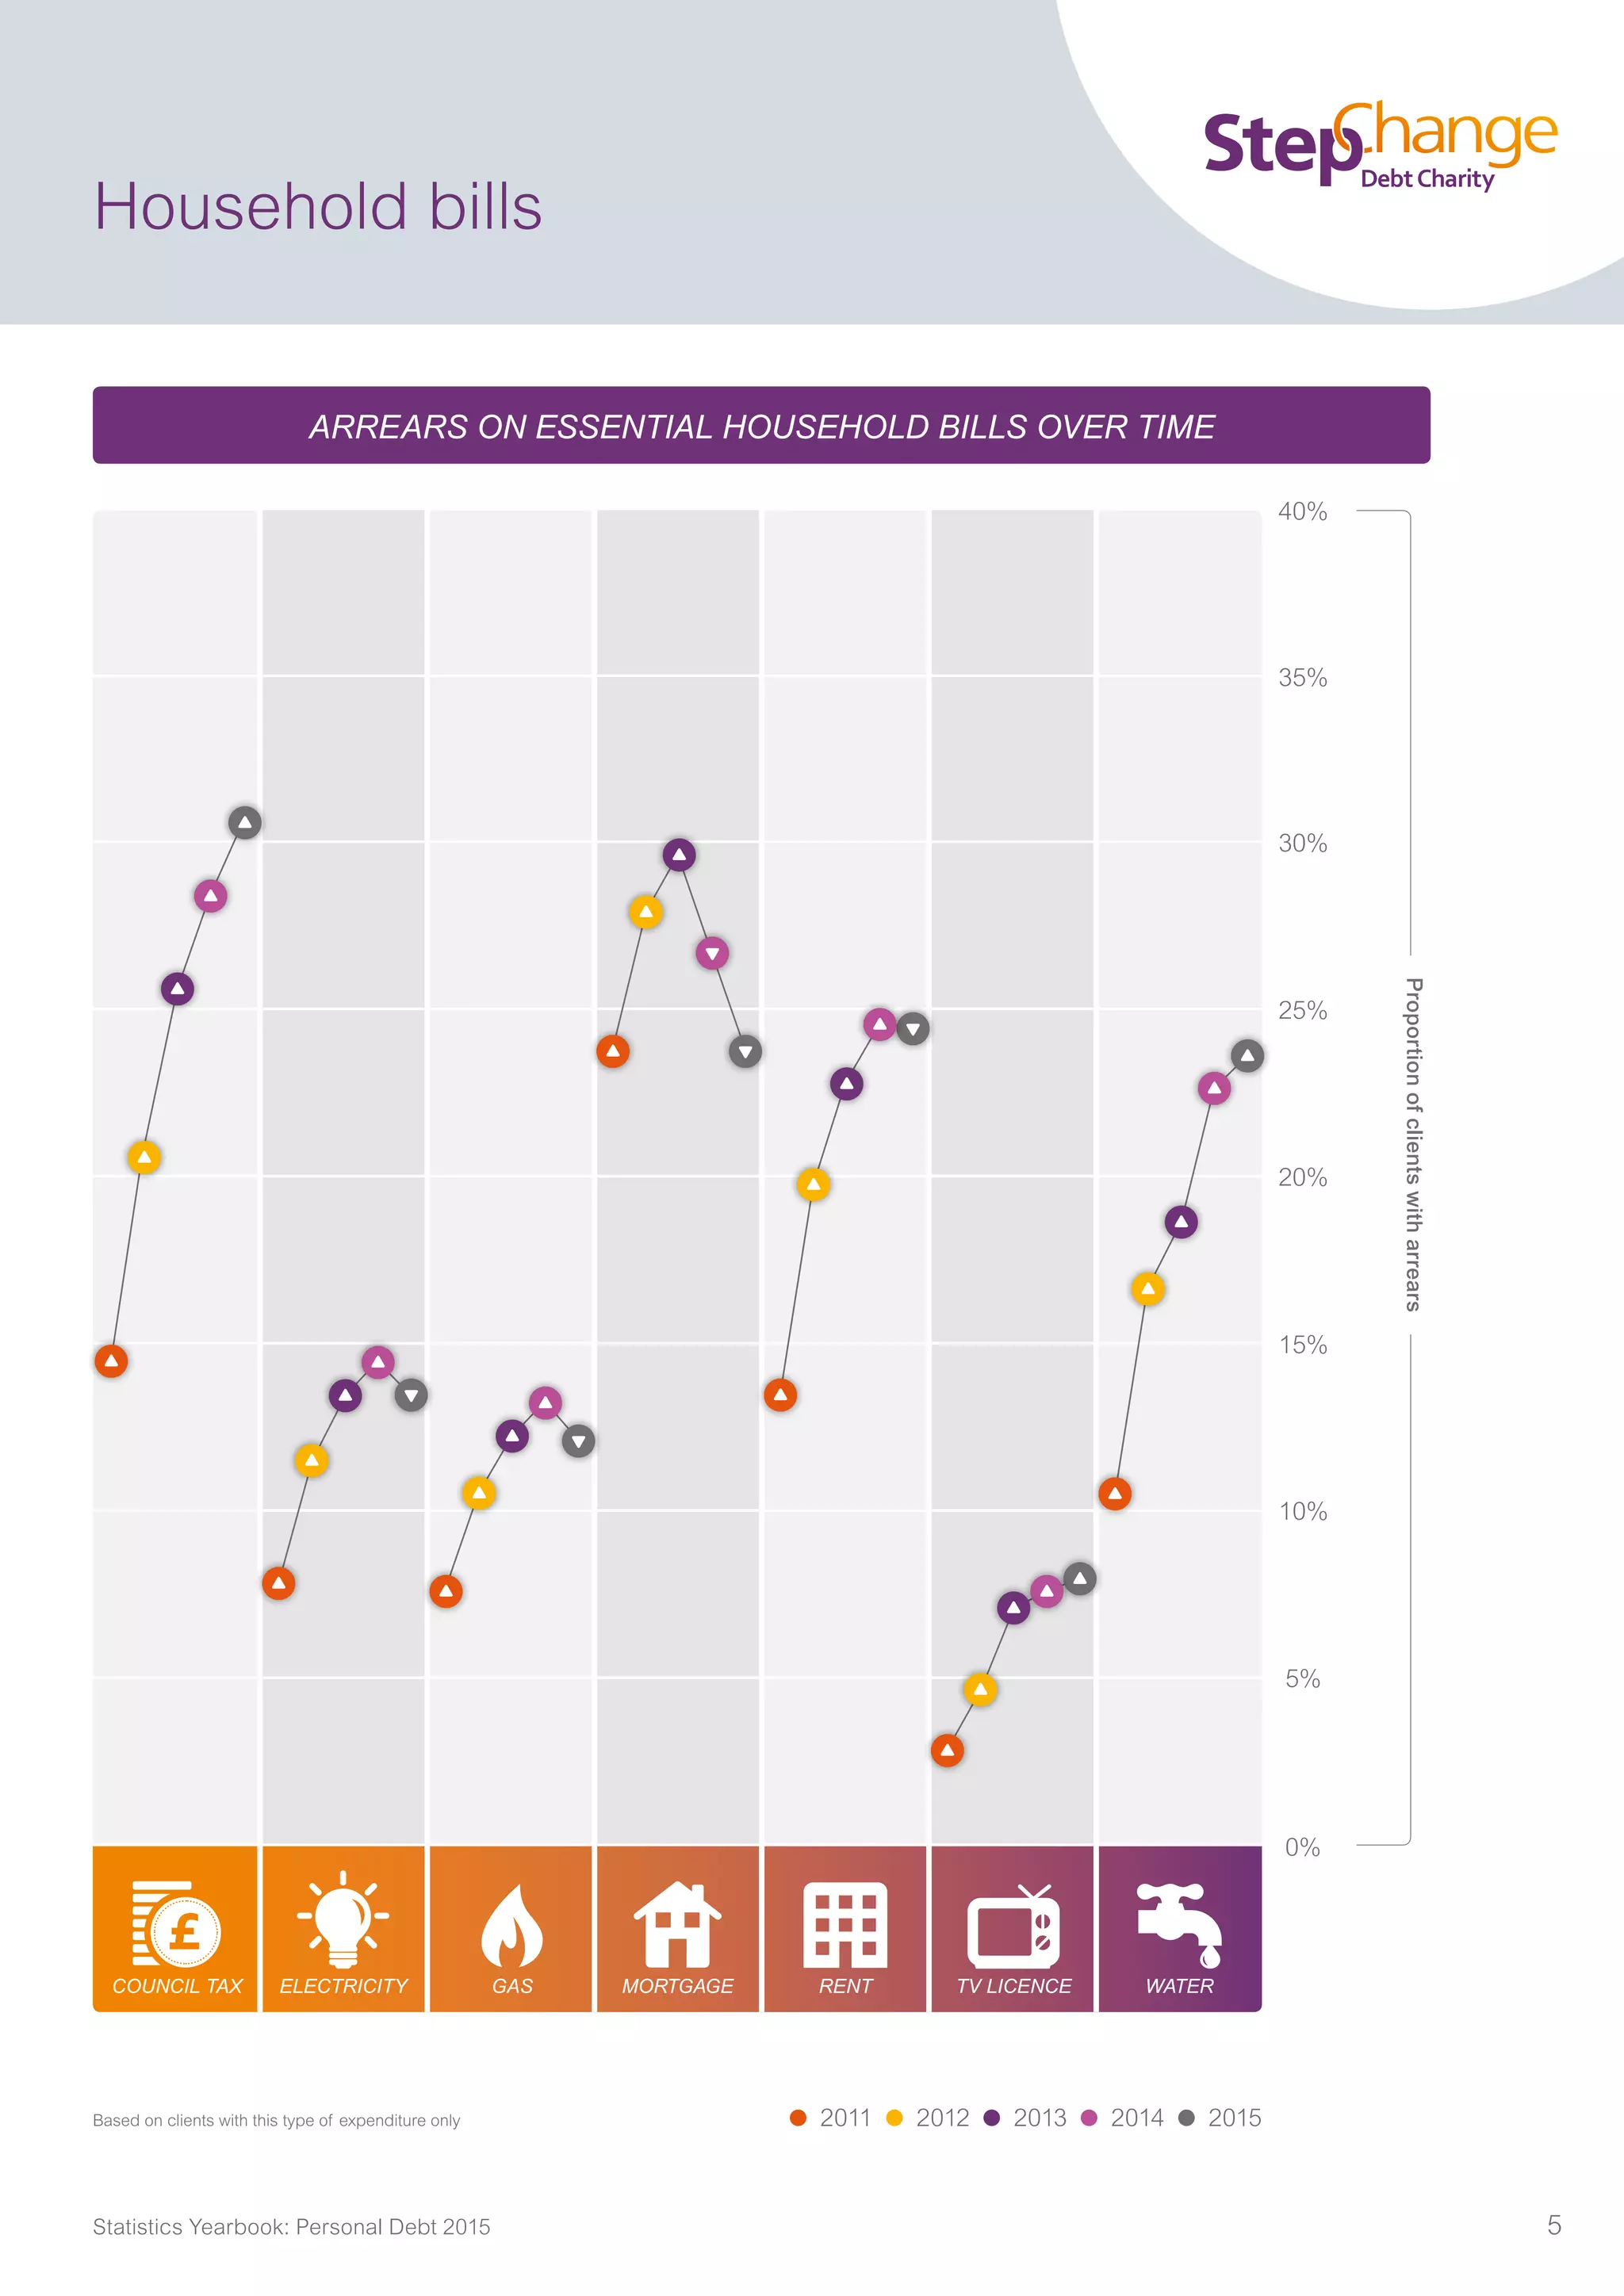
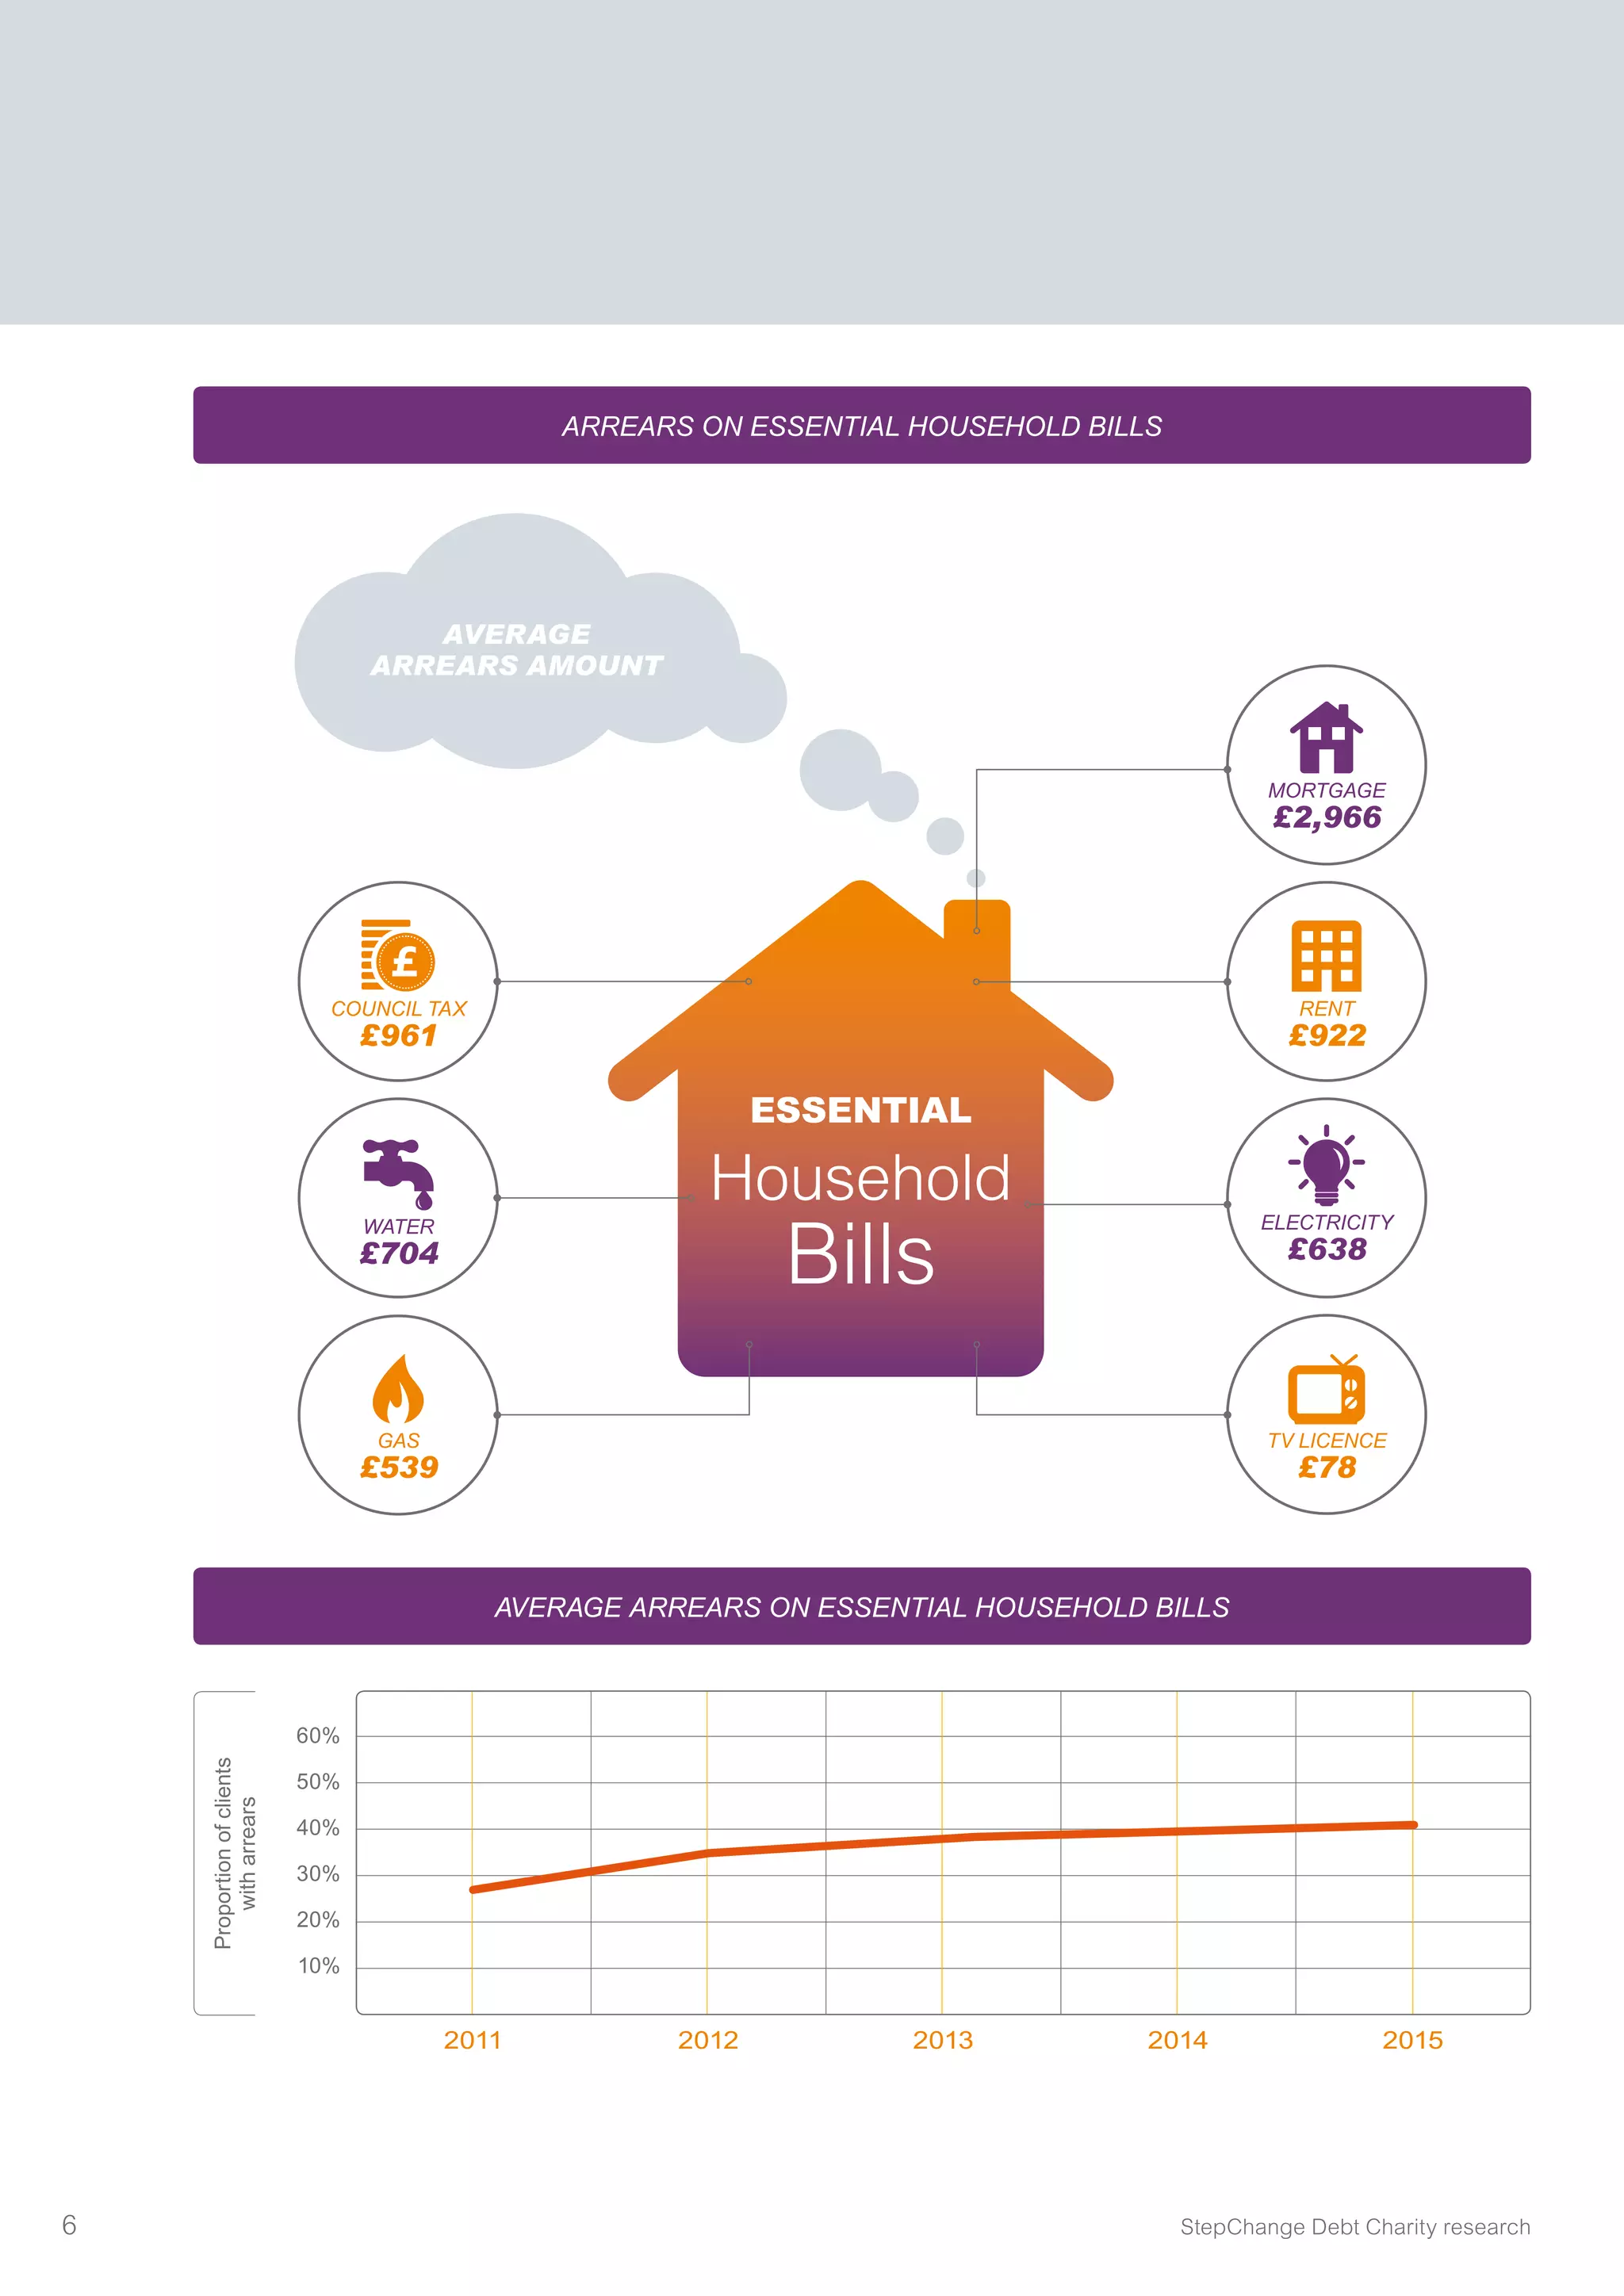
A look at the lives of half a million people in debt in the UK
Statistics
Yearbook
Personal Debt 2015
StepChange Debt Charity research2
Main findings 2015
1 Not including arrears on essential household bills.
Unless otherwise specified, data is based on the 307,043
new clients debt advised in 2015.
What debts do people have?
The average unsecured debt of our clients in
2015 was £13,9001
. The average number of debts
per person was 5.6. Credit cards were the most
common unsecured debt.
The proportion of clients we see with arrears on
essential household bills continues to grow. More
than four in 10 now owe money on items such as
council tax, rent and utilities. This is compared to
around a quarter in 2011.
Who’s seeking advice?
More than half (57%) of those seeking debt advice in 2015
were employed. But of these, fewer people have full-time jobs,
and more people have part-time jobs. More renters need help
than ever before. In 2015 over 75% of StepChange Debt Charity
clients live in rented accommodation, compared to a little over
50% five years ago.
More young people are contacting us; 57% of clients are under
40, and 14% are under 25. A growing proportion of clients are
single parents, now at close to 20%. This compares to just 7%
of UK households.
The average income for clients has continued to fall, now annually
at under £16,000 (net). The amount clients are left with at the end
of the month has also fallen over the last year, now at an average
of £55 per month.
The biggest cause of falling into debt is an income or employment
change. One in five of the charity’s clients in 2015 fell into problem
debt due to losing their job. A further 15% fell into problem debt due
to a reduced or irregular income. The average income of our clients
in 2015 was the lowest it has been in the previous five years.
Demand for debt advice
549,053 people contacted StepChange Debt Charity for help
in 2015. London continues to be the area where people are
most likely to be in need of advice. There were over three
million visits to the charity’s website, a 97% increase on 2012.
The data in this Statistics Yearbook is drawn
from a StepChange Debt Charity warehouse
containing the details of 20.5 million calls
and over three million clients. 2015 figures
are based on the 307,043 new
clients in this year.
Overall demand
Regional demand
2009 2010 2011 2012 2013 2014 2015
600,000
500,000
400,000
300,000
200,000
100,000
Contacts
Websitevisits(millions)
3.5
3
2.5
2
1.5
1
Statistics Yearbook: Personal Debt 2015 3
Demand
The highest level of demand
comes from London and the
north of England, each with
over 100 clients per 10,000
local population.
Clients per
10,000 population in 2015
25-50 50-75
75-100 100-125
Rank 3 2015
100
Rank 10 2015
58
Rank 8 2015
77
Rank 11 2015
44
Rank 1 2015
114
Rank 9 2015
73
Rank 2 2015
112
2015 Rank 4
100
2015 Rank 12
42
2015 Rank 6
91
2015 Rank 7
86
2015 Rank 5
95
Contacts Website visits
Averagetotal
unsecureddebt
Unsecured debts
StepChange Debt Charity research4
Unsecured debts
Unsecured debt over time
2011 2012 2013 2014 2015
£20,000
£15,000
£10,000
£1,063
£1,308
£1,937
£1,424
£8,637
£1,725
£8,403
CATALOGUE
34.7%
PAYDAY LOAN
15.7%
STORE CARD
12.5%
PAYDAY LOAN
15.7%
AVERAGE DEBT AMOUNT
CREDIT CARD
65.7%
PERSONAL LOAN
42.6%
OVERDRAFT
55.1%
HOME CREDIT
9.1%
UNSECURED
DEBT TYPE
% of clients
with each type
of debt
Arrears on essential household bills over time
2011 2012 2013 2014 2015Based on clients with this type of expenditure only
Statistics Yearbook: Personal Debt 2015 5
Household bills
MORTGAGE TV LICENCERENTGASCOUNCIL TAX ELECTRICITY WATER
0%
5%
10%
15%
20%
25%
30%
35%
40%
Proportionofclientswitharrears
StepChange Debt Charity research6
Arrears on essential household bills
Essential
Household
Bills
avERAGE
arrears amount
COUNCIL TAX
£961
WATER
£704
GAS
£539
TV LICENCE
£78
ELECTRICITY
£638
RENT
£922
MORTGAGE
£2,966
Proportionofclients
witharrears
Average arrears on essential household bills
2011 2012 2013 2014 2015
60%
50%
40%
30%
20%
10%
30%
25%
20%
15%
10%
5%
Proportionofclients
Statistics Yearbook: Personal Debt 2015 7
Employment status
What do those in debt look like?
Employed
full time
Employed
part time Full time carer
Looking after
the family Retired Self employed Student Unemployed
Housing
Homeowners Renters
2011 2012 2013 2014 2015
70%
60%
50%
40%
30%
20%
Annual(net)income
Monthlysurplus
Proportionofclients
Income and surplus
Annual (net) income Monthly surplus
2011 2012 2013 2014 2015
2011
2012
2013
2014
2015
2011
2012
2013
2014
2015
2011
2012
2013
2014
2015
2011
2012
2013
2014
2015
2011
2012
2013
2014
2015
2011
2012
2013
2014
2015
2011
2012
2013
2014
2015
2011
2012
2013
2014
2015
£17,100
£17,000
£16,900
£16,800
£16,700
£16,600
£16,500
£16,400
£16,300
£16,200
£70
£60
£50
£40
£30
£20
£10
£0
Family composition
2011 2012 2013 2014 2015
40%
35%
30%
25%
20%
15%
10%
5%
Under 25 25-39 40-59 60 and over
Age
Editor: Henry Hall
For data tables, including additional raw data, visit the StepChange Debt Charity website here
For help and advice with problem debts call (Freephone) 0800 138 1111 Monday to Friday
8am to 8pm and Saturday 8am to 4pm, or use our online debt advice tool, Debt Remedy.
Email: policy@stepchange.org | Web: www.stepchange.org | Twitter: @stepchange
80%
70%
60%
50%
40%
30%
20%
10%
38.8%
Single without children
(34% UK Av.)
25.9%
Couples with children
(23% UK Av.)
19.6%
Single with children
(7% UK Av.)
15.6%
Couples without children
(36% UK Av.)
Proportionofclients
© 2016 Foundation for Credit Counselling, Wade House, Merrion Centre, Leeds, LS2 8NG
trading as StepChange Debt Charity and StepChange Debt Charity Scotland.
A registered charity no.1016630 and SC046263.
Authorised and regulated by the Financial Conduct Authority
UK Average
Proportionofclients
Source: ONS Families and Households, 2015

Stats_Yearbook_2015

  • 1.
    A look atthe lives of half a million people in debt in the UK Statistics Yearbook Personal Debt 2015
  • 2.
    StepChange Debt Charityresearch2 Main findings 2015 1 Not including arrears on essential household bills. Unless otherwise specified, data is based on the 307,043 new clients debt advised in 2015. What debts do people have? The average unsecured debt of our clients in 2015 was £13,9001 . The average number of debts per person was 5.6. Credit cards were the most common unsecured debt. The proportion of clients we see with arrears on essential household bills continues to grow. More than four in 10 now owe money on items such as council tax, rent and utilities. This is compared to around a quarter in 2011. Who’s seeking advice? More than half (57%) of those seeking debt advice in 2015 were employed. But of these, fewer people have full-time jobs, and more people have part-time jobs. More renters need help than ever before. In 2015 over 75% of StepChange Debt Charity clients live in rented accommodation, compared to a little over 50% five years ago. More young people are contacting us; 57% of clients are under 40, and 14% are under 25. A growing proportion of clients are single parents, now at close to 20%. This compares to just 7% of UK households. The average income for clients has continued to fall, now annually at under £16,000 (net). The amount clients are left with at the end of the month has also fallen over the last year, now at an average of £55 per month. The biggest cause of falling into debt is an income or employment change. One in five of the charity’s clients in 2015 fell into problem debt due to losing their job. A further 15% fell into problem debt due to a reduced or irregular income. The average income of our clients in 2015 was the lowest it has been in the previous five years. Demand for debt advice 549,053 people contacted StepChange Debt Charity for help in 2015. London continues to be the area where people are most likely to be in need of advice. There were over three million visits to the charity’s website, a 97% increase on 2012. The data in this Statistics Yearbook is drawn from a StepChange Debt Charity warehouse containing the details of 20.5 million calls and over three million clients. 2015 figures are based on the 307,043 new clients in this year.
  • 3.
    Overall demand Regional demand 20092010 2011 2012 2013 2014 2015 600,000 500,000 400,000 300,000 200,000 100,000 Contacts Websitevisits(millions) 3.5 3 2.5 2 1.5 1 Statistics Yearbook: Personal Debt 2015 3 Demand The highest level of demand comes from London and the north of England, each with over 100 clients per 10,000 local population. Clients per 10,000 population in 2015 25-50 50-75 75-100 100-125 Rank 3 2015 100 Rank 10 2015 58 Rank 8 2015 77 Rank 11 2015 44 Rank 1 2015 114 Rank 9 2015 73 Rank 2 2015 112 2015 Rank 4 100 2015 Rank 12 42 2015 Rank 6 91 2015 Rank 7 86 2015 Rank 5 95 Contacts Website visits
  • 4.
    Averagetotal unsecureddebt Unsecured debts StepChange DebtCharity research4 Unsecured debts Unsecured debt over time 2011 2012 2013 2014 2015 £20,000 £15,000 £10,000 £1,063 £1,308 £1,937 £1,424 £8,637 £1,725 £8,403 CATALOGUE 34.7% PAYDAY LOAN 15.7% STORE CARD 12.5% PAYDAY LOAN 15.7% AVERAGE DEBT AMOUNT CREDIT CARD 65.7% PERSONAL LOAN 42.6% OVERDRAFT 55.1% HOME CREDIT 9.1% UNSECURED DEBT TYPE % of clients with each type of debt
  • 5.
    Arrears on essentialhousehold bills over time 2011 2012 2013 2014 2015Based on clients with this type of expenditure only Statistics Yearbook: Personal Debt 2015 5 Household bills MORTGAGE TV LICENCERENTGASCOUNCIL TAX ELECTRICITY WATER 0% 5% 10% 15% 20% 25% 30% 35% 40% Proportionofclientswitharrears
  • 6.
    StepChange Debt Charityresearch6 Arrears on essential household bills Essential Household Bills avERAGE arrears amount COUNCIL TAX £961 WATER £704 GAS £539 TV LICENCE £78 ELECTRICITY £638 RENT £922 MORTGAGE £2,966 Proportionofclients witharrears Average arrears on essential household bills 2011 2012 2013 2014 2015 60% 50% 40% 30% 20% 10%
  • 7.
    30% 25% 20% 15% 10% 5% Proportionofclients Statistics Yearbook: PersonalDebt 2015 7 Employment status What do those in debt look like? Employed full time Employed part time Full time carer Looking after the family Retired Self employed Student Unemployed Housing Homeowners Renters 2011 2012 2013 2014 2015 70% 60% 50% 40% 30% 20% Annual(net)income Monthlysurplus Proportionofclients Income and surplus Annual (net) income Monthly surplus 2011 2012 2013 2014 2015 2011 2012 2013 2014 2015 2011 2012 2013 2014 2015 2011 2012 2013 2014 2015 2011 2012 2013 2014 2015 2011 2012 2013 2014 2015 2011 2012 2013 2014 2015 2011 2012 2013 2014 2015 2011 2012 2013 2014 2015 £17,100 £17,000 £16,900 £16,800 £16,700 £16,600 £16,500 £16,400 £16,300 £16,200 £70 £60 £50 £40 £30 £20 £10 £0
  • 8.
    Family composition 2011 20122013 2014 2015 40% 35% 30% 25% 20% 15% 10% 5% Under 25 25-39 40-59 60 and over Age Editor: Henry Hall For data tables, including additional raw data, visit the StepChange Debt Charity website here For help and advice with problem debts call (Freephone) 0800 138 1111 Monday to Friday 8am to 8pm and Saturday 8am to 4pm, or use our online debt advice tool, Debt Remedy. Email: policy@stepchange.org | Web: www.stepchange.org | Twitter: @stepchange 80% 70% 60% 50% 40% 30% 20% 10% 38.8% Single without children (34% UK Av.) 25.9% Couples with children (23% UK Av.) 19.6% Single with children (7% UK Av.) 15.6% Couples without children (36% UK Av.) Proportionofclients © 2016 Foundation for Credit Counselling, Wade House, Merrion Centre, Leeds, LS2 8NG trading as StepChange Debt Charity and StepChange Debt Charity Scotland. A registered charity no.1016630 and SC046263. Authorised and regulated by the Financial Conduct Authority UK Average Proportionofclients Source: ONS Families and Households, 2015