What is Statistics?
The science which deals with the method of collecting,
classifying, organizing, presenting, comparing, analyzing, and
interpreting numerical data to assist in making more effective
decisions.
“Statistics may be regarded as a body of methods for making
wise decisions in the face of uncertainty.”
- Wallis and Roberts
Statistics is the science and art of handling aggregate of facts-
observing, recording, classifying and systematically treating
them.
- Horlow
3.
Why statistics isimportant for managers
1. Data generation is not a difficult task for manager. A
manager will be able to generate data from various
sources. The problem lies in interpretation this data. To do
this, a manager has to develop statistical thinking.
2. Statistical thinking can be defined as the ability to collect,
tabulate (present and describe), analyze and interpret data.
4.
Scope and importanceof Statistics
Statistics is gaining increasing importance in industry, business and
commerce.
To succeed in any business, the businessman must study all the
factors which enter production, buying and selling, exporting and
importing of goods in which they deal.
In any business, a businessman must first determine the demand
for his product.
used in various problems of production, consumption and
distribution etc. relating to economics.
also useful in formulating various economic policies
For the preparation of budget, statistics relating to various
incomes and expenditures of the government must be collected.
5.
Future employmentpolicy, tax policy, etc. of a state are
essentially based on various statistical information.
Statistical data relating to prices, production, consumption,
income, expenditure, export, import etc. are extensively
used by the governments for formulating their economic and
other policies.
6.
What is Data?
Observation expressed in numerical figures obtained by
measuring or counting are called data.
For ex : if we express in figures our observations in respect
of the weights of certain objects then these figures will be
called data.
7.
Why we needdata
The success of a business depends on obtaining appropriate
information. Some instances where data are needed in
business are as follows:
- The VP (Marketing) has to make a decision about a new
product launch.
- The media manager has to decide about the advertising
campaign.
- The production manager has to improve the quality of a
particular product.
8.
Basic Concepts
Characteristic– A quality possessed by an individual or object is
called a characteristic of the individual or object.
Ex. Height, weight, temperature, honesty, nationality
A characteristic may be measurable or non-measurable.
A measurable characteristic is called a variable. It is expressible
numerically in terms of some unit.
Ex: Weights of various students will be the values of x
A variable may be discrete or continuous.
Discrete Variable : A variable which takes specific values only
(integral values only) between two fixed limits is called a Discrete
Variable
9.
Continuous Variable: A variable which can take any value
between two fixed limits is called a continuous variable.
Attribute: A non-measurable characteristic like gender, age,
religion, honesty, nationality, etc. is called an attribute.
- An attribute cannot be measured numerically, but can be
classified under different categories.
10.
Types of statistics
Descriptive statistics – Methods of organizing,
summarizing, and presenting data in an informative way. It is
the process of describing data and trying to reach a
conclusion based on it.
Inferential statistics – The methods used to determine
something about a population on the basis of a sample
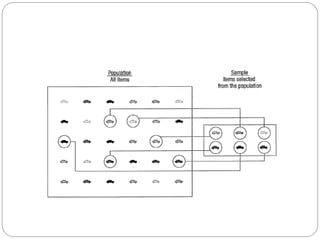
Population –The entire set of individuals or objects of interest
or the measurements obtained from all individuals or objects of
interest
Sample – A portion, or part, of the population of interest
12.
Inferential Statistics
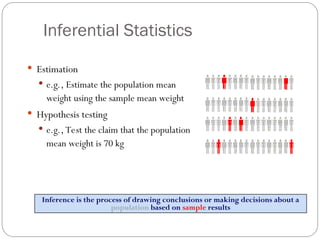
Estimation
e.g., Estimate the population mean
weight using the sample mean weight
Hypothesis testing
e.g., Test the claim that the population
mean weight is 70 kg
Inference is the process of drawing conclusions or making decisions about a
population based on sample results
13.
Sampling
a sample shouldhave the same characteristics
as the population it is representing.
Sampling can be:
with replacement: a member of the population may be
chosen more than once (picking the candy from the bowl)
without replacement: a member of the population may
be chosen only once (lottery ticket)
14.
Sampling methods
Sampling methodscan be:
Random or probability sampling : each member of the
population has an equal chance of being selected
Nonrandom or judgment sampling : Personal knowledge and
opinion are used to identify the items from the population that are to
be included in the sample.
15.
Random sampling methods
simple random sample (each sample of the same size has an
equal chance of being selected)
stratified sample (divide the population into groups called
strata and then take a sample from each stratum)
cluster sample (divide the population into strata and then
randomly select some of the strata. All the members from these
strata are in the cluster sample.)
systematic sample (randomly select a starting point and take
every n-th piece of data from a listing of the population)
Note: We use stratified sampling when each group has small
variation with itself but there is a wide variation between the
groups. We use cluster sampling in the opposite case-
16.
Measure of CentralTendency
Central tendency is the middle point of a distribution.
Also refer to measures of location
Curves representing the data points in the data set may be
either symmetrical or skewed.
Positively skewed: curve skewed to the right because it tails
off towards the high end of the scale.
Negatively skewed: curve skewed to the left because it tails
off towards the low end of the scale.
Kurtosis : measuring the peakedness of the curve.
17.
Mean :arithmetic average of a set of observation.
Median : The middle point of a data set, a measure of
location that divides the data set into halves.
Mode : The value most often repeated in the data set.
Parameter : Characteristics of a whole population
Statistics : Characteristics of a sample.
Quartiles : divide the data into four equal parts.
Deciles : divide the data into 10 equal parts.
Percentiles : divide the data into 100 equal parts.
18.
Measure of Dispersion
A measure describing how the observation in a data set
scattered or spread out.
Also refer to distance measures
Range:
Interquartile range
Variance : A measure of the average squared distance
between the mean and each item in the population.
19.
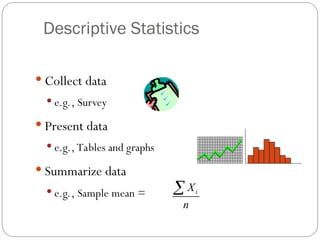
Descriptive Statistics
Collectdata
e.g., Survey
Present data
e.g., Tables and graphs
Summarize data
e.g., Sample mean = i
X
n
20.
Statistical data
Thecollection of data that are relevant to the problem being
studied is commonly the most difficult, expensive, and time-
consuming part of the entire research project.
Statistical data are usually obtained by counting or measuring
items.
Primary data are collected specifically for the analysis desired
Secondary data have already been compiled and are available
for statistical analysis
A variable is an item of interest that can take on many
different numerical values.
A constant has a fixed numerical value.
21.
Data
Statistical data areusually obtained by counting or measuring
items. Most data can be put into the following categories:
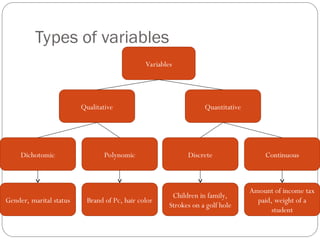
Qualitative data - is information about qualities;
information that can't actually be measured. (hair color,
honesty and other attributes of the population)
Quantitative data- data are observations that are
measured on a numerical scale (distance traveled to college,
number of children in a family, etc.)
22.
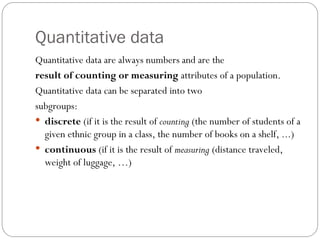
Quantitative data
Quantitative dataare always numbers and are the
result of counting or measuring attributes of a population.
Quantitative data can be separated into two
subgroups:
discrete (if it is the result of counting (the number of students of a
given ethnic group in a class, the number of books on a shelf, ...)
continuous (if it is the result of measuring (distance traveled,
weight of luggage, …)
Correlation
Correlation isa statistical tool that helps to measure and
analyze the degree of relationship between two
variables.
Correlation analysis deals with the association between
two or more variables.
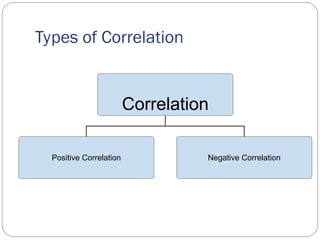
Positive Correlation:The correlation is said to be positive
correlation if the values of two variables changing with same
direction.
Ex. Pub. Exp. & sales, Height & weight.
Negative Correlation: The correlation is said to be
negative correlation when the values of variables change
with opposite direction.
Ex. Price & qty. demanded.
27.
Positive relationship– Variables change in the same
direction.
As X is increasing, Y is increasing
As X is decreasing, Y is decreasing
E.g., As height increases, so does weight.
Negative relationship – Variables change in opposite
directions.
As X is increasing, Y is decreasing
As X is decreasing, Y is increasing
E.g., As TV time increases, grades decrease
28.
Probability
Probability :The chance that something will happen.
Probabilities are expressed as fractions or as decimals
between zero and one.
Probability of zero means that something can never happen
Probability of 1 means something will always happen.
Classical probability: The number of outcomes favorable to
the occurrence of an event divided by the total number of
possible outcomes.
29.
Application of Probability
Sports : To decide what are the chances of winning or losing
of a particular team based on their previous record.
For instance, by tracking the record of a batsman in cricket,
it is decided at what place or rank, he should play.
Also used for Planning Around the Weather
For example, if there's a 60-percent chance of rain, then the
weather conditions are such that 60 out of 100 days with
similar conditions, it has rained.
Probability plays an important role in analyzing insurance
policies to determine which plans are best for you or your
family.
30.
For example,when choosing a car insurance policy, you use
probability to determine how likely it is that you'll need to
file a claim.
In business, probability theory is used in the calculation of
long term gains and losses.
Sales Forecasting is one practical use for probability
distributions and scenario analysis in business is to predict
future levels of sales.
 Most read
 Most read