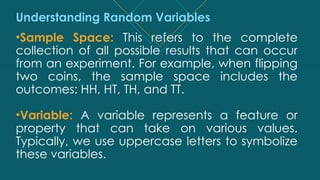
Understanding Random Variables
•SampleSpace: This refers to the complete
collection of all possible results that can occur
from an experiment. For example, when flipping
two coins, the sample space includes the
outcomes: HH, HT, TH, and TT.
•Variable: A variable represents a feature or
property that can take on various values.
Typically, we use uppercase letters to symbolize
these variables.
3.
EXPLORING RANDOM VARIABLES
•RandomVariable: A function assigning a
real number to each outcome in the sample
space.
Its values are determined by chance,
reflecting randomness.
Project analysis slide2
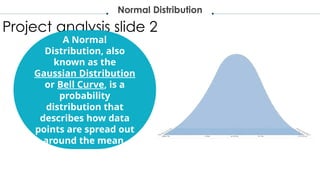
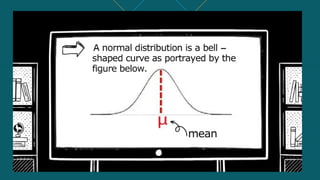
Normal Distribution
A Normal
Distribution, also
known as the
Gaussian Distribution
or Bell Curve, is a
probability
distribution that
describes how data
points are spread out
around the mean.
9.
Mean = median= mode
The normal curve is a bell-shaped and symmetric about the
mean
The area to left of the y-axis is 50%
and the area to right of the y-axis is 50%.
The total area under the curve is equal to 1 or 100%
The two end tail of the curve never touches the x-axis as it
extends from the mean.
Properties of
Normal Distribution
Project analysis slide2
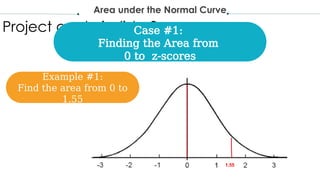
Case #1:
Finding the Area from
0 to z-scores
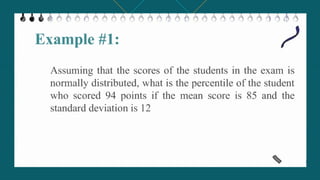
Example #1:
Find the area from 0 to
1.55
1.55
Area under the Normal Curve
12.
Project analysis slide2
Case #1:
Finding the Area from
0 to z-scores
Example #1:
Find the area from 0 to
1.55
1.55
Area under the Normal Curve
13.
Project analysis slide2
Example #1:
Find the area from 0
to 1.55
1.55
O
Z = 0 ; Z = 1.55
A = 0 + 0.4394
A = 0.4394
A = 43.94%
Area under the Normal Curve
14.
Project analysis slide2
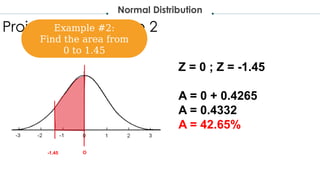
Normal Distribution
Example #2:
Find the area from
0 to 1.45
-1.45 O
Z = 0 ; Z = -1.45
A = 0 + 0.4265
A = 0.4332
A = 42.65%
15.
Project analysis slide2
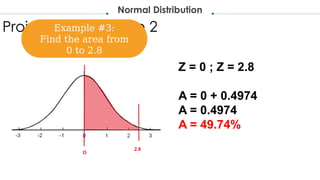
Normal Distribution
Example #3:
Find the area from
0 to 2.8
2.8
O
Z = 0 ; Z = 2.8
A = 0 + 0.4974
A = 0.4974
A = 49.74%
16.
Project analysis slide2
Normal Distribution
Example #4:
Find the area from
0 to -0.25
-0.25
O
Z = 0 ; Z = -0.25
A = 0 + 0.0987
A = 0.0987
A = 9.87%
17.
Project analysis slide2
Case #2:
Finding the areato the
left/right of z-scores
Area under the Normal Curve
Note:
Area to the left of (+)z-score
Area to the right of ( - ) z-score
Area to the left of (-) z-score
Area to the right of ( + ) z-score
subtract 0.50
add 0.50
18.
Project analysis slide2
Case #2:
Finding the areato the
left/right of z-scores
Example #1:
Find the area
to the left of 1.55
1.55
Area under the Normal Curve
19.
Project analysis slide2
Normal Distribution
to the left of Z=1.55
A = .50 + 0.4394
A = 0.9394
A = 93.94%
Example #1:
Find the area
to the left of 1.55
1.55
20.
Project analysis slide2
Normal Distribution
to the left of Z= -1.37
A = .50 - 0.4147
A = 0.0853
A = 8.53%
Example #2:
Find the area
to the left of -1.37
-1.37
21.
Project analysis slide2
Normal Distribution
to the right of Z= 2.75
A = .50 - 0.4970
A = 0.003
A = 0.3%
Example #3:
Find the area
to the right of 2.75
2.75
22.
Project analysis slide2
Normal Distribution
to the right of Z = - 0.82
A = .50 + 0.2939
A = 0.7939
A = 79.39%
Example #4:
Find the area
to the right of -0.82
-0.82
23.
Project analysis slide2
Case #3:
Finding the area between two z-
scores
Area under the Normal Curve
Note:
Area bet. + and +
Area bet. – and -
Area bet. + and -
Area bet. – and +
subtract the two
areas
add the two areas
24.
Project analysis slide2
Case #3:
Finding the area between two z-
scores
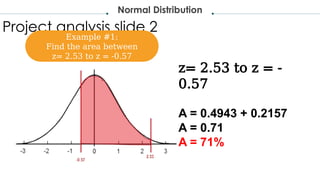
Example #1:
Find the area between
z= 2.53 to z = -0.57
2.53
Area under the Normal Curve
-0.57
25.
Project analysis slide2
Normal Distribution
z= 2.53 to z = -
0.57
A = 0.4943 + 0.2157
A = 0.71
A = 71%
Example #1:
Find the area between
z= 2.53 to z = -0.57
26.
Project analysis slide2
Normal Distribution
z= -1.75 to z=
0.10
A = 0.4599 + 0.0398
A = 0.4997
A = 49.97%
Example #2:
Find the area between
z= -1.75 to z= 0.10
-0.82
27.
Project analysis slide2
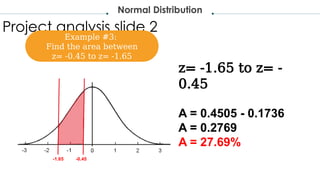
Normal Distribution
z= -1.65 to z= -
0.45
A = 0.4505 - 0.1736
A = 0.2769
A = 27.69%
Example #3:
Find the area between
z= -0.45 to z= -1.65
-1.65 -0.45
28.
Project analysis slide2
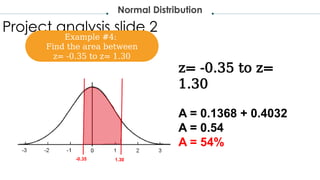
Normal Distribution
z= -0.35 to z=
1.30
A = 0.1368 + 0.4032
A = 0.54
A = 54%
Example #4:
Find the area between
z= -0.35 to z= 1.30
1.30
-0.35
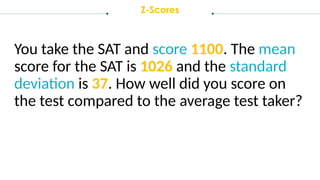
Z-Scores
You take theSAT and score 1100. The mean
score for the SAT is 1026 and the standard
deviation is 37. How well did you score on
the test compared to the average test taker?
32.
Z-Scores
You take theSAT and score 1100. The mean score for the SAT is
1026 and the standard deviation is 37. How well did you score on
the test compared to the average test taker?
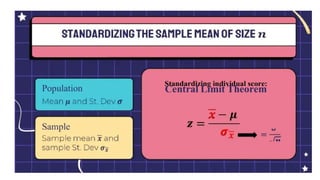
z = 2
𝒛 =
𝒙 −𝝁
𝝈
33.
Z-Scores
What is thestandard score of the student
who took the exam in mathematics with the
score of 42 and the mean of the class was 45
with a standard deviation of 10.
34.
Z-Scores
What is thestandard score of the student who took the
exam in mathematics with the score of 42 and the mean
of the class was 45 with a standard deviation of 10.
𝒛 =
𝒙 −𝝁
𝝈
z = -.3
3. Find σ.
z= 2
X = 90
μ = 80
Answer: σ = 5
4. Find X.
z = 0.9
μ = 70
σ = 8
Answer: X = 77.2
5. Find z.
X = 92
μ = 85
σ = 10
Answer: z = 0.7
1. Find μ.
z = -1
X = 60
σ = 12
Answer: μ = 72
2. Find σ.
z = -1.5
X = 40
μ = 50
Answer: σ = 6.67
40.
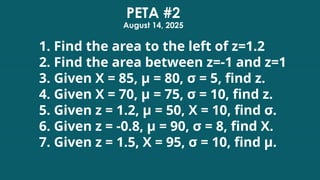
1. Find thearea to the left of z=1.2
2. Find the area between z=-1 and z=1
3. Given X = 85, μ = 80, σ = 5, find z.
4. Given X = 70, μ = 75, σ = 10, find z.
5. Given z = 1.2, μ = 50, X = 10, find σ.
6. Given z = -0.8, μ = 90, σ = 8, find X.
7. Given z = 1.5, X = 95, σ = 10, find μ.
PETA #2
August 14, 2025
41.
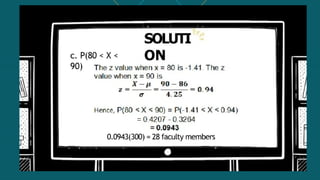
8. A normaldistribution has a mean
of 80 and a standard deviation of 10.
Find the z-score for a score of 135.
9. A company’s employee salaries
have a mean of 50,000 pesos and a z-
score of 2.3, Find the standard
deviation for a janitor’s salary of
20,000 pesos
42.
10. Find thez score for the value of
25, given a mean of 20 and a standard
deviation of 5.
43.
1.Given X =85, μ = 80, σ = 5, find z. Answer: z = 1
2.Given X = 70, μ = 75, σ = 10, find z. Answer: z = -0.5
3.Given z = 1.2, μ = 50, σ = 10, find X. Answer: X = -33.3
4.Given z = -0.8, μ = 90, σ = 8, find X. Answer: X = 83.6
5.Given z = 1.5, X = 95, σ = 10, find μ. Answer: μ = 80
POPULATION
the entiregroup you want
to study or draw
conclusions about.
SAMPLE
a smaller, specific group you
collect data from. It is a subset of
the population, and it should be
representative of the larger
group.
46.
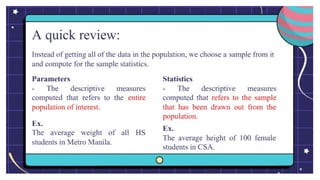
Population
The population isthe complete set of all
individuals, objects, events, or measurements that
have a common characteristic. It's the total group
you are interested in.
Example:
If you want to know the average height of all
adults in the United States, then the population is
every single adult in the United States.
47.
Sample
A sample isa portion or a subset of the population. Since
it's often impossible or impractical to collect data from
an entire population (due to size, time, or cost),
researchers use a sample to represent the whole.
Example:
Instead of measuring the height of every adult in the
U.S., you might measure the height of 1,000 randomly
selected adults across different states. This smaller
group is your sample.
48.
Sampling Frame
theactual list or source from which a sample is
drawn. It's a complete, specific list of all the
individuals, households, or other units that
make up the population you intend to study.
49.
Sample size
Thenumber of individuals you should include in
your sample depends on various factors,
including the size and variability of the
population and your research design. There are
different sample size calculators and formulas
depending on what you want to achieve with
statistical analysis.
50.
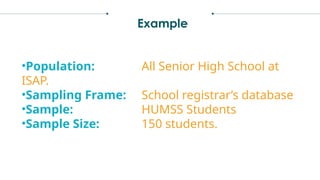
Example
•Population: All SeniorHigh School at
ISAP.
•Sampling Frame: School registrar’s database
•Sample: HUMSS Students
•Sample Size: 150 students.
Random samplingis a technique where
every individual in the population has an
equal chance of being selected for the
sample. This method ensures that the
sample is representative of the entire
population, reducing bias and increasing
the generalizability of the findings.
Random Sampling
55.
Random Sampling
EXAMPLE
Imagine aresearcher studying the heights of students
in a school. To use random sampling, the researcher
could assign each student in the school a number and
then use a random number generator to select a
certain number of students. This ensures that every
student has an equal chance of being included in the
study.
56.
involves dividingthe population into subgroups or strata
based on certain characteristics that are relevant to the
research. Random samples are then taken from each
stratum, ensuring representation from all segments of the
population. This method is useful when there are distinct
subgroups with different characteristics.
Stratified Sampling
57.
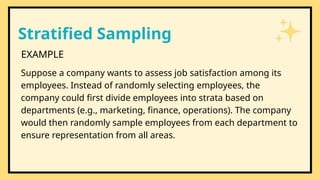
Stratified Sampling
EXAMPLE
Suppose acompany wants to assess job satisfaction among its
employees. Instead of randomly selecting employees, the
company could first divide employees into strata based on
departments (e.g., marketing, finance, operations). The company
would then randomly sample employees from each department to
ensure representation from all areas.
58.
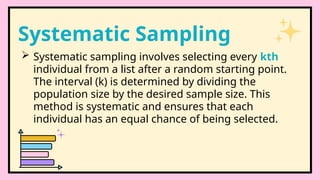
Systematic samplinginvolves selecting every kth
individual from a list after a random starting point.
The interval (k) is determined by dividing the
population size by the desired sample size. This
method is systematic and ensures that each
individual has an equal chance of being selected.
Systematic Sampling
59.
Systematic Sampling
EXAMPLE
Consider apopulation of 1000 individuals, and a researcher
wants a sample of 100. Using systematic sampling, the
researcher could select every 10th individual from a list
after randomly choosing a starting point. If the random
starting point is the 5th individual, the sample would
include the 5th, 15th, 25th, and so on until reaching the
100th individual.
60.
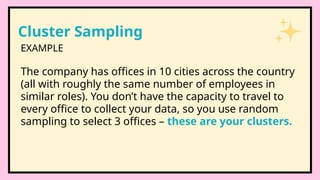
Cluster Sampling
Clustersampling also involves dividing the
population into subgroups, but each subgroup
should have similar characteristics to the whole
sample. You randomly select entire groups
(clusters) and survey everyone within them. The
goal is to make the clusters as diverse as possible.
61.
Cluster Sampling
The companyhas offices in 10 cities across the country
(all with roughly the same number of employees in
similar roles). You don’t have the capacity to travel to
every office to collect your data, so you use random
sampling to select 3 offices – these are your clusters.
EXAMPLE
Non-Probability Sampling
Non-randomsampling, also known as non-
probability sampling, refers to any sampling
method where not every individual in the
population has an equal chance of being
included in the sample.
64.
Non-Probability Sampling
Thistype of sample is easier and cheaper to
access, but it has a higher risk of sampling bias.
That means the inferences you can make about
the population are weaker than with probability
samples, and your conclusions may be more
limited.
65.
Convenience Sampling
Aconvenience sample simply includes the
individuals who happen to be most accessible to
the researcher.
66.
Convenience Sampling
EXAMPLE
In astudy examining smartphone usage patterns, a
researcher might use convenience sampling by surveying
people in a shopping mall. While this method is convenient, it
doesn't ensure a representative sample of the entire
population, as it only includes those who happen to be in the
mall at that time.
67.
This typeof sampling, also known as judgement
sampling, involves the researcher using their
expertise to select a sample that is most useful
to the purposes of the research.
Purposive Sampling
68.
You want toknow more about the opinions and
experiences of disabled students at your university, so
you purposefully select a number of students with
different support needs in order to gather a varied
range of data on their experiences with student
services.
Purposive Sampling
EXAMPLE
69.
Capture sampling isa technique commonly used in ecology
and biology. It involves capturing and marking a portion of
the population, releasing them back into the environment,
and then recapturing a new sample later. By comparing the
marked and unmarked individuals, researchers can estimate
population size and dynamics.
Capture Sampling
70.
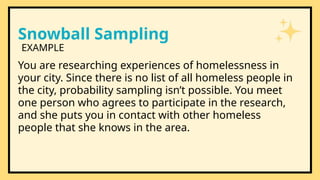
Snowball Sampling
Ifthe population is hard to access, snowball
sampling can be used to recruit participants via
other participants. The number of people you
have access to “snowballs” as you get in contact
with more people.
71.
Snowball Sampling
You areresearching experiences of homelessness in
your city. Since there is no list of all homeless people in
the city, probability sampling isn’t possible. You meet
one person who agrees to participate in the research,
and she puts you in contact with other homeless
people that she knows in the area.
EXAMPLE
72.
Quota Sampling
Quotasampling relies on the non-random selection of a
predetermined number or proportion of units. This is called a
quota.
• You first divide the population into mutually exclusive
subgroups (called strata) and then recruit sample units until
you reach your quota. These units share specific
characteristics, determined by you prior to forming your
strata. The aim of quota sampling is to control what or who
makes up your sample.
73.
Quota Sampling
You wantto gauge consumer interest in a new produce delivery
service in Boston, focused on dietary preferences. You divide the
population into meat eaters, vegetarians, and vegans, drawing a
sample of 1000 people. Since the company wants to cater to all
consumers, you set a quota of 200 people for each dietary
group. In this way, all dietary preferences are equally
represented in your research, and you can easily compare these
groups.You continue recruiting until you reach the quota of 200
participants for each subgroup.
EXAMPLE