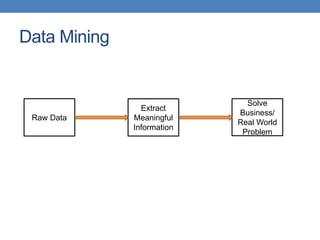
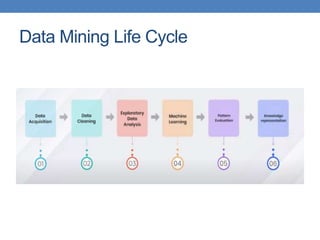
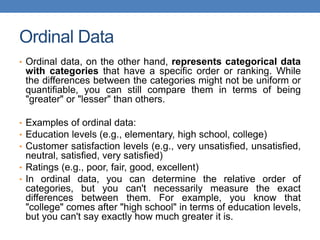
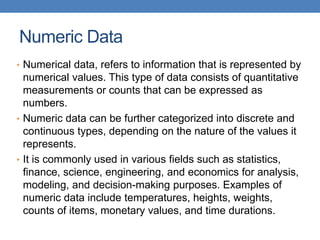
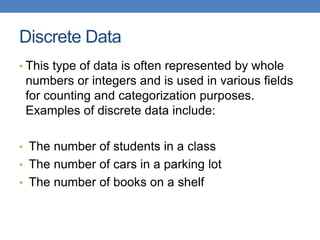
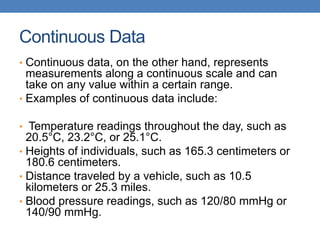
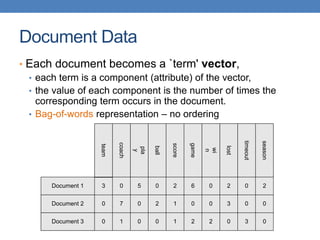
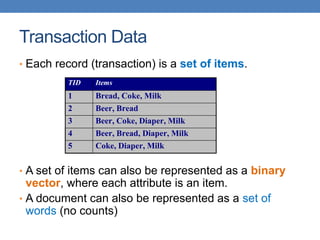
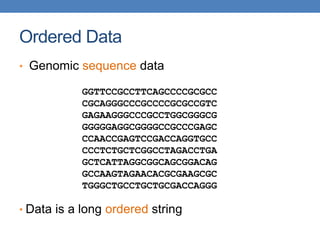
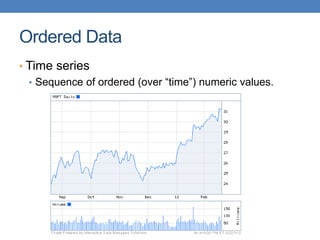
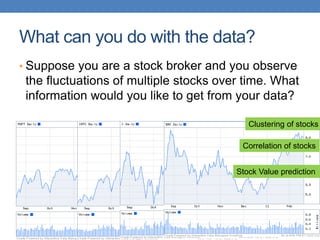
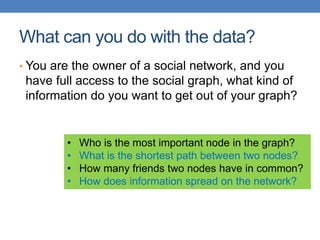
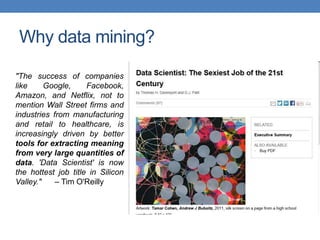
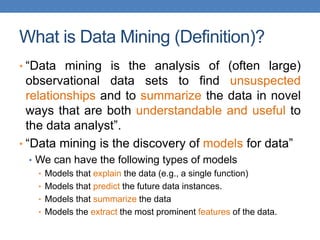
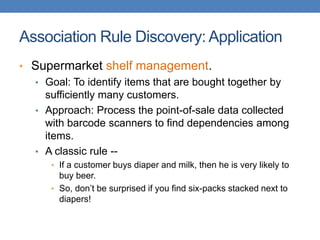
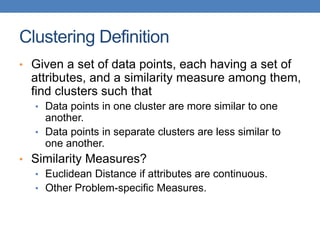
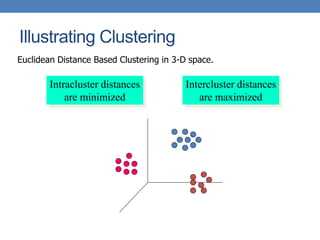
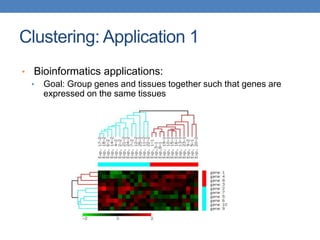
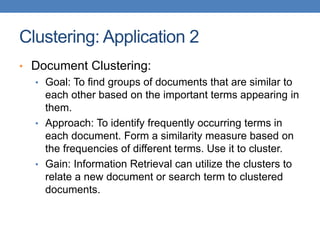
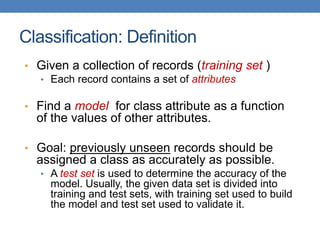
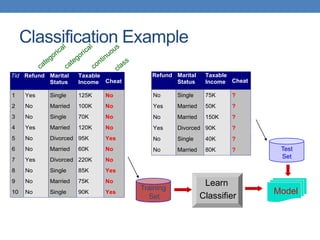
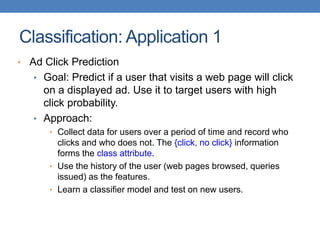
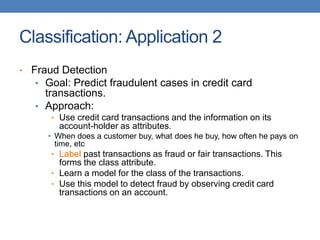
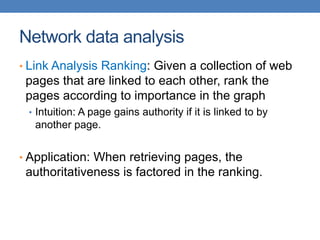
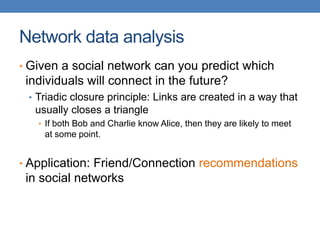
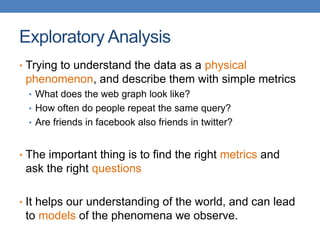
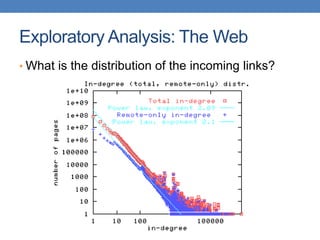
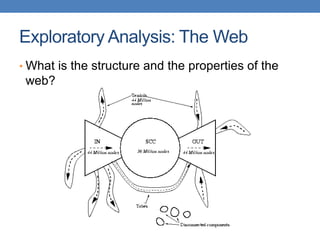
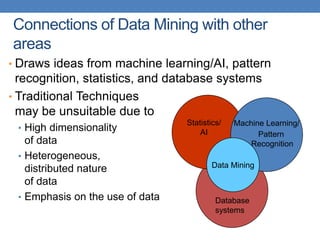
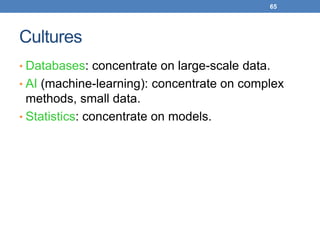
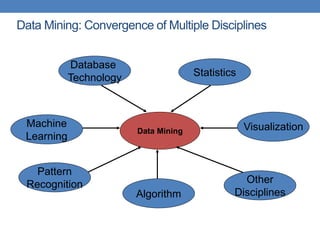
ADVANCE DATA MINING
LECTURE 1
Introduction
What is data mining?
• After years of data mining there is still no unique
answer to this question.
• A tentative definition:
Data mining is the use of efficient techniques for
the analysis of very large collections of data and the
extraction of useful and possibly unexpected
patterns in data.
Data Mining
Raw Data
Extract
Meaningful
Information
Solve
Business/
Real World
Problem
Data Mining Life Cycle
Why do we need data mining?
• Really, really huge amounts of raw data!!
• In the digital age, TB of data is generated by the
second
• Mobile devices, digital photographs, web documents.
• Facebook updates, Tweets, Blogs, User-generated
content
• Transactions, sensor data, surveillance data
• Queries, clicks, browsing
• Cheap storage has made possible to maintain this
data
• Need to analyze the raw data to extract
knowledge
Why do we need data mining?
Data mining is essential for extracting valuable
insights and knowledge from large and complex
datasets. There are several reasons why data
mining is necessary:
• Knowledge Discovery
• Predictive Analytics
• Decision Support
• Pattern Recognition
• Optimization and Efficiency
• Competitive Advantage
Why do we need data mining?
Knowledge Discovery
Data mining allows us to discover hidden
patterns, correlations, and trends within data
that can provide valuable insights and inform
decision-making processes. By analyzing large
volumes of data, we can uncover relationships and
understand the underlying structure of the
information.
Why do we need data mining?
Predictive Analytics
Data mining enables the development of
predictive models that can forecast future
trends or outcomes based on historical data.
These models are used in various fields such as
finance, healthcare, marketing, and manufacturing
to anticipate customer behavior, identify potential
risks, or optimize processes.
Why do we need data mining?
Decision Support
Data mining provides decision-makers with
actionable information to support strategic
planning, resource allocation, and policy
formulation. By analyzing data patterns and
trends, organizations can make informed decisions
that are based on evidence.
Why do we need data mining?
Pattern Recognition
Data mining techniques, such as clustering and
classification, help in identifying patterns and
grouping similar data instances together. This
can be useful for segmentation, anomaly
detection, and pattern recognition tasks in diverse
domains.
Why do we need data mining?
Optimization and Efficiency
By analyzing historical data, organizations can
identify inefficiencies, optimize processes, and
improve performance. Data mining techniques
can uncover opportunities for cost reduction,
resource optimization, and process
improvement, leading to increased efficiency
and productivity.
Why do we need data mining?
Competitive Advantage
organizations effectively utilize data mining gain a
competitive advantage through enhanced
understanding of their customers, markets, and
operational dynamics. By leveraging data mining
techniques, businesses can innovate, adapt to
changing market conditions, and stay ahead of
competitors.
The data is also very complex
• Multiple types of data: tables, time series,
images, graphs, etc
• Interconnected data of different types:
• From the mobile phone we can collect, location of the
user, friendship information, check-ins to venues,
opinions through twitter, images though cameras,
queries to search engines
Example: transaction data
• Billions of real-life customers:
• WALMART: 20M transactions per day
• AT&T 300M calls per day
• Credit card companies: billions of transactions per day.
• The point cards allow companies to collect
information about specific users
Example: document data
• Web as a document repository: estimated 50
billions of web pages
• Wikipedia: 4 million articles (and counting)
• Twitter: ~300 million tweets every day
Example: network data
• Web: 50 billion pages linked via hyperlinks
• Facebook: 500 million users
• Twitter: 300 million users
• Instant messenger: ~1billion users
• Blogs: 250 million blogs worldwide, presidential
candidates run blogs
Example: environmental data
• Climate data (just an example)
http://www.ncdc.gov/oa/climate/ghcn-monthly/index.php
• “a database of temperature, rain fall and pressure
records managed by the National Climatic Data
Center, Arizona State University and the Carbon
Dioxide Information Analysis Center”
Behavioral data
• Mobile phones today record a large amount of information about the
user behavior
• GPS records position
• Camera produces images
• Communication via phone and SMS
• Text via facebook updates
• Association with entities via check-ins
• Amazon collects all the items that you browsed, placed into your
basket, read reviews about, purchased.
• Google and Bing record all your browsing activity via toolbar plugins.
They also record the queries you asked, the pages you saw and the
clicks you did.
• Data collected for millions of users on a daily basis
So, what is Data?
• Collection of data objects and
their attributes
• An attribute is a property or
characteristic of an object
• Examples: eye color of a person,
temperature, etc.
• Attribute is also known as
variable, field, characteristic, or
feature
• A collection of attributes describe
an object
• Object is also known as record,
point, case, sample, entity, or
instance
Tid Refund Marital
Status
Taxable
Income Cheat
1 Yes Single 125K No
2 No Married 100K No
3 No Single 70K No
4 Yes Married 120K No
5 No Divorced 95K Yes
6 No Married 60K No
7 Yes Divorced 220K No
8 No Single 85K Yes
9 No Married 75K No
10 No Single 90K Yes
10
Attributes
Objects
Types of Attributes
• There are different types of attributes
• Categorical
• Examples: eye color, zip codes, words, rankings (e.g, good,
fair, bad), height in {tall, medium, short}
• Nominal (no order or comparison) vs Ordinal (order but not
comparable)
• Numeric
• Examples: dates, temperature, time, length, value, count.
• Discrete (counts) vs Continuous (temperature)
• Special case: Binary attributes (yes/no, exists/not exists)
Categorical & Numerical Data
Aspect Categorical Data Numerical Data
Nature Represents categories or labels Represents quantities or measurements
Examples Gender, colors, education levels
Age, height, temperature, number of
items
Order
Nominal (no order) or ordinal
(ordered)
Discrete (distinct values) or continuous
Operations
Cannot perform arithmetic
operations
Can perform arithmetic operations
Statistical Tests Chi-squared tests, cross-tabulations Mean, median, standard deviation
Visualization Bar charts, pie charts, histograms Histograms, scatter plots, line graphs
Data Types Nominal, ordinal Discrete, continuous
Nominal Data
• Nominal data refers to categorical data where the categories
have no inherent order or ranking. In other words, the
categories are distinct and can't be ranked or compared in
terms of being "higher" or "lower." Nominal data only
provide labels for different groups or categories.
• Examples of nominal data:
• Colors (e.g., red, blue, green)
• Types of animals (e.g., dog, cat, bird)
• Marital status (e.g., single, married, divorced)
• In nominal data, you can perform operations like counting the
frequency of each category, but you can't say that one category
is greater than or comes before another in a meaningful way.
Ordinal Data
• Ordinal data, on the other hand, represents categorical data
with categories that have a specific order or ranking. While
the differences between the categories might not be uniform or
quantifiable, you can still compare them in terms of being
"greater" or "lesser" than others.
• Examples of ordinal data:
• Education levels (e.g., elementary, high school, college)
• Customer satisfaction levels (e.g., very unsatisfied, unsatisfied,
neutral, satisfied, very satisfied)
• Ratings (e.g., poor, fair, good, excellent)
• In ordinal data, you can determine the relative order of
categories, but you can't necessarily measure the exact
differences between them. For example, you know that
"college" comes after "high school" in terms of education levels,
but you can't say exactly how much greater it is.
Numeric Data
• Numerical data, refers to information that is represented by
numerical values. This type of data consists of quantitative
measurements or counts that can be expressed as
numbers.
• Numeric data can be further categorized into discrete and
continuous types, depending on the nature of the values it
represents.
• It is commonly used in various fields such as statistics,
finance, science, engineering, and economics for analysis,
modeling, and decision-making purposes. Examples of
numeric data include temperatures, heights, weights,
counts of items, monetary values, and time durations.
Discrete Data
• This type of data is often represented by whole
numbers or integers and is used in various fields
for counting and categorization purposes.
Examples of discrete data include:
• The number of students in a class
• The number of cars in a parking lot
• The number of books on a shelf
Continuous Data
• Continuous data, on the other hand, represents
measurements along a continuous scale and can
take on any value within a certain range.
• Examples of continuous data include:
• Temperature readings throughout the day, such as
20.5°C, 23.2°C, or 25.1°C.
• Heights of individuals, such as 165.3 centimeters or
180.6 centimeters.
• Distance traveled by a vehicle, such as 10.5
kilometers or 25.3 miles.
• Blood pressure readings, such as 120/80 mmHg or
140/90 mmHg.
Document Data
• Each document becomes a `term' vector,
• each term is a component (attribute) of the vector,
• the value of each component is the number of times the
corresponding term occurs in the document.
• Bag-of-words representation – no ordering
Document 1
season
timeout
lost
wi
n
game
score
ball
pla
y
coach
team
Document 2
Document 3
3 0 5 0 2 6 0 2 0 2
0
0
7 0 2 1 0 0 3 0 0
1 0 0 1 2 2 0 3 0
Transaction Data
• Each record (transaction) is a set of items.
• A set of items can also be represented as a binary
vector, where each attribute is an item.
• A document can also be represented as a set of
words (no counts)
TID Items
1 Bread, Coke, Milk
2 Beer, Bread
3 Beer, Coke, Diaper, Milk
4 Beer, Bread, Diaper, Milk
5 Coke, Diaper, Milk
Ordered Data
• Genomic sequence data
• Data is a long ordered string
GGTTCCGCCTTCAGCCCCGCGCC
CGCAGGGCCCGCCCCGCGCCGTC
GAGAAGGGCCCGCCTGGCGGGCG
GGGGGAGGCGGGGCCGCCCGAGC
CCAACCGAGTCCGACCAGGTGCC
CCCTCTGCTCGGCCTAGACCTGA
GCTCATTAGGCGGCAGCGGACAG
GCCAAGTAGAACACGCGAAGCGC
TGGGCTGCCTGCTGCGACCAGGG
Ordered Data
• Time series
• Sequence of ordered (over “time”) numeric values.
Graph Data
• Examples: Web graph and HTML Links
5
2
1
2
5
<a href="papers/papers.html#bbbb">
Data Mining </a>
<li>
<a href="papers/papers.html#aaaa">
Graph Partitioning </a>
<li>
<a href="papers/papers.html#aaaa">
Parallel Solution of Sparse Linear System of Equations </a>
<li>
<a href="papers/papers.html#ffff">
N-Body Computation and Dense Linear System Solvers
What can you do with the data?
• Suppose that you are the owner of a supermarket
and you have collected billions of market basket
data. What information would you extract from it
and how would you use it?
• What if this was an online store?
TID Items
1 Bread, Coke, Milk
2 Beer, Bread
3 Beer, Coke, Diaper, Milk
4 Beer, Bread, Diaper, Milk
5 Coke, Diaper, Milk
Product placement
Catalog creation
Recommendations
What can you do with the data?
• Suppose you are a search engine and you have
a toolbar log consisting of
• pages browsed,
• queries,
• pages clicked,
• ads clicked
Each with a user id and a timestamp. What
information would you like to get our of the data?
Ad click prediction
Query reformulations
What can you do with the data?
• Suppose you are biologist who has microarray
expression data: thousands of genes, and their
expression values over thousands of different
settings (e.g. tissues). What information would you
like to get out of your data?
Groups of genes and tissues
What can you do with the data?
• Suppose you are a stock broker and you observe
the fluctuations of multiple stocks over time. What
information would you like to get from your data?
Clustering of stocks
Correlation of stocks
Stock Value prediction
What can you do with the data?
• You are the owner of a social network, and you
have full access to the social graph, what kind of
information do you want to get out of your graph?
• Who is the most important node in the graph?
• What is the shortest path between two nodes?
• How many friends two nodes have in common?
• How does information spread on the network?
Why data mining?
"The success of companies
like Google, Facebook,
Amazon, and Netflix, not to
mention Wall Street firms and
industries from manufacturing
and retail to healthcare, is
increasingly driven by better
tools for extracting meaning
from very large quantities of
data. 'Data Scientist' is now
the hottest job title in Silicon
Valley." – Tim O'Reilly
What is Data Mining (Definition)?
• “Data mining is the analysis of (often large)
observational data sets to find unsuspected
relationships and to summarize the data in novel
ways that are both understandable and useful to
the data analyst”.
• “Data mining is the discovery of models for data”
• We can have the following types of models
• Models that explain the data (e.g., a single function)
• Models that predict the future data instances.
• Models that summarize the data
• Models the extract the most prominent features of the data.
What is data mining again?
• The industry point of view: The analysis of huge
amounts of data for extracting useful and
actionable information, which is then integrated
into production systems in the form of new
features of products
• Data Scientists should be good at data analysis, math,
statistics, but also be able to code with huge amounts of
data and use the extracted information to build
products.
What can we do with data mining?
• Some examples:
• Frequent itemsets and Association Rules extraction
• Clustering
• Classification
• Ranking
• Exploratory analysis
Frequent Itemsets and Association Rules
• Given a set of records each of which contain some
number of items from a given collection;
• Identify sets of items (itemsets) occurring frequently
together
• Produce dependency rules which will predict
occurrence of an item based on occurrences of other
items.
TID Items
1 Bread, Coke, Milk
2 Beer, Bread
3 Beer, Coke, Diaper, Milk
4 Beer, Bread, Diaper, Milk
5 Coke, Diaper, Milk
Rules Discovered:
{Milk} --> {Coke}
{Diaper, Milk} --> {Beer}
Itemsets Discovered:
{Milk,Coke}
{Diaper, Milk}
Frequent Itemsets: Applications
• Text mining: finding associated phrases in text
• There are lots of documents that contain the phrases
“association rules”, “data mining” and “efficient
algorithm”
• Recommendations:
• Users who buy this item often buy this item as well
• Users who watched James Bond movies, also watched
Jason Bourne movies.
• Recommendations make use of item and user similarity
Association Rule Discovery: Application
• Supermarket shelf management.
• Goal: To identify items that are bought together by
sufficiently many customers.
• Approach: Process the point-of-sale data collected
with barcode scanners to find dependencies among
items.
• A classic rule --
• If a customer buys diaper and milk, then he is very likely to
buy beer.
• So, don’t be surprised if you find six-packs stacked next to
diapers!
Clustering Definition
• Given a set of data points, each having a set of
attributes, and a similarity measure among them,
find clusters such that
• Data points in one cluster are more similar to one
another.
• Data points in separate clusters are less similar to
one another.
• Similarity Measures?
• Euclidean Distance if attributes are continuous.
• Other Problem-specific Measures.
Illustrating Clustering
Euclidean Distance Based Clustering in 3-D space.
Intracluster distances
are minimized
Intercluster distances
are maximized
Clustering: Application 1
• Bioinformatics applications:
• Goal: Group genes and tissues together such that genes are
expressed on the same tissues
Clustering: Application 2
• Document Clustering:
• Goal: To find groups of documents that are similar to
each other based on the important terms appearing in
them.
• Approach: To identify frequently occurring terms in
each document. Form a similarity measure based on
the frequencies of different terms. Use it to cluster.
• Gain: Information Retrieval can utilize the clusters to
relate a new document or search term to clustered
documents.
Classification: Definition
• Given a collection of records (training set )
• Each record contains a set of attributes
• Find a model for class attribute as a function
of the values of other attributes.
• Goal: previously unseen records should be
assigned a class as accurately as possible.
• A test set is used to determine the accuracy of the
model. Usually, the given data set is divided into
training and test sets, with training set used to build
the model and test set used to validate it.
Classification Example
Tid Refund Marital
Status
Taxable
Income Cheat
1 Yes Single 125K No
2 No Married 100K No
3 No Single 70K No
4 Yes Married 120K No
5 No Divorced 95K Yes
6 No Married 60K No
7 Yes Divorced 220K No
8 No Single 85K Yes
9 No Married 75K No
10 No Single 90K Yes
10
Refund Marital
Status
Taxable
Income Cheat
No Single 75K ?
Yes Married 50K ?
No Married 150K ?
Yes Divorced 90K ?
No Single 40K ?
No Married 80K ?
10
Test
Set
Training
Set
Model
Learn
Classifier
Classification: Application 1
• Ad Click Prediction
• Goal: Predict if a user that visits a web page will click
on a displayed ad. Use it to target users with high
click probability.
• Approach:
• Collect data for users over a period of time and record who
clicks and who does not. The {click, no click} information
forms the class attribute.
• Use the history of the user (web pages browsed, queries
issued) as the features.
• Learn a classifier model and test on new users.
Classification: Application 2
• Fraud Detection
• Goal: Predict fraudulent cases in credit card
transactions.
• Approach:
• Use credit card transactions and the information on its
account-holder as attributes.
• When does a customer buy, what does he buy, how often he pays on
time, etc
• Label past transactions as fraud or fair transactions. This
forms the class attribute.
• Learn a model for the class of the transactions.
• Use this model to detect fraud by observing credit card
transactions on an account.
Network data analysis
• Link Analysis Ranking: Given a collection of web
pages that are linked to each other, rank the
pages according to importance in the graph
• Intuition: A page gains authority if it is linked to by
another page.
• Application: When retrieving pages, the
authoritativeness is factored in the ranking.
Network data analysis
• Given a social network can you predict which
individuals will connect in the future?
• Triadic closure principle: Links are created in a way that
usually closes a triangle
• If both Bob and Charlie know Alice, then they are likely to meet
at some point.
• Application: Friend/Connection recommendations
in social networks
Exploratory Analysis
• Trying to understand the data as a physical
phenomenon, and describe them with simple metrics
• What does the web graph look like?
• How often do people repeat the same query?
• Are friends in facebook also friends in twitter?
• The important thing is to find the right metrics and
ask the right questions
• It helps our understanding of the world, and can lead
to models of the phenomena we observe.
Exploratory Analysis: The Web
• What is the distribution of the incoming links?
Exploratory Analysis: The Web
• What is the structure and the properties of the
web?
• Draws ideas from machine learning/AI, pattern
recognition, statistics, and database systems
• Traditional Techniques
may be unsuitable due to
• High dimensionality
of data
• Heterogeneous,
distributed nature
of data
• Emphasis on the use of data
Connections of Data Mining with other
areas
Machine Learning/
Pattern
Recognition
Statistics/
AI
Data Mining
Database
systems
65
Cultures
• Databases: concentrate on large-scale data.
• AI (machine-learning): concentrate on complex
methods, small data.
• Statistics: concentrate on models.
Data Mining: Convergence of Multiple Disciplines
Data Mining
Database
Technology Statistics
Machine
Learning
Pattern
Recognition
Algorithm
Other
Disciplines
Visualization

Advance Data Mining - Machine Learning -

  • 1.
  • 2.
    What is datamining? • After years of data mining there is still no unique answer to this question. • A tentative definition: Data mining is the use of efficient techniques for the analysis of very large collections of data and the extraction of useful and possibly unexpected patterns in data.
  • 3.
  • 4.
  • 5.
  • 6.
  • 7.
  • 8.
  • 9.
  • 10.
  • 11.
  • 12.
    Why do weneed data mining? • Really, really huge amounts of raw data!! • In the digital age, TB of data is generated by the second • Mobile devices, digital photographs, web documents. • Facebook updates, Tweets, Blogs, User-generated content • Transactions, sensor data, surveillance data • Queries, clicks, browsing • Cheap storage has made possible to maintain this data • Need to analyze the raw data to extract knowledge
  • 13.
    Why do weneed data mining? Data mining is essential for extracting valuable insights and knowledge from large and complex datasets. There are several reasons why data mining is necessary: • Knowledge Discovery • Predictive Analytics • Decision Support • Pattern Recognition • Optimization and Efficiency • Competitive Advantage
  • 14.
    Why do weneed data mining? Knowledge Discovery Data mining allows us to discover hidden patterns, correlations, and trends within data that can provide valuable insights and inform decision-making processes. By analyzing large volumes of data, we can uncover relationships and understand the underlying structure of the information.
  • 15.
    Why do weneed data mining? Predictive Analytics Data mining enables the development of predictive models that can forecast future trends or outcomes based on historical data. These models are used in various fields such as finance, healthcare, marketing, and manufacturing to anticipate customer behavior, identify potential risks, or optimize processes.
  • 16.
    Why do weneed data mining? Decision Support Data mining provides decision-makers with actionable information to support strategic planning, resource allocation, and policy formulation. By analyzing data patterns and trends, organizations can make informed decisions that are based on evidence.
  • 17.
    Why do weneed data mining? Pattern Recognition Data mining techniques, such as clustering and classification, help in identifying patterns and grouping similar data instances together. This can be useful for segmentation, anomaly detection, and pattern recognition tasks in diverse domains.
  • 18.
    Why do weneed data mining? Optimization and Efficiency By analyzing historical data, organizations can identify inefficiencies, optimize processes, and improve performance. Data mining techniques can uncover opportunities for cost reduction, resource optimization, and process improvement, leading to increased efficiency and productivity.
  • 19.
    Why do weneed data mining? Competitive Advantage organizations effectively utilize data mining gain a competitive advantage through enhanced understanding of their customers, markets, and operational dynamics. By leveraging data mining techniques, businesses can innovate, adapt to changing market conditions, and stay ahead of competitors.
  • 20.
    The data isalso very complex • Multiple types of data: tables, time series, images, graphs, etc • Interconnected data of different types: • From the mobile phone we can collect, location of the user, friendship information, check-ins to venues, opinions through twitter, images though cameras, queries to search engines
  • 21.
    Example: transaction data •Billions of real-life customers: • WALMART: 20M transactions per day • AT&T 300M calls per day • Credit card companies: billions of transactions per day. • The point cards allow companies to collect information about specific users
  • 22.
    Example: document data •Web as a document repository: estimated 50 billions of web pages • Wikipedia: 4 million articles (and counting) • Twitter: ~300 million tweets every day
  • 23.
    Example: network data •Web: 50 billion pages linked via hyperlinks • Facebook: 500 million users • Twitter: 300 million users • Instant messenger: ~1billion users • Blogs: 250 million blogs worldwide, presidential candidates run blogs
  • 24.
    Example: environmental data •Climate data (just an example) http://www.ncdc.gov/oa/climate/ghcn-monthly/index.php • “a database of temperature, rain fall and pressure records managed by the National Climatic Data Center, Arizona State University and the Carbon Dioxide Information Analysis Center”
  • 25.
    Behavioral data • Mobilephones today record a large amount of information about the user behavior • GPS records position • Camera produces images • Communication via phone and SMS • Text via facebook updates • Association with entities via check-ins • Amazon collects all the items that you browsed, placed into your basket, read reviews about, purchased. • Google and Bing record all your browsing activity via toolbar plugins. They also record the queries you asked, the pages you saw and the clicks you did. • Data collected for millions of users on a daily basis
  • 26.
    So, what isData? • Collection of data objects and their attributes • An attribute is a property or characteristic of an object • Examples: eye color of a person, temperature, etc. • Attribute is also known as variable, field, characteristic, or feature • A collection of attributes describe an object • Object is also known as record, point, case, sample, entity, or instance Tid Refund Marital Status Taxable Income Cheat 1 Yes Single 125K No 2 No Married 100K No 3 No Single 70K No 4 Yes Married 120K No 5 No Divorced 95K Yes 6 No Married 60K No 7 Yes Divorced 220K No 8 No Single 85K Yes 9 No Married 75K No 10 No Single 90K Yes 10 Attributes Objects
  • 27.
    Types of Attributes •There are different types of attributes • Categorical • Examples: eye color, zip codes, words, rankings (e.g, good, fair, bad), height in {tall, medium, short} • Nominal (no order or comparison) vs Ordinal (order but not comparable) • Numeric • Examples: dates, temperature, time, length, value, count. • Discrete (counts) vs Continuous (temperature) • Special case: Binary attributes (yes/no, exists/not exists)
  • 28.
    Categorical & NumericalData Aspect Categorical Data Numerical Data Nature Represents categories or labels Represents quantities or measurements Examples Gender, colors, education levels Age, height, temperature, number of items Order Nominal (no order) or ordinal (ordered) Discrete (distinct values) or continuous Operations Cannot perform arithmetic operations Can perform arithmetic operations Statistical Tests Chi-squared tests, cross-tabulations Mean, median, standard deviation Visualization Bar charts, pie charts, histograms Histograms, scatter plots, line graphs Data Types Nominal, ordinal Discrete, continuous
  • 29.
    Nominal Data • Nominaldata refers to categorical data where the categories have no inherent order or ranking. In other words, the categories are distinct and can't be ranked or compared in terms of being "higher" or "lower." Nominal data only provide labels for different groups or categories. • Examples of nominal data: • Colors (e.g., red, blue, green) • Types of animals (e.g., dog, cat, bird) • Marital status (e.g., single, married, divorced) • In nominal data, you can perform operations like counting the frequency of each category, but you can't say that one category is greater than or comes before another in a meaningful way.
  • 30.
    Ordinal Data • Ordinaldata, on the other hand, represents categorical data with categories that have a specific order or ranking. While the differences between the categories might not be uniform or quantifiable, you can still compare them in terms of being "greater" or "lesser" than others. • Examples of ordinal data: • Education levels (e.g., elementary, high school, college) • Customer satisfaction levels (e.g., very unsatisfied, unsatisfied, neutral, satisfied, very satisfied) • Ratings (e.g., poor, fair, good, excellent) • In ordinal data, you can determine the relative order of categories, but you can't necessarily measure the exact differences between them. For example, you know that "college" comes after "high school" in terms of education levels, but you can't say exactly how much greater it is.
  • 31.
    Numeric Data • Numericaldata, refers to information that is represented by numerical values. This type of data consists of quantitative measurements or counts that can be expressed as numbers. • Numeric data can be further categorized into discrete and continuous types, depending on the nature of the values it represents. • It is commonly used in various fields such as statistics, finance, science, engineering, and economics for analysis, modeling, and decision-making purposes. Examples of numeric data include temperatures, heights, weights, counts of items, monetary values, and time durations.
  • 32.
    Discrete Data • Thistype of data is often represented by whole numbers or integers and is used in various fields for counting and categorization purposes. Examples of discrete data include: • The number of students in a class • The number of cars in a parking lot • The number of books on a shelf
  • 33.
    Continuous Data • Continuousdata, on the other hand, represents measurements along a continuous scale and can take on any value within a certain range. • Examples of continuous data include: • Temperature readings throughout the day, such as 20.5°C, 23.2°C, or 25.1°C. • Heights of individuals, such as 165.3 centimeters or 180.6 centimeters. • Distance traveled by a vehicle, such as 10.5 kilometers or 25.3 miles. • Blood pressure readings, such as 120/80 mmHg or 140/90 mmHg.
  • 34.
    Document Data • Eachdocument becomes a `term' vector, • each term is a component (attribute) of the vector, • the value of each component is the number of times the corresponding term occurs in the document. • Bag-of-words representation – no ordering Document 1 season timeout lost wi n game score ball pla y coach team Document 2 Document 3 3 0 5 0 2 6 0 2 0 2 0 0 7 0 2 1 0 0 3 0 0 1 0 0 1 2 2 0 3 0
  • 35.
    Transaction Data • Eachrecord (transaction) is a set of items. • A set of items can also be represented as a binary vector, where each attribute is an item. • A document can also be represented as a set of words (no counts) TID Items 1 Bread, Coke, Milk 2 Beer, Bread 3 Beer, Coke, Diaper, Milk 4 Beer, Bread, Diaper, Milk 5 Coke, Diaper, Milk
  • 36.
    Ordered Data • Genomicsequence data • Data is a long ordered string GGTTCCGCCTTCAGCCCCGCGCC CGCAGGGCCCGCCCCGCGCCGTC GAGAAGGGCCCGCCTGGCGGGCG GGGGGAGGCGGGGCCGCCCGAGC CCAACCGAGTCCGACCAGGTGCC CCCTCTGCTCGGCCTAGACCTGA GCTCATTAGGCGGCAGCGGACAG GCCAAGTAGAACACGCGAAGCGC TGGGCTGCCTGCTGCGACCAGGG
  • 37.
    Ordered Data • Timeseries • Sequence of ordered (over “time”) numeric values.
  • 38.
    Graph Data • Examples:Web graph and HTML Links 5 2 1 2 5 <a href="papers/papers.html#bbbb"> Data Mining </a> <li> <a href="papers/papers.html#aaaa"> Graph Partitioning </a> <li> <a href="papers/papers.html#aaaa"> Parallel Solution of Sparse Linear System of Equations </a> <li> <a href="papers/papers.html#ffff"> N-Body Computation and Dense Linear System Solvers
  • 39.
    What can youdo with the data? • Suppose that you are the owner of a supermarket and you have collected billions of market basket data. What information would you extract from it and how would you use it? • What if this was an online store? TID Items 1 Bread, Coke, Milk 2 Beer, Bread 3 Beer, Coke, Diaper, Milk 4 Beer, Bread, Diaper, Milk 5 Coke, Diaper, Milk Product placement Catalog creation Recommendations
  • 40.
    What can youdo with the data? • Suppose you are a search engine and you have a toolbar log consisting of • pages browsed, • queries, • pages clicked, • ads clicked Each with a user id and a timestamp. What information would you like to get our of the data? Ad click prediction Query reformulations
  • 41.
    What can youdo with the data? • Suppose you are biologist who has microarray expression data: thousands of genes, and their expression values over thousands of different settings (e.g. tissues). What information would you like to get out of your data? Groups of genes and tissues
  • 42.
    What can youdo with the data? • Suppose you are a stock broker and you observe the fluctuations of multiple stocks over time. What information would you like to get from your data? Clustering of stocks Correlation of stocks Stock Value prediction
  • 43.
    What can youdo with the data? • You are the owner of a social network, and you have full access to the social graph, what kind of information do you want to get out of your graph? • Who is the most important node in the graph? • What is the shortest path between two nodes? • How many friends two nodes have in common? • How does information spread on the network?
  • 44.
    Why data mining? "Thesuccess of companies like Google, Facebook, Amazon, and Netflix, not to mention Wall Street firms and industries from manufacturing and retail to healthcare, is increasingly driven by better tools for extracting meaning from very large quantities of data. 'Data Scientist' is now the hottest job title in Silicon Valley." – Tim O'Reilly
  • 45.
    What is DataMining (Definition)? • “Data mining is the analysis of (often large) observational data sets to find unsuspected relationships and to summarize the data in novel ways that are both understandable and useful to the data analyst”. • “Data mining is the discovery of models for data” • We can have the following types of models • Models that explain the data (e.g., a single function) • Models that predict the future data instances. • Models that summarize the data • Models the extract the most prominent features of the data.
  • 46.
    What is datamining again? • The industry point of view: The analysis of huge amounts of data for extracting useful and actionable information, which is then integrated into production systems in the form of new features of products • Data Scientists should be good at data analysis, math, statistics, but also be able to code with huge amounts of data and use the extracted information to build products.
  • 47.
    What can wedo with data mining? • Some examples: • Frequent itemsets and Association Rules extraction • Clustering • Classification • Ranking • Exploratory analysis
  • 48.
    Frequent Itemsets andAssociation Rules • Given a set of records each of which contain some number of items from a given collection; • Identify sets of items (itemsets) occurring frequently together • Produce dependency rules which will predict occurrence of an item based on occurrences of other items. TID Items 1 Bread, Coke, Milk 2 Beer, Bread 3 Beer, Coke, Diaper, Milk 4 Beer, Bread, Diaper, Milk 5 Coke, Diaper, Milk Rules Discovered: {Milk} --> {Coke} {Diaper, Milk} --> {Beer} Itemsets Discovered: {Milk,Coke} {Diaper, Milk}
  • 49.
    Frequent Itemsets: Applications •Text mining: finding associated phrases in text • There are lots of documents that contain the phrases “association rules”, “data mining” and “efficient algorithm” • Recommendations: • Users who buy this item often buy this item as well • Users who watched James Bond movies, also watched Jason Bourne movies. • Recommendations make use of item and user similarity
  • 50.
    Association Rule Discovery:Application • Supermarket shelf management. • Goal: To identify items that are bought together by sufficiently many customers. • Approach: Process the point-of-sale data collected with barcode scanners to find dependencies among items. • A classic rule -- • If a customer buys diaper and milk, then he is very likely to buy beer. • So, don’t be surprised if you find six-packs stacked next to diapers!
  • 51.
    Clustering Definition • Givena set of data points, each having a set of attributes, and a similarity measure among them, find clusters such that • Data points in one cluster are more similar to one another. • Data points in separate clusters are less similar to one another. • Similarity Measures? • Euclidean Distance if attributes are continuous. • Other Problem-specific Measures.
  • 52.
    Illustrating Clustering Euclidean DistanceBased Clustering in 3-D space. Intracluster distances are minimized Intercluster distances are maximized
  • 53.
    Clustering: Application 1 •Bioinformatics applications: • Goal: Group genes and tissues together such that genes are expressed on the same tissues
  • 54.
    Clustering: Application 2 •Document Clustering: • Goal: To find groups of documents that are similar to each other based on the important terms appearing in them. • Approach: To identify frequently occurring terms in each document. Form a similarity measure based on the frequencies of different terms. Use it to cluster. • Gain: Information Retrieval can utilize the clusters to relate a new document or search term to clustered documents.
  • 55.
    Classification: Definition • Givena collection of records (training set ) • Each record contains a set of attributes • Find a model for class attribute as a function of the values of other attributes. • Goal: previously unseen records should be assigned a class as accurately as possible. • A test set is used to determine the accuracy of the model. Usually, the given data set is divided into training and test sets, with training set used to build the model and test set used to validate it.
  • 56.
    Classification Example Tid RefundMarital Status Taxable Income Cheat 1 Yes Single 125K No 2 No Married 100K No 3 No Single 70K No 4 Yes Married 120K No 5 No Divorced 95K Yes 6 No Married 60K No 7 Yes Divorced 220K No 8 No Single 85K Yes 9 No Married 75K No 10 No Single 90K Yes 10 Refund Marital Status Taxable Income Cheat No Single 75K ? Yes Married 50K ? No Married 150K ? Yes Divorced 90K ? No Single 40K ? No Married 80K ? 10 Test Set Training Set Model Learn Classifier
  • 57.
    Classification: Application 1 •Ad Click Prediction • Goal: Predict if a user that visits a web page will click on a displayed ad. Use it to target users with high click probability. • Approach: • Collect data for users over a period of time and record who clicks and who does not. The {click, no click} information forms the class attribute. • Use the history of the user (web pages browsed, queries issued) as the features. • Learn a classifier model and test on new users.
  • 58.
    Classification: Application 2 •Fraud Detection • Goal: Predict fraudulent cases in credit card transactions. • Approach: • Use credit card transactions and the information on its account-holder as attributes. • When does a customer buy, what does he buy, how often he pays on time, etc • Label past transactions as fraud or fair transactions. This forms the class attribute. • Learn a model for the class of the transactions. • Use this model to detect fraud by observing credit card transactions on an account.
  • 59.
    Network data analysis •Link Analysis Ranking: Given a collection of web pages that are linked to each other, rank the pages according to importance in the graph • Intuition: A page gains authority if it is linked to by another page. • Application: When retrieving pages, the authoritativeness is factored in the ranking.
  • 60.
    Network data analysis •Given a social network can you predict which individuals will connect in the future? • Triadic closure principle: Links are created in a way that usually closes a triangle • If both Bob and Charlie know Alice, then they are likely to meet at some point. • Application: Friend/Connection recommendations in social networks
  • 61.
    Exploratory Analysis • Tryingto understand the data as a physical phenomenon, and describe them with simple metrics • What does the web graph look like? • How often do people repeat the same query? • Are friends in facebook also friends in twitter? • The important thing is to find the right metrics and ask the right questions • It helps our understanding of the world, and can lead to models of the phenomena we observe.
  • 62.
    Exploratory Analysis: TheWeb • What is the distribution of the incoming links?
  • 63.
    Exploratory Analysis: TheWeb • What is the structure and the properties of the web?
  • 64.
    • Draws ideasfrom machine learning/AI, pattern recognition, statistics, and database systems • Traditional Techniques may be unsuitable due to • High dimensionality of data • Heterogeneous, distributed nature of data • Emphasis on the use of data Connections of Data Mining with other areas Machine Learning/ Pattern Recognition Statistics/ AI Data Mining Database systems
  • 65.
    65 Cultures • Databases: concentrateon large-scale data. • AI (machine-learning): concentrate on complex methods, small data. • Statistics: concentrate on models.
  • 66.
    Data Mining: Convergenceof Multiple Disciplines Data Mining Database Technology Statistics Machine Learning Pattern Recognition Algorithm Other Disciplines Visualization