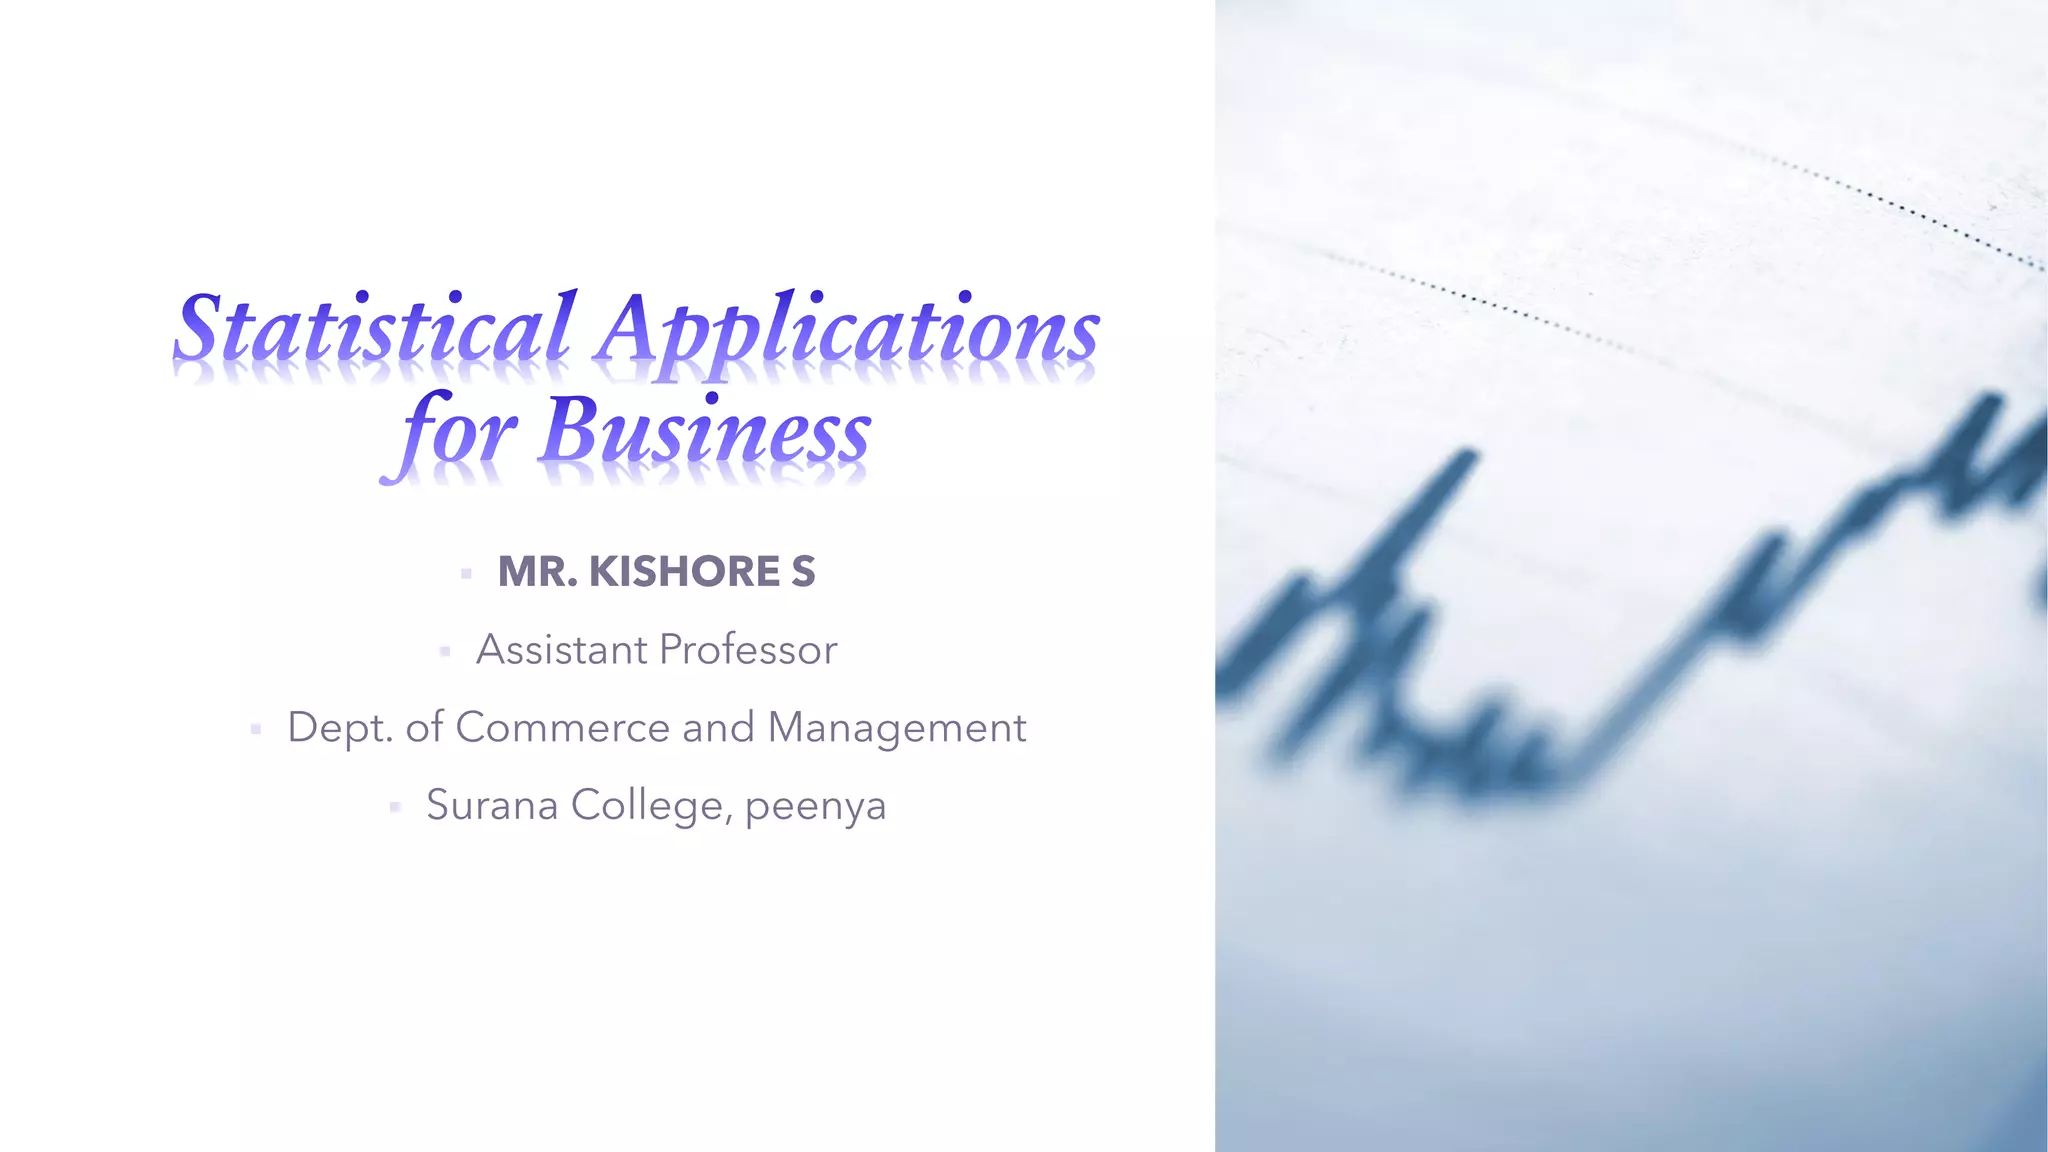
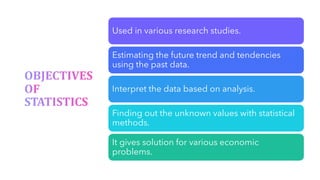
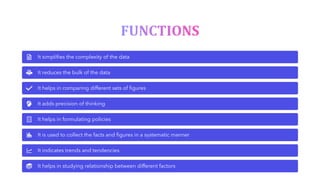
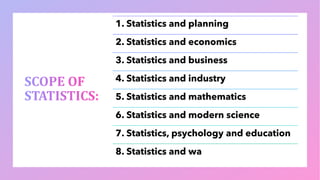
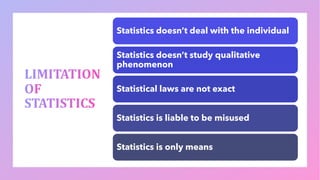
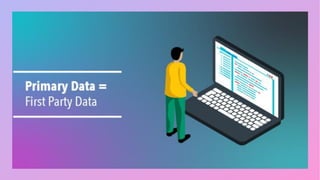
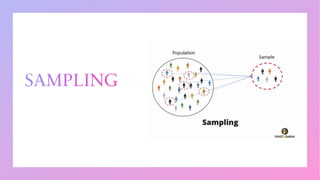
2. ▪ a. Introduction to Statistics – Definition of Statistics –-
Functions – Scope – Limitations
▪ b. Classification and tabulation of data - Collection of data -
census and sample techniques. Classification of data,
preparation of frequency distribution and tabulation of
data.(simple problems)
▪ c. Statistical Representation of Data -Diagrammatic
representation of data - Bar diagram sub divided bar diagram-
percentage bar diagram and pie diagram Histogram- Frequency
polygon- ogives (simple problems).
7. According to F.E.Coroxton and D.J.Cowden
“the statistics is the science of collection,
analysis, presentation and interpretation of
numerical data”
1
According to Harlow “the statistics is the
science and art of handling aggregate of
facts – observing, enumerating, recording,
classifying and otherwise systematically
treating them”.
2
9. Used in various research studies.
Estimating the future trend and tendencies
using the past data.
Interpret the data based on analysis.
Finding out the unknown values with statistical
methods.
It gives solution for various economic
problems.
10.
11. It simplifies the complexity of the data
It reduces the bulk of the data
It helps in comparing different sets of figures
It adds precision of thinking
It helps in formulating policies
It is used to collect the facts and figures in a systematic manner
It indicates trends and tendencies
It helps in studying relationship between different factors
13. 1. Statistics and planning
2. Statistics and economics
3. Statistics and business
4. Statistics and industry
5. Statistics and mathematics
6. Statistics and modern science
7. Statistics, psychology and education
8. Statistics and wa
16. Statistics doesn’t deal with the individual
Statistics doesn’t study qualitative
phenomenon
Statistical laws are not exact
Statistics is liable to be misused
Statistics is only means