This document provides instructions for analyzing data with a t-test in Microsoft Excel. It includes:
1. An introduction to hypothesis testing and the t-test.
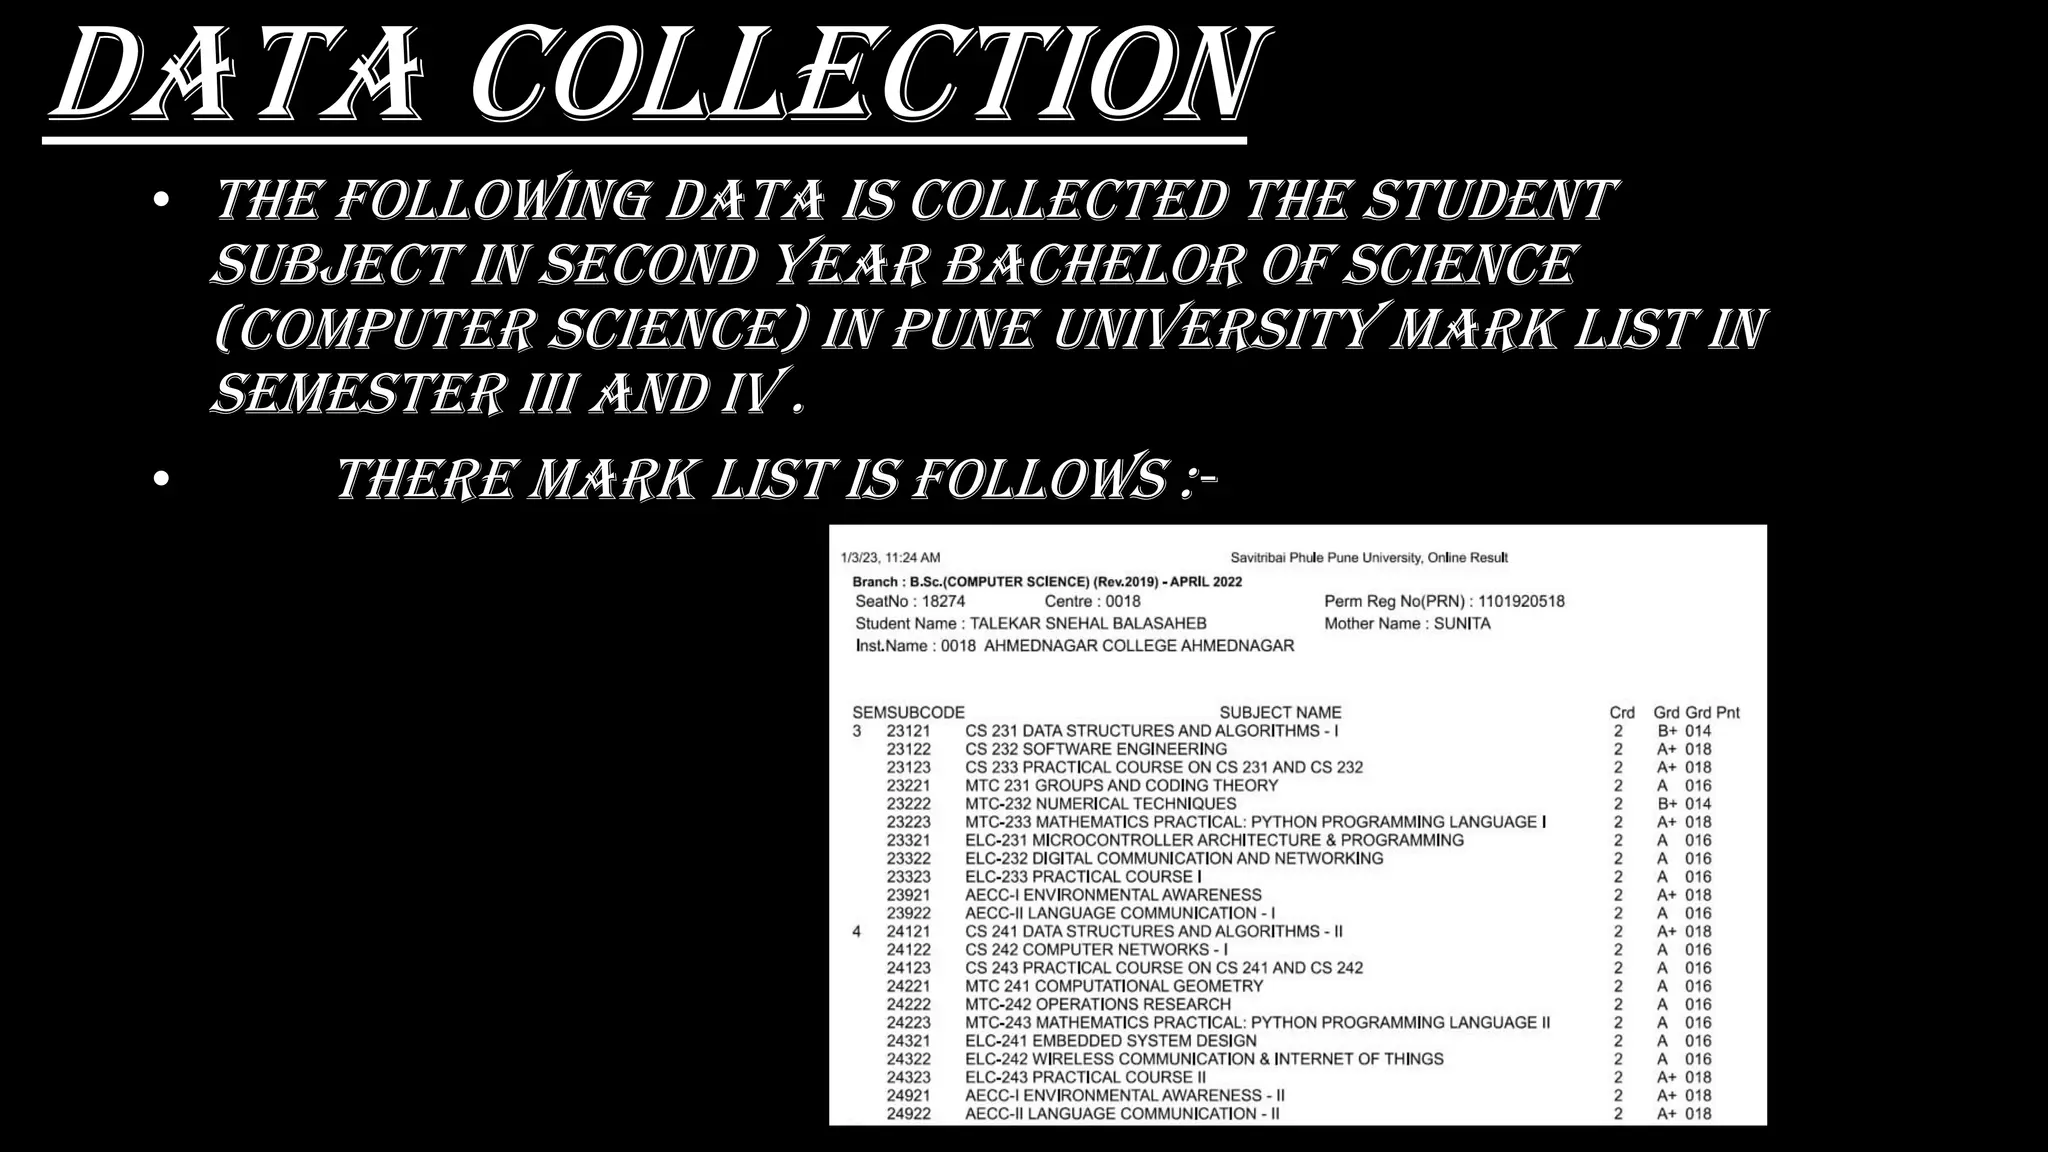
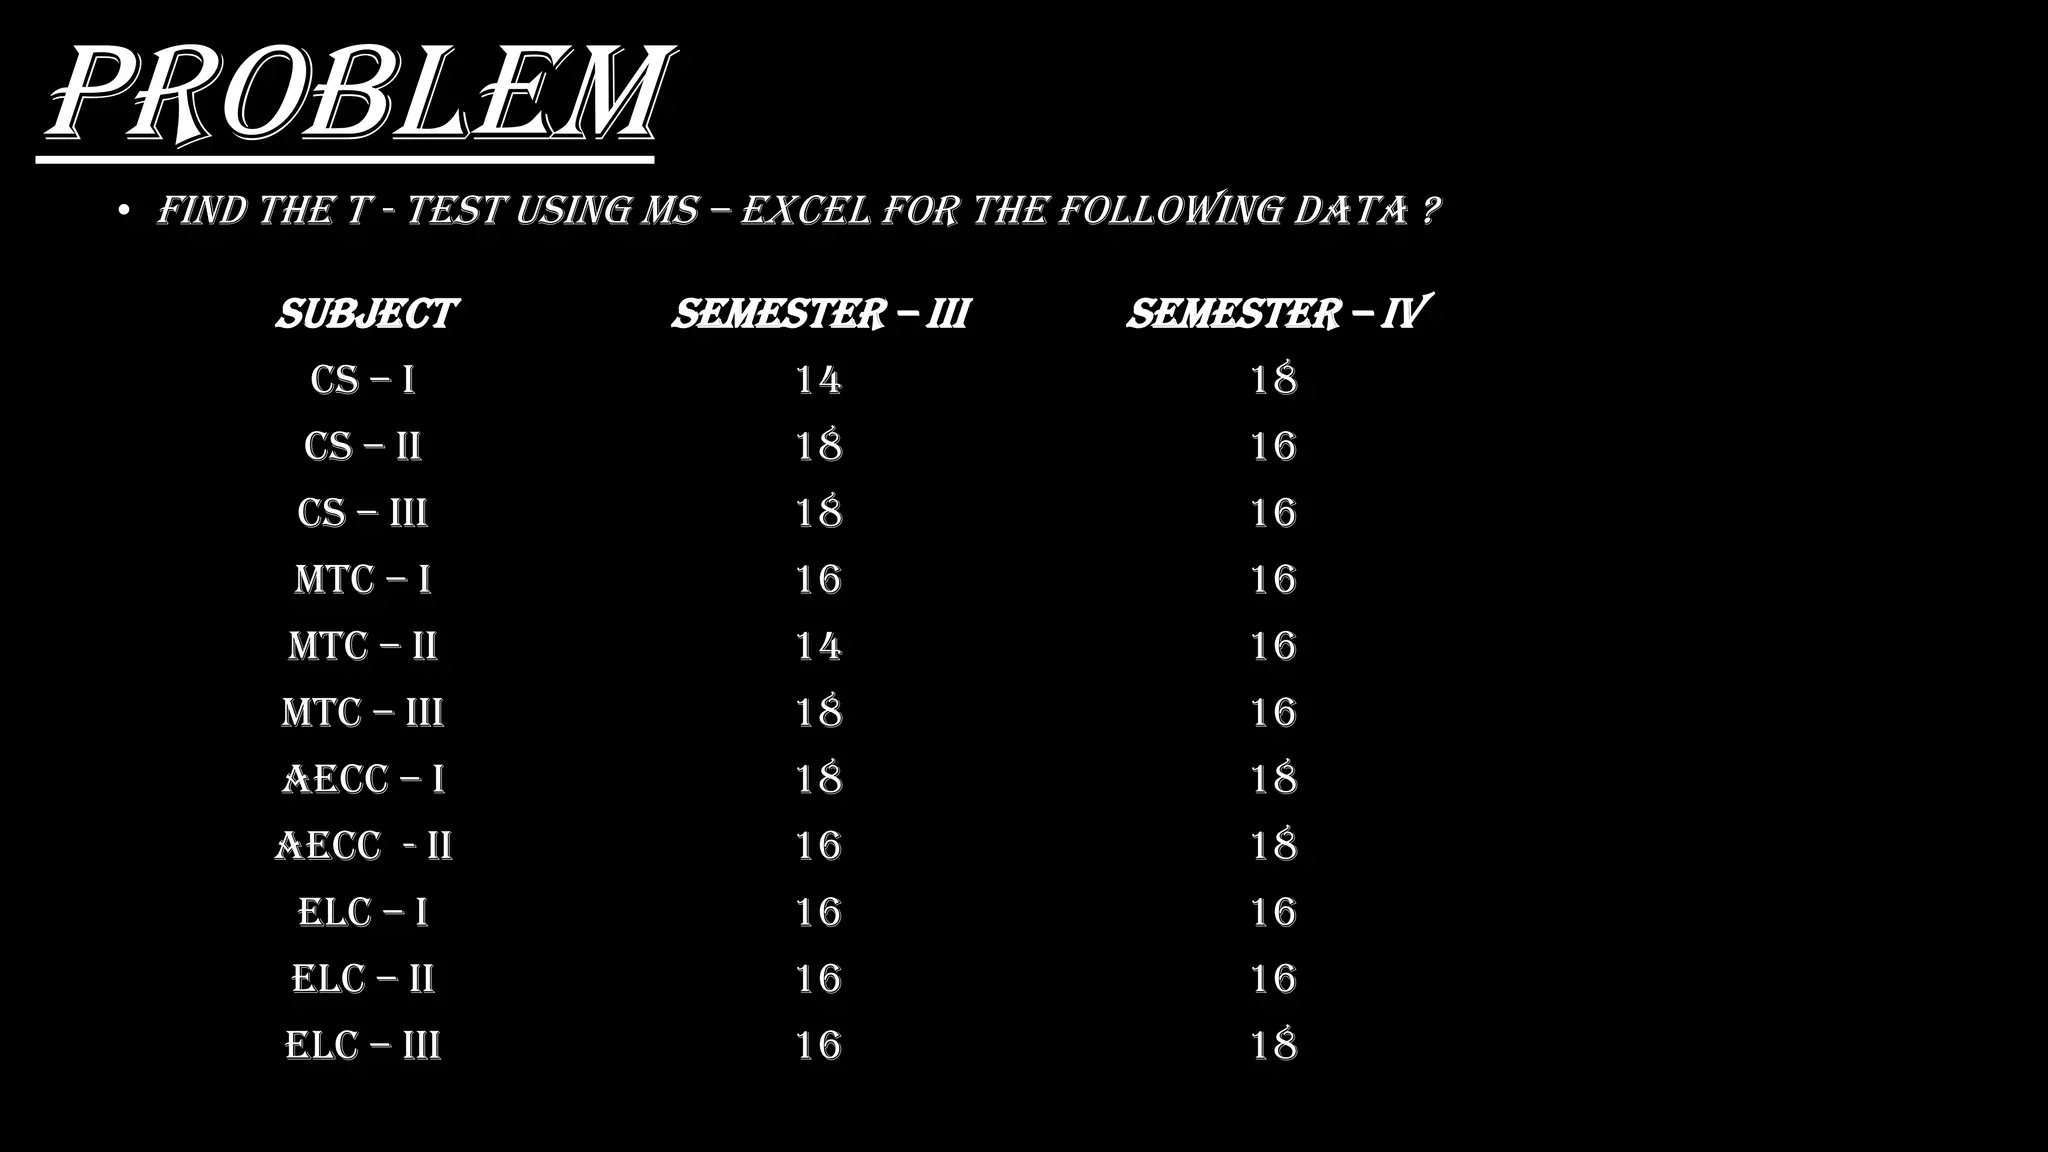
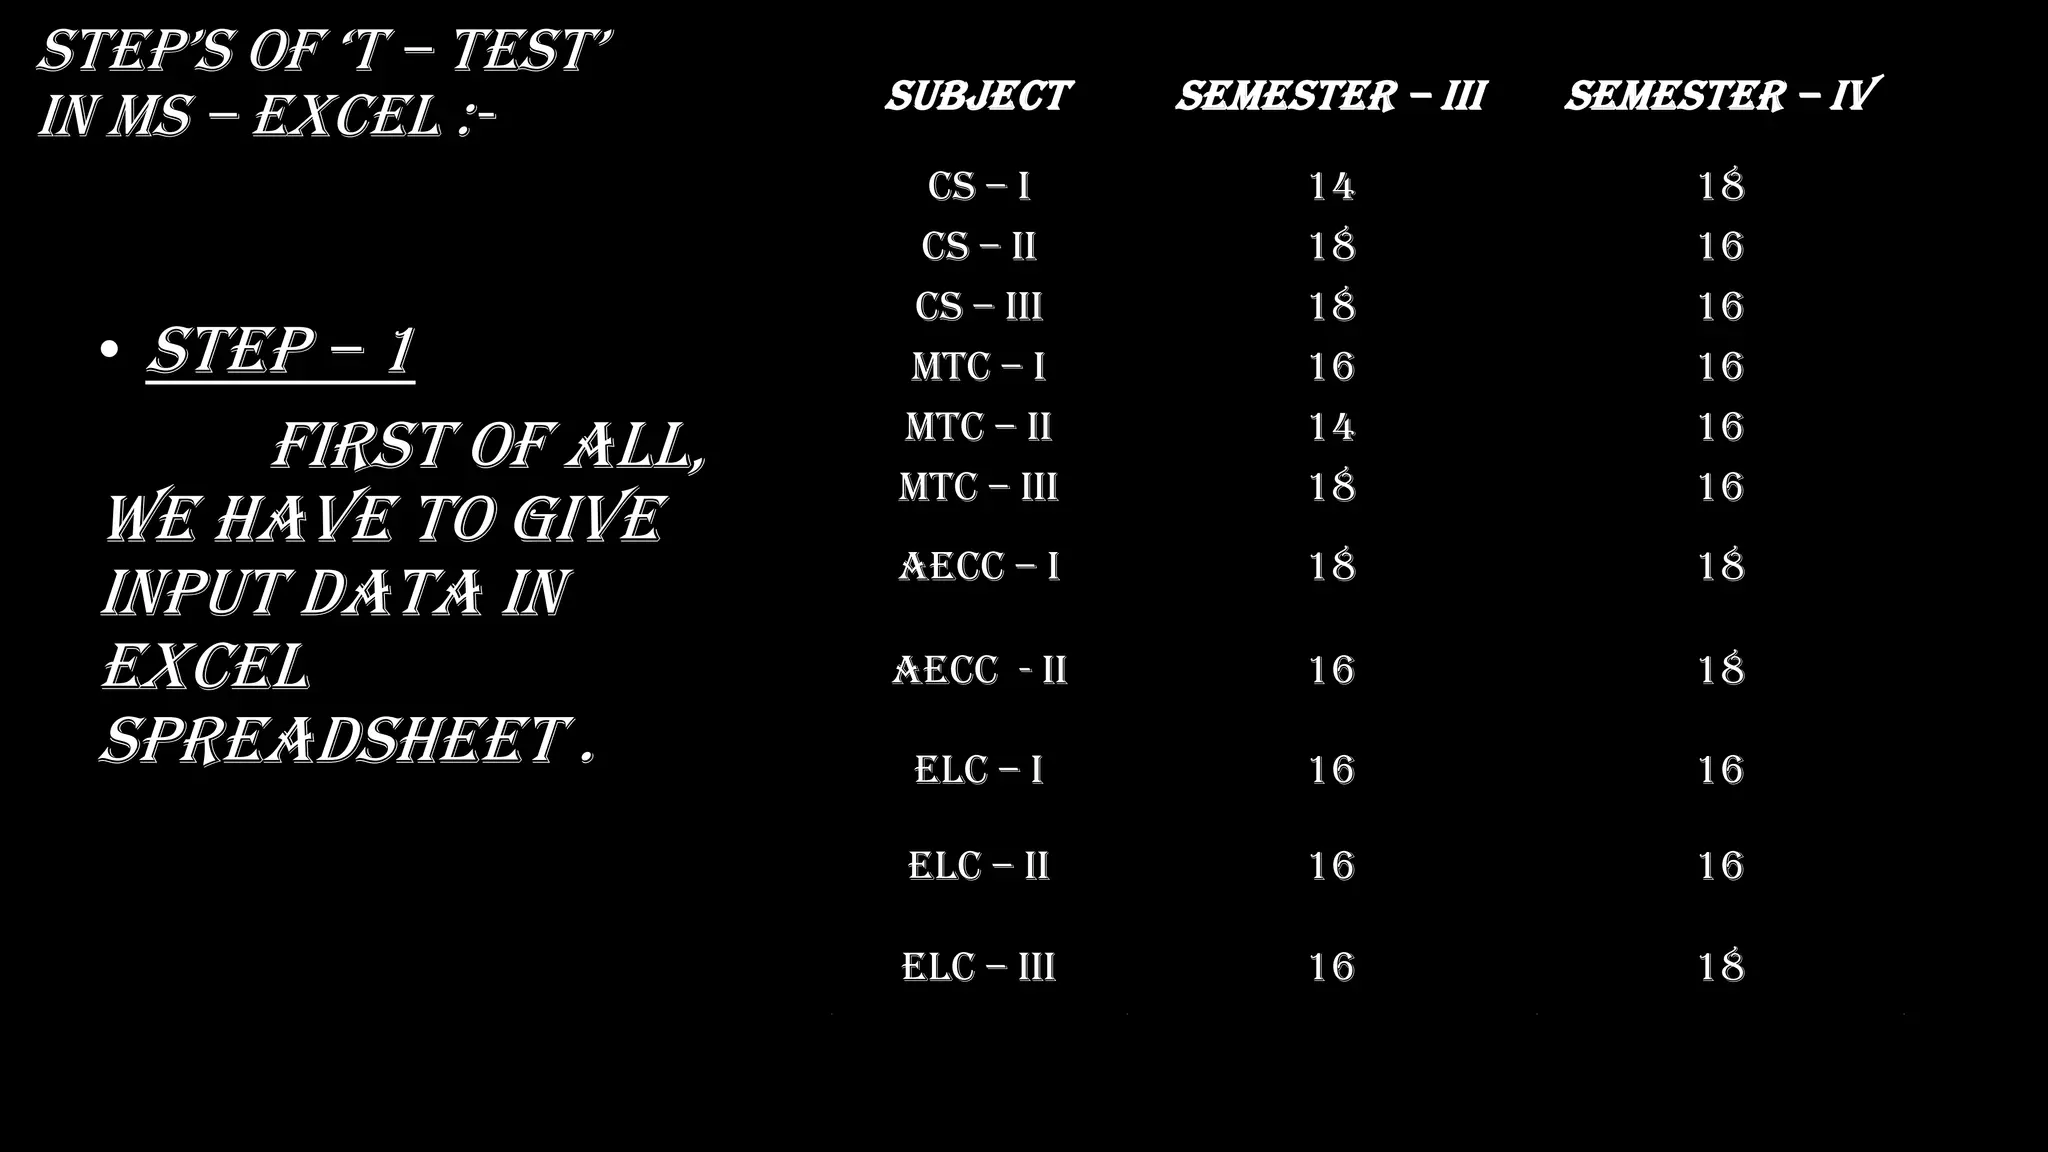
2. Steps for collecting student mark data from two semesters to analyze.
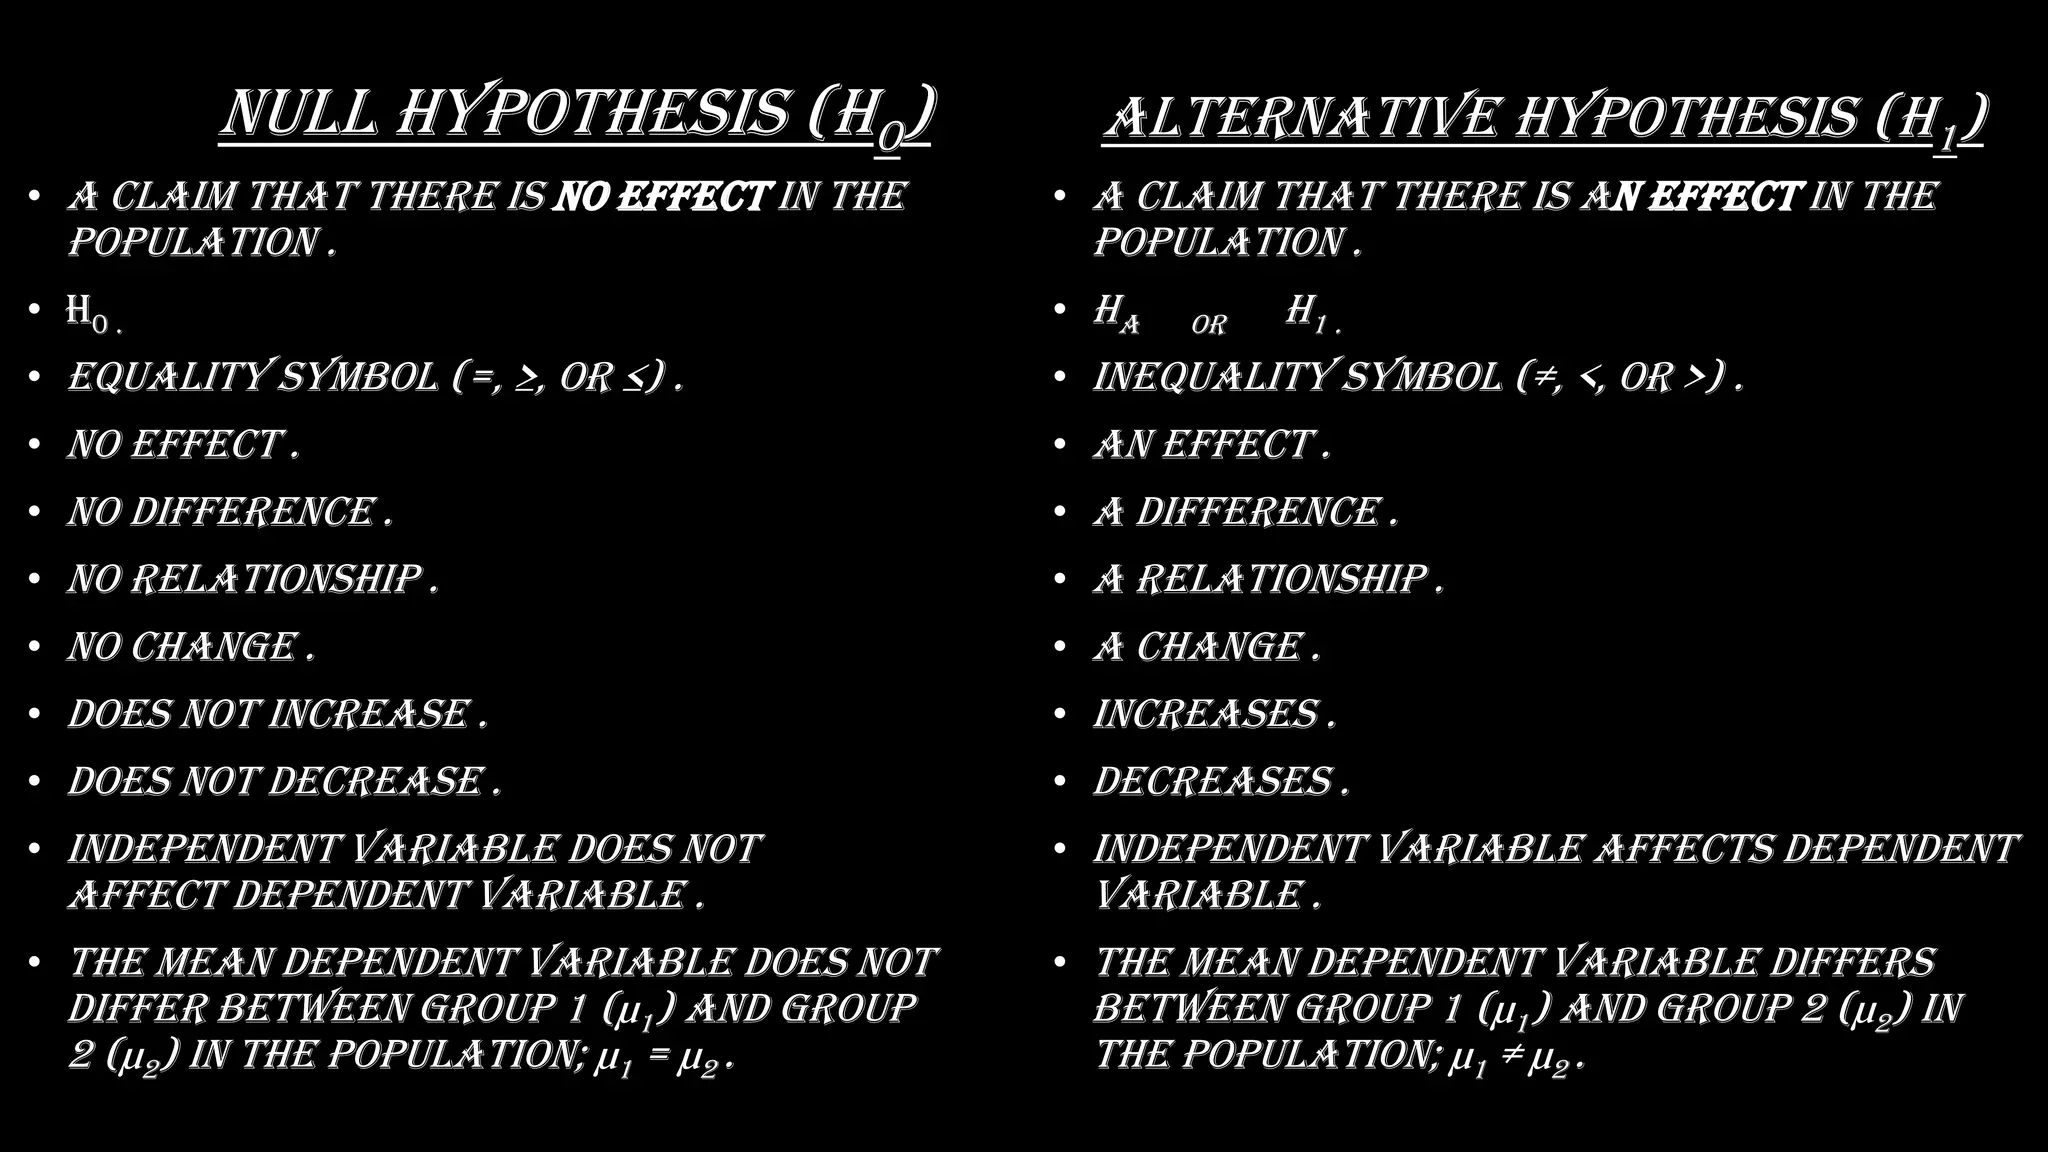
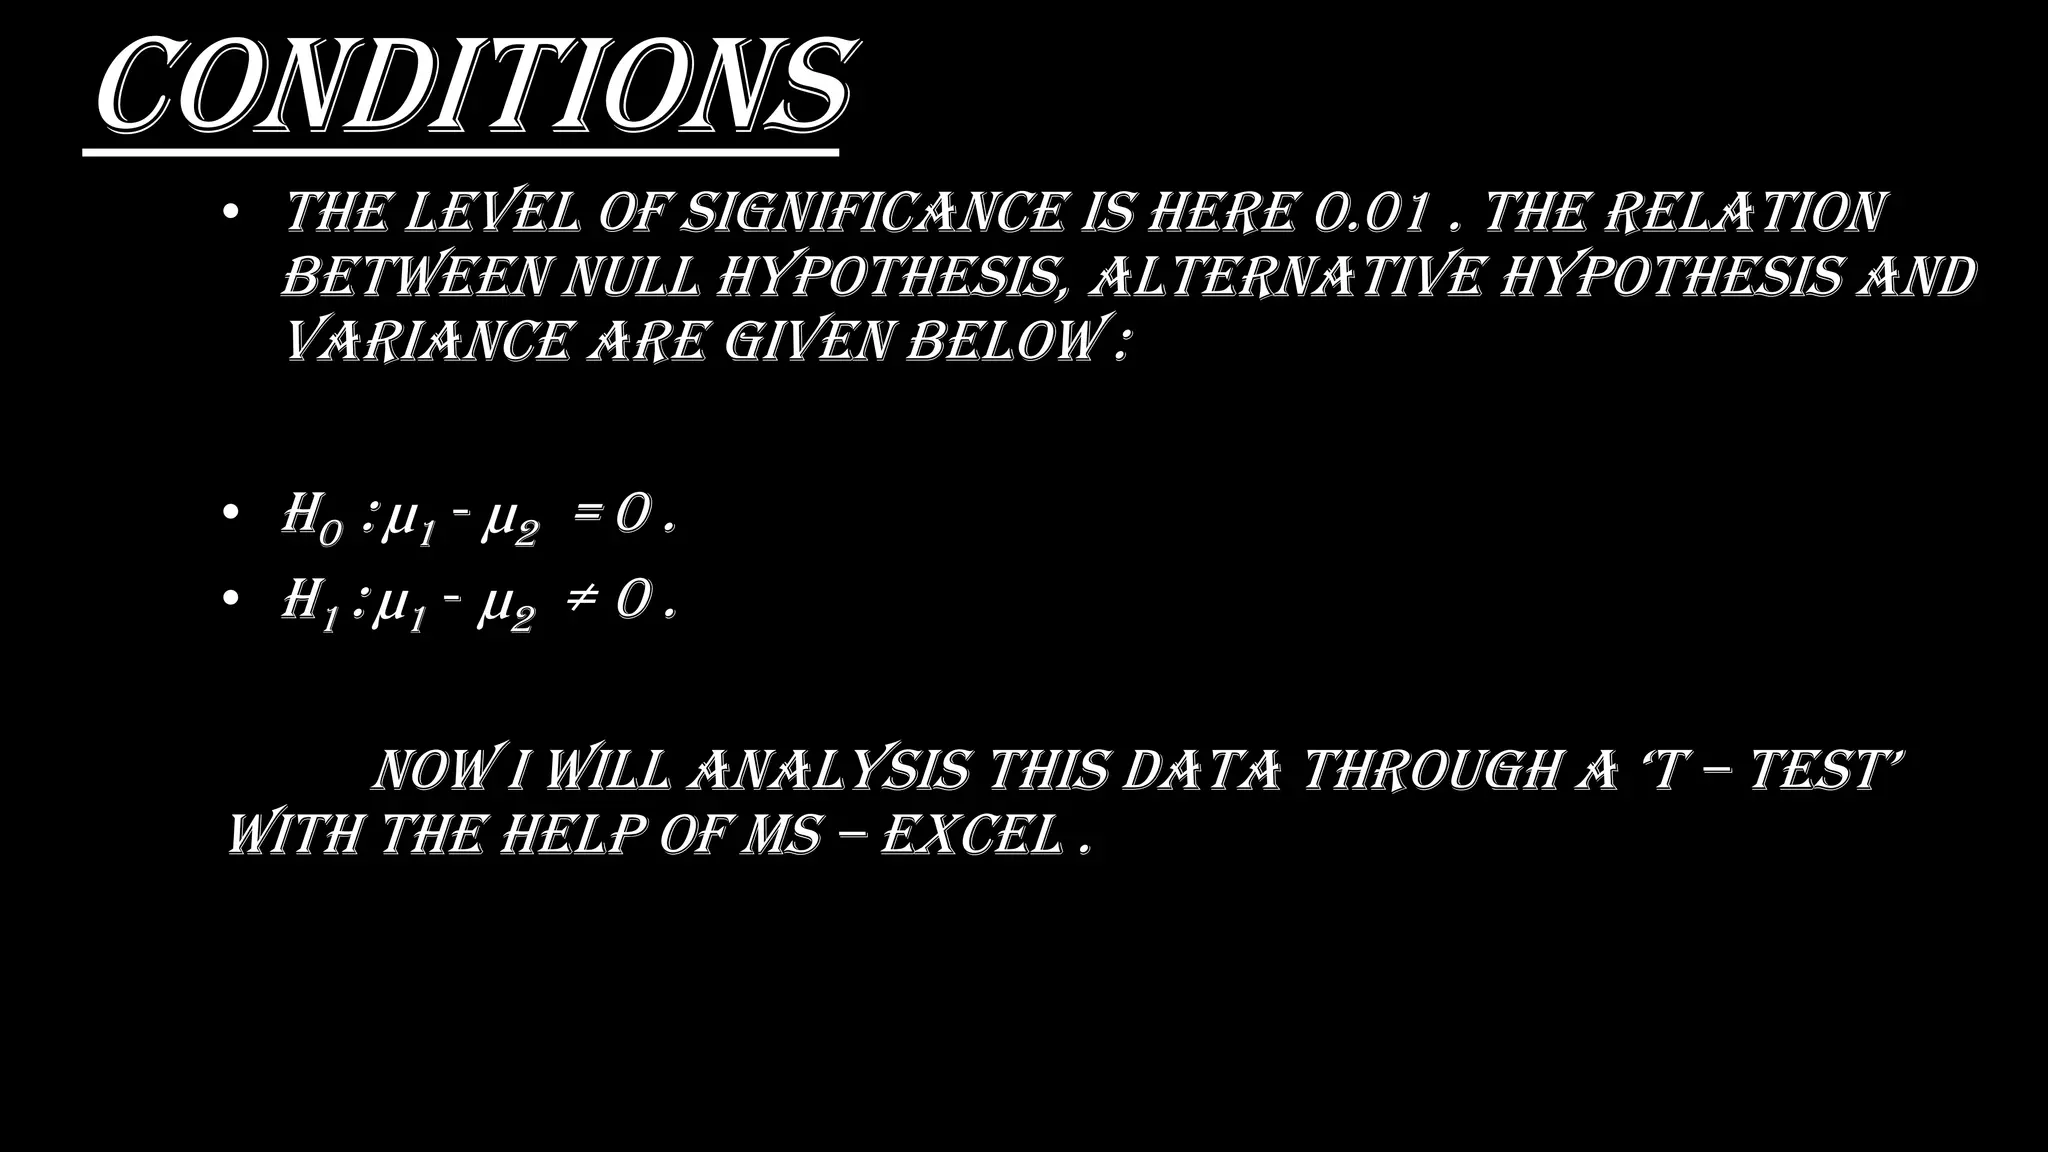
3. Definitions of the null and alternative hypotheses.
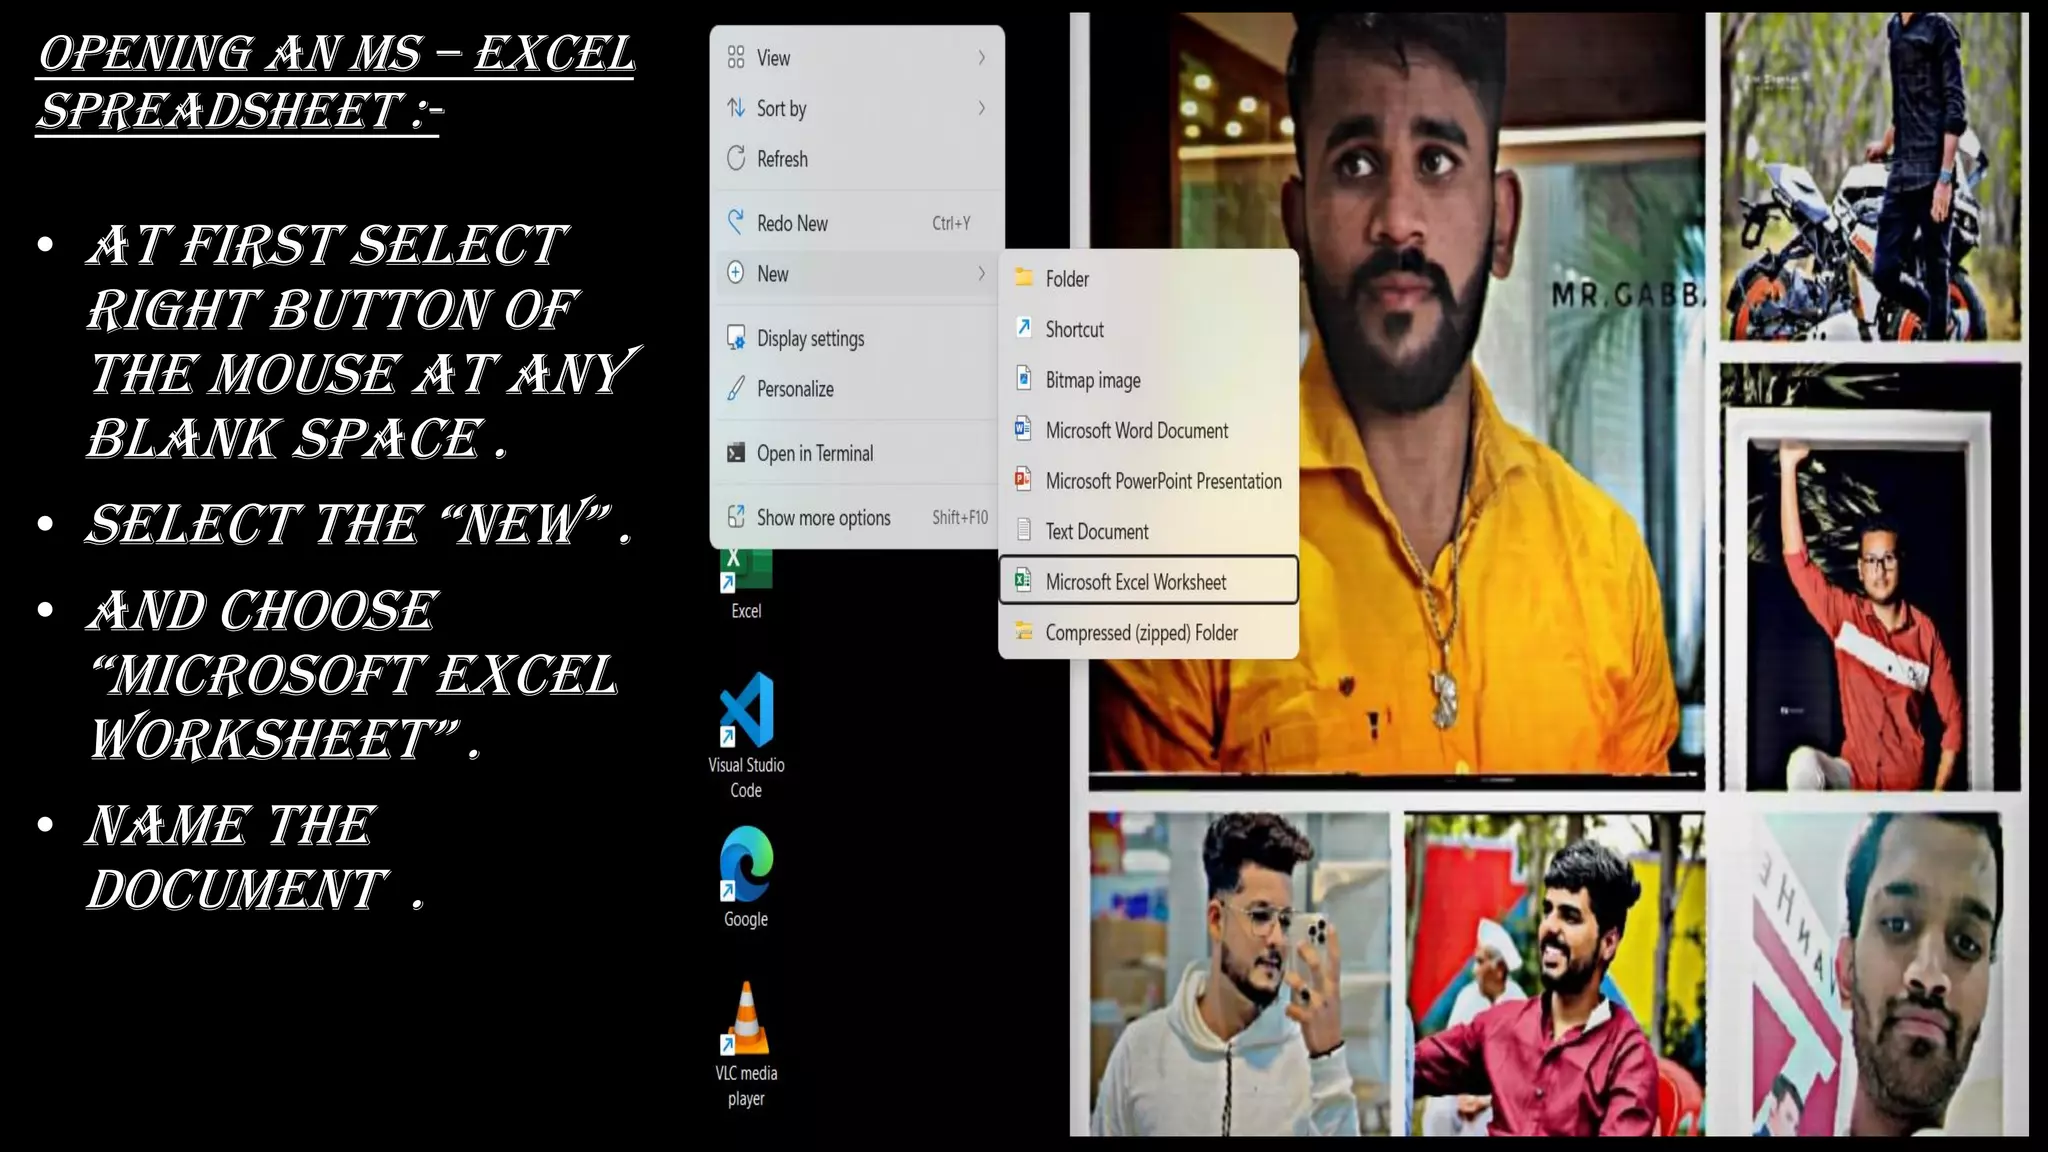
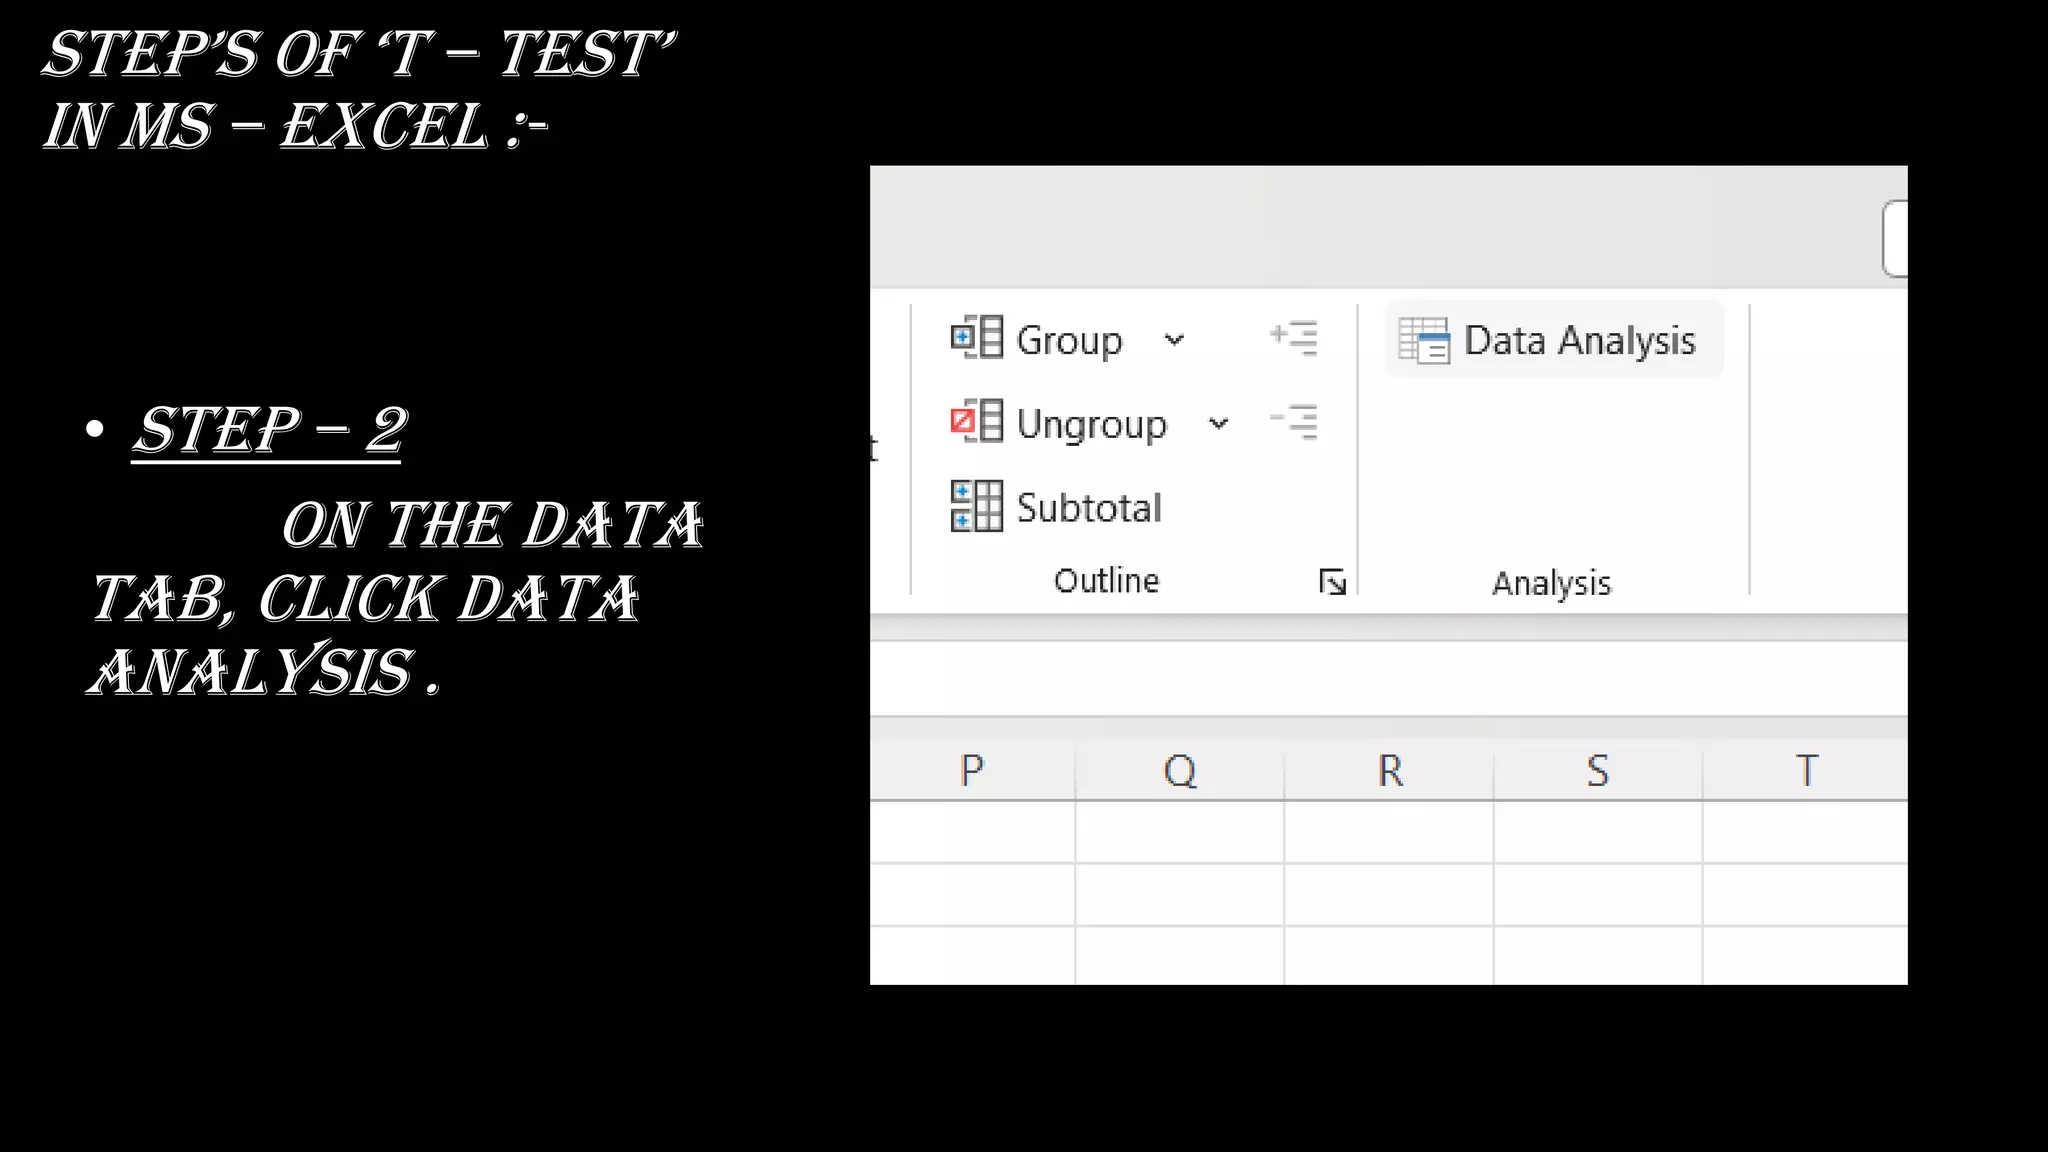
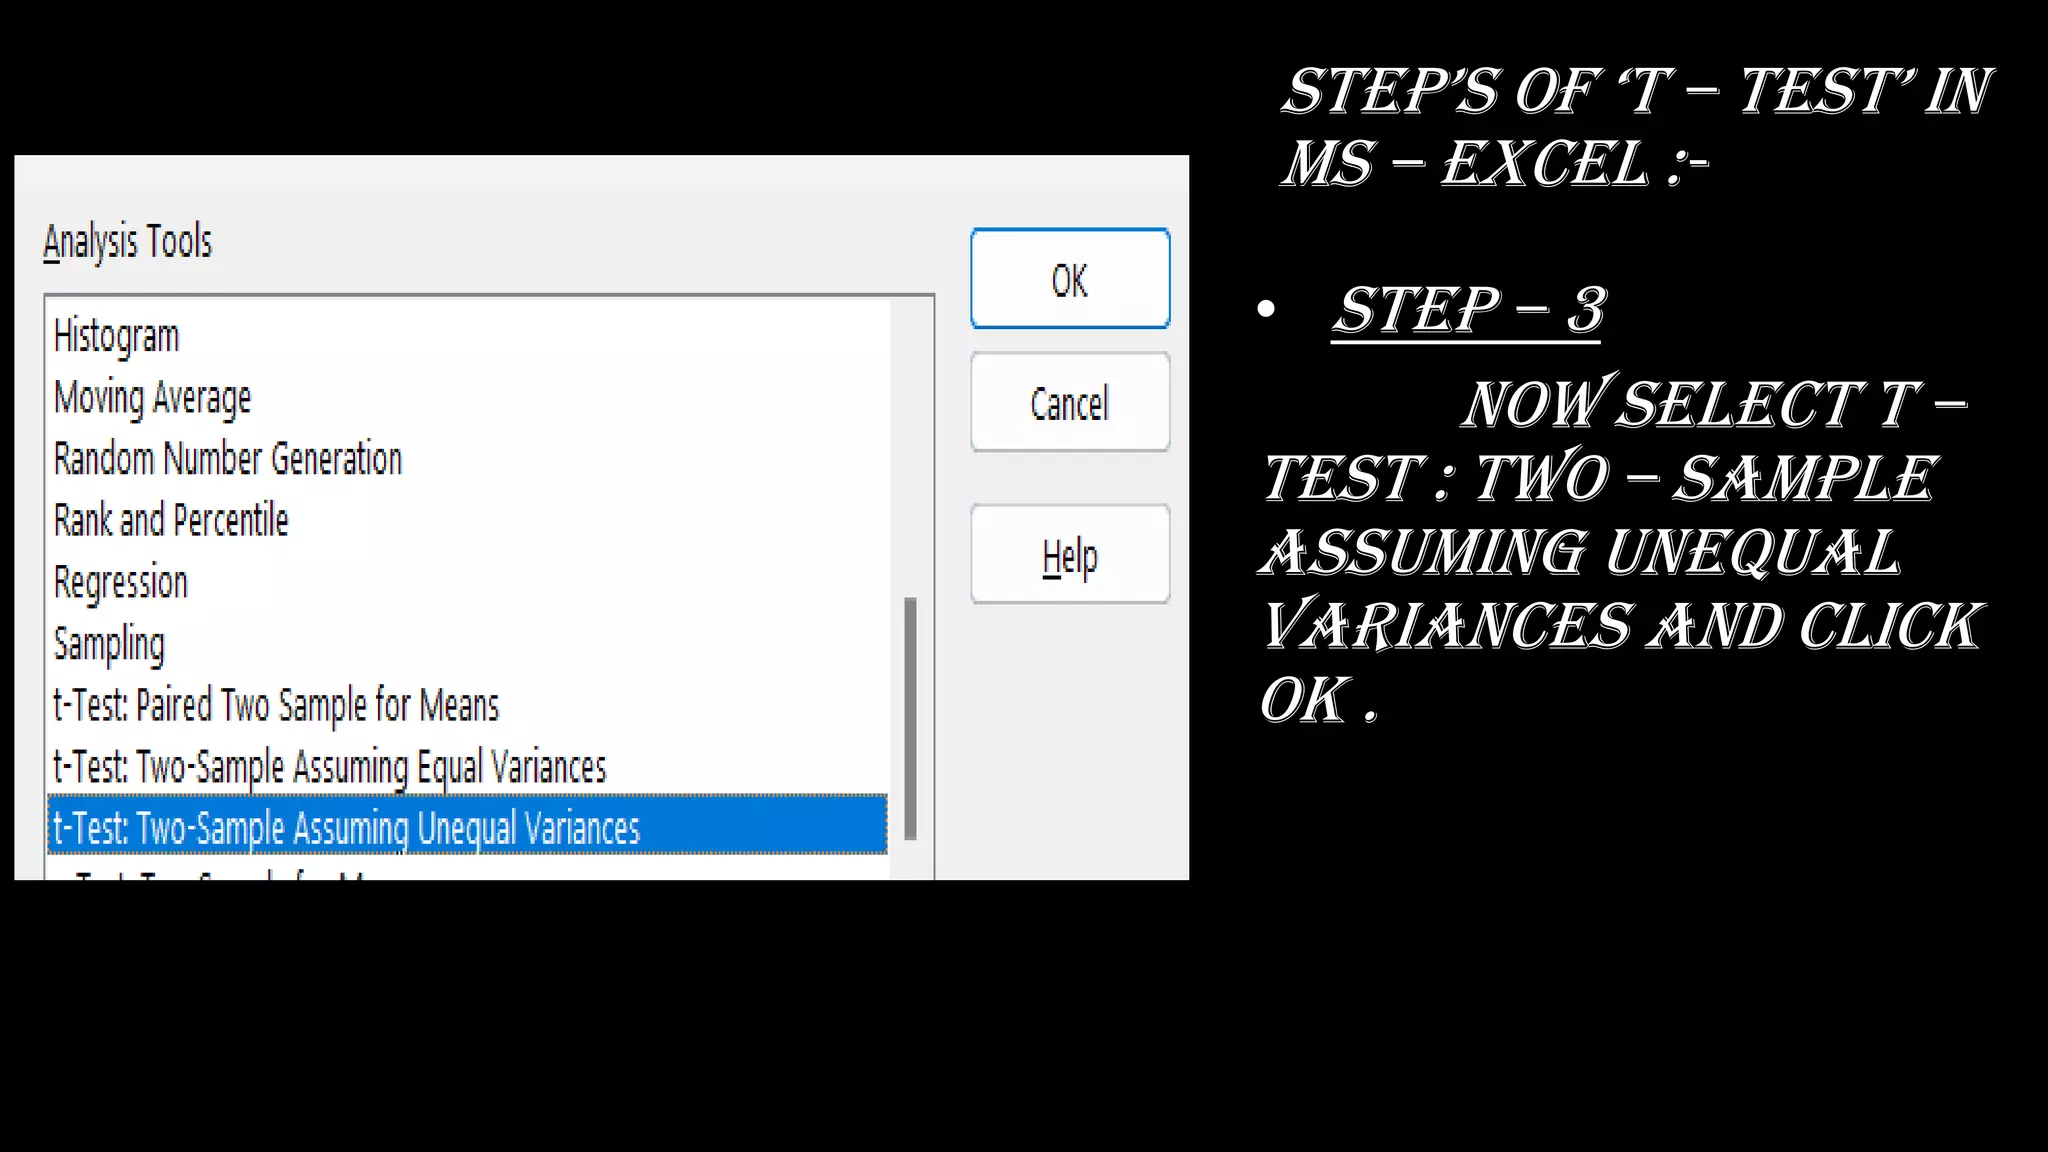
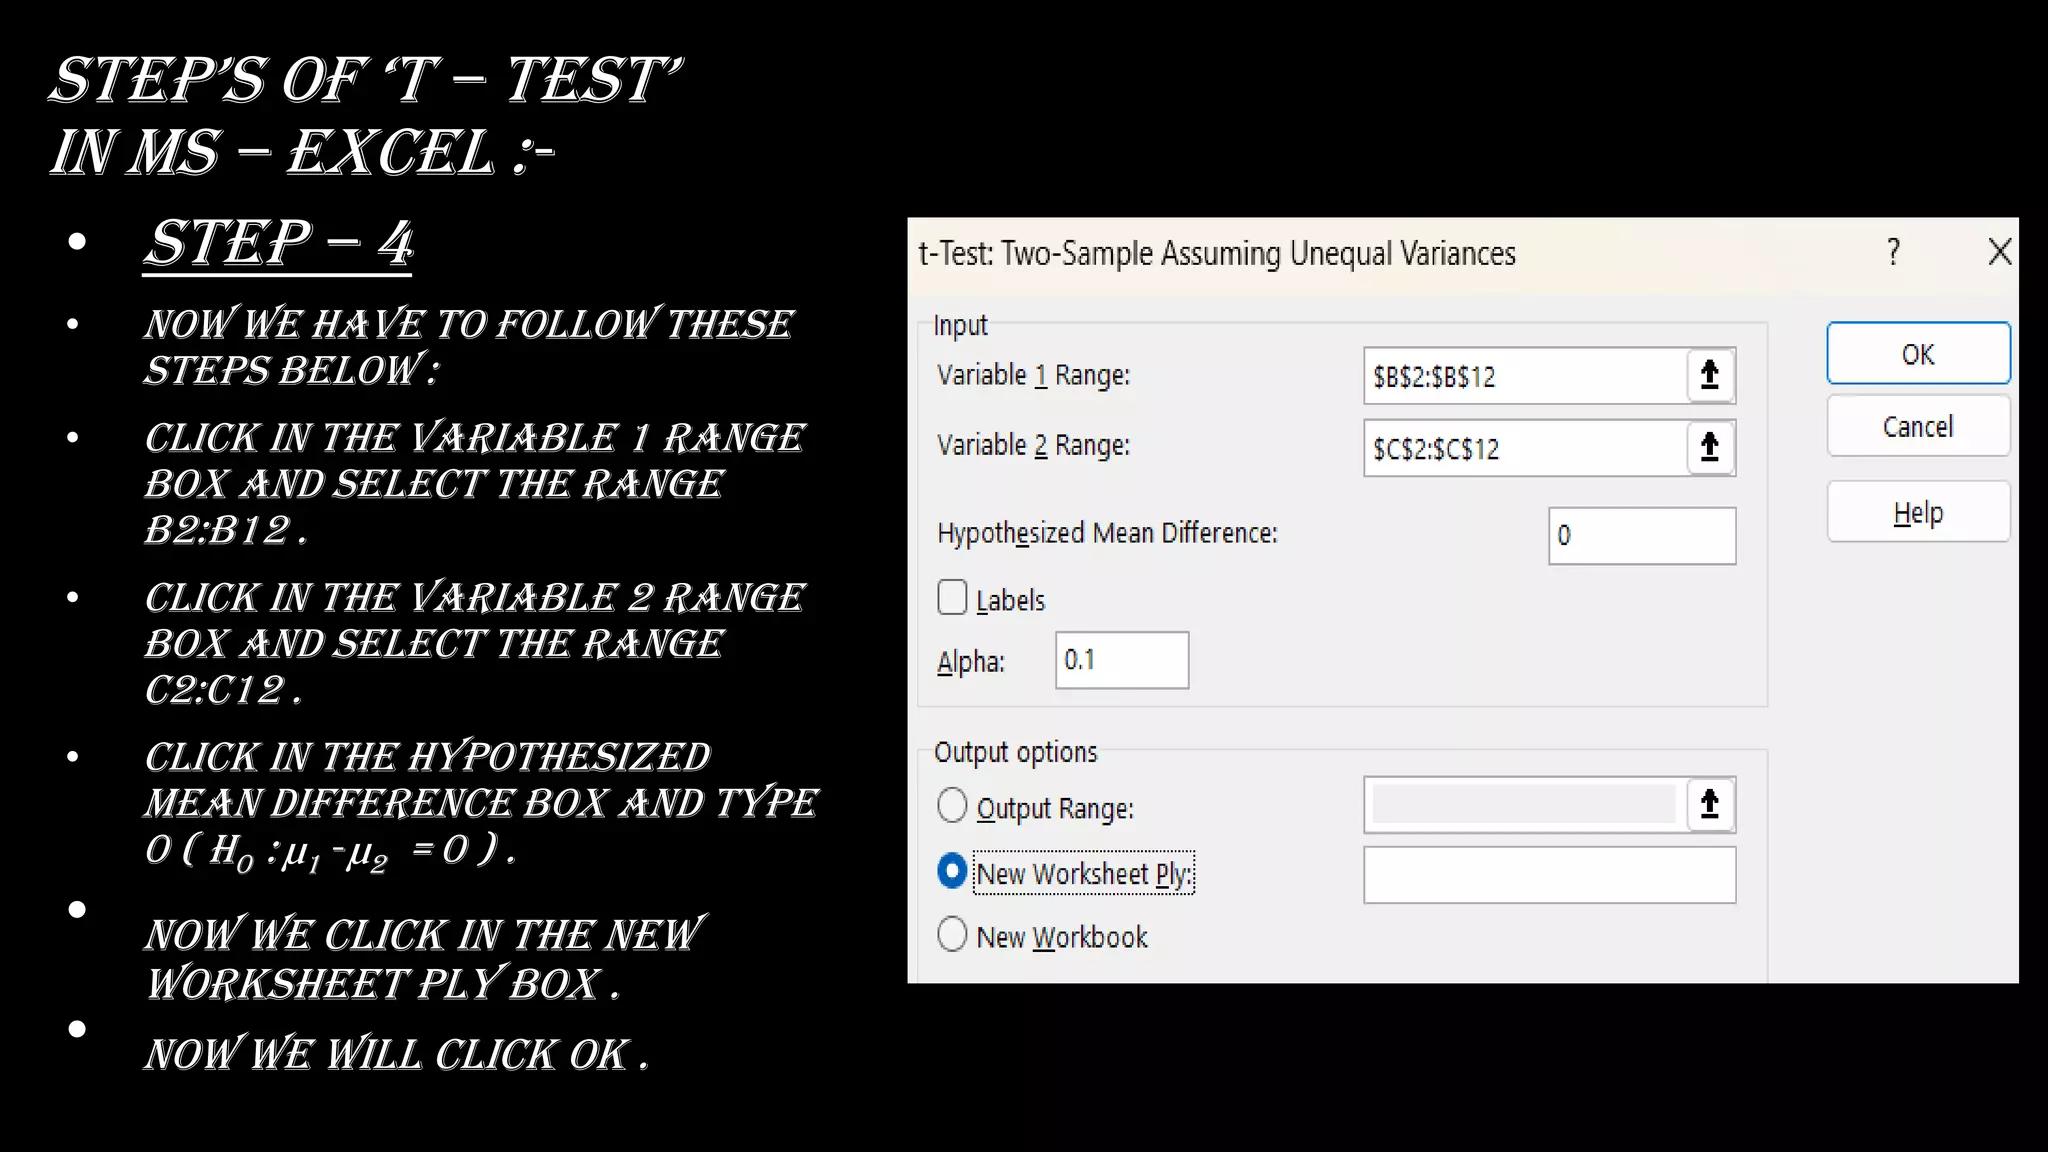
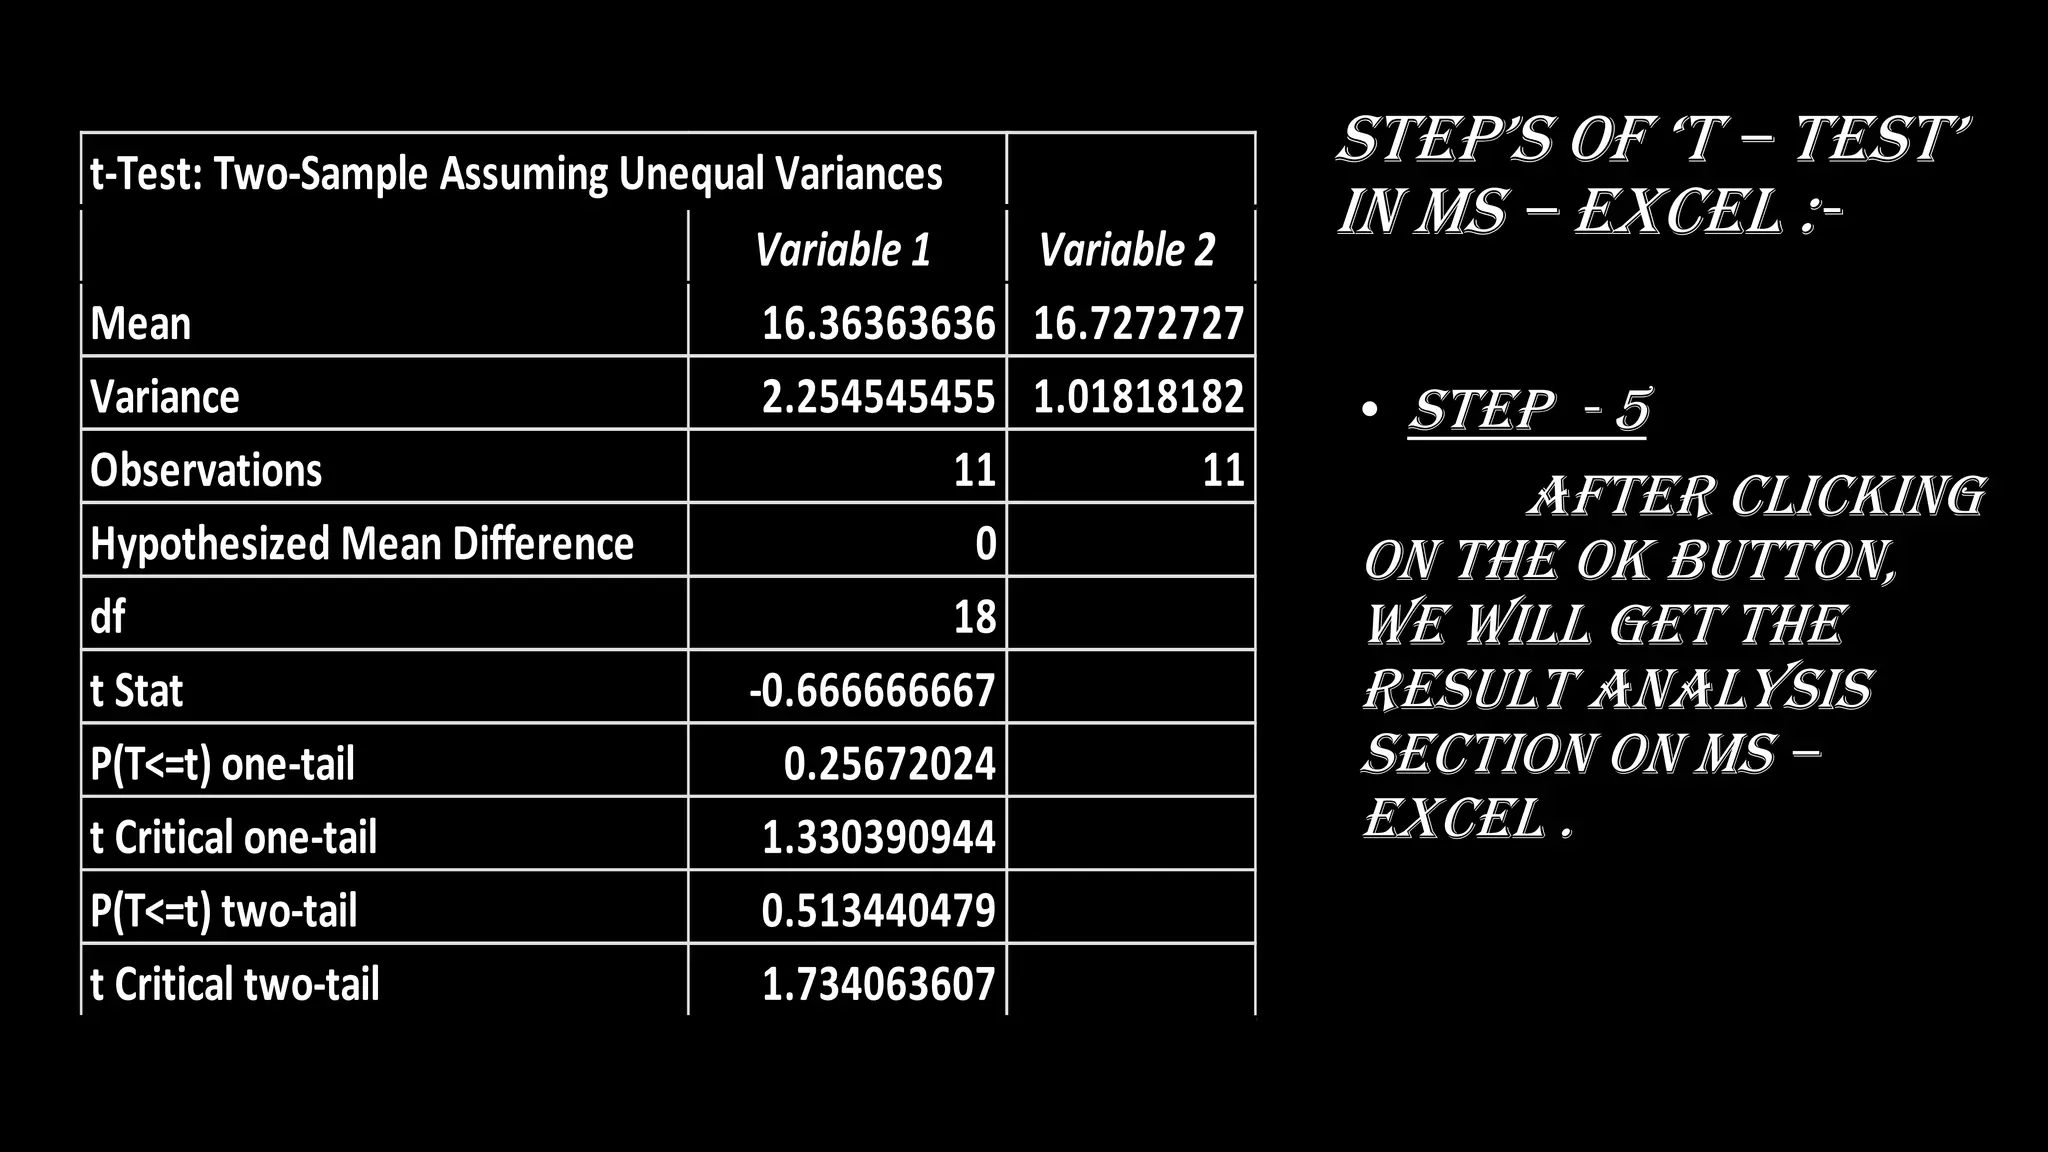
4. Steps for performing a t-test on the student mark data in Excel, including inputting the data, selecting the t-test analysis tool, and interpreting the results.
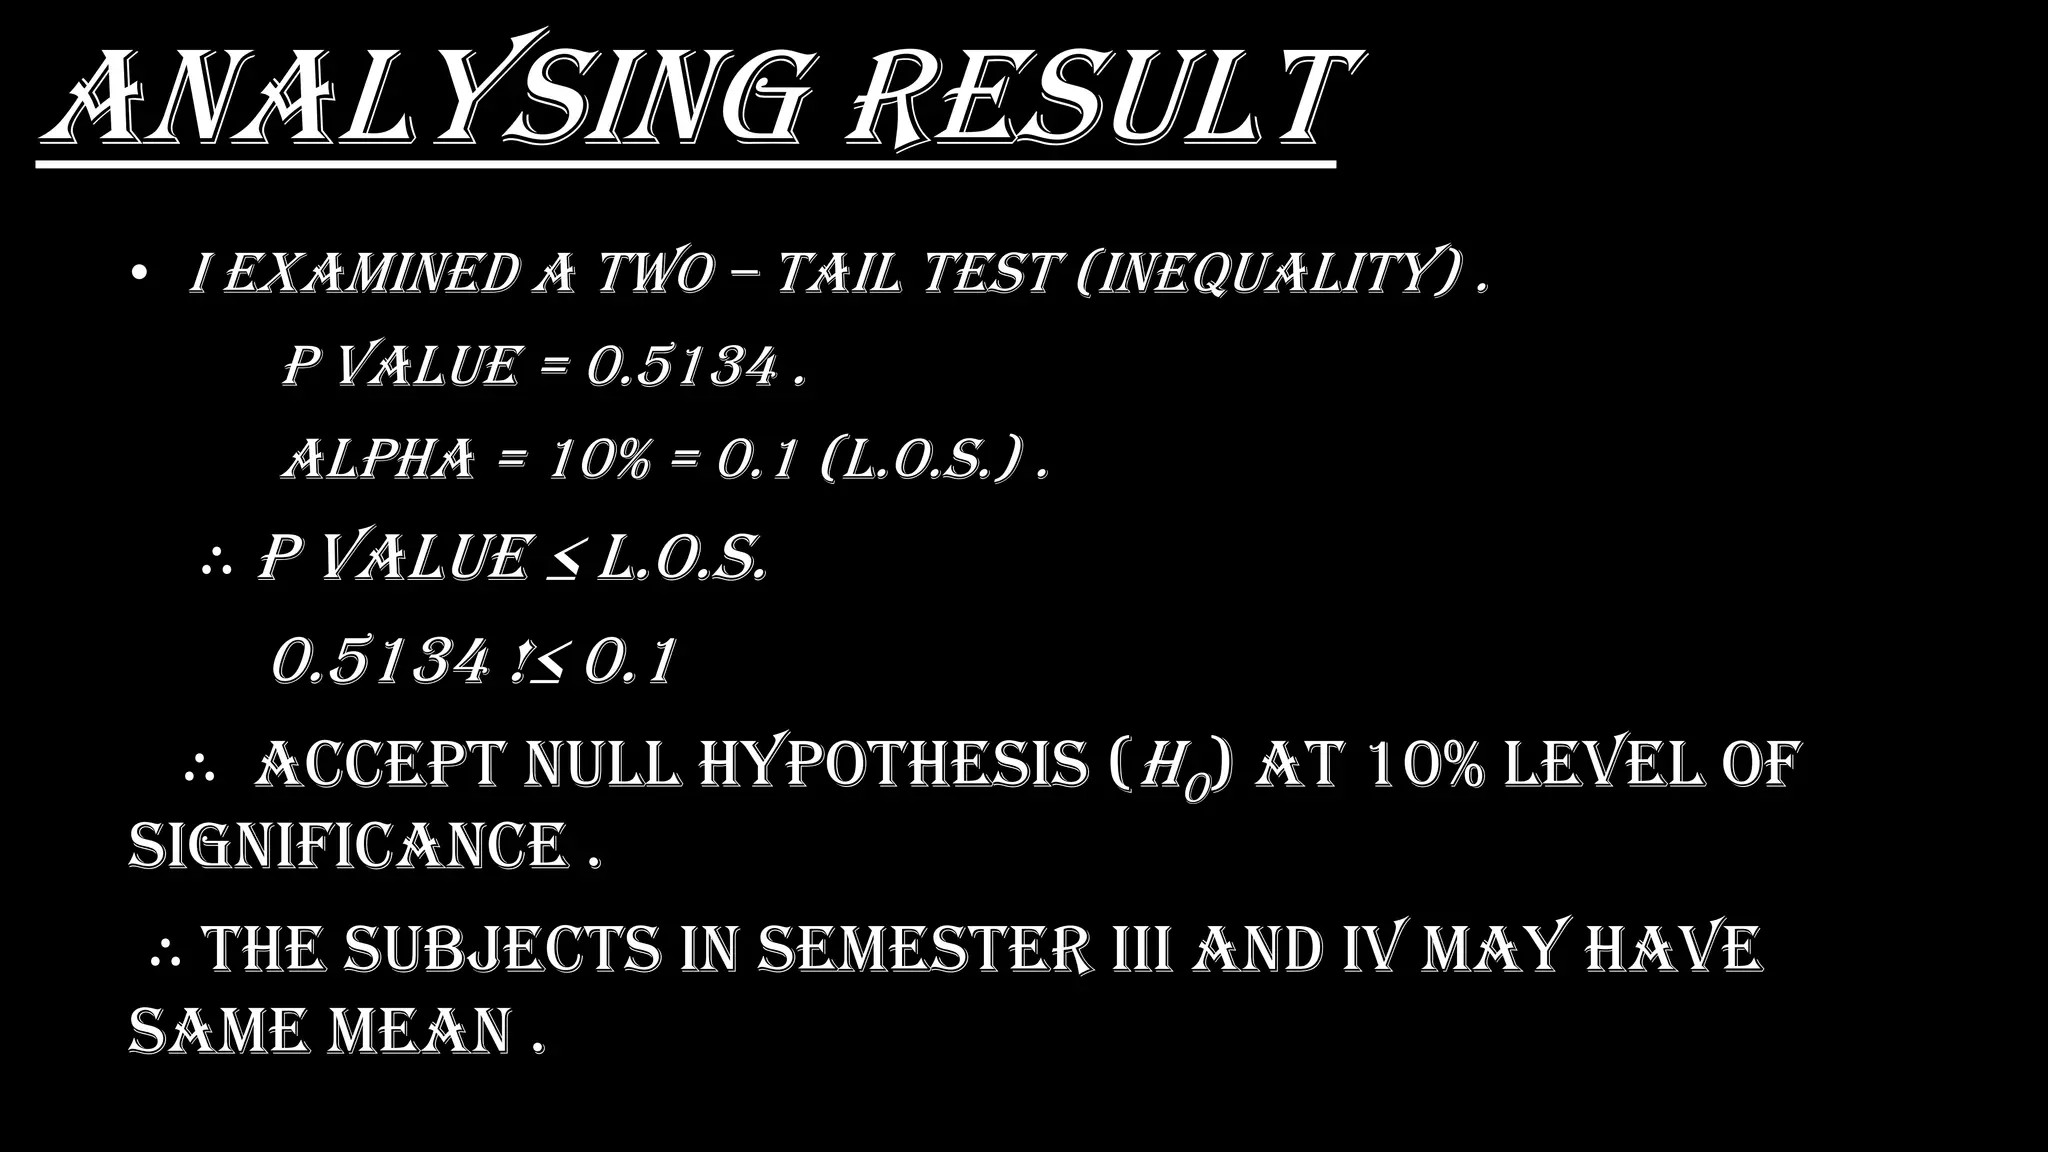
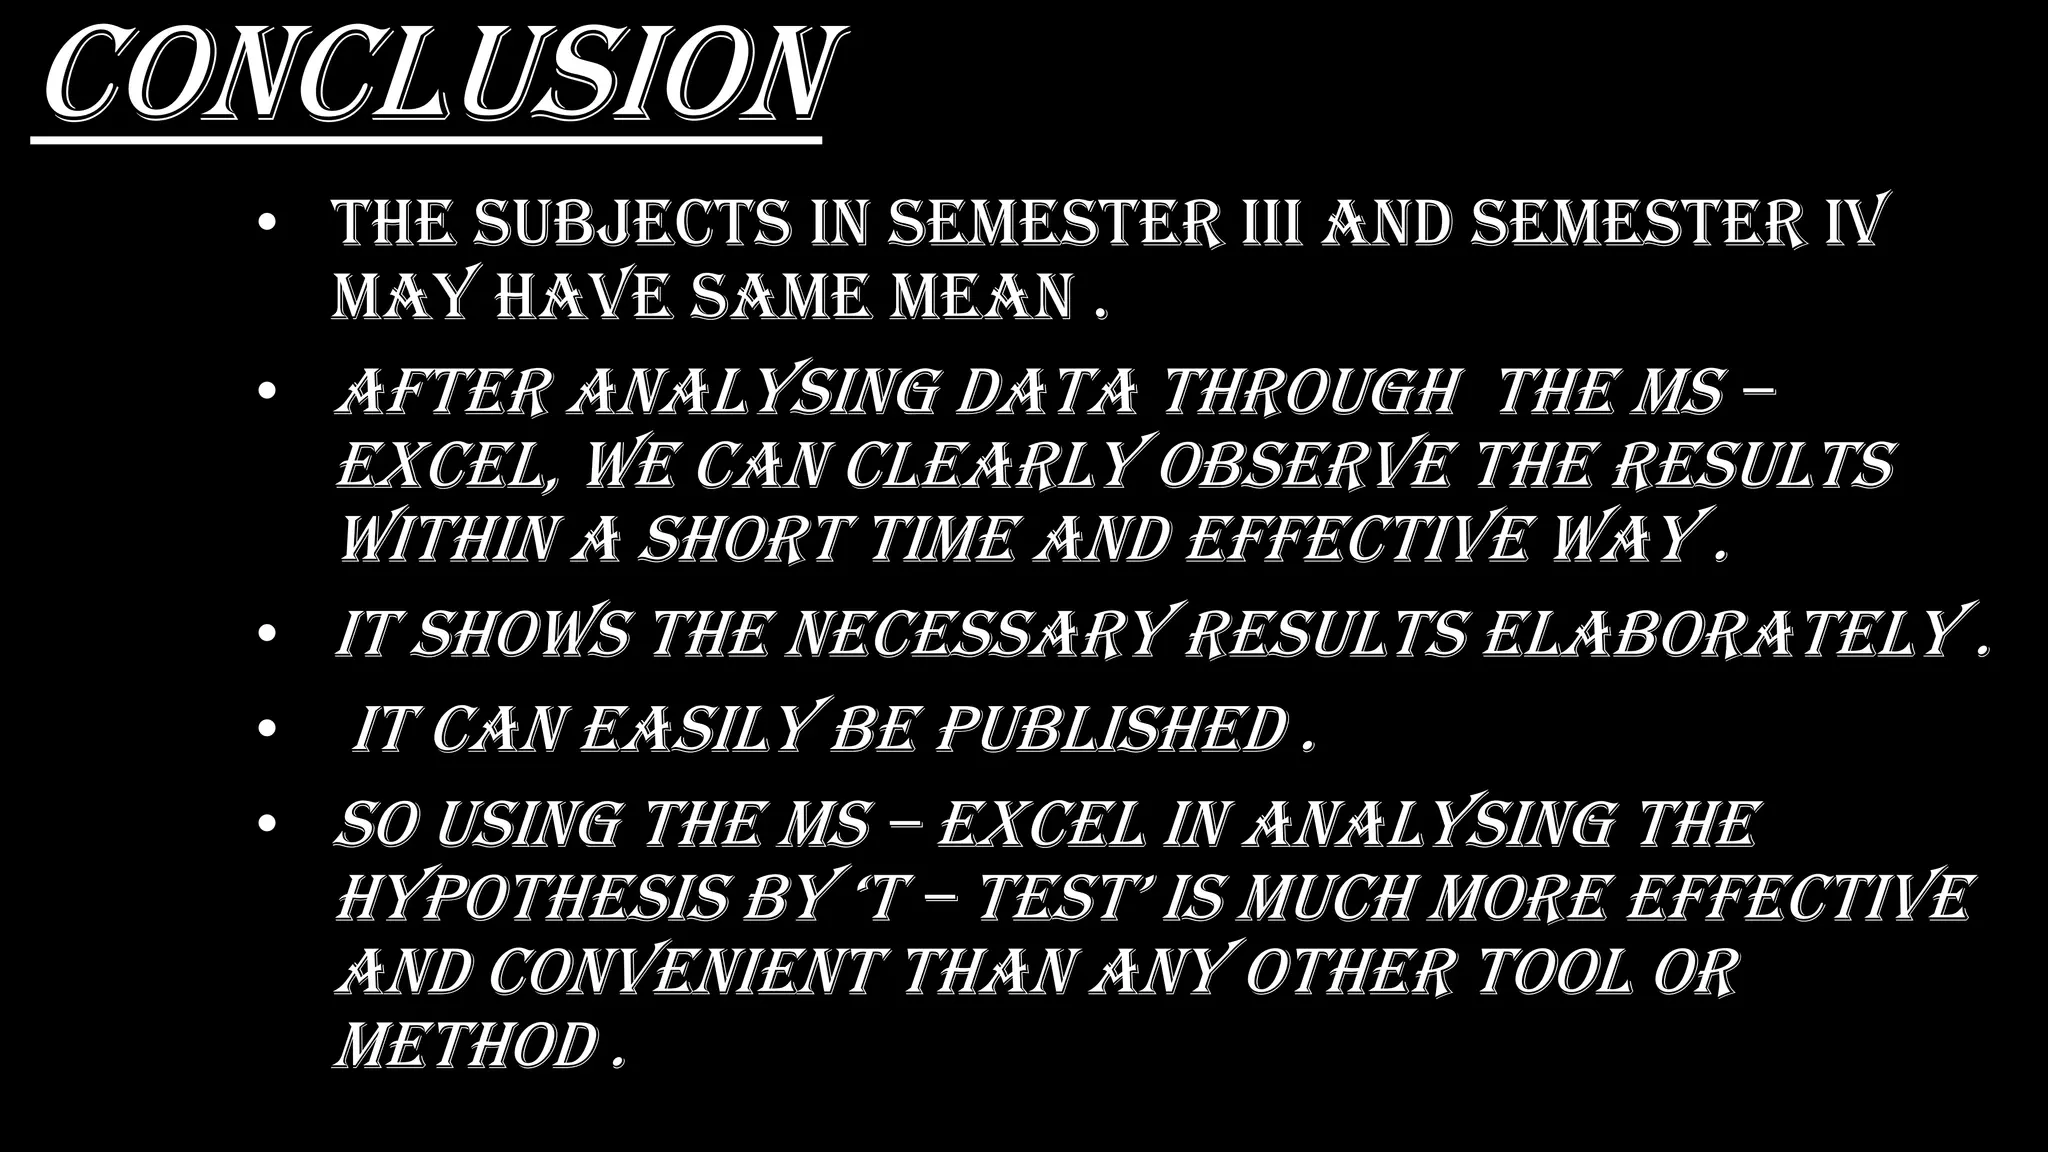
5. The results of the t-test show no significant difference between the means of the two semesters, so the null hypothesis is accepted.