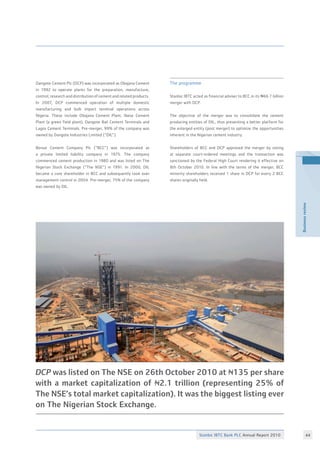
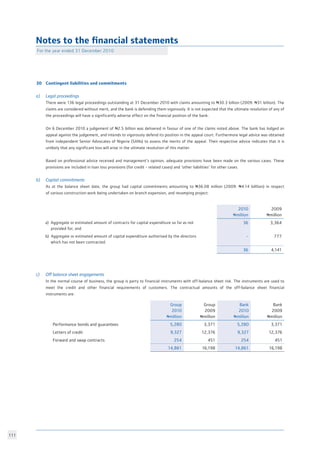
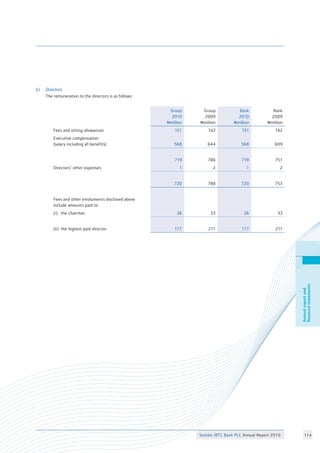
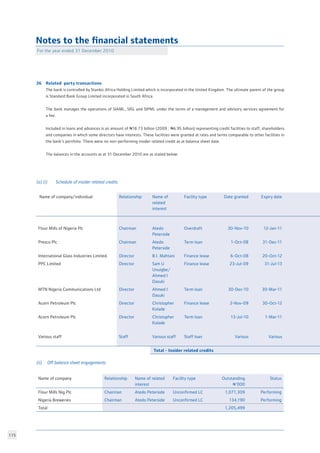
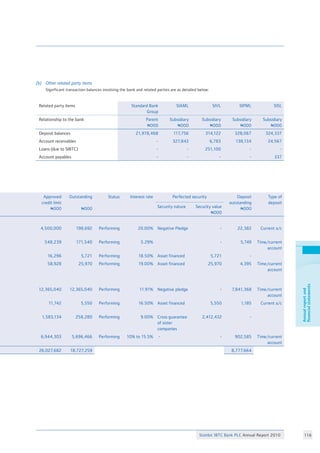
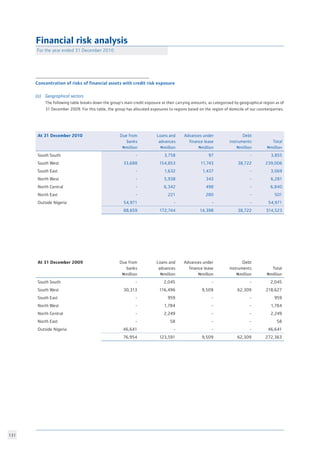
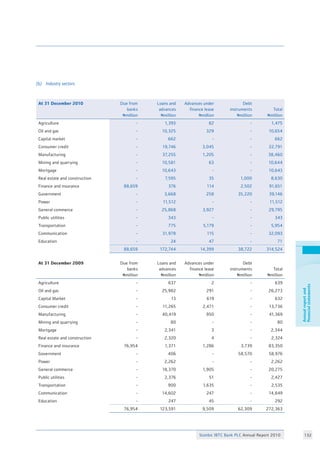
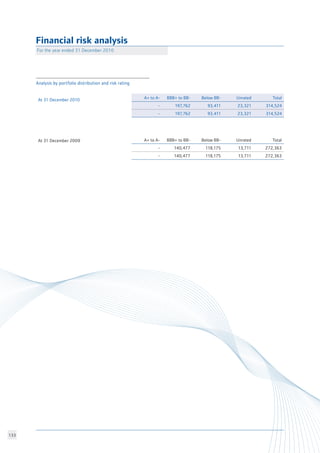
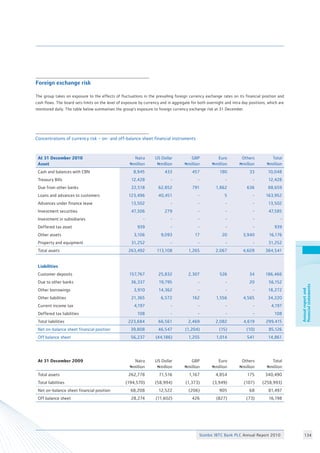
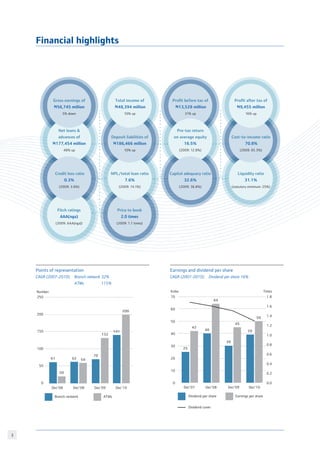
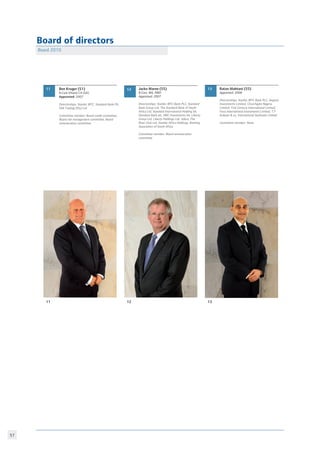
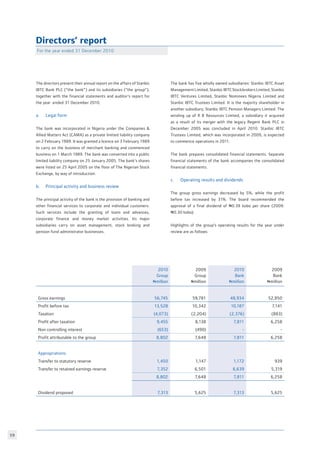
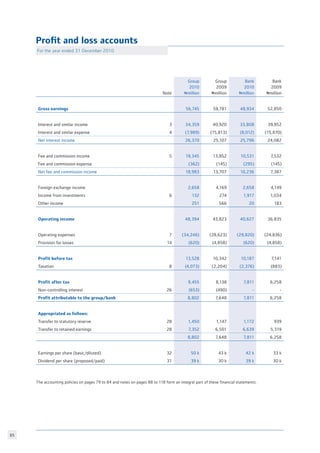
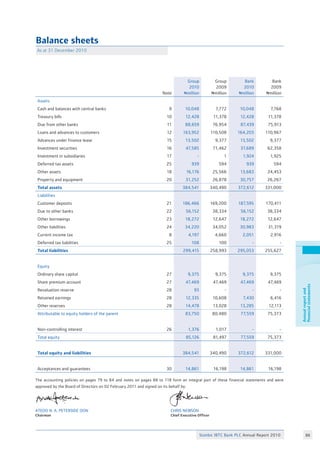
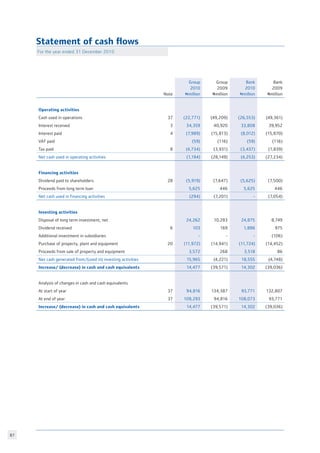
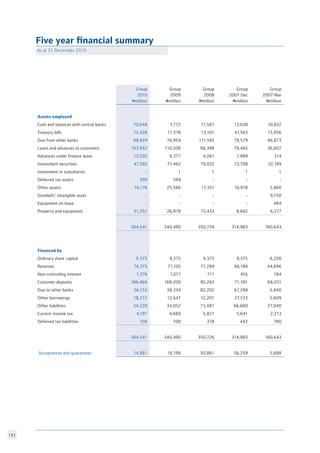
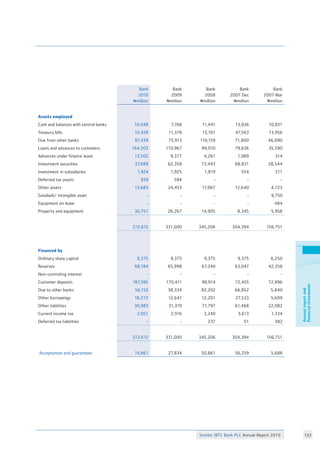
Stanbic IBTC Bank PLC
Annual Report 2010
RC 125097
The flow and ebb of the financial landscape is
not always a predictable one. Constant trend
fluctuations and ripples in global economics
have resulted in Stanbic IBTC adopting a
progressive attitude of intelligent flexibility,
one that has seen them excel, not only in past
challenges, but in our present fast-moving
conditions.
With our worldwide perspective, we can affect
changes and advances fluidly - to not only
individual accounts but the pattern and rhythm
ofourbankingpractises.Keepingourcustomers,
shareholders and staff ahead of the pack.
We are fluent in forward-thinking business
demands. We keep you moving forward.
www.stanbicibtcbank.com
Making the right connections can
make the world of difference in
the world of finance.
BusinessreviewAnnualreportand
financialstatements
GroupoverviewOtherinformationBusinessreview
01
03
04
05
07
Table of contents
Overview
Our vision & values
Financial highlights
A broad-based financial services business
Recognition
Standard Bank Group at a glance
Business review
	
Chairman’s statement	
Chief executive’s statement	
Economic review
Financial review	
Executive committee	
Personal and Business Banking	
Case study – BT Technologies Limited
Case study – Don P Communications Ltd
Corporate and Investment Banking
Case study – Oando Plc 	
Case study – Dangote Cement Plc	
Case study – AccuGas Limited
Case study – IHS Nigeria Plc
Wealth
Annual report and financial statements
Board of directors
Directors’ report
Directors’ responsibility for annual financial statements
Corporate governance report
Audit committee report
Report of the independent auditor
Statement of accounting policies
Profit and loss accounts
Balance sheets
Statement of cash flow
Notes to the financial statements
Financial risk analysis
Statement of value added
Five year financial summary
Other information
Management team
Branch network
Contact information
	
11
15
19
21
29
31
33
35
37
41
43
45
47
49
55
59
64
65
77
78
79
84
85
86
88
119
149
151
	
157
162
166
Annualreportand
financialstatements
GroupoverviewOtherinformation
Connecting
Africa to the
world, and the
world to Africa
Stanbic IBTC Bank PLC Annual Report 2010
Our vision  values
One vision
To be the best financial solutions team - the customer’s choice.
We will deploy our local knowledge and global emerging market expertise to deliver superior value to all our stakeholders.
We will only succeed if we are able to attract, retain, develop and deploy teams of people with energy, passion and skills.
Eight values
•
•
•
Serving our customers
We do everything in our power
to ensure that we provide our
customers with the products,
services and solutions to suit their
needs, provided that everything
we do for them is based on sound
business principles.
Upholding the highest
levels of integrity
Our entire business model is based
on trust and integrity as perceived
by our stakeholders, especially our
customers.
Respecting each other
We have the highest regard for the
dignityofallpeople.Werespecteach
other and what Stanbic IBTC stands
for. We recognise that there are
corresponding obligations associated
with our individual rights.
Growing our people
We encourage and help our people
to develop to their full potential
and measure our leaders on how
well they grow and challenge the
people they lead.
Stanbic IBTC Bank PLC Annual Report 2010 
Groupoverview
Being proactive
We strive to stay ahead by
anticipating rather than reacting,
but our actions are always
carefully considered.
Delivering to our
shareholders
We understand that we earn the
right to exist by providing
appropriate long-term returns to
our shareholders. We try extremely
hard to meet our various targets
and deliver on our commitments.
Guarding against
arrogance
We have confidence in our ability
to achieve ambitious goals and
we celebrate success, but we
never allow ourselves to become
arrogant.
Working in teams
We, and all aspects of our work,
are interdependent. We appreciate
that, as teams, we can achieve
much greater things than as
individuals We value teams within
and across business units, divisions
and countries.
Financial highlights
Price to book
2.0 times
(2009: 1.7 times)
Fitch ratings
AAA(nga)
(2009: AAA(nga))
NPL/total loan ratio
7.6%
(2009: 14.1%)
Deposit liabilities of
N186,466 million
10% up
Liquidity ratio
31.1%
(statutory minimum: 25%)
Net loans 
advances of�
N177,454 million
48% up
Cost-to-income ratio
70.8%
(2009: 65.3%)
Profit before tax of
N13,528 million
31% up
Total income of
N48,394 million
10% up
Profit after tax of
N9,455 million
16% up
Credit loss ratio
0.3%
(2009: 3.6%)
Gross earnings of
N56,745 million
5% down
Pre-tax return
on average equity
16.5%
(2009: 12.8%)
Pre-tax return
on average equity
16.5%
(2009: 12.8%)
Capital adequacy ratio
32.6%
(2009: 36.8%)
Earnings and dividend per share
CAGR (2007-2010): 	 Dividend per share 16%
		
Points of representation
CAGR (2007-2010): 	 Branch network 32%
			 ATMs 	 115%
Dividend per share Earnings per share
Dividend cover
Kobo Times
Dec’07 Dec’08 Dec’09 Dec’10
0
10
20
30
40
50
60
70
0.0
0.2
0.4
0.6
0.8
1.0
1.2
1.4
1.6
1.8
25
42
40
64
30
45
39
50
Number
250
200
150
100
50
0
Dec’08Dec’08
62 5961
20
Dec’09 Dec’10
Branch network ATMs
70
132
141
200
Stanbic IBTC Bank PLC Annual Report 2010 
Groupoverview
Gross revenue
N33.7 billion
Corporate and investment banking
services to larger corporates,
financial institutions and international
counter-parties in Nigeria.
Gross revenue
N14.3 billion
Banking and other financial services
to individual customers and small to
medium sized enterprises.
Gross revenue
N8.7billion
Investment management in form
of asset management, pension
fund administration and trusteeship.
Personal  Business
Banking (PBB)
WealthCorporate  Investment
Banking (CIB)
Total assetsTotal incomeGross revenue
Groupoverview

Wealth CIB
PBB
60%
15%
25%
Gross loans and advances
Wealth CIB
PBB
57%
18%
25%
Wealth CIB
PBB
65%
3%
32%
CIBPBB
69%
31%
A broad-based financial services business
The Standard Bank Group (SBG) merged its Nigerian operations, Stanbic Bank Nigeria (SBN) with that of IBTC Chartered Bank PLC
(IBTC) on 24 September 2007. The merger, by way of the first ever tender offer in Nigeria and $525 million in foreign direct investment,
was the largest in Nigerian financial history. The Standard Bank Group, which has a controlling stake of 50.8% in Stanbic IBTC, has been
in business for over 148 years and is Africa’s largest banking group ranked by assets and earnings.
SBN was created in 1992 when SBG acquired ANZ Grindlays’ operations in Botswana, Ghana, Kenya, Nigeria, Uganda, Zaire, Zambia
and Zimbabwe. SBN offered merchant banking services, while Investment Banking  Trust Company (IBTC) was established 22 years
ago to offer investment banking and investment management services. IBTC merged with Chartered Bank and Regent Bank in 2005
and was thereafter known as IBTC Chartered Bank PLC - a universal bank. At the time of the merger with Stanbic Bank Nigeria, IBTC
Chartered Bank PLC was the leading investment bank in Nigeria.
Stanbic IBTC Bank PLC is a universal bank and has consolidated its position in Nigeria as a diversified business with a proven track
record. The group focuses on the three key business segments – Corporate  Investment Banking, Personal  Business Banking and
Wealth Management that leverage the skills, economies of scale and synergies that come from being part of an international group,
and our excellent Nigerian pedigree.
Recognition
Stanbic IBTC Bank PLC Annual Report 2010 
Groupoverview
ACQ Country Award
The ACQ Finance Magazine Country Awards is an
annual event that celebrates the top Mergers 
Acquision dealmakers and their transactions. Stanbic
IBTC Bank has been awarded ‘Bank of the Year,
Investment Bank of the Year 2010 and Best Debt
Advisory Firm of the Year. Getting an accolade of this
value amidst several other notable competitors is a
very important nod for Stanbic IBTC Bank.
Best Custodian Bank in Nigeria
The bank was voted the Best Custodian Bank in
Nigeria in the Global Custodian 2010 Emerging
Markets Awards in the domestic, cross border and
leading client’s categories. The award affirms the
bank’s position as a leading custodian in Nigeria.
Finance Monthly Global Awards
This is a celebration of companies which are
considered the best in their class, particularly in
the light of one of the most demanding periods
commerce has experienced for decades. Stanbic
IBTC Stockbrokers Limited (a subsidiary of the bank)
was awarded the Best Stockbroker of the Year by
Gobal Awards.
Best Investment Bank in Nigeria
2010, EMEA Finance Awards
Stanbic IBTC Bank won the Best Investment
Bank Award 2010, from EMEA Finance, for its
achievement, successes and notable transactions
in the course of the year.
Fair Play Award
This was conferred on the bank during the Nigeria
Banker’s games 2010 for displaying outstanding
spirit or sportsmanship
Other awards won by the Bank include:
•	 Best Brokerage House, EMEA Finance, 2010
•	 Best Issuing House, EMEA Finance, 2010
•	 Best Investment Bank in Nigeria, Euromoney,
	 2010
•	 Best Investment Bank, EMEA Finance, 2010
•	 Physiotherapy Disabled Friendly Award, 2010
	 Nigeria Society of Physiotherapy
•	 ADVAN Award for Marketing Excellence, 2010
	 - “Campaign of the year - Radio”
Standard Bank Group at a glance
Where we operate
*	 Market capitalisation R170 billion (US$26 billion)
*	 Total assets R1.341 trillion (US$202 billion)
*	 Operating in 17 African countries and 15 countries
	 outside Africa
*	 53,351 employees (2,248 in Nigeria)
*	 1,216 branches (141 in Nigeria)
*	 6,816 ATMs (200 in Nigeria)
Stanbic IBTC Bank PLC Annual Report 2010 
Groupoverview
North West 	 - 	 30
South East 	 - 	 17
South South 	 - 	 15
South West 	 - 	 31
North West	 - 	 21
South East 	 - 	 8
South South 	 - 	 15
South West 	 - 	 25
FCT Abuja 	 - 	 8
Lagos Island 	 - 	 16
Lagos Mainland - 	 35
North Central 	 - 	 8
North East 	 - 	 5
	
FCT Abuja 	 - 	 12
Lagos Island 	 - 	 35
Lagos Mainland - 	 44
North Central 	 - 	 9
North East 	 - 	 7
Branches in Nigeria
ATMs
Groupoverview
Stanbic IBTC Bank PLC Annual Report 2010 10
Businessreview
06
Business
review	
Chairman’s statement	
Chief executive’s statement	
Economic review
Financial review	
Executive committee	
Personal and Business Banking	
Case study – BT Technologies Limited
Case study – Don P Communications Ltd
Corporate and Investment Banking
Case study – Oando Plc 	
Case study – Dangote Cement Plc	
Case study – AccuGas Limited
Case study – IHS Nigeria Plc
Wealth
11
15
19
21
29
31
33
35
37
41
43
45
47
49
11
Atedo N A Peterside (OON)
Chairman
2011 has become an important transition
period for our bank and also for Nigeria.
“I am however pleased to report that both Stanbic IBTC Bank
PLC and our parent, Standard Bank Group, take succession
planning very seriously as we realise that our business will
only remain safe and secure if it continues to be overseen by
safe and trusted hands.”
Chairman’s statement
Stanbic IBTC Bank PLC Annual Report 2010 12
Businessreview
In the build up towards this 22nd Annual General Meeting (AGM)
of our bank, there was a beehive of activity in terms of personnel
movements at the board level. This has naturally generated some
mixed feelings for me and some of the older directors.  While we
are pleased to welcome one new face, we are naturally saddened
that so many of our longest serving non-executive directors have
had to move on at about the same time. 
 
I am however pleased to report that both Stanbic IBTC Bank PLC
and our parent, Standard Bank Group, take succession planning
very seriously as we realise that our business will only remain
safe and secure if it continues to be overseen by safe and trusted
hands.
At the national level, there was intense political activity on
account of party primaries early in the year which were a prelude
to the April general elections. The year 2011 has therefore
become an important transition period for our bank and also for
Nigeria. The months preceding an election are also a very difficult
period for curbing the fiscal excesses of governments. The virtual
depletion of the excess crude account reserves, from nearly $20
billion in 2008 and the erosion of the nation’s external reserves
which dwindled from $42 billion at the onset of the current
administration to a little over $32 billion as at 31 December 2010
have also generated some controversy. This, added to the fact
that the Government was borrowing domestically at negative
real interest rates to finance a growing deficit which was largely
funding recurrent expenditure, fuelled inflationary expectations
as well as concerns over exchange rate stability.
While the inflation rate has remained stubbornly in the double-
digits, with core inflation closing the year 2010 at just below
11%, a significant spike in consumer prices has however not
materialised, probably because the impact of fiscal expansion
was offset by a weak money multiplier and a contraction in
private sector credit. Yet public sector credit extension increased
substantially, in line with Nigeria’s total debt stock which climbed
from around $25 billion at the end of 2009 to above $34 billion
as at 31 December 2010.
The Federal Government moved to contain some of the concerns
regarding its countercyclical policies by using the 2011 budget
proposals (a projected 18% cutback in expenditures and a
Businessreview
reduction in its deficit as a percentage of GDP to 3.62%) as
a signal that it was eager to place a lid on its own spending
and gradually roll back the fiscal stimulus that saw its budget
deficit target (as a percentage of GDP) climb to 6.10% in 2010.
Unfortunately, the National Assembly hiked the projected total
expenditure by as much as 13% before approving the budget.
Income statement
The Stanbic IBTC Group (Stanbic IBTC Bank PLC together with
its subsidiaries) achieved gross earnings of N56.7 billion for the
12 months ended 31 December 2010, which was 5% below the
N59.8 billion achieved in the corresponding period ended 31
December 2009. The decrease is largely a result of the extreme
market liquidity in the first three quarters of the year which led to
lower yields on inter bank and fixed income investments. There
was however a partially offsetting decrease in interest paid on
deposits arising from conscious efforts to replace expensive
deposits with cheaper funds. Cautious growth of the loan book
and improved revenues associated with transactional banking
volumes and new advisory mandates also helped to mitigate the
impact of the fall in gross earnings.
Net interest income increased by 5% from N25.1 billion to N26.4
billion due to a reduction in our average deposit interest rates,
which were partly offset by decreased revenue from money
market and fixed income activities. Total assets increased by
13% to N384.5 billion. Consequently, the net interest margin
decreased from 7.4% recorded in the prior year to 6.9%.
Non-interest revenue increased by 18% from N18.7 billion
in 2009 to N22.0 billion in 2010, as a result of new advisory
mandates, increased transactional volumes and gradual recovery
of the capital market which offset the negative impact of lower
trading revenue due to the stability in exchange rates and the
concomitant reduction in arbitrage opportunities.
In line with the growth and expansion strategy of the group,
investment in infrastructure, (doubling branch network to 141)
skilled employees and systems enhancement continued in the
period under review and this contributed to the increase in
operating expenses by 20% to N34.2 billion.
“On account of recent initiatives by the Central Bank of Nigeria to
“ring fence” the business of investment banking from consumer
banking, we expect to restructure our group operations along Holding
Company lines.”
13
as directors. Mr. Adedoyin, Mrs Esiri, Ms Roets and myself, all
being eligible, are offering ourselves for re-election. Later in
the meeting, we will be required to vote on the election of Mr.
Arnold Gain, who was appointed a director after the last AGM.
We will also be voting on nominations received in relation to our
audit committee.
Our Corporate Social Responsibility (CSR) initiatives in 2010 were
focused on contributing to the improvement of the educational
sector in Nigeria, making an impact in the health sector and also
helping in the general development of society. Using Lagos as a
pilot, we activated the Stanbic IBTC Adopt-a-School programme
(which involves the overhaul and restoration of schools across the
country). We also undertook the development and commissioning
of the Stanbic IBTC Sickle Cell Library, whereby the facilities of
a world class library are now in place to aid research into the Sickle
Cell scourge. In general, we intensified our support for various
social causes which offer value to the communities in which
we operate. 
As an important local bank, our CSR initiatives hope to streamline
all these efforts with a view to enhancing our ability to take
development even further amongst our people, and in so doing,
contributing towards creating an enabling environment for more
rapid economic growth. The social capital generated from this
has assisted greatly in Stanbic IBTC Bank in the forefront of
the new consciousness towards doing business responsibly
in Nigeria.
Overall, we are pleased with the way our business has shaped
up during the course of 2010. However, on account of recent
initiatives by the Central Bank of Nigeria to “ring fence” the
business of investment banking from consumer banking, we
expect to restructure our group operations along Holding
Company lines and so we expect the bank, Stanbic IBTC
Pensions, Stanbic IBTC Stockbrokers and other current
subsidiaries of the bank to all operate as direct subsidiaries of a
Stanbic IBTC Holding Company. Appropriate announcements will
be made before these changes take place and necessary proposals
in this regard will eventually be tabled before shareholders.
On behalf of the board of directors, I would like to thank all
those who have contributed in one way or the other towards the
success of our business in 2010. These include our clients, staff,
regulators, suppliers, host communities, shareholders etc. It is
my sincere hope that we can continue to count on your support
in the years ahead.
Having made adequate provisions on delinquent facilities in prior
years, the group was able to achieve substantial recoveries on
some of these accounts and this resulted in a 87% reduction in
net credit impairment charge, with the amount reducing from
N4.9 billion in 2009 to N0.6 billion in 2010.
Overall, group profit before tax increased by 31% from N10.3
billion in 2009 to N13.5 billion in 2010.
 
Balance sheet
The group’s total assets increased by 13% from N340.5 billion as
at 31 December 2009 to N384.5 billion as at 31 December 2010
due largely to a strong growth in loans and advances. In response
to the lower interest rates on the money market and fixed rate
instruments, the group focused on responsibly growing its lending
book i.e. by concentrating its efforts on quality exposures. The
gross risk asset portfolio increased by 41% from N133.1 billion
to N187.1 billion.  
Total liabilities recorded an increase of 16% from N259.0 billion in
2009 to N299.4 billion in 2010 largely driven by the increase
in deposits.
In line with its comprehensive risk management framework,
the group continues to conservatively provide for its loans and
advances portfolio. Substantial recoveries were however made
on the significant portions of previously provisioned accounts
and this resulted in the reduction in non-performing loans. As at
31 December 2010, non-performing loans amounted to N14.2
billion, representing 7.6% of total advances in comparison to
N18.8 billion and 14.1% respectively in the prior year.  
Shareholders’ funds grew by 4% to N83.8 billion as at 31
December 2010. The change in shareholders’ funds represents
the undistributed portion of the current year’s profits. Having
regard to all of the foregoing, your directors are pleased to
recommend a dividend payout of 39 kobo per ordinary share of
50 kobo amounting to N7.3 billion, which is 30% higher than the
30 kobo per share paid in the prior year.
General
Since our last AGM, Dr Alewyn Burger, Mallam Ahmed Dasuki,
Dr Christopher Kolade CON, Mr Bhagwan Mahtani and Sam
Unuigbe have all resigned from the Board.
In accordance with Article 81 of the bank’s Memorandum and
Articles of Association, four directors - Mr. Moses Adedoyin,
Mrs Ifeoma Esiri, Ms Marna Roets and myself are retiring today
Atedo N A Peterside (OON)
Chairman
Chairman’s statement
Businessreview
Stanbic IBTC Bank PLC Annual Report 2010
Businessreview
14
15
Chris Newson
Chief executive officer
2010 will be remembered as challenging for
the Nigerian banking sector and Nigeria as
a whole.
“Given this environment, we deem the results of the group to
be positive. Our capital and liquidity positions remain robust,
as indicated by the confirmation of our Fitch AAA (nga) rating.
In summary, on the back of our growth strategy we achieved
a strong network expansion, good balance sheet growth and
a loan and advances growth well in excess of the industry.”
Chief executive’s review
16
Overview
As the year unfolded there emerged a significant amount of
political uncertainty, given the ailing health of the late president
and upcoming elections, a global economy (particularly the
developed countries) that continued to struggle to emerge from
recession and on-going reform in the banking sector. The Nigerian
economy however continued to reflect strong (in worldwide
terms) GDP growth averaging 7.85% which was driven by both
oil and non-oil sectors (agriculture, telecoms, construction).
An improving oil price and production levels meant that Nigeria
managed to achieve a strong current account surplus, which did
not however translate into a growth in gross reserves. On the
contrary, national reserves continued to fall, ending the year
some $11 billion below where they had opened. Although, at
over $32 billion, these reserve levels remain credible and strong
when compared to levels of import cover. In addition, the almost
complete depletion of the excess crude account and the high
growth in public sector borrowing (+59%) all indicate the strong
expansionary policies employed by the Federal Government.
Of particular impact on the banking industry was the high level of
market liquidity maintained by the CBN for most of the calendar
year. Such excess liquidity, along with the ongoing CBN interbank
guarantee, resulted in interest rates reducing dramatically from
December 2009 levels and turn negative in real terms. However,
the excess liquidity in the system did not immediately translate
into sustained credit growth to the private sector which actually
was negative for the first 7 months of 2010. During this period,
the majority of the banking sector tended to place their liquidity
in “safe havens”, while focusing on their risk asset portfolios
and in some cases awaiting the implementation of AMCON. As a
consequence of this prevailing “risk averseness”, competition for
better quality assets became very high. The beneficiaries of this
were undoubtedly the better quality counterparties who enjoyed
considerably lower rates than in 2009. On the back of the CBN’s
intervention, the last quarter of 2010 did however see a part
reversal of some of these trends with reduced levels of liquidity
and a general increase in the interest rate environment. It is also
notable that credit growth to the private sector did turn positive
in the latter few months of the year, thereby achieving an annual
positive growth of around 6%.
There were fears expressed that the expansionary nature of
monetary and fiscal policies would translate into significant
inflationary pressures. However, this was not the case;
significantly due to the limited credit extension growth (i.e. a
low money multiplier effect) which saw inflation ending the year
up on 2009 but not significantly so.
The capital markets performance was varied with periods of
strong recovery generally followed by some pull back on profit
taking. The market did however consolidate to achieve a net gain
of 18.5% for 2010 although average daily activity declined from
414.7 million shares in 2009 to 377.9 million shares in 2010.
One of the positive features of the markets recovery was the
increase in foreign portfolio investment which saw net inflows of
some N381 billion (USD2.5 billion) against N215 billion (USD1.4
billion) in 2009.
Given this environment, we deem the results of the group to
be positive. Our capital and liquidity positions remain robust,
as indicated by the confirmation of our Fitch AAA (nga) rating.
In summary, on the back of our growth strategy we achieved a
strong network expansion, good balance sheet growth and a loan
and advances growth well in excess of the industry. We remain
confident that our risk management approach is appropriate and
should ensure the sustainability of such growth.
Average customer deposits grew a healthy 39%, which also
reflects good growth in the level of current account balances, an
important indicator of the success in delivering the expansion of
our physical network and growth in the number of transactional
banking relationships. The reports will also reflect the strong
performances delivered by a number of our capital markets and
advisory businesses.
The group continued its investment drive in 2010 and showed
some considerable progress in this regard. As mentioned, the
delivery of an expanded physical infrastructure was very pleasing
with the group now having a network of 141 branches spread
throughout Nigeria. In addition, our ATM network has also
expanded to 200 ATM’s. The critical project to move our core
banking platform from Equinox to Finacle is currently on track
and should see us “go live” in the 3rd quarter of 2011. As may
be expected, all this investment has resulted in the continued
increase in our cost base.
In a year that proved challenging from a revenue generation
perspective, the above has inevitably seen our cost to income
ratio rise to our upper target level and is a key area of focus for
the management team. There is clearly a need to balance future
growth with sustainability.
Businessreview
Stanbic IBTC Bank PLC Annual Report 2010
17
We are grateful that as an indicator of some key successes, 2010
saw Stanbic IBTC again receiving a number of accolades and
awards, being:
•	 Global Finance Awards for best Sub Custodian , 2010
•	 Best Investment Bank in Nigeria, Euromoney, 2010
•	 Best Brokerage House, EMEA Finance, 2010
•	 Best Investment Bank, EMEA Finance, 2010
•	 Best Issuing House in Africa, Africa Bankers Award, 2010
•	 Best Custodian in Nigeria, Global Custodian 2010 Emerging
	 Markets Award
•	 Stockbroker of the Year Award - Finance Monthly Magazine
•	 Physiotherapy Disabled Friendly Award, 2010 Nigeria
	 Society of Physiotherapy
•	 2010 ADVAN Award for Marketing Excellence - “Campaign
	 of the year - Radio”
•	 ACQ Global Award 2010 for Bank of the Year in Africa
A very big thank you to all our customers and staff, without whom
none of the above would have been possible.
Stanbic IBTC’s core business units (Corporate  Investment
Banking, Personal  Business Banking and Wealth) are all
committed to the principle that the customer needs to be at
the centre of everything we do. We believe that our long term
success will be entirely reliant on our ability to understand those
customer needs and the environment they operate in, while
working seamlessly as a team across business units to serve
them. This not only requires good “knowledge management”
but significantly requires having the right people. Stanbic IBTC
continues to invest in both.
A key aspect of teamwork is our ability to leverage off our
parentage, that being the Standard Bank Group. Senior
management within Stanbic IBTC operate under a matrix
reporting system designed to ensure maximum congruency of
customers and product strategies, leverage off expertise and
capabilities across all geographies that Standard Bank operates in
and to ensure maximum exposure of our staff to “best practice”
and career advancement. In particular, given that Industrial and
Commercial Bank of China has a 20% strategic shareholding in
our parent the Standard Bank Group, we deem ourselves to be
uniquely placed to support China/Nigeria activities and believe
this holds significant opportunities for ourselves.
The events of 2009/10 within the Nigerian Banking sector
brought home many lessons, the most critical being the
importance of corporate governance and the need for a very
robust risk management approach. As a response thereto, during
the course of 2010 the Central Bank of Nigeria brought out a
number of new and proposed regulations. Stanbic IBTC remains
totally committed to all aspects of corporate governance and
risk management and continues to strive to position itself at the
forefront of these principles in Nigeria.
One of the key pieces of regulation that was released is the repeal
of the current universal banking model. Given that Stanbic IBTC
currently operates as a full universal banking group and wishes to
continue as such, it is our intention to comply therewith through
a Holding Company structure.
We believe effectively communicating with all our stakeholders
is a critical aspect of building and managing the Stanbic IBTC
brand. We have continued to invest in our capacity in this regard.
I wish to say a big Thank You to all of those who have assisted
in making 2010 a reality. I would particularly once again wish
to thank our shareholders, customers, staff, the Executive team
(especially my deputy Mrs. Sola David-Borha), the chairman (Mr.
Atedo Peterside) and the rest of the board for their commitment,
contribution and invaluable support.
Due to a number of factors, 2011 is likely to also be a challenging
year for most Nigerians. The successful conclusion of the general
elections in April 2011 will be critical in setting the base for
possible growth acceleration in the rest of 2011. December
2010 saw the implementation of the first phase of AMCON’s
activities, which is certainly a positive step forward, however it
is probably important to also recognize that it is only a part of
the process to the ultimate sustainable reform of the sector. The
present government has committed itself to addressing certain
of Nigeria’s significant infrastructure deficiencies, particularly
power. It is our sincere hope that momentum is not lost in this
regard as we believe success herein will be a major catalyst for
growth in the future.
With Nigeria having an estimated GDP growth for 2011 of 7%,
which again should exceed global growth estimates, we look
forward to a successful and rewarding year for all.
chris newson
Chief executive officer
Chief executive’s review
BusinessreviewBusinessreview
Stanbic IBTC Bank PLC Annual Report 2010 18
19
Economic review
Global economic environment
The global economy continued to recover in 2010 as output
expanded 4.8%, following a contraction of 0.6% in 2009,
primarily driven by emerging and developing countries. Although
growth also rebounded in advanced economies, there have been
concerns over the still sluggish macroeconomic metrics in the US
and the budget position of the Eurozone which ultimately forced
several governments to introduce drastic fiscal consolidation
programs. That said, a double-dip scenario did not materialise and
policy makers in key developed countries remained determined to
make the necessary de-leveraging process as smooth as possible.
Overall, monetary stimulus was still on the agenda, supporting
the substantial improvement in global risk appetite and leading
to a rally in commodities. Indeed, the oil price closed the year at
US$96.4/barrel from US$79.2/barrel in early 2010.
Economic growth
Nigeria’s real economy showed some improvement with GDP
growing by 7.36% in the first quarter of the year, 7.69% in
the second quarter, 7.86% in the third quarter and expected
8.29% in the last quarter. This would translate into an average
growth rate of 7.85% in 2010, from 6.96% in 2009. Although
agriculture was still the dominant sector in terms of contribution
to GDP (39.0% in half year 2010), the fastest growth rates
were recorded in the telecoms (33.7%), hotels and restaurants
(12.1%) and construction sectors (12.0%). However, the Finance
and insurance sector lagged aggregate growth, expanding
by only 4.3%, which partially reflected the systemic issues in
the banking system. In this context, the Asset Management
Corporation of Nigeria (AMCON)’s initial launch in late 2010
was generally perceived as a positive step forward in addressing
the meltdown in the financial sector and erasing the banks’ non
performing loans.
Increasing oil prices and the Nigerian economy
The increasing crude oil price was positive for Nigeria’s external
metrics as it implied relatively robust trade and to a lesser extent,
current account surpluses (5.2%/GDP in the first three quarters
of 2010), supported by the rebound in oil production associated
with the amnesty programme in the Niger Delta region. In this
regard, crude oil output averaged 2.05 mbpd in 2010, from
1.84 mbpd in 2009. Nevertheless, foreign reserves continued
to consistently slide, reaching US$32.3bn by end December
2010, from USD42.4bn in January 2010. This reflected the
sizeable monetization of the excess crude account on the back of
countercyclical fiscal policies, but also episodic spikes in demand
for dollars amid weak naira confidence and substantially negative
interest rates. Still, on the upside, the import cover ratio of 13.8
months was still the third highest in Sub-Sahara Africa after
those of Botswana and the Republic of Congo.
Exchange rate and interest rate dynamics
The naira came under pressure in September 2010 as a result of
increased corporate, but also liquidity-driven, demand for dollars.
Consequently, the Central Bank of Nigeria (CBN) reacted by
hiking the standing deposit facility by 325 basis points between
late September and November to 4.25% (and the MPR by 25
0.0
2.5
5.0
10.0
7.5
20
35
50
80
USDbn USDbn
65
Dec’07 Dec’08 Dec’09 Dec’10
Oil earnings per month (LHS) FX researves (RHS)
Stanbic IBTC Bank PLC Annual Report 2010 20
Businessreview
basis points to 6.25%) in order to tighten liquidity and preserve
exchange rate stability. The sharp rebound in money market and
treasury bill rates in last quarter of 2010 was the product of
this policy shift: 90-day NIBOR jumped to a range of 12-15% in
fourth quarter 2010 from a low of around 6% in early September,
while the 91-day Treasury-bill rate spiked to around 7.6% in the
primary market in late 2010, from lows of 2% in first quarter
of the year. This effectively ended the era of cheap money in
Nigeria. While long-dated bond yields had started to rebound
in late first half of the year, this trend accelerated in the second
half of 2010 as the Debt Management Office (DMO)’s issuance
surged to record high levels. Consequently, the yield on the 20-
year bond reached 14.5% in last quarter of 2010 in the primary
market, from lows of 7.0% in second quarter. However, the
DMO gradually cut the size of domestic borrowing in November
and December to prevent an unsustainable rise in the cost of
funding, supporting a stabilisation and marginal rally in bonds
yields by year-end. Average inflation rose to 13.7% year-on-year
(YoY) in 2010, from 12.5% (YoY) in 2009, but the decline in
consumer prices to 12.8% (YoY ) in November and 11.8% (YoY)
in December ultimately contributed to the drop in long-dated
yields. Also, it became increasingly obvious that the substantial
fiscal expansion over the past two years had been offset by a
weak money multiplier and failed to translate into sizeable core
inflationary pressures. Besides, food prices still continued to
drive the revised CPI basket, in which they account for 50.7%,
from a previous 63.8%: food inflation stood at 14.8% (YoY) in
2010 as against 12.4% (YoY) for non-food inflation.
were keen to tackle the issue of bad loans in the banking system.
Furthermore, the upward trend in long-dated bond yields in the
second half 2010 attracted foreign fixed income investors into
the debt market for the first time since 2008.
Nigerian policy environment
Several policy avenues came to the fore in 2010 in addition
to the exchange rate and interest rate interaction mentioned
above. First, the CBN and policy-makers focused on the revival
of the banking system by setting up AMCON and improving
the regulatory framework in the financial system. AMCON
officials indicated by year-end that they would soak up nearly
N2.5 trillion of bad debts, of which margin loans represented an
estimated 40% to 50%, by issuing zero-coupon bonds in early
2011, and non-tradeable consideration bonds in the meantime.
AMCON’s success, and potential mergers  acquisitions in the
sector, become also critical factors to boost private sector
lending which contracted by 4.9% (YoY) in 2010. Private sector
credit growth began to rebound in the second half of 2010 and
was positive for four consecutive months as of November 2010,
but collapsed in December as the toxic assets brought back by
AMCON were written-off. Meanwhile, public sector credit surged
to record high levels, with its growth rate reaching 67.8% (YoY)
in December. Second, the government pushed for the adoption
of the Petroleum Industry Bill in parliament, as it sought to
increase the participation of local companies in the oil industry
and improve the efficiency and solvency of the Nigeria National
Petroleum Company (among other issues). The administration
also unveiled a comprehensive program to address chronic power
shortages, including the privatisation of the Power Holding
Company of Nigeria and incremental private sector involvement
in the industry. Power generation had fluctuated between
2,000 megawatt and 3,000 megawatt in 2010, well below the
government’s target of 6,000 megawatt, and this translated into
significant price pressures in the manufacturing sector, and the
economy as a whole.
Summary
Official figures suggest economic growth remained robust and
broad-based; yet a turnaround in private sector credit has yet to
materialise and reverse a previous downturn driven by the margin-
lending crisis. Although the first quarter was associated with
increased institutional uncertainty, the smooth political transition
in 2010, coupled with the initiation of key reforms, paved the way
for a structural transformation of the Nigerian economy in the
coming years and its emergence as a core geopolitical force in
Sub-Sahara Africa and the emerging-market space.
Impact of international capital flows
While the actual data of international capital inflows into Nigeria
is yet to be released, foreign portfolio investments into the
Nigerian Stock Exchange (NSE) stood at N381 billion in 2010
compared to N215 billion in 2009. The Nigerian Stock Exchange
gained 18.5% in 2010, driven by both international and domestic
investors, especially as it became evident that policy-makers
0
5
10
25
20
15
Jan’07 Jan’08 Jan’09 Jan’10
Headline inflation Food inflation 90- day NIBOR MPR
%
21
Financial review
Overview of financial results
Despite the unprecedented lull in the economy following the slow
and gradual recovery from the shocks of the global meltdown
in the previous years, the group was able to post a good result
for the year. The group commenced the year operating in a
market characterized by excess liquidity, dwindling margins and
cautiously recovering equity markets.
The diversified nature of the group’s business helped in
achieving the good performance for the year and this was driven
by income from new advisory mandates, increased transactional
volumes and asset under management and a gradually recovering
capital market.
Highlights of the 2010 results reflect increased customer
confidence as evidenced by the growth in deposit liabilities as
customers sought for flight to safety following the financial
sector reforms and a responsible approach to asset growth in line
with the group’s comprehensive risk management framework.
Having made adequate provisions on delinquent facilities in
prior years, the group was able to recover on some delinquent
accounts and this resulted in 87% reduction in net credit
impairment charge, with the amount reducing from N4.9 billion
in 2009 to N0.6 billion in 2010. While total income before credit
impairments grew by 10%, income after credit impairments was
up by 23%. The group participated in the sale of toxic assets
to Asset Management Corporation of Nigeria (AMCON) to the
tune of N14 million. The sale had an insignificant impact on the
reduction of credit impairment charges.
Profit after tax increased by 16%, from N8.1 billion in 2009
to N9.5 billion due to increase in fees and commissions and
improved quality of the risk asset book.
Return on equity for the group improved from 12.8% in 2009
to 16.5% in 2010 as a result of improved earnings and fruitful
recovery efforts.
0
10,000
20,000
30,000
40,000
50,000
60,000
70,000
80,000
90,000
Dec’07 Dec’08 Dec’09 Dec’10
0%
5%
10%
15%
20%
25%
ROaE (PAT)
Shareholders’ funds (average)
ROaE (PBT)
Nmillion
Return on average equity
2010 2009
Return on average equity (pre tax) 16.5% 12.8%
Return on average equity (post tax) 10.7% 9.5%
Stanbic IBTC Bank PLC Annual Report 2010 22
Businessreview
Notwithstanding the lull in the economy and regulatory induced
rationalisation in the banking industry, the group continues to
grow its points of represenation by opening additional branches
within the country in order to improve service and product
delivery. The number of representations doubled from 70 in
2009 to 141 in 2010 and we expect that this trend will continue
in 2011.
Economic factors impacting the results
Global economic activity slowed its rebound momentum
towards the end of 2010, due to uncertainty surrounding the
sustainability of growth, especially in the world’s three biggest
financial markets – Europe, United States and China. Sovereign
debt default concerns and policy responses in Europe, a mix of
disappointing job and housing market data in the US and the
tightening of monetary policy (credit growth) by China to cool
its over-heated property market raised fears that global GDP
growth may continue to stall. The sovereign debt default crisis
has prompted fears of a double-dip recession, with negative
implications for manufacturing activities, commodities prices, as
well as the entire global financial system.
Meanwhile, the World Bank expects growth in developing and
emerging countries to support the rebound from the current
sluggish global economic recovery. It also expects developing
countries to account for one-half of global GDP growth in the
years ahead. Real GDP data at the respective country levels
have been relatively volatile, reflecting large fluctuations in net
exports tied to a sharp deceleration in world trade growth.
For the country, security concerns were a major issue during
2010 especially the issue of the Niger Delta crisis, but with the
completion of the Amnesty program, crude oil production rose
and averaged 2.1 mbpd from 1.8 mbpd in 2009.
The Central Bank (CBN) had embarked on quantitative monetary
policy since late 2009, which involved injecting liquidity into the
market to ease the credit squeeze induced by the global financial
crisis. The CBN in the third quarter of 2010 increased the standing
deposit facility by 325 basis points between late September and
November to 4.25% (and the MPR by 25 basis points to 6.25%)
in order to tighten liquidity and preserve exchange rate stability
and also make placement by banks with the CBN unattractive,
therefore forcing the creation of new risk assets, especially
towards the real sector. This action precipitated an immediate
reduction in interbank rates across varying maturities.
Interest rates, treasury bill rates and savings deposit rates
decreased to record lows and remained so for most of the early
Performance indicator 2010 2009
Total income growth 10% 3%
Credit impairment charges growth (87%) (3%)
Profit before tax growth 31% (29%)
Gross loans and advances growth 41% 18%
Deposit growth 10% 78%
Capital adequacy 32.6% 36.8%
Net interest margin 6.9% 7.4%
Return on average equity (pre-tax) 16.5% 12.8%
Return on average assets (pre-tax) 3.7% 3.0%
Earnings per share 50k 43k
Price to book (times) 2.0 1.7
Long term Fitch rating AAA(nga) AAA(nga)
Profit and loss analysis
Net interest income
Net interest income grew by 5% to N26.4 billion on the back
of strong growth in loan book and decrease in interest paid on
deposits, which were more than enough to douse the impact
of the reduction in lending rates and low yields in investment
securities. While interest income decreased from N40.9 billion
in 2009 to N34.4 billion as a result of decline in market interest
rates, the group was able to reduce its interest expense by
49%, from N15.8 billion to N8.0 billion through a proactive
restructuring of the funding base and replacement of expensive
deposits with cheaper funding in line with market opportunities.
Total assets increased by 13% to N384.5 billion. Consequently,
the net interest margin decreased from 7.4% recorded in prior
year to 6.9%.
Personal and business banking year on year net interest income
decreased by 4% from N8.1 billion in 2009 to N7.7 billion in
2010 due to negative endowment as interest rates declined.
Corporate and investment banking net interest income increased
by 12% from N16.1 billion in 2009 to N18.1 billion in 2010 chiefly
due to the significant 54% reduction in interest expenses as a
result of lower funding cost and a positive change in deposit mix.
part of the year thereby leading to the reduction in income from
interest yielding investment opportunities.
Key financial highlights
23
Credit loss ratioCredit impairment charge on NPLs
Credit impairment charge on PLs
(2,000)
Dec’07 Dec’08 Dec’09 Dec’10
5,000
4,000
3,000
2,000
1,000
0
3%
4%
5%
2%
1%
0%
(1,000)
1,681
362
4,607
413
4,504
354
(835)
1,455
Nmillion
2010
Nmillion
2009
Nmillion
Change
%
Specific provisions (835) 4,504 (100)
General provisions 1,455 354 100
Total 620 4,858 (87)
The credit impairment charges decreased by 87% resulting from
recoveries on some major accounts which were provisioned in
prior years. This is without prejudice to the group’s robust
risk management processes which demands for a prudent
approach to credit impairments. The substantial recoveries
resulted in the credit loss ratio improving from 3.6% in 2009 to
0.3% in 2010. The group has not modified its provisioning policy
and continues to impair assets using the same principles it used
in previous years inclusive of a general debt provision.
Credit impairment charges
Financial review
Commissions
Fees Other income
Dec’07 Dec’08 Dec’09 Dec’10
6
24
17 19
64 50 57 67
15
15
20
6
22
12
2
Trading revenue
0
20
40
60
80
100
120
%
4
Non-interest revenue
Credit impairment charges and credit loss ratio
Interest income 2010
Nmillion
2009
Nmillion
Change
%
Interest income 34,359 40,920 (16)
Interest expense (7,989) (15,813) (49)
Net interest income 26,370 25,107 5
Non-interest revenue
Net fee and commission revenue increased by 38%, largely due
to new advisory mandates, increased asset under management,
improved transactional volumes and a gradual recovery of the
capital market. However, trading revenue which is largely foreign
exchange based registered a decrease of 36% due to relative
stability of the exchange rate and lesser arbitrage opportunities.
Net fees and commissions accounted for 86% (2009: 73%) of
total non-interest revenue in 2010.
2010
Nmillion
2009
Nmillion
Change
%
Net fee  commission 18,983 13,707 38
Trading income 2,658 4,169 (36)
Other income 383 840 (54)
Total 22,024 18,716 18
Stanbic IBTC Bank PLC Annual Report 2010 24
Businessreview
Operating expenses
The group investment in infrastructure, people and skills
continued in 2010. Despite doubling branch network (and
consequently staff increase of 12%) and increasing the number
of ATMs by 52%, the group was able to contain expense growth
to only 20%. Operating expenses increased to N34.2 billion from
N28.6 billion in 2009. As a function of this, the cost to income
ratio increased from 65.3% in 2009 to 70.8%.
The increase in cost is unexpected given our continued drive to
expand on our points of representation, automate and upgrade
our IT infrastructure and the need to attract quality people.
In addition, in order to improve our service offering and delivery
especially, in the personal and business banking market, the
average staff headcount increased by 12% to 2,248, whilst
number of branches doubled from 70 in 2009 to 141 at the end
of 2010.
2010
Nmillion
2009
Nmillion
Change
%
Staff costs 14,781 13,469 10
Other operating
expenses:
Auditor’s remuneration 135 138 (2)
Communication 534 638 (16)
Depreciation 4,034 2,567 57
Information technology 2,431 1,538 58
Marketing expenses 1,318 1,197 10
Premises 2,764 2,527 9
Training, travel and
accommodation
1,814 1,878 (4)
Others 6,435 4,671 38
Total other operating
expenses
19,465 15,154 12
Total operating
expenses
34,246 28,623 20
Cost-to-income ratio 70.8% 65.3%
Balance sheet analysis
The group’s total assets increased by 13% from N340.5 billion as
at 31 December 2009 to N384.5 billion as at 31 December 2010.
Key balance sheet indicators
2010
Nmillion
2009
Nmillion
Change
%
Loans and advances
to banks
88,659 76,954 15
Net loans and
advances to customers
177,454 119,885 48
Total loans and
advances
266,113 196,839 35
Deposits and current
accounts
186,466 169,200 10
Shareholders’ funds 83,750 80,480 4
Loans and advances
Loans and advances to customers (net), which accounted for
46% (2009: 35%) of total assets, grew by 48% to N177.5
billion. Personal and Business Banking net loans and advances
increased by 105% to N53.6 billion in response to our group’s
retail footprint.
The Corporate and Investment Banking net loans and advances
grew by 32% to N123.9 billion largely due to strong growth in
infrastructural project and structured finance.
The non-performing loans (NPL) declined by 24% to N14.2
billion. The NPL to total loan ratio also improved significantly
to 7.6% (2009: 14.1%), evidencing fruitful recovery efforts
notwithstanding the group’s comprehensive risk management
framework and prudent provisioning policies. The participation
by the group in the sale of a few toxic assets amounting to N14
million to AMCON had no significant impact on the decrease in
non-performing loans. The NPL coverage ratio (excluding the
net present value of security) of 68% was slightly lower than
70% recorded in 2009, while the coverage ratio with security
was 163% in 2010.
25
Financial review
Composition of gross loans and advances
Term loans constitute 51.3% (2009: 43.1% ) of total loans with
home loans increasing to 5.7% from 4.1% in 2009.
Breakdown of loan book
Funding and liquidity
Total deposits and current accounts, which represent 49%
of total liabilities and equity, increased by 10% to N186.5
billion. The growth in deposit liabilities is evidence of increased
customer confidence in the group in a very competitive market,
a consequence of the growing branch footprint. Personal and
Business Banking deposits increased by 10%, while Corporate
and Investment Banking deposits increased by 11%.
Deposits Other liabilities
Borrowings Equity
49%
22%
10%
19%
186,466
0
Dec’07 Dec’08 Dec’09 Dec’10
200,000
Nmillion
160,000
140,000
100,000
60,000
40,000
180,000
120,000
80,000
20,000
71,391
95,262
169,200
14.2
0
120%
100%
80%
60%
40%
20%
200
Nbillion
160
140
100
60
40
0
Dec’07 Dec’08 Dec’09 Dec’10
180
120
80
20 11.2 15.5 18.8
93.1
113.1
133.1
187.1
Gross loans and advances
Non-performing loans
Cumulative provision on NPLs
Gross loans  advances and non performing loans
Funding mix
Deposit liabilities
CAGR (2007-2010):36%
Overdrafts
Home loans
Term loans
Instalment sales (VAF)
35%
6%
51%
8%
Stanbic IBTC Bank PLC Annual Report 2010 26
Businessreview
Capital adequacy
Total shareholders’ funds grew by 4% from N80.5 billion to N83.8
billion, however, the group continued to be very well capitalised.
Tier 1 capital adequacy ratio was 31.4% (2009: 35.8%), while
the total capital adequacy ratio was 32.6% (2009: 36.8%). The
ratio is significantly higher than the regulatory minimum of 10%.
The group’s capital is deemed adequate to support business risks
and contingencies and the growth strategy of the group.
2010
Nmillion
2009
Nmillion
Change
%
Tier I capital 83,657 80,480 4
Tier II capital 3,252 2,177 49
Total qualifying
capital
86,909 82,657 5
Risk weighted assets 266,764 224,614 19
Capital adequacy
Tier I 31.4% 35.8%
Tier II 32.6% 36.8%
Proposed dividend
The board of directors has proposed a dividend of 39 kobo per
share, amounting to N7.3 billion for the 12 months ended 31
December 2010 on the issued share capital of 18.75 billion
ordinary shares, subject to the approval by the shareholders
at the next annual general meeting (AGM). This represents an
increase of 30% over the dividend paid for the period ended 31
December 2009 of 30 kobo per share on the issued share capital
of 18.75 billion ordinary shares amounting to N5.6 billion.
IFRS results
The Standard Bank Group (‘SBG’) reports its results in accordance
with International Financial Reporting Standards (IFRS).
Accordingly the group prepares IFRS results for inclusion in SBG’s
results. Below are extracts of the income statements and balance
sheets for the comparative years 31 December 2009 and 2010
prepared in accordance with IFRS.
The fundamental differences between Nigerian GAAP (NGAAP)
and IFRS are:
•	 NGAAP employs a historical cost convention whereas IFRS
	 employs fair value.
•	 Credit impairments are calculated based on expected losses
	 (a set percentage based on prudential guidelines) instead
	 of the IFRS incurred loss methodology with fair value
	 calculations for security.
•	 Under NGAAP revenue on yield instruments is recognized
	 purely on an accrual basis with no mark to market
	 adjustments.
27
IFRS income statement
Group
2010
Nmillion
Group
2009
Nmillion
Change
%
Interest income 24,342 25,609 (5)
Interest expense 3,895 9,685 (60)
Net interest income 20,447 15,924 28
Non-interest revenue 29,823 28,221 6
Net fee and commission revenue 17,751 13,707 30
Trading revenue 11,689 13,674 (15)
Other revenue 382 840 (54)
Total income 50,270 44,145 14
Credit impairment charges 191 3,956 (95)
Impairments for non-performing loans (2,167) 4,059 (100)
Impairments for performing loans 2,358 (103) (100)
Income after credit impairment charges 50,079 40,189 25
Operating expenses 34,476 29,752 20
Staff costs 15,011 13,598 10
Other operating expenses 19,465 15154 28
Profit before tax 15,603 11,437 36
Financial review
Stanbic IBTC Bank PLC Annual Report 2010 28
Businessreview
IFRS balance sheet
Group
2010
Nmillion
Group
2009
Nmillion
Change
%
Assets
Cash and balances with central banks 10,048 7,772 29
Pledged assets 18,573 16,966 9
Derivative assets 263 188 40
Trading securities 70,886 95,520 (26)
Financial investments 28,936 30,192 (4)
Loans and advances 212,396 153,371 38
Loans and advances to customers 179,105 111,976 60
Loans and advances to banks 33,291 41,395 (20)
Other assets 15,740 14,010 12
Current and deferred taxation 939 594 58
Equity investment in group companies - 1 (100)
Property and equipment 31,252 26,878 16
Total assets 389,033 345,492 13
Equity and liabilities
Equity 89,805 85,012 6
Equity attributable to ordinary shareholders 88,429 83,995 5
Ordinary share capital 9,375 9,375 -
Ordinary share premium 47,469 47,469 -
Reserves 31,585 27,151 16
Minority interest 1,376 1,017 35
Liabilities 299,228 260,480 15
Trading liabilities 50,116 97,448 (49)
Deposit and current accounts 192,350 111,186 73
Deposits and current accounts with customers 186,118 110,931 68
Deposits and current accounts with banks 6,232 255 100
Other liabilities 52,139 47,013 11
Current and deferred tax liabilities 4,623 4,833 (4)
Total equity and liabilities 389,033 345,492 13
29
Executive committee
01 Sola David-Borha
Deputy chief executive officer
02
Marna Roets
Executive director, Business support
03 Yinka Sanni
Deputy chief executive officer
04 Jacques Troost
Executive director,
Personal  business banking
05 06
Chris Newson
Chief executive officer
Angela Omo-Dare
Company secretary and head, legal
04 05 06
01 02 03
Stanbic IBTC Bank PLC Annual Report 2010 30
Otherinformation
10 11 12Ronald Pfende
Chief financial officer
Demola Sogunle
Head, group risk
Kayode Solola
Head,
Corporate  investment banking
10 11 12
Obinnia Abajue
Acting CEO, Stanbic IBTC Pension
Managers Limited
07 Kandolo Kasongo
Head, credit
08 Isioma Ogodazi
Head, human resources
09
07 08 09
31
Net commissions and fees
N4,545 million
2009: N2, 636 million
Total Income
N12,236 million
2009: N11,318 million
Deposits
N82,244 million
2009: N75,014 million
Loans and advances (net)
N53,560 million
2009: N26,150 million
Personal  Business Banking
What we offer
We provide financial solutions to personal and business customers by offering the correct
range of products and services at competitive pricing through the correctly placed and cost
effective channels. Channels include the branches, ATM network, internet and telephone
banking. Products include overdrafts, medium term loan, mortgage loans, vehicle and
asset finance, credit cards, trade finance and a variety of savings and investment products.
2010 highlights
•	 Gross loans and advances increased by 93% to N57.3 billion
•	 Savings accounts balances increase by 60% to N9.4 billion
•	 Current accounts balances up 25% to N49.7 billion
•	 Branch network rose 101% to 141
•	 ATM footprint increased by 52% to 200
•	 Customer based increased by 30% to about 600,000
•	 Cash withdrawals at ATMs increased by 62% to N28.1 billion
•	 Significant improvement in deposit mix. Stable and lower priced deposits accounted for 72%
	 (2009: 61%) of total PBB deposit
•	 Volume of transactions on ATMs increased by 51% to 80.6 million
2011 priorities
•	 Continue to grow branch and ATM networks
•	 Continue to grow customer base in all segments of the market
•	 Continue to responsibly grow loans and advances
•	 Continue to grow liability base with special focus on current and savings account balances
•	 Focus to responsibly grow Agricultural business
•	 Continue to improve on service quality as a key market differentiator
•	 Continue to focus on cost containment and operational efficiencies
•	 Focus on continuous improvement of the quality of PBB leadership and staff
•	 Sweating the “investment” in PBB business
•	 Focus on internal credit and risk management processes and systems
Personal banking Business banking
61%
39%
Revenue by business unit
Stanbic IBTC Bank PLC Annual Report 2010 32
Businessreview
Overview
Since the strategic decision in 2008 to reduce exposure to
margin facilities, focus was placed on rebuilding the PBB
asset book. With continuous focus on reviewing the PBB asset
products portfolio and the risk appetite supported by effective
credit approval processes, the business unit grew its asset book
at 93%.
Having a low risk assets to liabilities ratio, less emphasis was
placed on growing the liabilities base and more focus was placed
on reducing the cost of interest expenses by replacing more
expensive term liabilities with lower priced short term liabilities.
As a result, the deposit mix (i.e ratio of low cost deposits (savings
and current accounts) to total deposits) improved to 72% from
61% recorded in 2009.
We continued the journey to establish a profitable and long
term sustainable retail business in Nigeria by focusing on both
the Business and Personal markets. We continued to grow our
physical and electronic channel presence in Nigeria. At the end
of 2010, our branch and ATM networks have grown to 141 and
200 respectively.
This increase in footprint is supported by the continuous on-
boarding of clients and profitability of such clients is ensured by
the delivering of a range of products and services to the client
base, which are aligned to their needs and requirements.
To ensure improved efficiency, continuous focus has been placed
towards the productivity of our staff and improved processes and
service delivery.
To ensure client loyalty in a very competitive market, ongoing
focus is to foster good long term relationships with our clients
through the delivery of positive client experiences by recruiting
the right quality of staff, ensuring they have adequate skills and
motivated by team leaders to add value through the provision of
offering financial solutions and unsurpassable service levels.
Strategy
Expanding our reach
During 2010, we continued to grow our footprint and we now
have representation in all of the States in Nigeria. We also
followed the same approach regarding our ATM network while the
internet platform was upgraded to offer additional functionality.
Improving the customer experience
With close to a hundred percent of our branch network both
being upgraded or brand new, as well as having ATMs deployed
at all the branches; client experience levels have improved while
at the same time we are in closer reach to our client base.
A fast growing branch network comes with a new and young
workforce and much time and resources have been deployed to
ensure that they are adequately trained and developed. Various
leadership interventions were also arranged to ensure that
the workforce are well motivated and focus on positive client
interventions.
To further improve service levels, a fully integrated call centre,
which has the ability to handle both inbound and outbound
calls, was established to deliver client enquiry and complaints
management processes.
Containing cost
The PBB business is in an expanding phase but it remains
important to manage costs effectively and continued focus
is being placed on the productivity levels of our workforce
together with the improvement of processes and procedures and
the centralization of certain functions whilst at the same time
focusing on increasing transactional activities and revenues.
Financial performance
2010
Nmillion
2009
Nmillion
Growth
%
Total Income 12,236 11,318 8
Staff costs 6,124 4,572 34
Other operating
expenses
6,408 4,582 40
Provision for risk assets 1,133 1,038 9
Tax provision (429) 304 (100)
Profit after tax (1,000) 882 (100)
Deposits 82,224 75,014 10
Gross loans  advances 57,335 29,721 93
Looking ahead
We intend to continue growing our market share and share of
clients’ wallets during 2011. To achieve this, we will continue
to invest in the branch and ATM networks as well as continue to
expand our portfolio of products and services.
In 2011, we will be moving to a new core banking platform, which
should assist us in our aspirations to further grow our market
share, improve our service delivery and at the same time reduce
our overall cost of delivery.
33
Case study
BT Technologies Limited
BT Technologies Limited – Incorporated
on the 5th of September 2001 with 100%
Nigeria ownership, the firm is a fast growing
truly Nigerian firm with speciality in
telecommunication infrastructure.
Stanbic IBTC Bank PLC Annual Report 2010 34
Businessreview
The company has over 250 employees and has developed
core competencies locally in the maintenance of fibre optic
networks, structured cabling  External Line Plant provisioning
(ELP), networking of optic fibre and survey and design of
optic fibre networks. From a humbling beginning as an IT
training firm, the company has evolved into a major telecom
infrastructure firm providing specialised services to some of the
largest Telecom service providers in Nigeria including Multilinks,
Airtel, Glo and MTN.
The programme
To meet the growing expansion in its network, Multilinks awarded
BT Technologies Limited a N2.04 billion contract which entails
providing fibre optic infrastructure (ELP) across 650 km of road
covering six states in the south east and south south regions of
the country.
Financing
Stanbic IBTC granted a N415 million facility in the form of a
project finance facility to enable BT Technologies to take delivery
of fibre optic cable, execute civil works and deliver the telecom
infrastructure within the time frame of the project. The facility
has since been paid down and over 97% of the job delivered as
at end December 2010.
The market
The advent of GSM has ushered in an era of massive infrastructural
development in telephony and telecommunication operations in
the country, with a subscriber base exploding to over 57 million
in 2010. The exponential growth in subscriber base is putting
lots of pressure on telecommunication infrastructure. This gap is
what truly Nigerian firms like BT Technologies have exploited to
build core competences and expertise employing and up skilling
over 250 Nigerians, majority of them engineers, to meet the
challenges of GSM network operators.
The company has demonstrated a reputation for timely delivery,
competence, reliability and use of appropriate technology to
service delivery to the market place.
The company has demonstrated a reputation for timely delivery,
competence, reliability and use of appropriate technology in service
delivery to the market place.
35
Case study
Don-P Communications Ltd
Don-P Communications Ltd (“Don-P”) with
headquarters in Abuja was incorporated in April
2003. The company is primarily into wholesale
marketing of GSM telecommunication recharge
cards as well as mobile phones and accessories.
They are the leading key dealer and trade
partner to all the major telecommunication
network providers in Nigeria, namely; MTN,
Airtel, Glomobile, Multilinks, Starcomms
and Visafone. The emergence of Don-P
Communication Ltd as a formidable GSM dealer
was predicated by the huge opportunities
offered by the telecom industry following
the first GSM license issued in 2001 by the
Nigeria Government.
Stanbic IBTC Bank PLC Annual Report 2010 36
Businessreview
The programme
For easy and effective distribution, the telecommunication
network providers partner with major telecoms dealers like
Don-P Ltd to retail their products through their established
marketing channels.
In their stride to fully harness the evolving opportunities and
market network expansion to various states of the federation,
the dire need for steady working capital for the purchase of GSM
stock to meet the increasing demand by their teeming customers
became evident.
Financing
Stanbic IBTC financed their business with a total of N2.8 billion
in the form of an overdraft, term loans and bank guarantees. This
enabled Don-P to expand their market to Lagos, while growing
their distribution network in Abuja, Jos and Enugu.
The market
Nigeria is the fastest growing telecoms market in the world.
The teledensity has increased from 0.4% in 2001 to 40% i.e 57
million subscribers in 2010. Don-P as a company controls over 6%
of the MTN market share in GSM recharge cards and accessories
marketed in Nigeria. This is through their established channels
in specific regions. The company is also an active partner in the
distribution of GSM recharge cards for other notable networks
such as Glo and Airtel etc.
With the support of Stanbic IBTC Bank, Don-P has won several
awards over the years including;
•	 Drummer Award = MTN, Zain, Glo
•	 Best Dealer, Abuja Region = Glo
•	 Best Dealer Award Scholarship= Visafone, MTN
37
The CIB team has shown resilience in the face of the challenging banking environment witnessed during the year. The persistent excess
liquidity in the system coupled with the on-going banking reforms made the banking terrain unusually challenging. Nonetheless, our
corporate  investment business passed the test credibly, deploying its various products in Global Markets (GM), Investment Banking
(IB) and Transactional Products and Services (TPS) to the delight of our various customers and recording growth in many of its
performance indices in 2010.
Net commission and fees
N6,526 million
2009: N5,467 million
Total income
N27,487 million
2009:N25,586 million
Deposits
N104,222 million
2009: N94,186 million
Loans and advances (net)
N123,894 million
2009: N93,735 million
Global markets Transactional
products and services
Investment banking
33%
38%
29%
What we offer
Corporate and Investment Banking (CIB) is the wholesale banking arm of Stanbic IBTC Bank
PLC. We provide innovative investment and financing solutions to large local and multinational
corporates, as well as to institutional and public sector clients in strategic sectors of the economy.
We are appropriately positioned to meet our clients’ varying needs both within Nigeria and
across the border as a result of a combination of our industry expertise, cross-border linkages
with Standard Bank’s Global CIB team, a very strong balance sheet, our team of highly skilled
and experienced professionals, and a strong and well respected brand in the Nigerian market.
2010 highlights
•	 Restructured the trade finance business and process to enable greater participation in this
	 market segment.
•	 Maintained market leadership in project finance investment banking and global market
	 businesses.
•	 Intensified our Chinese Corporates focus, with a view to leveraging Standard Bank’s strategic
	 partnership with the Industrial  Commercial Bank of China (ICBC)
•	 Intensified the lengthening of the tenor of loan book by a deliberate focus on medium to long
	 term tenured risk assets.
•	 Successfully defended and grew the asset book by 26% during the year versus a low single
	 digit growth recorded by the banking industry.
•	 Maintained our dominance of the secondary equity stock market with a market share in excess
	 of 30% during the period.
•	 Grew holdings under custody by 44% to N525 billion.
•	 Refocused the relationship management team to create an Investment Banking Coverage team
	 and a Corporate Banking Coverage team. The former team is devoted to creating and
	 facilitating strategic opportunities for identified large corporate clients, including those of
	 cross border nature by leveraging on Standard Bank’s Global/Emerging Market footprint
	 while the latter focuses on identifying, recruiting and “selling” our bank and all its product
	 offerings to corporate clients in identified sectors of the economy.
•	 Set up a carbon trading desk
Corporate  Investment Banking
Revenue by business unit
Stanbic IBTC Bank PLC Annual Report 2010 38
BusinessreviewBusinessreview
Stanbic IBTC Bank PLC Annual Report 2010
Overview
We carried out some internal restructuring during the year, to
improve efficiency and the performance of each of the product
houses within CIB. The Investment Banking Coverage team was
carved out of the subsisting Coverage team to focus on those
large corporate entities that require cross-border linkages. In
addition, the sales team in TPS business was combined with the
Corporate Banking Coverage team to provide clearer focus on
clients and internal efficiency. This has enabled us to have a
holistic view of the client and provide value-adding services to
our clients.
The credit process was equally reviewed during the year to
provide a faster throughput time for our credit applications. The
old structure of layering credit application review was disposed of
and a new structure where all the concerned parties are present
in one approval meeting was introduced. This process review has
been partly contributory to the growth of our loan book.
The budding TPS business contributed significantly to CIB’s
position during the year. The coming together of the hitherto
Structure Trade Finance capability within the IB space and the
Trade Services business within TPS to form the new Trade Finance
business within TPS has led to a more concerted effort to grow
trade business. The growth in the bank’s branch network aided
the TPS franchise by increasing our reach and thus increasing the
volume of collections for TPS.
The upgrade of existing cash management applications and
the introduction of new and more robust ones boosted the
performance of the segment. The Investor Services unit within
TPS won the Global Finance Awards for Best Sub-Custodian,
2010, amongst a handful of accolades.
The Global Markets pillar continued its leading role internally as
the highest revenue generating segment as well as externally
by being one of major market makers in foreign exchange (FX),
money market (MM) and the fixed income (FI) businesses.
The Investment Banking business had a remarkable year. The
team continued its dominance of Nigeria’s investment banking
space and this is buttressed by the sheer number and awards
and accolades received by the team. The debt solutions team
(compassing project finance, leveraged  acquisition finance 
property finance units) within the IB business was instrumental in
the impressive growth witnessed in the loan book thus securing
a stream of annuity income. The Corporate Finance team was
equally exceptional given the range of mandates won and the
magnitude of deals executed.
CIB business across the group became balance sheet conscious
during the year and this has encouraged a foray into deals
and transactions which were earlier thought to be too big for
the local balance sheet by using Standard Bank’s distribution
network. The importance of this innovative change could not
be over-emphasized on the books of both the local CIB business
as well as that of the group. It has equally fostered intra-group
communication and co-operation.
38
2011 priorities
•	 Continue emphasis on growing the trade finance business.
•	 Increased focus on building quality long term loan books through the Investment Banking team, thereby creating a sustainable	
	 stream of annuity income.
•	 Focus on the Equity and Debt Capital Markets as more companies and state governments are expected to approach the capital	
	 markets for financing.
•	 Further repositioning of the relationship management team for effectiveness and closer working relationship with our	
	 transactional bankers.
•	 An aggressive client acquisition program.
•	 Continued improvement of service and processes.
•	 Cost and operational efficiency.
39
Corporate  Investment Banking
Strategic direction
The challenging terrain witnessed in 2010 required clear and
precise strategic initiatives from management aimed at not only
defending our current market share but growing organically by
increasing our wallet share of existing client business as well as
attract new clients.
The strategic initiatives include:
•	 Continued growth in medium to long term risk asset book
•	 Focus on trade finance, with the aim of increasing our
	 market share
•	 An aggressive client acquisition programme
•	 Repositioning the balance sheet to lower the cost
	 of funding
Awards
The relentless efforts and outstanding contributions made by
units within CIB were not unnoticed in the course of the year.
Awards and accolades were showered on the team by various
reputable institutions amongst which are:
•	 Global Finance Awards for best Sub Custodian , 2010
•	 Best Investment Bank in Nigeria, Euromoney, 2010
•	 Best Brokerage House, EMEA Finance, 2010
•	 Best Investment Bank, EMEA Finance, 2010
•	 Best Issuing House in Africa, Africa Bankers Award, 2010
•	 Best Custodian in Nigeria, Global Custodian 2010 Emerging
	 Markets Award
Financial performance
Though the market terrain was quite challenging in 2010, CIB was
able to post an impressive result on the back of clear strategic
goals and team performance. The division’s total income grew
by 7% during the year with significant portion of it coming from
a 54% reduction in interest expense due to the repositioning of
the balance sheet specifically change in deposit mix coupled with
lower cost of funding.
Looking forward
The on-going banking reforms and the present economic
situation present both challenges and opportunities for CIB.
It is therefore imperative to be forward looking and approach
the imminent challenges and opportunities in 2011 with some
well articulated strategies that will ensure that we harness the
emerging opportunities as well as increase our market share.
Some of these strategies include:
•	 One CIB – We expect to continue to develop our concept
	 of One CIB whereby the CIB business will run group-wide
	 on a balance sheet conscious model such that transactions
	 can be booked on the balance sheet of any country
	 provided the group has an appetite for the transaction
	 and it does not violate any local regulatory laws. These will
	 allow large ticket transactions to be done irrespective of
	 the country of origination. The concept also encourages
	 better working cooperation between CIB’s 3 product houses
	 – GM, IB and TPS with a view to better serving our clients.
•	 Improved coverage model – The segregation between
	 investment banking coverage and corporate banking
	 coverage will create client focused relationship teams.
	 Specific needs of client will easily be accommodated under
	 this model with the end result of providing tailor-made
	 services for clients. Large corporate and multinationals will
	 be able to access expertise knowledge on how to launch
	 their business and access investment opportunities across
	 the globe through our wide market presence.
The key performance indicators are highlighted below:
2010
Nmillion
2009
Nmillion
Growth
%
Total income 27,487 25,586 7
Staff costs 7,026 7,444 (6)
Other operating
expenses 10,307 8,541 21
Provision for risk
assets
(513) 3,820 (100)
Tax provision 3,106 810 100
Profit after tax 7,561 4,971 52
Deposits 104,222 94,186 11
Gross loans 
advances 129,807 103,379 26
BusinessreviewBusinessreview
Stanbic IBTC Bank PLC Annual Report 2010
•	 Efficiency in the credit process – Further reviews will be
	 carried out on the credit review process across CIB in order
	 to improve the process and make it more efficient whilst still
	 maintaining the highest standard of credit review and
	 approval process.
•	 Client acquisition – The drive is to increase our client base
	 across all our priority sectors. The bank has grown in branch
	 network and several improvements have been carried out
	 on the bank’s systems and infrastructure to better serve the
	 clients. It is imperative to grow client base, to sweat the
	 existing infrastructure and increase our market share.
•	 Debt solutions – The debt solutions team has been
	 adequately resourced to undertake several projects and
	 grow the loan book in order to create a stream of annuity
	 income. The team will be looking at the various
	 opportunities within key sectors of the economy such as
	 power, infrastructure and oil  gas.
•	 Cost optimisation – There is need to focus on ways of
	 eliminating avoidable costs and optimizing the benefits
	 from the unavoidable ones.
•	 Trade business – The country remains an import
	 dependent economy which means that increasing trade
	 transactions remain an important part of our business
	 strategy. It is expected that the fusion of structured and
	 vanilla trade business will ensure a more successful year for
	 the trade desk.
•	 Cash management solutions – Our expectation is that more
	 volumes will be pushed through our electronic payment
	 platform called new Business Online (nBOL). The platform
	 has been upgraded to include new features and it is more
	 user friendly. New applications such as Bulk Cheque Writing
	 solutions and Auto Safe will further complement the existing
	 cash management solutions thereby catering for a variety
	 of client needs.
40
Oando PLC (“Oando” or the “Company”) is
a leading Nigerian oil and gas company
which generated over US$2 billion in revenue
in 2009.
Case study
Oando PLC
41
Stanbic IBTC Bank PLC Annual Report 2010 42
Businessreview
Oando’s business is organised into 6 business divisions:
(i)	 Exploration  production;
(ii) 	 Energy services (in the upstream sector);
(iii)	 Gas and power (in the midstream sector);
(iv) 	 Marketing;
(v) 	 Supply and trading; and
(vi)	 Refinery and terminals (in the downstream sector).
The company had approximately US$660 million (naira
equivalent) in short term debt which comprised overdraft, 90
day commercial paper, and trade finance facilities to 18
commercial banks and was seeking to implement an optimal
capital structure in advance of executing a number of corporate
finance initiatives and expansion programmes in its exploration
and production business.
The programme
Stanbic IBTC Bank PLC (“Stanbic IBTC”) was mandated as Global
Co-ordinator and Structuring Bank to restructure a portion of
Oando’s short term debt into a term facility. US$400 million
(naira equivalent) of the company’s total debt was restructured
from previously unsecured 90 day commercial paper into a fully
secured syndicated medium term facility, which was held at the
group level with security taken on five of the subsidiaries of the
Oando Group.
The transaction required extensive financial and legal due
diligence of the financing company’s operations at both the
holding company and subsidiary level which ensured that an
adequate financing structure was put in place for the transaction
and furthermore that the company would not violate any terms
and conditions of its existing facilities at both the holding
company and subsidiary levels.
Financing
Stanbic IBTC acted as Joint Mandated Lead Arranger with two
other banks on the transaction. In its additional capacity as
The Bank won “Bank Arranger of the Year Award” from Africa
Investor at the Ai Infrastructure Investment Awards 2010, on the
back of this transaction, amongst others.
Structuring Bank and Global Co-ordinator on the transaction,
Stanbic IBTC also undertook the roles of Financial Modelling
Bank and Documentation Bank.
The transaction to date is the largest restructuring of a short
term loan completed in 2010, in the Nigerian financial market.
•	 The restructure of Oando’s commercial bank facilities
	 was pertinent to the success of its corporate finance
	 initiatives valued at US$640 million;
•	 This transaction consolidated the administration of the
	 company’s local commercial loans to a more efficiently
	 managed process and Oando was able to streamline its
	 banking operations in the process from 18 to 13 banks;
•	 Local banks are now in a secured position with regards to
	 their loan exposure to Oando; and
•	 Stanbic IBTC in its capacity as Global Coordinator for the
	 Oando transaction, was the de-facto financial adviser with
	 respect to the restructuring of the company’s balance
	 sheet. As Global Coordinator / Financial Adviser, we were
	 responsible for preparing the financial model that was used
	 during the debt financing for the transaction. In addition
	 we were responsible for structuring the transaction and
	 providing support to the company from the stage when
	 the term sheet was signed until financial close (initial
	 disbursement).
43
Case study
Dangote Cement Plc
Dangote Cement Plc (“DCP”) is a fully
integrated cement company with operations
in Nigeria, Benin and Ghana. It is the largest
cement company in Nigeria with an expected
production capacity of 20mpta in 2011
(representing 70% market share). The
company owns and operates Obajana Cement
Plant, the largest cement plant in Sub-Saharan
Africa and the second largest in Africa.
Stanbic IBTC Bank PLC Annual Report 2010 44
Businessreview
Dangote Cement Plc (DCP) was incorporated as Obajana Cement
in 1992 to operate plants for the preparation, manufacture,
control, research and distribution of cement and related products.
In 2007, DCP commenced operation of multiple domestic
manufacturing and bulk import terminal operations across
Nigeria. These include Obajana Cement Plant, Ibese Cement
Plant (a green field plant), Dangote Bail Cement Terminals and
Lagos Cement Terminals. Pre-merger, 99% of the company was
owned by Dangote Industries Limited (“DIL”).
Benue Cement Company Plc (“BCC”) was incorporated as
a private limited liability company in 1975. The company
commenced cement production in 1980 and was listed on The
Nigerian Stock Exchange (“The NSE”) in 1991. In 2000, DIL
became a core shareholder in BCC and subsequently took over
management control in 2004. Pre-merger, 75% of the company
was owned by DIL.
The programme
Stanbic IBTC acted as financial adviser to BCC in its N66.7 billion
merger with DCP.
The objective of the merger was to consolidate the cement
producing entities of DIL, thus presenting a better platform for
the enlarged entity (post merger) to optimize the opportunities
inherent in the Nigerian cement industry.
Shareholders of BCC and DCP approved the merger by voting
at separate court-ordered meetings and the transaction was
sanctioned by the Federal High Court rendering it effective on
8th October 2010. In line with the terms of the merger, BCC
minority shareholders received 1 share in DCP for every 2 BCC
shares originally held.
DCP was listed on The NSE on 26th October 2010 at N135 per share
with a market capitalization of N2.1 trillion (representing 25% of
The NSE’s total market capitalization). It was the biggest listing ever
on The Nigerian Stock Exchange.
45
Case study
AccuGas Limited
The AccuGas Gas Pipeline Project (the
“project”) involves the construction of a new
65km pipeline with a capacity of 100mmcf/d
from Frontier Oil Limited’s / Septa Energy’s
Uquo gas field to Ikot Abassi in Akwa Ibom
State, Nigeria. The project also involves the
construction of a gas and liquids processing
facility (“CPF”) and liquids pipeline, which
in aggregate will cost approximately
US$250 million, of which AccuGas Limited
(“AccuGas”) will be investing a total of
US$190 million in equity and pre-payments
and the additional US$60 million will be
funded by debt.
Stanbic IBTC Bank PLC Annual Report 2010 46
Businessreview
The gas pipeline will deliver gas to Ibom Power Company Limited,
a 180MW Independent Power Producer, which began operation
in December 2009 and is slated to expand to 550MW in the
near future.
AccuGas is a wholly owned subsidiary of Seven Energy
International Limited (“Seven Energy”), a leading independent
gas exploration and production company, which operates under
the trade name of Septa Energy Nigeria Limited (“Septa Energy”)
in Nigeria. AccuGas was set up as a special purpose vehicle
(“SPV”) for the development of Seven Energy’s gas pipeline
infrastructure operations across Nigeria.
The programme
Stanbic IBTC Bank PLC (“Stanbic IBTC”) was mandated as Lead
Arranger, Global Coordinator and Structuring Bank, to arrange
and raise the required debt financing for the project. In June
2010, AccuGas signed a US$60 million 8 year project finance
facility with Stanbic IBTC and United Bank for Africa Plc (“UBA”)
to part finance the project, which is the first phase in AccuGas’
and Septa Energy’s development programme to bring the South
East Niger Delta’s substantial discovered gas reserves to market
to meet the growing energy demand from power plants and
industrial users in the region. This has been strongly supported by
independent power companies, Akwa Ibom State and industrial
companies, who require reliable gas supply for their operations.
AccuGas and Septa Energy have achieved a major milestone
in Nigeria’s gas development industry, as an indigenous gas
producer, setting the pace for the nation’s industrial economic
growth. The financing represents the first true project financing
in Nigeria for an integrated mid-stream gas infrastructure
network, which includes an extensive gas pipeline distribution
network and a gas processing facility and is also one of the
first in Nigeria to comply with both the Nigerian environmental
regulations and the IFC’s Equator Principles.
In its capacity as Structuring Bank and Global Coordinator on the
transaction, Stanbic IBTC also undertook the roles of Financial
Modeling Bank, Facility Agent and Documentation Bank.
The Bank won “African Midstream Oil  Gas Deal of the
Year 2010” from Euromoney Project Finance Magazine, on the back
of this, amongst others.
47
Case study
IHS Nigeria Plc
IHS Nigeria Plc (“IHS”) is a telecommunication
infrastructure support services provider with
presence in Nigeria, Ghana, Tanzania, Sudan
and other Sub-Saharan African markets.
The company commenced operations in
2001 by providing turnkey solutions for
telecommunications operators and vendors
and has emerged as a formidable operator in
the sub-sector with its three-tier approach:
Site Deployment Services, Managed Services
and Collocation Services. IHS has over 2,500
sites under management.
Stanbic IBTC Bank PLC Annual Report 2010 48
Businessreview
Financing
In June 2010, Stanbic IBTC, through its Leveraged and
Acquisition Finance unit, provided a fully underwritten
$74 million syndicated medium term refinancing and capital
expenditure facility to IHS. The 5-year facility was structured
as dual-currency financing consisting of a local currency (Naira)
tranche and a foreign currency (USD) tranche. The USD tranche
was structured with a currency hedge to minimize foreign
exchange risks. The proportion of foreign currency and local
currency in the facility structure was optimally weighted to
achieve a lower cost of debt capital whilst providing IHS with
the appropriate loan tenor. In summary, the financing allowed
IHS to restructure its balance sheet.
Stanbic IBTC acted as Mandated Lead Arranger for the financing
which was also one of the largest funding led by a local bank
to the telecoms infrastructure support sub-sector in 2010 and
financial close was achieved within acutely tight timeline.
Partnership
Growth in the infrastructure support services sub-sector has
been fueled by a cost management drive which has permeated
the telecom industry landscape in 2010. In addition to the cost
focus, the regulatory support for infrastructure sharing is also
fuelling the growth of collocation services. This trend, which is
expected to continue in Nigeria, is also expected to hold sway
in other African telecoms markets. The financing provided by
Stanbic IBTC will help position IHS to strengthen its position as
the leading telecommunications solutions provider in Africa.
49
Total income
N8,671 million
2009: NGN6,919 million
Cost to income ratio
50.5 %
2009: 50.4%
Assets under management
N580 billion
2009: N384 billion
Retirement savings accounts
834,298
2009: 726,879
Wealth
The Wealth Group continued to show resilience in the face of market uncertainties by exceeding 2009 income and profit by 25%. Assets
under management (AuM) and client numbers also grew to sustain the position of component businesses as market leaders in their
various industries.
Asset management Pension management
24%
76%
What we offer
•	 The wealth division focuses on private non-pension asset management and pension fund	
	 administration and management. The division will commence the offering of trusteeship and	
	 estate planning business from 2011 having obtained both the local and international approval	
	 in 2010.
2010 highlights
•	 Achieved record assets under management of N580billion to consolidate position as largest	
	 institutional investment business in Nigeria
•	 Year on year revenue growth of 25%
•	 Assets under management (AuM) grew by 51% over 2009 numbers to N580 billion (US$3.8b)	
•	 Launch of 2 fixed income focused funds (Stanbic IBTC Money Market and Bond Funds)
•	 Regulatory approvals received for the commencement of Stanbic IBTC Trustees Limited (‘SITL”)	
•	 Established the foundation for a robust distribtion platform to drive growth strategy
•	 Maintained cost efficiency by containing costs at about 50% of income
2011 priorities
•	 Focus on service to improve customer experience and brand affinity
•	 Continued growth in AuM and client numbers
•	 SITL to commence operations
•	 Add Shariah Compliant Investment theme for private clients
Revenue by business unit
Stanbic IBTC Bank PLC Annual Report 2010 50
Businessreview
Overview
Thewealthgroupisthegroup’sthirdpartyinvestmentmanagement
business. The wealth division comprised two companies:
•	 private non-pension asset management through Stanbic
	 IBTC Asset Management Limited (“SIAML”); and
•	 pension fund administration (PFA) and management
	 through Stanbic IBTC Pension Managers Limited
	 (“SIPML”).
All required local and international regulatory approvals have
been received for the establishment and operation of Stanbic
IBTC Trustees Limited (“SITL”), the group’s wholly owned
trusteeship and estate planning subsidiary. SITL commenced
business formally from 01 January 2011.
The wealth group consolidated its position as the largest
wealth business in Nigeria extending the franchise of the
component businesses and hitting a record N580 billion
(US$3.8b) in assets under management. SIAML remained the
largest independent asset manager in Nigeria measured by assets
under management and number and size of mutual funds, while
SIPML also remained the largest PFA in Nigeria by client size
and assets under management.
Strategy
The wealth business model remained focused on helping clients
invest predominantly in the equities and fixed income markets
in Nigeria to accumulate, preserve/protect and decumulate
their assets. The inclusion of SITL allows us to extend the client
offering to include the (inter-generational) transfer of assets.
In 2010 we focused on growth – in client numbers; assets under
management and the scope of our wealth operations. For the
pension business, where the client numbers are important,
we added over 100,000 new clients and grew assets under
management by 43% to close at N489 billion (US$3.2b). We
are still focused on our goal to reach a milestone of 1 million
Retirement Savings accounts. For the asset management
business, we more than doubled our assets under management
from N43 billion in 2009 to N91 billion (US$600 million) on
31 December 2010. This result instantly positions SIAML as
one of the top 10 asset managers in Nigeria when the PFAs are
included. SIPML remains the largest asset manager in Nigeria by
assets under management.
Furthermore, the foundation for a robust distribution platform
for the wealth group was established with the creation of a
focused distribution (sales) team with the capability to cross sell
2010
Nmillion
2009
Nmillion
Growth
%
Total income 8,671 6,919 25
Staff costs 1,631 1,453 12
Other operating
expenses
2,750 2,031 35
Tax provision 1,396 1,090 28
Profit after tax 2,894 2,345 24
into other group client bases. We also commenced the extension
of our client wealth offering to risk management by offering
clients the opportunity to procure health insurance through
our network from Liberty Health/THT, the local affiliate of the
Standard Bank Group’s health insurance subsidiary. In addition,
we maintained the focus on embedding a cost effective and
scalable operating model and continuously improving internal
operating efficiencies. After two years of implementation, the
model is yielding the expected benefits and ensuring minimal
cost growth despite a much larger operating scale.
Finally, the process of leveraging the bank’s growing branch
network was agreed and the accountability process defined.
The pilot process highlighted the challenges and opportunities
that should be managed and the appropriate attention is being
paid to resolving the issues and harnessing the potential of an
integrated financial services platform for our clients.
Financial performance
We were not overly ambitious about the market performance for
2010 based on an anticipated overhang from the financial crisis.
This was exacerbated in Nigeria by the CBN induced banking
reform and its impact on The Nigerian Stock Exchange. Our focus
was therefore on strengthening our annuity and non-volatile
income bases.
The foregoing approach proved to be prescient and 2010 was
remarkably successful for the wealth group. Revenues and net
earnings grew by 25% each over the 2009 results. Although the
fee pressure remains, the much improved performance reflected
not only the strength of our underlying business, but the level of
efficiency and savings that was extracted from our operational
improvement strategy. Total assets under management grew by
51% to N580 billion (i.e. over $3.8 billion).
51
Looking forward
We expect a great deal of excitement in the financial markets
in 2011. With the expected resolution and completion of
the banking sector reforms, we expect an increase in general
liquidity. Combined with the customary pre-election liquidity,
and increasing compliance in the pension industry and insurance
sector, we expect an increase in investment assets and have
therefore positioned ourselves to take advantage of the possible
mandate opportunities.
Our focus vehicles for 2011 are the mutual funds and the RSA
fund which should benefit from increasing retail participation via
lower risk investment vehicles. We expect to launch a shariah-
compliant investment avenue for our private clients in SIAML to
address a market segment that is still underserved.
Our client lifecycle management approach will continue to guide
us as the synergy between the objectives of living a healthy life,
investing safely and retiring well should provide us with ample
opportunity to expose our clients – existing and potential - to
the Stanbic IBTC Wealth offering. In so doing, we expect to drive
client numbers and there from, asset growth.
Wealth
Stanbic IBTC Bank PLC Annual Report 2010 52
BusinessreviewBusinessreview
52
Stanbic IBTC Bank PLC Annual Report 2010 54
Annualreportand
financialstatements
Annual report
and financial
statements
Annualreportand
financialstatements
50
Board of directors
Directors’ report
Directors’ responsibility for annual financial statements
Corporate governance report
Audit committee report
Report of the independent auditor
Statement of accounting policies
Profit and loss accounts
Balance sheets
Statement of cash flow
Notes to the financial statements
Financial risk analysis
Statement of value added
Five year financial summary
55
59
64
65
77
78
79
84
85
86
88
119
149
151
55
Yinka Sanni (45)
B.SC, MBA, ACS, AMP
Appointed: 2005
Directorships: Stanbic IBTC Bank PLC, Stanbic
IBTC Asset Management Ltd, Stanbic IBTC
Trustees Ltd, People Affairs Ltd
Committee member: Board credit committee,
Board risk management committee
Board of directors
Board 2010
01
04
02
05
03Atedo N.A. Peterside (oon) (55)
BSc, MBA
Appointed: Director 1989, Chairman 2007
Directorships: Stanbic IBTC Bank PLC, Stanbic
IBTC Pension Managers Ltd, Cadbury Nigeria
Plc, Nigerian Breweries Plc, Presco Plc, Unilever
Nigeria Plc, Flour Mills of Nigeria Plc
Committee member: None
Chris Newson (46)
B.Com, CA(SA), CSEP
Appointed: 2008
Directorships: Stanbic IBTC Bank PLC,
Stanbic IBTC Stockbrokers Ltd, Stanbic
Nominees Nigeria Limited, Stanbic IBTC Asset
Management Ltd, Stanbic IBTC Ventures Ltd
Committee member: Board risk management
committee
Sola David-Borha (50)
BSc (Econs), MBA
Appointed: 1994
Directorships: Stanbic IBTC Bank PLC,
Stanbic Nominees Nigeria Ltd, Stanbic
IBTC Stockbrokers Ltd, Stanbic IBTC Asset
Management Ltd, Stanbic IBTC Pension
Managers Ltd, Stanbic IBTC Ventures Ltd,
Board Member-Financial Institutions Training
Centre (FITC), First Securities Discount House,
Credit Reference Company, Frezone Plant
Fabrication Int Ltd, First SMI Investment
Company, Vectis Capital Nigeria Ltd, Fate
Foundation, Redeemers International School
Committee member: Board credit committee,
Board risk management committee
Marna Roets (44)
B.Com (Hons) CA (SA)
Appointed: 2007
Directorships: Stanbic IBTC Bank PLC,
Stanbic Nominees Nigeria Ltd,
Stanbic IBTC Stockbrokers Ltd
Committee member: Board risk management
committee
01
04
02
05
03
Stanbic IBTC Bank PLC Annual Report 2010 56
06
09
07
1008
Moses Adedoyin (62)
FCIB
Appointed: 2005
Directorships: Stanbic IBTC Bank PLC, Remofal
Ltd, Allegiance Technologies Ltd, Bank
Directors Association of Nigeria
Committee member: Board credit committee,
Audit committee
Jacques Troost (47)
B.Com (Hons)
Appointed: 2007
Directorships: Stanbic IBTC Bank PLC
Committee member: Board credit committee,
Board risk management committee
Alaibi Samuel Cookey (55)
B.A. Hons A  E D, B.Arch Hons
Appointed: 2009
Directorships: Stanbic IBTC Bank PLC, Space
Concepts Limited, Context Matrix Ltd,
Mentor Trinity Ltd
Committee member: Board risk management
committee, Audit committee
Ifeoma Esiri (58)
LLB, BL, LLM
Appointed: 2004
Directorships: Stanbic IBTC Bank PLC, Stanbic
IBTC Asset Management Limited, Podini
International Limited, Veritas Geophysical Nigeria
Limited, Ashburt Leisures Limited, Ashburt
Beverages Limited, Ashburt Oil and Gas Limited
Committee member: Chairperson. Board risk
management committee, Audit committee
06
09
07
1008
Arnold Gain (56)
B.Com, FA, BDP
Appointed 2011
Directorships: Stanbic IBTC Bank PLC
Committee member: Board credit committee,
Board risk management committee.
Annualreportand
financialstatements
57
Board of directors
Board 2010
12
11 12 13
1311 Ben Kruger (51)
B.Com (Hons) CA (SA)
Appointed: 2007
Directorships: Stanbic IBTC, Standard Bank Plc,
SSA Trading (Pty) Ltd
Committee member: Board credit committee,
Board risk management committee, Board
remuneration committee
Jacko Maree (55)
B.Com, MA, PMD
Appointed: 2007
Directorships: Stanbic IBTC Bank PLC, Standard
Bank Group Ltd, The Standard Bank of South
Africa Ltd, Standard International Holding SA,
Standard Bank plc, SBIC Investments SA, Liberty
Group Ltd, Liberty Holdings Ltd, Jobco, The
River Club Ltd, Stanbic Africa Holdings, Banking
Association of South Africa
Committee member: Board remuneration
committee
Ratan Mahtani (55)
Appointed: 2008
Directorships: Stanbic IBTC Bank PLC, Aegean
Investments Limited, Churchgate Nigeria
Limited, First Century International Limited,
Foco International Investments Limited, T F
Kuboye  co, International Seafoods Limited
Committee member: None
Stanbic IBTC Bank PLC Annual Report 2010 58
Annualreportand
financialstatements
59
Directors’ report
For the year ended 31 December 2010
The directors present their annual report on the affairs of Stanbic
IBTC Bank PLC (“the bank”) and its subsidiaries (“the group”),
together with the financial statements and auditor’s report for
the year ended 31 December 2010.
a. 	 Legal form
The bank was incorporated in Nigeria under the Companies 
Allied Matters Act (CAMA) as a private limited liability company
on 2 February 1989. It was granted a licence on 3 February 1989
to carry on the business of merchant banking and commenced
business on 1 March 1989. The bank was converted into a public
limited liability company on 25 January 2005. The bank’s shares
were listed on 25 April 2005 on the floor of The Nigerian Stock
Exchange, by way of introduction.
b. 	 Principal activity and business review
The principal activity of the bank is the provision of banking and
other financial services to corporate and individual customers.
Such services include the granting of loans and advances,
corporate finance and money market activities. Its major
subsidiaries carry on asset management, stock broking and
pension fund administrator businesses.
2010
Group
Nmillion
2009
Group
Nmillion
2010
Bank
Nmillion
2009
Bank
Nmillion
Gross earnings 56,745 59,781 48,934 52,850
Profit before tax 13,528 10,342 10,187 7,141
Taxation (4,073) (2,204) (2,376) (883)
Profit after taxation 9,455 8,138 7,811 6,258
Non controlling interest (653) (490) - -
Profit attributable to the group 8,802 7,648 7,811 6,258
Appropriations:
Transfer to statutory reserve 1,450 1,147 1,172 939
Transfer to retained earnings reserve 7,352 6,501 6,639 5,319
8,802 7,648 7,811 6,258
Dividend proposed 7,313 5,625 7,313 5,625
The bank has five wholly owned subsidiaries: Stanbic IBTC Asset
Management Limited, Stanbic IBTC Stockbrokers Limited, Stanbic
IBTC Ventures Limited, Stanbic Nominees Nigeria Limited and
Stanbic IBTC Trustees Limited. It is the majority shareholder in
another subsidiary; Stanbic IBTC Pension Managers Limited. The
winding up of R B Resources Limited, a subsidiary it acquired
as a result of its merger with the legacy Regent Bank PLC in
December 2005 was concluded in April 2010. Stanbic IBTC
Trustees Limited, which was incorporated in 2009, is expected
to commence operations in 2011.
The bank prepares consolidated financial statements. Separate
financial statements of the bank accompanies the consolidated
financial statements.
c. 	 Operating results and dividends
The group gross earnings decreased by 5%, while the profit
before tax increased by 31%. The board recommended the
approval of a final dividend of N0.39 kobo per share (2009:
N0.30 kobo).
Highlights of the group’s operating results for the year under
review are as follows:
Stanbic IBTC Bank PLC Annual Report 2010 60
Annualreportand
financialstatements
d. 	 Directors’ shareholding
The direct interest of directors in the issued share capital of the bank as recorded in the register of directors’ shareholding and / or as
notified by the directors for the purposes of section 275 and 276 of CAMA and the listing requirements of The Nigerian Stock Exchange are
as follows:
Direct shareholding
Number of ordinary
shares held
Number of ordinary
shares held
2010 2009
Atedo N. A. Peterside OON 220,000,000 220,000,000
Chris Newson - -
Sola David - Borha 16,121,573 16,121,573
Marna Roets - -
Jacques Troost - -
Yinka Sanni 1,000,000 1,000,000
Moses Adedoyin 44,400,000 44,320,000
Sam Cookey 2,000,000 2,000,000
Ahmed Dasuki*** 109,000,722 109,000,722
Dr Alewyn Burger*** - -
Ifeoma Esiri 100,844,394 113,844,394
Christopher Kolade CON*** - -
Ben Kruger - -
Bhagwan Mahtani * 53,373,333 53,373,333
Ratan Mahtani * 53,373,333 53,373,333
Jacko Maree - -
Sam Unuigbe*** 121,605,600 121,605,600
Lt Gen (rtd) M.I. Wushishi CFR GCON** - -
* Messrs Bhagwan Mahtani and Ratan Mahtani both have indirect shareholdings amounting to 2,002,457,635 ordinary shares (2009:
2,002,457,635) respectively through First Century International Limited, Churchgate Limited, International Seafoods Limited, Foco
International Limited, Aegean Investments Limited and R B Investments Limited.
**Lt General (rtd) Wushishi CFR GCON, who retired from the Board in June 2010, has an indirect shareholding amounting to 214,000,000
ordinary shares (2009: 214,000,000) through Umfat Holdings Limited.
***Dr. Alewyn Burger, Dr. Christopher Kolade CON, Mallam Ahmed Dasuki, Mr. Bhagwan Mahtani and Mr. Sam Unuigbe voluntarily retired
during 2010. The board also appointed Mr. Arnold Gain as a director after the Annual General Meeting held in June 2010. His appointment is
effective 25 February 2011. Shareholders will be requested to appoint Mr Gain as a director at the Annual General Meeting holding in 2011.
Arnold Gain’s shareholding position which is nil is not reflected above because his appointment to the board took effect after 31
December 2010.
The directors to retire by rotation at the next Annual General Meeting (AGM) are Mr Atedo N. A. Peterside OON, Mr Moses Adedoyin, Mrs
Ifeoma Esiri and Ms Marna Roets. All of these directors, being eligible, offer themselves for re – election.
61
Directors’ report
For the year ended 31 December 2010
e. 	 Directors interest in contracts
During the course of 2010, two directors, Mr Bhagwan Mahtani
and Mr Ratan Mahtani, had an interest in a company which had a
contract with the bank, which interest was disclosed to the board
in compliance with the requirements of Section 277 of CAMA.
f. 	 Property and equipment
Information relating to changes in property and equipment is
given in Note 20 to the accounts. In the directors’ opinion the
disclosures regarding the group’s properties are in line with the
related statement of accounting policy of the group.
g. 	 Shareholding analysis
The shareholding pattern of the Bank as at 31 December 2010
is as stated below:
h. 	 Substantial interest in shares
According to the register of members as at 31 December 2010, no shareholder held more than 5% of the issued share capital of the bank
except the following:
Shareholder No of
shares held
Percentage shareholding
Stanbic Africa Holdings Limited (SAHL) 9,518,617,926 50.77%
First Century International Limited 1,400,790,732 7.47%
Share range No. of shareholders Percentage of
shareholders
No. of holding Percentage
holdings
1 - 1,000 27,455 25.1 22,910,238 0.10
1,001 - 5,000 47,041 43.0 130,213,858 0.70
5,001 - 10,000 14,029 12.8 118,917,909 0.60
10,001 - 50,000 15,487 14.2 371,398,470 2.00
50,001 - 100,000 2,581 2.4 206,346,836 1.10
100,001 - 500,000 2,225 2.0 506,010,291 2.70
500,001 - 1,000,000 281 0.3 219,130,334 1.20
1,000,001 - 5,000,000 204 0.2 421,406,877 2.20
5,000,001 - 10,000,000 41 0.0 292,779,376 1.60
10,000,001 - 50,000,000 54 0.0 1,310,095,341 7.00
50,000,001 - 18,750,000,000 35 0.0 15,150,790,470 80.80
Grand total 109,433 100 18,750,000,000 100
Foreign shareholders 148 9,759,536,445 52.05
Year ended Total amount paid
Nmillion
Dividend paid
per share
kobo
31 March 2000 240.0 40
31 March 2001 270.0 45
31 March 2002 300.0 30
31 March 2003 400.0 40
31 March 2004 500.0 25
31 March 2005 1,174.2 20
31 March 2006 2,411.4 20
31 March 2007 3,750.0 30
31 December 2007 4,687.5 25
31 December 2008 7,500.0 40
31 December 2009 5,625.0 30
i.	 Dividend payment history
Stanbic IBTC Bank PLC Annual Report 2010 62
Annualreportand
financialstatements
Year Authorized (N000) Issued  fully paid-up (N000) Consideration
Increase Cumulative Increase Cumulative
1989 - 20,000 - 12,000 Cash
1991 30,000 50,000 12,000 24,000 Bonus (1:1)
1992 - 50,000 16,000 40,000 Bonus (2:3)
1994 100,000 150,000 60,000 100,000 Bonus (3:2)
1996 50,000 200,000 100,000 200,000 Bonus (1:1)
1997 400,000 600,000 400,000 600,000 Bonus (2:1)
2001 400,000 1,000,000 400,000 1,000,000 Bonus (2:3)
2003 1,000,000 2,000,000 1,000,000 2,000,000 Bonus (1:1)
2004 2,000,000 4,000,000 - 2,000,000
2005 1,000,000 5,000,000 935,492 2,935,492 Cash
2006 1,500,000 6,500,000 3,314,508 6,250,000 Cash and share exchange
2007 3,500,000 10,000,000 3,125,000 9,375,000 Share exchange
k. 	 Donations and charitable gifts
The group made contributions to charitable and non–political organizations amounting to N50,751,000 (2009: N81,310,000) during the year.
N
Stanbic IBTC adoption of Lagos Progressive School, Surulere 19,700,000
Stanbic IBTC Sickle Cell Library 10,000,000
Yaba College of Technology 6,426,000
The Nigerian Economic Summit 2010 5,000,000
The Lagos Economic Summit 1,500,000
The Musical Society of Nigeria 950,000
Fate Foundation 850,000
2010 International French Schools World Cup Sponsorship 750,000
Renovation of Gbagada Senior Grammar School 750,000
World Malaria Day 710,000
The African Refugee Foundation 500,000
Patrich Speech  Languages Centre 500,000
Children Development Centre (CDC) 500,000
The Social Enterprise Report and Awards (SERA) 500,000
The Future Project 500,000
The International Women Organization for Charity 435,000
2010 Independence Day Parade for 40 Students 400,000
Loyola Jesuit College PTA Advocacy Project 250,000
Nigerian Heart Foundation 200,000
NYSC Anti-Trafficking Club 150,000
The Eko Awards 100,000
South African Social Day for Charity 80,000
Total 50,751,000
j. 	 Share capital history
63
Directors’ report
For the year ended 31 December 2010
l. 	 Post balance sheet events
There are no significant post balance sheet events after the
balance sheet date.
m. 	 Human resources
Employment of disabled persons
The bank continues to maintain a policy of giving fair consideration
to applications for employment made by disabled persons with due
regard to their abilities and aptitude. The bank’s policy prohibits
discrimination of disabled persons or persons with HIV in the
recruitment, training and career development of its employees. In
the event of members of staff becoming disabled efforts will be
made to ensure that, as far as possible, their employment with the
bank continues and appropriate training is arranged to ensure that
they fit into the bank’s working environment.
Health safety and welfare at work
The bank enforces strict health and safety rules and practices at
the work environment which are reviewed and tested regularly.
The bank’s staff are covered under a comprehensive health
insurance scheme (Liberty Blue) pursuant to which the medical
expenses of staff and their immediate family are covered up to
a defined limit.
Fire prevention and fire fighting equipment are installed in
strategic locations within the bank’s premises
The bank has both Group Personal Accident and Workmen’s
Compensation Insurance cover for the benefit of its employees. It
also operates a contributory pension plan in line with the Pension
Reform Act 2004.
n. 	 Employee involvement and training
The bank ensures, through various fora, that employees are
kept informed on matters concerning them. Formal and informal
channels are employed for communication with employees with
an appropriate two – way feedback mechanism.
Inaccordancewiththebank’spolicyofcontinuousstaffdevelopment,
training facilities are provided in the bank’s well equipped Training
School (the Blue Academy). Employees of the bank attend training
programmes organized by the Standard Bank Group (SBG) in
South Africa and elsewhere and participate in programmes
at the Standard Bank Global Leadership Centre in South Africa.
The bank also provides its employees with on the job training in
the bank and at various Standard Bank locations.
o. 	 Auditors
The external auditors; PricewaterhouseCoopers who have acted as
the bank’s auditors for a continuous period of more than 10 years
have, as required by the CBN Code of Corporate Governance,
indicated that from the 2011 financial year they will no longer
act as auditors to the Company. Special approval was obtained
from Central Bank of Nigeria to enable them act as auditors for
the purpose of the 2010 financial statements. In accordance
with Section 357(1) of CAMA a resolution will be proposed, and
if considered appropriate passed, by shareholders, at the AGM,
to appoint new auditors. Shareholders will also be required to
authorise the directors to fix the remuneration of such new auditors.
By order of the board
Angela Omo-Dare
Company secretary  head legal
23 February 2011
Annualreportand
financialstatements
Directors’ responsibility for annual financial statements
For the year ended 31 December 2010
The Companies and Allied Matters Act, and the banks and
Other Financial Institutions Act, require the directors to prepare
financial statements for each financial year that give a true and
fair view of the state of financial affairs of the bank at the end
of the year and of its profit or loss. The responsibilities include
ensuring that the bank:
i.	 keeps proper accounting records that disclose, with
	 reasonable accuracy, the financial position of the bank and
	 comply with the requirements of the Companies and
	 Allied Matters Act and the Banks and Other Financial
	 Institutions Act;
ii. 	 establishes adequate internal controls to safeguard its
	 assets and to prevent and detect fraud and other
	 irregularities; and
iii. 	 prepares its financial statements using suitable accounting
	 policies supported by reasonable and prudent judgements
	 and estimates, that are consistently applied.
The directors accept responsibility for the annual financial
statements, which have been prepared using appropriate
accounting policies supported by reasonable and prudent
judgments and estimates, in conformity with:
- 	 Nigerian Accounting Standards;
- 	 Prudential Guidelines for Licensed Banks;
-	 relevant circulars issued by the Central Bank of Nigeria;
-	 the requirements of the Banks and Other Financial
	 Institutions Act; and
-	 the requirements of the Companies and Allied Matters Act.
The directors are of the opinion that the financial statements
give a true and fair view of the state of the financial affairs
of the bank and group and of the profit for the year. The
directors further accept responsibility for the maintenance of
accounting records that may be relied upon in the preparation
of financial statements, as well as adequate systems of
internal financial control.
Nothing has come to the attention of the directors to indicate
that the group will not remain a going concern for at least twelve
months from the date of this statement.
Atedo N.A. Peterside OON
Chairman
23 February 2011
Chris Newson
Chief executive officer
23 February 2011
64Stanbic IBTC Bank PLC Annual Report 2010
65
Corporate governance report
For the year ended 31 December 2010
Introduction
The bank is a member of the Standard Bank Group, which holds a
50.77% equity holding in the bank.
Standard Bank Group (“SBG”) is committed to implementing
initiatives that improve corporate governance for the benefit
of all stakeholders. SBG’s board of directors remains steadfast
in implementing governance practices that comply with
international best practice, where substance prevails over form.
Subsidiary entities within SBG are guided by these principles in
establishing their respective governance frameworks, which are
aligned to SBG’s standards in addition to meeting the relevant
jurisdictional requirements in their areas of operation.
Stanbic IBTC Bank PLC (“Stanbic IBTC or the bank”), and its
subsidiaries (“the group”), as a member of SBG, operate under a
governance framework which enables the board to balance its role
of providing oversight and strategic counsel with its responsibility
to ensure conformance with regulatory requirements, group
standards and acceptable risk tolerance parameters.
The major subsidiaries of the bank; Stanbic IBTC Asset
Management Limited and Stanbic IBTC Pension Managers
Limited have their own distinct boards and take account of
the particular statutory and regulatory requirements of the
businesses they operate. These subsidiaries operate under a
governance framework that enables their boards to balance
their roles in providing oversight and strategic counsel with
their responsibility for ensuring compliance with the regulatory
requirements that apply in their areas of operation and the
standards and acceptable risk tolerance parameters adopted
by the group. In this regard they have aligned their respective
governance frameworks to that of the group. As the bank is
the holding company for the subsidiaries in the group, the bank’s
board also acts as the group board, with oversight of the full
activities of the group.
A number of committees have been established by the group’s
board that assist the board in fulfilling its stated objectives.
The committees’ roles and responsibilities are set out in their
mandates, which are reviewed periodically to ensure they remain
relevant. The mandates set out their roles, responsibilities,
scope of authority, composition and procedures for reporting
to the board.
Codes and regulations
The group operates in highly regulated industries and compliance
with applicable legislation, regulations, standards and codes,
including transparency and accountability, remain an essential
characteristic of its culture. The board monitors compliance
with these by means of management reports, which include
information on the outcome of any significant interaction with
key stakeholders such as SBG’s various regulators.
The group complies with all applicable legislation, regulations,
standards and codes.
Shareholders’ responsibilities
The shareholders’ role is to approve the appointments of the
board of directors and the external auditors as well as to grant
approval for certain corporate actions that are by legislation
or the company’s articles of association specifically reserved
for shareholders. Their role is extended to holding the board
accountable and responsible for efficient and effective
corporate governance.
Developments during 2010
During 2010, the following developments in the group’s
corporate governance practices occurred:
-	 Full compliance with the requirements of the Central
	 Bank of Nigeria’s Code of Corporate Governance in relation
	 to independent directors was maintained until 31 December
	 2010, when one of the two independent directors on the
	 board voluntarily retired.
-	 Establishment of a nominations committee to assist in the
	 process for selecting individuals for appointment to the
	 board subsequent to the voluntary retirement of four
	 directors at the end of 2010.
- 	 There was a continued focus on directors training via
	 attendance at various courses.
- 	 The provision of an enhanced level of information in the
	 financials provided to shareholders and investors on an
	 annual and quarterly basis continued.
Focus areas for 2011
The group intends during 2011 to:
- 	 continue the focus on directors’ training via formal
	 training sessions and information bulletins on issues that
	 are relevant;
- 	 ensure that the bank fully complies with the requirement
	 for two independent directors;
Stanbic IBTC Bank PLC Annual Report 2010 66
Annualreportand
financialstatements
Board and directors
Board structure and composition
Ultimate responsibility for governance rests with the board of
directors of the group, who ensure that appropriate controls,
systems and practices are in place. The group has a unitary board
structure and the roles of chairman and chief executive are
separate and distinct. The group’s chairman is a non-executive
director. The number and stature of non-executive directors
ensures that sufficient consideration and debate are brought to
bear on decision making thereby contributing to the efficient
running of the board.
One of the features of the manner in which the board operates
is the role played by board committees, which facilitate the
discharge of board responsibilities. The committees each have
a board approved mandate that is regularly reviewed. Details
on how these committees operate are provided elsewhere in
this report.
Strategy
The board considers and approves the group’s strategy. Once the
financial and governance objectives for the following year have
been agreed, the board monitors performance against financial
objectives and detailed budgets on an on-going basis, through
quarterly reporting.
Regular interaction between the board and the executive is
encouraged. Management is invited, as required, to make
presentations to the board on material issues under consideration.
Directors are provided with unrestricted access to the group’s
management and company information, as well as the resources
required to carry out their responsibilities, including external
legal advice, at the group’s expense.
It is the board’s responsibility to ensure that effective
management is in place to implement the agreed strategy, and
to consider issues relating to succession planning. The board
is satisfied that the current pool of talent available within the
bank and the group, and the ongoing work to deepen the talent
pool, provides adequate succession depth in both the short and
long term.
Skills, knowledge, experience and attributes of directors
The board ensures that directors possess the skills, knowledge
and experience necessary to fulfil their obligations. The directors
bring a balanced mix of attributes to the board, including:
- 	 international and domestic experience;
- 	 operational experience;
- 	 knowledge and understanding of both the macroeconomic
	 and the microeconomic factors affecting the group;
- 	 local knowledge and networks; and
- 	 financial, legal, entrepreneurial and banking skills.
The credentials and demographic profile of the board are
regularly reviewed, to ensure the board’s composition remains
both operationally and strategically appropriate.
Appointment philosophy
The appointment philosophy ensures alignment with all necessary
legislation and regulations which include, but are not limited to
the requirements of the Companies  Allied Matters Act and the
Banks  Other Financial Institutions Act as well as the Companies
and Banks Act of SBG’s home country.
Consideration for the appointment of directors and key
executives take into account compliance with legal and regulatory
requirements and appointments to external boards to monitor
potential for conflicts of interest and ensure directors can
dedicate sufficient focus to the group’s business. The board
takes cognisance of the skills, knowledge and experience of the
candidate, as well as other attributes considered necessary to the
prospective role.
- 	 continue to enhance the level of information provided to
	 and interaction with shareholders, investors and
	 stakeholders generally; and
- 	 develop an appropriate governance framework for the
	 operating structure it will be adopting pursuant to Central
	 Bank of Nigeria’s regulation on the Scope of Banking
	 Activities and Ancillary Matters No 3, 2010, which
	 brought to an end the universal banking regime under
	 which banks and banking groups in Nigeria, inclusive of
	 Stanbic IBTC, had been operating since 2002.
67
Corporate governance report
For the year ended 31 December 2010
In June 2010, a non-executive director; Lt Gen (rtd) M. I. Wushishi
CFR GCON voluntarily retired from the board. In August 2010,
another non-executive director, Dr Alewyn Burger voluntarily
retired from the board, while at that time Mr Arnold Gain was
appointed as a non-executive director by the board subject to
all regulatory approvals being obtained for his appointment. In
terms of the articles of association, Mr Gain’s appointment will
be tabled at the next annual general meeting, at which time
shareholders will be asked to approve the appointment and elect
him to the board.
Dr Christopher Kolade CON, Mallam Ahmed Dasuki, Mr Bhagwan
Matani and Mr Sam Unuigbe voluntarily retired from the board
of the bank with effect from 31 December 2010. With these
retirements the board’s size has reduced to five (5) executive
directors and eight (8) non-executive directors. The number of
independent directors was also reduced to one (1). The board
has however put in place steps to appoint additional directors, at
least one of whom will be an independent director.
The board has the right mix of competencies and experience.
Board responsibilities
The key terms of reference in the board’s mandate, which forms
the basis for its responsibilities, are to:
- 	 agree the group’s objectives, strategies and plans for
	 achieving those objectives;
- 	 annually review the corporate governance process and
	 assess achievement against objectives;
- 	 review its mandate at least annually and approve
	 recommended changes;
- 	 delegate to the chief executive or any director holding
	 any executive office or any senior executive any of the
	 powers, authorities and discretions vested in the board’s
	 directors, including the power of sub-delegation; and to
	 delegate similarly such powers, authorities and discretions 	
	 to any committee and subsidiary company boards as may 	
	 exist or be created from time to time;
- 	 determine the terms of reference and procedures of all
	 board committees and review their reports and minutes;
- 	 consider and evaluate reports submitted by members of
	 the executive;
- 	 ensure that an effective risk management process exists
	 and is maintained throughout the bank and its subsidiaries
	 to ensure financial integrity and safeguarding of the
	 group’s assets;
- 	 review and monitor the performance of the chief executive
	 and the executive team;
- 	 ensure consideration is given to succession planning for the
	 chief executive and executive management;
- 	 establish and review annually, and approve major changes
	 to, relevant group policies;
- 	 approve the remuneration of non-executive directors on
	 theboardandboardcommittees,basedonrecommendations
	 made by the remuneration committee, and recommended
	 to shareholders for approval;
- 	 approve capital funding for the group, and the terms
	 and conditions of rights or other issues and any prospectus
	 in connection therewith;
- 	 ensure that an adequate budget and planning process
	 exists, performance is measured against budgets and plans,
	 and approve annual budgets for the group;
- 	 approve significant acquisitions, mergers, take-overs,
	 divestmentsofoperatingcompanies,equityinvestmentsand
	 new strategic alliances by the group;
- 	 consider and approve capital expenditure recommended by
	 the executive committee;
- 	 consider and approve any significant changes proposed
	 in accounting policy or practice, and consider the
	 recommendations of the statutory audit committee;
- 	 consider and approve the annual financial statements,
	 quarterly results and dividend announcements and notices
	 to shareholders, and consider the basis for determining that
	 the group will be a going concern as per the recommendation
	 of the audit committee;
- 	 assume ultimate responsibility for financial, operational and
	 internal systems of control, and ensure adequate reporting
	 on these by committees to which they are delegated;
- 	 take ultimate responsibility for regulatory compliance and
	 ensure that reporting to the board is comprehensive;
- 	 ensure a balanced and understandable assessment of the
	 group’s position in reporting to stakeholders;
- 	 review non financial matters that have not been specifically
	 delegated to a management committee; and
- 	 specifically agree, from time to time, matters that are
	 reserved for its decision, retaining the right to delegate
	 any of these matters to any committee from time to time in
	 accordance with the articles of association.
Stanbic IBTC Bank PLC Annual Report 2010 68
Annualreportand
financialstatements
Stanbic IBTC board Shareholders
Credit committee
Remuneration
committee (REMCO)
Risk management
committee
Audit committee
Country risk committee
Executive committee
Asset  liabiliy committee
(ALCO)
Credit committee
Risk management
committee
IT steering committee
(Program of works)
Personal  business
banking exco
Operational risk 
compliance committee
Corporate  investment
banking exco
Investment committee
Business support exco
Career management
committee
Wealth excoNew products committee
Board committee
Statutory committee
Management committee
Delegation of authority
The ultimate responsibility for the bank’s and group’s operations
rests with the board. The board retains effective control through
a well-developed governance structure of board committees.
These committees provide in-depth focus on specific areas of
board responsibility.
The board delegates authority to the chief executive to manage
the business and affairs of the group. The executive committee
assists the chief executive when the board is not in session,
subject to specified parameters and any limits on the board’s
delegation of authority to the chief executive.
Membership of the executive committee is set out on page 29.
In addition, a governance framework for executive management
assists the chief executive in his task. Board-delegated authorities
are regularly monitored by the company secretary’s office.
The corporate governance framework adopted by the board on
25 October 2007 and formalised with mandate approvals on 29
January 2008 is set out below:
69
Corporate governance report
For the year ended 31 December 2010
Board effectiveness and evaluation
The board is focused on continued improvements in its corporate
governance performance and effectiveness.
During the year the board of directors underwent an evaluation
conducted by an independent consultant. The aim of this
evaluation was to assist the board and committees to constantly
improve their effectiveness. The assessment conducted in 2010
focused on structure, process and effectiveness.
The report on this evaluation was discussed at a board meeting
and relevant action points have been noted for implementation
to further improve board functioning.
The performance of the chairman and chief executive are
assessed annually, providing a basis to set their remuneration.
Induction and training
An induction programme designed to meet the needs of each
new director is being implemented. One-on-one meetings are
scheduled with management to introduce new directors to the
group and its operations. The company secretary manages the
induction programme.
The CBN’s code of conduct is provided to new directors on their
appointment.
Directors are kept abreast of all relevant legislation and
regulations as well as sector developments leading to changing
risks to the organisation on an on - going basis. This is achieved
by way of management reporting and quarterly board meetings,
which are structured to form part of ongoing training.
Directors attended various workshops that included money
laundering and risk programmes conducted by the regulatory
authorities during the second half of 2010. These workshops
were aimed at enhancing the understanding of key issues, and
skills of bank directors.
Board meetings
The board meets, at a minimum, once every quarter with ad-hoc
meetings being held whenever deemed necessary. The board held
a strategy session in October 2010. Directors, in accordance with
the articles of association of the bank, attend meetings either in
person or via tele conferencing.
Directors are provided with comprehensive board documentation
at least four days prior to each of the scheduled meetings.
Stanbic IBTC Bank PLC Annual Report 2010 70
Annualreportand
financialstatements
Attendance at board meetings from 1 January – 31 December 2010 is set out in the following table:
Name Feb Apr Aug Oct
Atedo Peterside OON (Chairman)
Chris Newson
Sola David-Borha
Marna Roets
Jacques Troost
Moses Adedoyin
Dr Alewyn Burger1
Sam Cookey
Ahmed Dasuki
Ifeoma Esiri
Dr Christopher Kolade CON
Ben Kruger
Bhagwan Mahtani
Ratan Mahtani
Jacko Maree
Yinka Sanni
Sam Unuigbe
Lt. Gen. (rtd) M. Wushishi CFR, GCON2
	= Attendance
A	 = Apology
-	 = Not applicable
1
Retired from the Board on 03 August 2010
2
Retired from the Board on 07 June 2010
Board committees
Some of the functions of the board have been delegated to
board committees, consisting of board members appointed by
the board, which operate under mandates originally established
on 29 January 2008. The composition and mandates of the
committees were reviewed during the course of 2010.
Credit committee
The credit committee during the period under review was vested
with the following responsibilities:
- 	 recommend credit policies and guidelines for the board’s
	 approval;
- 	 review and approve credit facilities to be granted by the
	 bank that fall under the category of insider related credits
	 or which are being granted to the bank staff in the cadres
	 Assistant General Manager and above; and
- 	 such other matters relating to the credit operations of the
	 bank as may be specifically delegated to the committee by
	 the board.
The committee’s mandate is in line with SBG’s standards, while
taking account of local circumstances.
The mandate ensures that effective frameworks for credit
governance are in place across the bank. This involves ensuring
that the committees within the structure operate according to
clearly defined mandates and delegated authority, and providing
for the adequate management, measurement, monitoring and
control of credit risk, including country risk. The committee
reports on credit portfolios, adequacy of provisions and status
of non-performing loans.
The credit committee met its objectives in the year under
review.
The committee consists of the eight directors, four of whom,
including the chairman, were non – executives during the year
under review.
71
Corporate governance report
For the year ended 31 December 2010
Name Feb April July Oct
Ben Kruger (chairman)
Chris Newson
Sola David-Borha
Yinka Sanni
Jacques Troost
Sam Unuigbe
Moses Adedoyin
Dr Christopher Kolade CON
	= Attendance
A	 = Apology
Risk management committee
The board is ultimately responsible for risk management. The main
purpose of the risk management committee, as specified in its
mandate is the provision of independent and objective oversight
of risk management within the group. The committee is assisted in
fulfilling its mandate by a number of management committees.
To achieve effective oversight, the committee reviews and
assesses the integrity of risk control systems and ensures that risk
policies and strategies are effectively managed and contribute to
a culture of discipline and control that reduces the opportunity
for fraud.
The risk management committee during the period under review
was vested, among others, with the following responsibilities:
- 	 to oversee management’s activities in managing credit,
	 market, liquidity, operational, legal and other risks of the
	 bank;
- 	 to periodically review the group’s risk management systems
	 and report thereon to the board;
- 	 to ensure that the group’s material business risks are being
	 effectively identified, quantified, monitored and controlled
	 and that the systems in place to achieve this are operating
	 effectively at all times; and
- 	 such other matters relating to the group’s risk assets as may
	 be specifically delegated to the committee by the board.
The committee’s mandate is in line with SBG’s standards, while
taking account of local circumstances.
A more in-depth risk management section which provides details
of the overall framework for risk management in the group
commences on page 119 of this annual report.
The committee consisted of nine directors, four of whom,
including the chairman were non – executives during the year
under review.
Members’ attendance at risk management committee
meetings during the financial year ended 31 December 2010 is
stated below:
Name Feb April July Oct
Ifeoma Esiri (chairman)
Lt. Gen M.I. Wushishi CFR
GCON
Ben Kruger
Yinka Sanni
Chris Newson
Sola David-Borha
Marna Roets
Jacques Troost
Sam Cookey
= Attendance
A = Apology
- = Not applicable
Remuneration committee
The remuneration committee (REMCO) was vested with
responsibilities during the year under review that included:
- 	 reviewing the remuneration philosophy and policy;
- 	 considering the guaranteed remuneration, annual
	 performance bonus and pension incentives of the group’s
	 highest-paid executive directors and managers;
- 	 reviewing the performance measures and criteria to be
	 used for annual incentive payments for all employees;
- 	 determining the remuneration of executive directors;
- 	 determining the remuneration of the chairman and non-
	 executive directors, which are subject to board and
	 shareholder approval;
- 	 considering the average percentage increases of the
	 guaranteed remuneration of executive management across
	 the group, as well as long-term and short-term
	 incentives; and
- 	 agreeing incentive schemes across the group.
Members’ attendance at credit committee meetings during the
financial year ended 31 December 2010 are stated below:
Stanbic IBTC Bank PLC Annual Report 2010 72
Annualreportand
financialstatements
The chief executive attends meetings by invitation. Other
members of executive management are invited to attend when
appropriate. No individual, irrespective of position, is expected
to be present when his or her remuneration is discussed. When
determining the remuneration of executive and non-executive
directors as well as senior executives, REMCO is expected to
review market and competitive data, taking into account the
groups performance using indicators such as earnings.
REMCO utilises the services of a number of suppliers and advisors
to assist it in tracking market trends relating to all levels of staff,
including fees for non-executive directors. In 2010 the following
suppliers were used:
• 	 KPMG Professional services - Participated in a renumeration
	 survey co-sponsored by the bank.
• 	 International Remuneration, Human Resources and
	 Compensation Consulting (IRRCC) - global market specific
	 survey sponsored by Standard Bank Group.
The board reviews REMCO’s proposals and, where relevant, will
submit them to shareholders for approval at the annual general
meeting (AGM.) The board remains ultimately responsible for the
remuneration policy.
The committee consists of four directors, all of whom are
non–executives.
Members’ attendance at REMCO meetings during the financial
year ended 31 December 2010 is stated below:
Name Jan Apr July Oct
Jacko Maree (chairman)
Ben Kruger
Ahmed Dasuki
Dr Christopher Kolade CON
	= Attendance
A 	= Apology
Remuneration
Introduction
The purpose of this section is to provide stakeholders with
an understanding of the remuneration philosophy and policy
applied across the group for executive management, employees,
and directors (executive and non-executive).
Remuneration philosophy
The group’s board and remuneration committee set a
remuneration philosophy which is guided by SBG’s philosophy
and policy as well as the specific social, regulatory, legal and
economic context of Nigeria.
In this regard, the group employs a cost to company structure,
where all benefits are included in the listed salary and
appropriately taxed.
The following key factors have informed the implementation of
reward policies and procedures that support the achievement of
business goals:
• 	 the provision of rewards that enable the attraction,
	 retentionandmotivationofemployeesandthedevelopment
	 of a high performance culture;
•	 maintaining competitive remuneration in line with the
	 market, trends and required statutory obligations;
• 	 rewarding people according to their contribution;
• 	 allowing a reasonable degree of flexibility in remuneration
	 processes and choice of benefits by employees;
• 	 utilising a cost-to-company remuneration structure; and
• 	 educating employees on the full employee value
	 proposition;
The group’s remuneration philosophy aligns with its core values,
including growing our people, remunerating appropriately
high performers and delivering value to our shareholders. The
philosophy emphasises the fundamental value of our people and
their role in ensuring sustainable growth. This approach is crucial
in an environment where skills remain scarce.
The group board sets the principles for the group‘s remuneration
philosophy in line with the approved business strategy and
objectives. The philosophy aims to maintain an appropriate
balance between employee and shareholder interests. The
deliberations of REMCO inform the philosophy, taking into
account reviews of performance at a number of absolute and
relative levels – from a business, an individual and a competitive
point of view.
A key success factor for the group is its ability to attract, retain
and motivate the talent it requires to achieve its strategic and
operational objectives. The group’s remuneration philosophy
includes short-term and long-term incentives to support this
ability.
Short-term incentives, which are delivery specific, are viewed as
strong drivers of competitiveness and performance. A significant
portion of top management’s reward is therefore variable, being
determined by financial performance and personal contribution
73
Corporate governance report
For the year ended 31 December 2010
against specific criteria set in advance. This incentivises the
commitment and focus required to achieve targets.
Long-term incentives seek to ensure that the objectives of
management and shareholders are broadly aligned over longer
time periods.
Remuneration policy
The group has always had a clear policy on the remuneration
of staff, executive and non-executive directors which set such
remunerationatlevelsthatarefairandreasonableinacompetitive
market for the skills, knowledge, experience required and which
complies with all relevant tax laws.
REMCOassiststhegroup’sboardinmonitoringtheimplementation
of the group remuneration policy, which ensures that:
• 	 salary structures and policies, as well as cash and long term
	 incentives, motivate sustained high performance and are
	 linked to corporate performance objectives;
• 	 stakeholders are able to make a reasonable assessment of
	 reward practices and the governance process; and
• 	 the group complies with all applicable laws and codes.
Remuneration structure
Non-executive directors
Terms of service
Directors are appointed by the shareholders at the AGM,
although board appointments may be made between AGMs.
These appointments are made in terms of the group’s policy.
Shareholder approvals for such interim appointments are
however sought at the annual general meeting that holds
immediately after such appointments are made.
Non-executive directors are required to retire after three
years and may offer themselves for re-election. If recommended
by the board, their re-election is proposed to shareholders at
the AGM.
In terms of regulations, a non-executive director can not hold
office for more than 10 consecutive years. If a director over
the age of 70 is seeking re-election to the board his age must
be disclosed to shareholders at the meeting at which such re-
election is to occur.
Fees
Non-executive directors receive fixed annual fees and sitting
allowances for service on boards and board committees in line
with the Central Bank of Nigeria’s guidelines on the remuneration
payable to such directors. There are no contractual arrangements
for compensation for loss of office. Non-executive directors do
not receive short-term incentives, nor do they participate in any
long-term incentive schemes.
REMCO reviews the non-executive directors’ fees annually and
make recommendations on same to the board for consideration.
Based on these recommendations the Board in turn recommends
a gross fee to shareholders for approval at the Annual General
Meeting (AGM Fees are payable for the reporting period 1
January to 31 December of each year).
Category 2011* 2010
Chairman 37,211,125 34,615,000
Non executive directors 10,342,844 9,621,250
Sitting allowances for
board meetings**:
- Chairman 192,425 179,000
- Non executive directors 121,475 113,000
* 	 Proposed for approval by shareholders at the AGM taking
	 place in 2011.
** 	 Fees quoted as sitting allowance represent per meeting
	 sitting allowance paid for board, board committee and ad
	 hoc meetings. No annual fees are payable to committee
	 members with respect to their roles on such committees.
Retirement benefits
Non-executive directors do not participate in the pension
scheme.
Executive directors
The group currently has five executive directors.
Executive directors receive a remuneration package and qualify
for long-term incentives on the same basis as other employees.
Executive directors’ bonuses and pension incentives are subject
to an assessment by REMCO of performance against various
criteria. The criteria include the financial performance of the
Stanbic IBTC Bank PLC Annual Report 2010 74
Annualreportand
financialstatements
group, based on key financial measures and qualitative aspects of
performance, such as effective implementation of group strategy
and human resource leadership.
The employment contracts of executive directors have a
termination clause of three months.
Executive directors, other than the CEO, are required to
retire from the board on a rotational basis, that usually occurs
after three years and may offer themselves for re-election. If
recommended by the board, their re-election is proposed to
shareholders at the AGM.
Management and general staff
Total remuneration packages for employees comprise the
following:
• 	 guaranteed remuneration – based on market value and the
	 role played;
• 	 annual bonus – used to incentivise the achievement of
	 group objectives;
• 	 Long term incentives – rewards the sustainable creation of
	 shareholder value and aligns behaviour to this goal;
•	 pension – provides a competitive post-retirement benefit
	 in line with other employees; and
• 	 where applicable, expatriate benefits in line with other
	 expatriates in Nigeria.
Terms of service
The minimum terms and conditions for managers are governed
by relevant legislation and the notice period is one month.
Employees on international assignments have notice periods of
three months.
Fixed remuneration
Managerial remuneration is based on a total cost-to-company
structure. Cost-to-company comprises a fixed cash portion,
compulsory benefits (medical aid and retirement fund
membership) and optional benefits. Market data is used to
benchmark salary levels and benefits. Salaries are normally
reviewed annually in March.
For all employees, performance-related payments have formed
an increasing proportion of total remuneration over time to
achieve business objectives and reward individual contribution.
All employees (executives, managers and general staff) are rated
on the basis of performance and potential and this is used to
influence performance-related remuneration
Rating and the consequent pay decision is done on an individual
basis. There is therefore a link between rating, measuring
individual performance and reward.
Short-term incentives
All staff participate in a performance bonus scheme. Individual
awards are based on a combination of business unit performance,
job level and individual performance. In keeping with the
remuneration philosophy, the bonus scheme seeks to attract and
retain high-performing managers.
As well as taking performance factors into account, the size of
the award is assessed in terms of market-related issues and pay
levels for each skill set, which may for instance be influenced by
the scarcity of skills in that area.
Long-term incentives
It is essential for the group to retain key skills over the longer
term. The group has put in place an equity growth scheme for
qualifying managers. Participation rights in such scheme are be
granted to qualifying managers in accordance with the rules of
the scheme approved by the board.
Retention agreements
As part of the group’s strategy to retain highly mobile and talented
employees, the group has selectively entered into agreements in
terms of which retention payments are made. Retention payments
have to be repaid should the individual concerned leave within a
stipulated period
Post-retirement benefits
Pension
Retirement benefits are typically provided on the same basis for
employees of all levels and are in line and full comply with the
Pension Reform Act 2004.
Remuneration for 2010
The amounts specified below represent the total remuneration
paid to executive and non-executive directors for the period
under review:
Group
Nmillion
Bank
Nmillion
Fees  sitting allowance 151 151
Executive compensation 568 568
Total 719 719
75
Corporate governance report
For the year ended 31 December 2010
The group will continue to ensure its remuneration policies and
practices remain competitive, incentivise performance and are
aligned across the group and with its values.
The audit committee
The role of the audit committee is defined by the Companies 
Allied Matters Act and includes making recommendations to the
board on financial matters. These matters include assessing the
integrity and effectiveness of accounting, financial, compliance
and other control systems. The committee also ensures effective
communication between internal auditors, external auditors, the
board and management.
The committee’s key terms of reference comprise various
categories of responsibilities and include the following:
- 	 review the audit plan with the external auditors with
	 specific reference to the proposed audit scope, and
	 approach to risk activities and the audit fee;
- 	 meet with external auditors to discuss the audit findings
	 and consider detailed internal audit reports with the
	 internal auditors;
- 	 annually evaluate the role, independence and effectiveness
	 of the internal audit function in the overall context of the
	 risk management systems;
- 	 review the accounting policies adopted by the group and
	 all proposed changes in accounting policies and practices;
- 	 consider the adequacy of disclosures;
- 	 review the significant differences of opinion between
	 management and internal audit;
- 	 review the independence and objectivity of the auditors;
	 and
- 	 all such other matters as are reserved to the audit
	 committee by the Companies  Allied Matters Act and the
	 Bank’s Articles of Association.
As specified in the Central Bank of Nigeria (CBN) Code of
Corporate Governance (“the CBN code”), the audit committee
members have recent and relevant financial experience.
Composition
The committee is made up of six members, three of whom are
non - executive directors while the remaining three members are
shareholders elected at the Annual General Meeting (AGM). The
committee, whose membership is stated below, as required by
the CBN code, is chaired by a shareholder representative.
As at 1 January 2010 the committee consisted of the following
persons:
Engr. Oluyomi Adeyemi – Wilson*	 Chairman
Mr. Sam Unuigbe**			 Member
Mr. Sam Cookey**			 Member
Mr. Moses Adedoyin**		 Member
Mrs. Oshuwa Gbadebo – Smith*		 Member
Mr. Waheed Adegbite*		 Member
*	 = Shareholders representative
**	= Non Executive Director
The shareholders re-elected the entire shareholder
representatives on the audit committee at the AGM held on 7
June 2010.
Members’ attendance at audit committee meetings during the
financial year ended 31 December 2010 is stated below:
Name Feb April July Oct
Engr. Oluyomi Adeyemi
– Wilson
Mr. Sam Unuigbe
Mr. Moses Adedoyin
Mrs. Oshuwa Gbadebo
– Smith
Mr. Sam Cookey
Mr. Waheed Adegbite
	= Attendance
A 	= Apology
Company secretary
It is the role of the company secretary to ensure the board
remains cognisant of its duties and responsibilities. In addition
to providing the board with guidance on its responsibilities,
the company secretary keeps the board abreast of relevant
changes in legislation and governance best practices. The
company secretary oversees the induction of new directors,
including subsidiary directors, as well as the ongoing training
of directors. All directors have access to the services of the
company secretary.
Stanbic IBTC Bank PLC Annual Report 2010 76
Annualreportand
financialstatements
Going concern
On the recommendation of the audit committee, the board
annually considers and assesses the going concern basis for the
preparation of the financial statements at the year end.
The board continues to view the company as a going concern for
the foreseeable future.
Management committees
The group has the following management committees:
Stanbic IBTC Group executive committee (EXCO)
Corporate and Investment Banking (CIB) Exco
Private and Business Banking (PBB) Exco
Wealth Exco
Credit committee
Risk committee
Business support Exco
Asset and liability committee (ALCO)
Risk management committee
IT steering committee (“program of works”)
Investment committee
Operational risk and compliance committee
Career management committee
New products committee
Relationship with shareholders
As an indication of its fundamental responsibility to create
shareholder value, effective and ongoing communication with
shareholders is seen as essential. In addition to the ongoing
engagement facilitated by the company secretary and the head of
investor relations, the group encourages shareholders to attend
the annual general meeting and other shareholder meetings
where interaction is welcomed. The chairman of the group’s audit
committee is available at the meeting to respond to questions
from shareholders.
Voting at general meetings is conducted either on a show of
hands or a poll depending on the subject matter of the resolution
on which a vote is being cast and separate resolutions are
proposed on each significant issue.
Dealing in securities
In line with its commitment to conduct business professionally
and ethically, the group has introduced policies to restrict the
dealing in securities by directors, shareholder representatives on
the audit committee and employees. A personal account trading
policy is in place to prohibit employees and directors from
trading in group securities during closed periods, which period
commences from 1 December to publication of final results.
Compliance with this policy is monitored on an ongoing basis.
Sustainability
Social and environmental responsibility remains an important part of
the group’s culture. The monitoring and reporting of sustainability
issues is still an evolving discipline within our organisation.
Social responsibility
As an African business, the group understands the challenges
and benefits of doing business in Africa, and owes its existence
to the people and societies within which it operates.
The group is committed therefore not only to the promotion
of economic development but also to the strengthening of civil
society and human well being.
The group is concentrating its social investment expenditure in
defined focus areas which currently include education in order to
make the greatest impact. These areas of focus will be subject to
annual revision as the countries socio-economic needs change.
The Bank during the year established a Unit to handle this issue .
Ethics and organisational integrity
The Code of Ethics rolled out in the bank in 2008 continued to
operate during 2010.
Breaches of the code
The bank on a number of occasions breached the requirement
that anticipatory approvals granted by board committees should
be ratified at a committee meeting held within 30 days of the
grant of such approval. However all such anticipatory approvals
were subsequently ratified by the relevant committee, albeit
outside of the specified time line.
77
Audit committee report
In compliance with the provisions of Section 359(3) to (6)
of the Companies  Allied Matters Act Cap C20 Laws of the
Federation of Nigeria 2004 the Committee considered the
Audited Financial Statements for the year ended 31 December
2010 together with the Management Controls Report from the
auditors and the bank’s response to this report at its meeting
held on 31 January 2011.
In our opinion, the scope and planning of the audit for the year
ended 31 December 2010 were adequate.
After due consideration, the Committee accepted the Report of
the Auditors that the Financial Statements were in accordance
with ethical practice and generally accepted accounting
principles and give a true and fair view of the state of the bank’s
financial affairs.
The Committee reviewed management’s response to the auditors
findings in respect of management matters and we and the
auditors are satisfied with management’s response thereto.
On a review of insider / related party transactions the committee
was satisfied with their status.
The Committee therefore recommended that the Audited
Financial Statements of the bank for the year ended 31 December
2010 and the auditor’s report thereon be presented for adoption
by the company at the Annual General Meeting.
The Committee also approved the provision made in the Financial
Statements in relation to the remuneration of the Auditors.
Eng. Oluyomi Adeyemi-Wilson
Chairman, Audit committee		
31 January 2011
Stanbic IBTC Bank PLC Annual Report 2010 78
Annualreportand
financialstatements
We believe that the audit evidence we have obtained is sufficient
and appropriate to provide a basis for our opinion. 		
Opinion	 					
In our opinion the accompanying financial statements give a
true and fair view of the state of the financial affairs of the bank
and the group at 31 December 2010 and of their profits and
cash flows for the year then ended in accordance with Nigerian
Statements of Accounting Standards, the Companies and Allied
Matters Act and the Banks and Other Financial Institutions Act.	
Report on other legal requirements
The Companies and Allied Matters Act and the Banks and Other
Financial Institutions Act require that in carrying out our audit we
consider and report to you on the following matters. 		
				
We confirm that:					
	
i)	 we have obtained all the information and explanations
	 which to the best of our knowledge and belief were
	 necessary for the purposes of our audit;		
	
ii)	 in our opinion proper books of account have been kept
	 by the bank, so far as appears from our examination of
	 those books;					
				
iii)	 the bank’s balance sheet and profit and loss account are in
	 agreement with the books of account;			
	
iv)	 our examination of loans and advances was carried out in
	 accordance with the Prudential Guidelines for licensed
	 banks issued by the Central Bank of Nigeria; 		
	
v)	 related party transactions and balances are disclosed
	 in Note 36 to the financial statements in accordance with
	 the Central Bank of Nigeria circular BSD/1/2004; 	
		
vi)	 the bank contravened certain sections of the Banks and
	 Other Financial Institutions Act during the year as explained
	 in Note 33 to the financial statements; and		
		
vii)	 except for the contraventions disclosed in Note 33 to the
	 financial statements, the bank has complied with the
	 requirements of the relevant circulars issued by the Central
	 Bank of Nigeria.					
		
	
Chartered Accountants				
Lagos, Nigeria 			 24 February 2011	
Report on the financial statements	
We have audited the accompanying separate and consolidated
financial statements of Stanbic IBTC Bank Plc (“the bank”)
and its subsidiaries (together,“the group”) which comprise the
balance sheets as of 31 December 2010 and the profit and loss
accounts and statements of cash flows for the year then ended
and a summary of significant accounting policies and other
explanatory notes.	 				
	
Directors’ responsibility for the financial statements	
The directors are responsible for the preparation and fair
presentation of these financial statements in accordance with
Nigerian Statements of Accounting Standards and with the
requirements of the Companies and Allied Matters Act and the
Banks and Other Financial Institutions Act. This responsibility
includes: designing, implementing and maintaining internal
controls relevant to the preparation and fair presentation of
financial statements that are free from material misstatement,
whether due to fraud or error; selecting and applying appropriate
accounting policies; and making accounting estimates that are
reasonable in the circumstances.				
Auditor’s responsibility	
Our responsibility is to express an independent opinion on the
financial statements based on our audit. We conducted our audit
in accordance with International Standards on Auditing. Those
standards require that we comply with ethical requirements and
plan and perform our audit to obtain reasonable assurance that
the financial statements are free from material misstatement.	
					
An audit involves performing procedures to obtain audit
evidence about the amounts and disclosures in the financial
statements. The procedures selected depend on the auditor’s
judgement, including the assessment of the risks of material
misstatement of the financial statements, whether due to fraud
or error. In making those risk assessments, the auditor considers
internal controls relevant to the entity’s preparation and fair
presentation of the financial statements in order to design audit
procedures that are appropriate in the circumstances, but not
for the purpose of expressing an opinion on the effectiveness
of the company’s internal control. An audit also includes
evaluating the appropriateness of accounting policies used
and the reasonableness of accounting estimates made by the
directors, as well as evaluating the overall presentation of the
financial statements.					
						
Report of the independent auditor
Report of independent auditor to members of Stanbic IBTC Bank PLC
79
The principal accounting policies adopted in the preparation
of these financial statements are set out below. These policies
have been consistently applied to all years presented, unless
otherwise stated.
a.	 Basis of preparation
These financial statements are the consolidated and separate
financial statements of Stanbic IBTC Bank Plc, a company
incorporated in Nigeria on 2 February 1989 and its subsidiaries
(hereinafter collectively referred to as “the group”). The financial
statements are prepared in compliance with Nigerian Statements
of Accounting Standards (SAS) issued by the Nigerian Accounting
Standards Board (NASB). The financial statements are presented
in the functional currency, Nigerian Naira (N), and prepared under
the historical cost convention as modified by the revaluation of
certain investment securities, property and equipment.
The preparation of financial statements in conformity with
Generally Accepted Accounting Principles in Nigeria requires
the use of estimates and assumptions that affect the reported
amounts of assets and liabilities, and disclosure of contingent
assets and liabilities at the date of the financial statements and
the reported amounts of revenues and expenses during the
reporting period. Although these estimates are based on the
directors’ best knowledge of current events and actions, actual
results may differ from those estimates.
b.	 Basis of consolidation
Subsidiaries undertaking, which are those companies in which
the group directly or indirectly, has interest of more than half
the voting rights or otherwise has power to control, have been
consolidated.Subsidiariesareconsolidatedfromthedateeffective
control is transferred to the group. Subsidiaries cease to be
consolidated from the date of disposal. All intercompany
transactions, balances and unrealised surpluses and deficits on
transactions between group companies have been eliminated.
Where necessary, accounting policies for subsidiaries have been
adjusted to ensure consistency with the policies adopted by the
group. Separate disclosure is made for non-controlling interest.
The acquisition method of accounting is used to account for the
acquisition of subsidiaries and other entities by the group. The
cost of an acquisition is measured as the market value of the
assets given, equity instruments issued and liabilities incurred or
assumed at the date of exchange, plus costs directly attributable
to the acquisition. Identifiable assets acquired, liabilities and
contigent liabilities assumed in a business combination are
measured at their fair values at the acquisition date, irrespective
of the extent of any minority interest. The excess of the cost
of acquisition over the fair value of the group’s share of the
identifiable net assets acquired is recorded as goodwill. If the
cost of acquisition is less than the fair value of the net assets of
the entities acquired, the difference is recognised directly in the
profit and loss account.
Inter-company transactions, balances and unrealised gains
on transactions between Group companies are eliminated.
Unrealised losses are also eliminated unless the transaction
provides evidence of impairment of the asset transferred.
c.	 Segment reporting
An operating segment is a component of the group engaged
in business activities, whose operating results are regularly
reviewed by management in order to make decisions about
resources to be allocated to segments and assessing segment
performance. The group’s identification of segments and the
measurement of segment results is based on the group’s internal
reporting to management. It represents the classification of the
group’s activities in segments that reflect the risk and return
of the group’s product offerings in different product markets.
Additional information relating to products and services,
geographic areas and major customers is provided.
Segments whose total revenue (internal and external), absolute
profit or loss or total assets are 10% or more of the group total,
are reported separately. Transactions between segments are
priced at market-related rates.
Statement of accounting policies
Stanbic IBTC Bank PLC Annual Report 2010 80
Annualreportand
financialstatements
d.	 Foreign currency transactions
Transactions denominated in foreign currency are converted into
Naira at the rate of exchange ruling at the date of the transaction.
Foreign currency balances are translated at the rate of exchange
prevailing at the balance sheet date or, where appropriate, at
the related forward exchange rate. Exchange differences are
included in the profit and loss account in the period in which
they arise.
e	 Recognition of interest income and expense
i. 	 Interest income and expense are recognised in the profit
	 and loss account for all interest bearing instruments on
	 an accrual basis except for interest income overdue for
	 more than 90 days, which is suspended and recognised only
	 to the extent that cash is received.
ii. 	 Income accruing on advances under finance lease is
	 amortised over the lease period to achieve a constant rate
	 of return on the outstanding net investment. Rental income
	 on equipment leased to customers is recognised on a
	 straight line basis over the lease term.
iii. 	 Income earned on bonds and guarantees are amortised
	 over the life of the guarantee, while other fees are
	 recognised as commissions in the period in which they
	 occur.
f.	 Provision against credit risk
Provision is made in accordance with the Statement of Accounting
Standard for Banks and Non-Bank Financial Institutions, (SAS
10) issued by the Nigerian Accounting Standards Board, and
Prudential Guidelines issued by the Central Bank of Nigeria. For
each account that is not performing in accordance with the terms
of the related facility, provision is made as follows:
Interest and/or principal
outstanding for over:
Classification Minimum
provision
90 days but less than 180 days Substandard 10%
180 days but less than 360 days Doubtful 50%
Over 360 days Lost 100%
When a loan is deemed uncollectible, it is written off against
the related provision for impairments. Subsequent recoveries
are credited to the provision for loan losses in the profit and
loss account. If the amount of the impairment subsequently
decreases due to an event occuring after the write-down, the
release of the provision is credited as a reduction of the provision
for impairment in the profit and loss account.
A minimum of 1% general provision on performing loans is made
in accordance with the prudential guidelines.
g.	 Investment securities	 			
		
The group categorises its investment securities as short term
investments and long term investments. Investment securities
are initially recognised at cost and management determines
classification at initial investment. 			
			
i.	 Short term investments
	 Short-term investments are investments held temporarily in
	 place of cash and which can be converted into cash when
	 current financing needs make such conversion desirable.
	 They include debt and equity securities intended to be held
	 for a period not exceeding one year.			
		
	 Short-term investments in marketable securities are
	 subsequently re-measured at net realisable value. The
	 gain/loss on revaluation is credited/charged to profit and
	 loss account for the period.			
		
	 Other short-term investments are subsequently re-
	 measured at the lower of cost and market value (quoted
	 bid prices). The amount by which cost exceeds market
	 value (unrealized loss) is charged to the profit and loss
	 account for the period.				
	
ii.	 Long term investments				
	 Investment securities intended to be held for an indefinite
	 period of time, or until maturity, and which may be sold
	 in response to needs for liquidity or change in market
	 rates, exchange rates or equity prices are classified as long
	 term investments. Long-term investments may include
	 debt and equity securities.
81
	 Long-term investments in marketable securities are carried
	 at lower of cost and net realizable value. Unrealised losses
	 are charged to the profit and loss account. Other long term
	 investments are carried at cost less impairment. An
	 investment is impaired if its carrying amount is greater than
	 its estimated recoverable amount.
	 Any discount or premium arising on acquisition of bonds is
	 included in the original cost of the investment and is
	 amortised over the period of purchase to maturity.	
				
	 Interest earned whilst holding investment securities is
	 reported as interest income. Dividends receivable are
	 included separately in dividend income when a dividend is
	 declared. A change in market value of investment
	 securities is not taken into account unless it is considered
	 to be permanent.				
						
h.	 Investments in subsidiaries	 		
			
Investments in subsidiaries are carried in the bank’s balance sheet
at cost less provisions for impairment losses. Where, in the opinion
of the directors, there has been impairment in the value of an
investment, the loss is recognised as an expense in the period in
which the impairment is identified. On disposal of an investment,
the difference between the net disposal proceeeds and the
carrying amount is charged to the profit and loss account.	
	
i.	 Property and equipment
All categories of fixed assets are initially recorded at historical
cost. They are subsequently stated at historical cost less
depreciation. Historical cost includes expenditure that is directly
attributable to the acquisition of the assets. Subsequent costs
are included in the asset’s carrying amount or recognised as
a separate asset, as appropriate, only when it is probable that
future economic benefits associated with the item flow to the
company and the cost of the item can be measured reliably. All
other repairs and maintenance are charged to the profit and loss
account during the financial period in which they are incurred.
Construction cost in respect of offices is carried at cost as work
in progress. On completion of construction, the related amounts
are transferred to the appropriate category of property and
equipment. No depreciation is charged until the assets are put
into use.
Depreciation is calculated on a straight line basis to write-off fixed
assets and equipment on lease over their estimated useful life. The
basis of calculation for each class of asset are set out below:
j.	 Leases
Investments under finance lease arrangements are recorded
as receivables at an amount equal to the net investment in the
lease i.e. the present value of the lease payments including any
residual value payable on the lease. The difference between
the gross receivable and the present value of the receivable is
recognised as unearned income. Income accruing on the lease is
amortised over the lease period on a basis reflecting a constant
periodic rate of return on the outstanding net investment.
Leases in which a significant portion of the risks and rewards of
ownership are retained by the bank are classified as operating
leases, and accounted for by the bank as an item of fixed asset.
The depreciation of these assets is on the basis of the bank’s
normal depreciation policy for the various classes of assets
leased out. The periodic lease rentals receivable are treated as
rental income in the income statement during the period they
occur; while initial direct costs incurred are written off to the
income statement in the period incurred.
k.	 Goodwill
Goodwill represents the excess of the cost of an acquisition
over the group’s interest in the net fair value of the identifiable
assets, liabilities and contingent liabilities of the acquired entity,
associate or joint venture at the date of acquisition. Goodwill
arising on the acquisition of an entity is reported in the balance
sheet as an intangible asset.
Leasehold land and building Minimum of 6 years or
life of the lease
Buildings 25 yrs
Motor vehicles 4 yrs
Furniture, fittings  equipments 4 yrs
Computer hardware 3 yrs
Computer software 3 yrs
Leasehold assets, machinery
and equipment
Over the life of the lease
Statement of accounting policies
Stanbic IBTC Bank PLC Annual Report 2010 82
Annualreportand
financialstatements
Goodwill arising on acquisitions is allocated to cash generating
units and tested annually for impairment. Negative goodwill is
recognised as income in the period in which it arises. Where
there has been impairment in the value of goodwill, the loss is
identified in the year in which the impairment was made. Gains or
losses on the disposal of an entity include the carrying amount of
goodwill relating to the entity sold.
l.	 Cash and cash equivalents
Cash comprises cash on hand and demand deposits denominated
in Naira and foreign currencies. Cash equivalents are short-term,
highly liquid instruments which are:
(a) 	 readily convertible into cash, whether in local or foreign
	 currency; and
(b) 	 so close to their maturity dates as to present
	 insignificant risk of changes in value as a result of changes
	 in interest rates.
m.	 Provisions, contingent liabilities and contigent assets
Provisions are liabilities that are uncertain in timing or amount.
Provisions are recognised when: the group has a present legal or
constructive obligation as a result of past events; it is more likely
than not that an outflow of resources will be required to settle
the obligation; and the amount has been reliably estimated.
A contingent liability is a possible obligation that arises from
past events and whose existence will be confirmed only by the
occurrence or non-occurrence of one or more uncertain future
events not wholly within the control of the Group or the Group
has a present obligation as a result of past events but is not
recognised because it is not likely that an outflow of resources
will be required to settle the obligation; or the amount cannot be
reliably estimated.
A contingent asset is a possible asset that arises from past events
and whose existence will be confirmed only by the occurrence
or non-occurrence of one or more uncertain future events not
wholly within the control of the Group.
n.	 Retirement benefits
The group operates a defined contribution pension scheme in line
with the provisions of the Pension Reform Act, with contributions
based on the sum that consists of employees basic salary, housing
and transport allowance in the ratio 7.5% by the employee and
7.5% by the employer.
The group’s contributions to the scheme are charged to the
profit and loss account in the period to which they relate, and
the scheme’s assets are held by pension fund administrators on
behalf of the beneficiary staff.
o.	 Deferred taxation				
			
Deferred income tax is provided in full using the liability method
on all temporary differences arising between the tax bases
of assets and liabilities and their carrying values for financial
reporting purposes. Deferred income tax is determined using
tax rates enacted or substantively enacted at the balance sheet
date and are expected to apply when the deferred income tax
liability is settled. Deferred income tax assets are recognised only
to the extent that it is probable that future taxable profits will be
available against which the temporary difference can be utilised.	
						
p.	 Borrowed funds	 			
Borrowed funds are recognised initially at their issue proceeds
and subsequently stated at cost less any repayments.		
			
Transaction costs where immaterial, are recognized immediately in
the profit and loss account. Where transaction costs are material,
they are capitalized and amortised over the life of the loan.	
						
Interest paid on borrowings is recognised in the profit and loss
account for the year.					
	
q.	 Ordinary share capital				
				
i.	 Share issue costs				
	 Incremental costs directly attributable to the issue of new
	 shares or to the acquisition of a business are shown in
	 equity as a deduction, net of tax, from the proceeds.
83
Statement of accounting policies
					
ii. 	 Dividends on ordinary shares			
	 Dividends on ordinary shares are appropriated from
	 revenue reserve in the period they are approved by the
	 bank’s shareholders.				
			
	 Dividends for the year that are approved by the share
	 holders after the balance sheet date are dealt with in the
	 subsequent events note.				
			
	 Dividends proposed by the directors’ but not yet approved
	 by members are disclosed in the financial statements in
	 accordance with the requirements of the Companies and
	 Allied Matters Act.				
					
r.	 Off balance sheet transactions			
						
Off-balancesheetengagementscomprisedirectcreditsubstitutes
and transaction related contingencies such as guarantees,
acceptances, bid bonds, performance guarantees and forward
contracts which the bank is a party to in its normal course of
business. Income earned on bonds and guarantees are amortised
over the life of the guarantee, while other fees are recognised as
commissions in the period in which they occur.		
				
s.	 Sale of loans or securities	 		
				
A sale of loans or securities without recourse to the seller is
accounted for as a disposal and the assets excluded from the
balance sheet.					
						
Profits or losses on sale of loans or securities without recourse
to the seller is recognised by the seller when the transaction
is completed.					
		
The Group regards a sale of loans or securities as without
recourse, if it satisfies all the following conditions. Any sale not
satisfying these conditions will be regarded as with recourse.	
			
- 	 control over the economic benefits of the asset must be
	 passed on to the buyer;			
- 	 the seller can reasonably estimate any outstanding cost;
	 and						
- 	 there must not be any repurchase obligations.		
					
A sale or transfer of loans or securities with recourse where there
is an obligation to, or an assumption of, repurchase is not treated
as a sale, and the asset remains in the Group’s balance sheet, with
any related cash received recognised as a liability.		
				
Profit arising from sale or transfer of loan or securities
with recourse to the seller is amortised over the remaining
life. However, losses are recognised as soon as they can be
reasonably estimated.				
					
Where there is no obligation to or assumption of repurchase, the
sale should be treated as a disposal and the asset excluded from
the balance sheet, and any contingent liability disclosed.	
					
t.	 Fiduciary activities				
			
Where the group acts in a fiduciary capacity such as nominee,
assets and liabilities arising there on together with the related
undertakings to return such assets to the customers are excluded
from the financial statements.
Stanbic IBTC Bank PLC Annual Report 2010 84
Annualreportand
financialstatements
u.	 Fees and commission				
			
Fees and commission are generally recognised on an accrual basis
when the service has been provided. 			
					
Commissions and fees arising from negotiating, or participating
in the negotiation of a transaction for a third party such as
establishing letters of credit, arrangement of the acquisition of
shares or other securities or the purchase or sale of businesses
are recognised on completion of the underlying transaction.
Portfolio and other management advisory and services fees are
recognised based on the applicable service contracts, usually on
a time - apportionment basis. Asset management fees related
to investment funds are recognised rateably over the period the
service is provided.					
		
v.	 Dividend
Proposed dividends on ordinary shares are disclosed as a note to
the financial statements in the period in which they are proposed
by the directors, amounts ratified for dividend payment by the
shareholders are recognised as charge against the distributable
reserve in the period in which the payment become obligatory.
w.	 Income taxation
Income tax expense is the aggregate of the charges to the
profit and loss account in respect of current income tax,
education tax, information technology development tax and
deferred income tax.
Current income tax is the amount of income tax payable on the
taxable profit for the period determined in accordance with
the Company Income Tax Act (CITA). Education tax is assessed
at 2% of the assessable profits whilst information technology
development tax is assessed at 1% of profit before tax.
85
For the year ended 31 December 2010
Note
Group
2010
Nmillion
Group
2009
Nmillion
Bank
2010
Nmillion
Bank
2009
Nmillion
Gross earnings 56,745 59,781 48,934 52,850
Interest and similar income 3 34,359 40,920 33,808 39,952
Interest and similar expense 4 (7,989) (15,813) (8,012) (15,870)
Net interest income 26,370 25,107 25,796 24,082
Fee and commission income 5 19,345 13,852 10,531 7,532
Fee and commission expense (362) (145) (295) (145)
Net fee and commission income 18,983 13,707 10,236 7,387
Foreign exchange income 2,658 4,169 2,658 4,149
Income from investments 6 132 274 1,917 1,034
Other income 251 566 20 183
Operating income 48,394 43,823 40,627 36,835
Operating expenses 7 (34,246) (28,623) (29,820) (24,836)
Provision for losses 14 (620) (4,858) (620) (4,858)
Profit before tax 13,528 10,342 10,187 7,141
Taxation 8 (4,073) (2,204) (2,376) (883)
Profit after tax 9,455 8,138 7,811 6,258
Non-controlling interest 26 (653) (490) - -
Profit attributable to the group/bank 8,802 7,648 7,811 6,258
Appropriated as follows:
Transfer to statutory reserve 28 1,450 1,147 1,172 939
Transfer to retained earnings 28 7,352 6,501 6,639 5,319
8,802 7,648 7,811 6,258
Earnings per share (basic/diluted) 32 50 k 43 k 42 k 33 k
Dividend per share (proposed/paid) 31 39 k 30 k 39 k 30 k
The accounting policies on pages 79 to 84 and notes on pages 88 to 118 form an integral part of these financial statements.
Profit and loss accounts
Stanbic IBTC Bank PLC Annual Report 2010 86
Annualreportand
financialstatements
Balance sheets
As at 31 December 2010
Note
Group
2010
Nmillion
Group
2009
Nmillion
Bank
2010
Nmillion
Bank
2009
Nmillion
Assets
Cash and balances with central banks 9 10,048 7,772 10,048 7,768
Treasury bills 10 12,428 11,378 12,428 11,378
Due from other banks 11 88,659 76,954 87,439 75,913
Loans and advances to customers 12 163,952 110,508 164,203 110,967
Advances under finance lease 15 13,502 9,377 13,502 9,377
Investment securities 16 47,585 71,462 37,689 62,358
Investment in subsidiaries 17 - 1 1,924 1,925
Deferred tax assets 25 939 594 939 594
Other assets 18 16,176 25,566 13,683 24,453
Property and equipment 20 31,252 26,878 30,757 26,267
Total assets 384,541 340,490 372,612 331,000
Liabilities
Customer deposits 21 186,466 169,200 187,595 170,411
Due to other banks 22 56,152 38,334 56,152 38,334
Other borrowings 23 18,272 12,647 18,272 12,647
Other liabilities 24 34,220 34,052 30,983 31,319
Current income tax 8 4,197 4,660 2,051 2,916
Deferred tax liabilities 25 108 100 - -
Total liabilities 299,415 258,993 295,053 255,627
Equity
Ordinary share capital 27 9,375 9,375 9,375 9,375
Share premium account 27 47,469 47,469 47,469 47,469
Revaluation reserve 28 93 - - -
Retained earnings 28 12,335 10,608 7,430 6,416
Other reserves 28 14,478 13,028 13,285 12,113
Attributable to equity holders of the parent 83,750 80,480 77,559 75,373
Non-controlling interest 26 1,376 1,017 - -
Total equity 85,126 81,497 77,559 75,373
Total equity and liabilities 384,541 340,490 372,612 331,000
Acceptances and guarantees 30 14,861 16,198 14,861 16,198
The accounting policies on pages 79 to 84 and notes on pages 88 to 118 form an integral part of these financial statements and were
approved by the Board of Directors on 02 February 2011 and signed on its behalf by:
Atedo N. A. Peterside OON
Chairman
Chris Newson
Chief Executive Officer
87
Statement of cash flows
For the year ended 31 December 2010
Note
Group
2010
Nmillion
Group
2009
Nmillion
Bank
2010
Nmillion
Bank
2009
Nmillion
Operating activities
Cash used in operations 37 (22,771) (49,209) (26,553) (49,361)
Interest received 3 34,359 40,920 33,808 39,952
Interest paid 4 (7,989) (15,813) (8,012) (15,870)
VAT paid (59) (116) (59) (116)
Tax paid 8 (4,734) (3,931) (3,437) (1,839)
Net cash used in operating activities (1,194) (28,149) (4,253) (27,234)
Financing activities
Dividend paid to shareholders 28 (5,919) (7,647) (5,625) (7,500)
Proceeds from long term loan 5,625 446 5,625 446
Net cash used in financing activities (294) (7,201) - (7,054)
Investing activities
Disposal of long term investment, net 24,262 10,283 24,875 8,749
Dividend received 6 103 169 1,886 975
Additional investment in subsidiaries - - - (106)
Purchase of property, plant and equipment 20 (11,972) (14,941) (11,724) (14,452)
Proceeds from sale of property and equipment 3,572 268 3,518 86
Net cash generated from/(used in) investing activities 15,965 (4,221) 18,555 (4,748)
Increase/ (decrease) in cash and cash equivalents 14,477 (39,571) 14,302 (39,036)
Analysis of changes in cash and cash equivalents
At start of year 37 94,816 134,387 93,771 132,807
At end of year 37 109,293 94,816 108,073 93,771
Increase/ (decrease) in cash and cash equivalents 14,477 (39,571) 14,302 (39,036)
Stanbic IBTC Bank PLC Annual Report 2010 88
Annualreportand
financialstatements
Notes to the financial statements
For the year ended 31 December 2010
1.	 General information
Stanbic IBTC Bank Plc (“the bank) was incorporated as a
private limited liability company on 2 February 1989, granted a
merchant banking license on 3 February 1989, and commenced
operations on 1 March 1989. Its merchant banking license was
converted into universal banking license in January 2002,
pursuant to the universal banking scheme of the Central Bank
of Nigeria. The bank’s shares are quoted on the Nigerian Stock
Exchange and held by both foreign and Nigerian individuals and
corporate investors.
The group comprises the bank and its subsidiaries undertaking
(‘’the group’’). The group provides corporate and investment
banking, stockbroking, asset management, personal and business
banking services.
The bank, which was incorporated as Investment Banking  Trust
Company Plc (“IBTC”), merged with Chartered Bank Plc and
Regent Bank Plc on 19 December 2005, and changed its name
to IBTC Chartered Bank Plc. On 24 September 2007, the bank
merged with Stanbic Bank Nigeria Limited (“SBN”), a wholly
owned subsidiary of Stanbic Africa Holdings Limited (‘’SAHL’’).
SAHL, a subsidiary of Standard Bank Group (“SBG”) of South
Africa, in accordance with the scheme of merger, acquired
majority shareholding (50.77%) in the bank whose name was
subsequently changed to Stanbic IBTC Bank Plc.
The Bank has six subsidiaries as analysed below:
Stanbic IBTC Ventures Limited (“SIVL”)		 100%
Stanbic IBTC Asset Management Limited (“SIAML”)	 100%
Stanbic IBTC Pension Managers Limited (“SIPML”)	 70.59%
Stanbic Nominees Nigeria Limited (“SNNL”)		 100%
Stanbic IBTC Stockbrokers Limited (“SISL”)		 100%
Stanbic IBTC Trustees Limited (“SITL”)		 100%
2.	 Segment analysis
The Directors confirm that the financial statements comply
with the information reported to the bank’s Board of Directors,
and top management for the purposes of evaluating units’ past
performance as it relates to performance of the bank and its
subsidiaries during the period.
The group is structured on the basis of products and services, and
the segments have been identified on this basis. The principal
business units in the group are as follows:
Business units:
Personal  Business Banking
(PBB)
Corporate  Investment
Banking (CIB)
Wealth
	 -	 Banking and other financial services to individual customers and small-to-medium-sized
		 enterprises.
-	 Mortgage lending – Provides residential accommodation loans to mainly personal market
	 customers.
-	 Instalment sale and finance leases – Provides instalments finance to personal market
	 customers and finance of vehicles and equipment in the business market.
-	 Card products – Provides credit and debit card facilities for individuals and businesses.	
-	 Transactional and lending products – Transactions in products associated with the various
	 points of contact channels such as ATMs, internet, telephone banking and branches.
	 This includes deposit taking activities, electronic banking, cheque accounts and other
	 lending products coupled with debit card facilities to both personal and business market
	 customers.	 	
	 -	 Corporate and investment banking services to larger corporates, financial institutions and
		 international counterparties.
-	 Global markets – includes foreign exchange, fixed income, interest rates and equity trading.
-	 Transactional products and services – includes transactional banking and investor services.
-	 Investment banking – includes project finance, structured finance, equity investments,
	 advisory, corporate lending, primary markets acquisition and leverage finance and
	 structured trade finance.
	 -	 The wealth group is made up of the bank’s subsidiaries, whose activities involve investment
		 management, portfolio management, unit trust/funds management, trusteeship, and pension
		 fund management and administration.
89
Segment analysis (continued)
The group’s operations by major operating segment during the period is contained below:	
2010
Corporate 
Investment
Banking
Personal 
Business
Banking
Wealth Elimination Group
Nmillion Nmillion Nmillion Nmillion Nmillion
Total revenue:
Derived from external customers 33,890 14,204 8,651 - 56,745
Derived from other business segments 560 121 20 (701) -
Total revenue 34,450 14,325 8,671 (701) 56,745
Total cost:
Interest expense 5,976 2,089 - (76) 7,989
Risk and other asset provisions (513) 1,133 - - 620
Other operating expenses 18,320 12,532 4,381 (625) 34,608
Total cost 23,783 15,754 4,381 (701) 43,217
Profit before tax 10,667 (1,429) 4,290 - 13,528
Tax (3,106) 429 (1,396) - (4,073)
Profit after tax 7,561 (1,000) 2,894 - 9,455
Segment assets 254,788 122,016 10,771 (3,034) 384,541
Segment liabilities 200,399 96,498 3,899 (1,381) 299,415
Net asset 54,389 25,518 6,872 (1,653) 85,126
Notes to the financial statements
For the year ended 31 December 2010
Stanbic IBTC Bank PLC Annual Report 2010 90
Annualreportand
financialstatements
2009
Corporate 
Investment
Banking
Personal 
Business
Banking
Wealth Elimination Group
Nmillion Nmillion Nmillion Nmillion Nmillion
Total revenue:
Derived from external customers 39,478 13,439 6,864 - 59,781
Derived from other business segments 574 832 55 (1,461) -
Total revenue 40,052 14,271 6,919 (1,461) 59,781
Total cost:
Interest expense 12,974 2,953 - (114) 15,813
Risk and other asset provisions 3,820 1,038 - - 4,858
Other operating expenses 17,477 9,154 3,484 (1,347) 28,768
Total cost 34,271 13,145 3,484 (1,461) 49,439
Profit before tax 5,781 1,126 3,435 - 10,342
Tax (810) (304) (1,090) - (2,204)
Profit after tax 4,971 822 2,345 - 8,138
Segment assets 193,365 142,721 9,159 (4,755) 340,490
Segment liabilities 161,173 97,618 3,033 (2,831) 258,993
Net asset 32,192 45,103 6,126 (1,924) 81,497
All transactions between business units were conducted at arms length. Internal charges and transfer pricing adjustments are reflected in the
performance of each segment. The bank operates in a single geographical location, thus no segmentation based on geographical location is
presented in this financial statement.
91
Group
2010
Nmillion
Group
2009
Nmillion
Bank
2010
Nmillion
Bank
2009
Nmillion
3 Interest and similar income
Placements 3,686 4,602 3,686 4,602
Treasury bills and investment securities 10,395 12,302 10,278 12,083
Loans and advances 18,306 22,862 17,872 22,113
Advances under finance leases 1,972 1,154 1,972 1,154
34,359 40,920 33,808 39,952
Interest income earned in Nigeria 34,183 40,074 33,632 39,110
Interest income earned outside Nigeria 176 846 176 842
34,359 40,920 33,808 39,952
4 Interest and similar expense
Current accounts 590 387 667 558
Savings accounts 248 102 248 102
Time deposits 5,561 12,433 5,507 12,319
Inter-bank takings 1,036 1,787 1,036 1,787
Borrowed funds 554 1,104 554 1,104
7,989 15,813 8,012 15,870
Interest expense paid outside Nigeria amounted to Group N0.85 billion (2009: N1.10 billion) and Bank N0.85 billion
(2009: N1.10 billion).
5 Fees and commission income
Credit related fees 2,902 2,553 2,902 2,553
Commission on turnover 1,904 753 1,904 753
Commission on off-balance sheet transactions 170 184 170 184
Letters of credit commissions and fees 388 620 388 620
Facility management fee 12,267 8,234 3,552 1,914
Other fees and commissions 1,714 1,508 1,615 1,508
19,345 13,852 10,531 7,532
Notes to the financial statements
For the year ended 31 December 2010
Stanbic IBTC Bank PLC Annual Report 2010 92
Annualreportand
financialstatements
Group
2010
Nmillion
Group
2009
Nmillion
Bank
2010
Nmillion
Group
2009
Nmillion
6 Income from investments
Dividend income 103 169 1,886 975
Profit on sale of securities - - - 28
Other investment income 23 74 23 -
Rental income 6 31 8 31
132 274 1,917 1,034
7 Operating expenses
Staff costs (note 35) 14,898 13,469 13,072 11,790
Depreciation (note 20) 4,034 2,567 3,718 2,267
Auditors’ remuneration 135 138 103 104
Directors’ emoluments (note 35) 720 788 720 753
(Profit)/ loss on disposal of property
and equipment
(8) 4 (2) 3
Other operating expenses 14,467 11,657 12,209 9,919
34,246 28,623 29,820 24,836
8 Taxation
Charge
Current tax 3,328 3,231 1,721 2,024
Education tax 165 207 60 142
Technology tax 71 103 71 71
Income tax charge 3,564 3,541 1,852 2,237
Under/(over) provision in prior years 720 (722) 720 (722)
Deferred tax (note 25) (360) (830) (345) (830)
Charge for the year 3,924 1,989 2,227 685
Withholding tax charge 149 215 149 198
4,073 2,204 2,376 883
Payable
At start of year 4,660 5,821 2,916 3,240
Tax paid (4,734) (3,931) (3,437) (1,839)
Income tax charge 3,564 3,541 1,852 2,237
Reclassification to deferred tax (13) (49) - -
Under/(over) provision in prior years 720 (722) 720 (722)
At end of year 4,197 4,660 2,051 2,916
93
Group
2010
Nmillion
Group
2009
Nmillion
Bank
2010
Nmillion
Bank
2009
Nmillion
9 Cash and balances with Central Bank
Cash 7,367 4,020 7,367 4,016
Operating account with Central Bank 839 2,464 839 2,464
Included in cash and cash equivalents 8,206 6,484 8,206 6,480
Mandatory reserve deposits with Central Bank 1,842 1,288 1,842 1,288
10,048 7,772 10,048 7,768
Mandatory reserve deposits are not available for use in the group’s day to day operations.
10 Treasury bills
Treasury bills 12,428 11,378 12,428 11,378
Included in Treasury bills are bills amounting to N9.38 billion (2009: N4.31billion) held by third parties as collateral for various
transactions.
11 Due from other banks
Current balances with banks within Nigeria 1,293 1,113 73 72
Current balances with banks outside Nigeria 20,524 20,750 20,524 20,750
Placements with banks and discount houses 66,842 55,091 66,842 55,091
88,659 76,954 87,439 75,913
Notes to the financial statements
For the year ended 31 December 2010
Balances with banks outside Nigeria include N5.3 billion (2009: N8.32 billion), which represents the Naira value of foreign currency bank
balances held on behalf of customers in respect of letters of credit transactions. The corresponding liability is included in other liabilities. The
amount is not available for the day to day operations of the bank.
Included in placements with banks and discount houses are placements with banks within Nigeria of N32.4 billion (2009: N29.2 billion).
Stanbic IBTC Bank PLC Annual Report 2010 94
Annualreportand
financialstatements
Group
2010
Nmillion
Group
2009
Nmillion
Bank
2010
Nmillion
Bank
2009
Nmillion
12 Loans and advances
Overdrafts 26,920 28,531 26,920 28,531
Term loans 145,753 57,334 146,004 57,793
Others 71 37,726 71 37,726
172,744 123,591 172,995 124,050
Loan loss provision (note 13a) (7,322) (11,574) (7,322) (11,574)
Interest in suspense (note 13b) (1,470) (1,509) (1,470) (1,509)
163,952 110,508 164,203 110,967
Analysis by performance:
Performing 160,841 105,889 161,092 106,348
Non-performing:
- substandard 420 859 420 859
- doubtful 8,796 11,289 8,796 11,289
- lost 2,687 5,554 2,687 5,554
172,744 123,591 172,995 124,050
Analysis by maturity:
0–30 days 44,176 42,217 44,176 42,218
1-3 months 42,907 45,594 42,907 45,594
3-6 months 11,874 3,762 12,125 3,762
6-12 months 7,756 10,843 7,756 10,843
Over 12 months 66,031 21,175 66,031 21,633
172,744 123,591 172,995 124,050
Analysis by security:
Secured against real estate 24,779 13,945 24,779 13,945
Secured by shares of quoted companies 920 1,394 920 1,394
Otherwise secured 40,099 50,315 40,099 50,315
Unsecured 106,946 57,937 107,197 58,396
172,744 123,591 172,995 124,050
95
b. Movement in interest-in-suspense
At start of year 1,509 1,328 1,509 1,328
Suspended during the year 1,954 1,741 1,954 1,741
Amounts written back (625) (459) (625) (459)
Amounts written off (1,368) (1,101) (1,368) (1,101)
At end of year 1,470 1,509 1,470 1,509
Summary:
- General provision 1,643 1,068 1,643 1,068
- Specific provision 5,679 10,506 5,679 10,506
- Interest in suspense 1,470 1,509 1,470 1,509
8,792 13,083 8,792 13,083
Notes to the financial statements
For the year ended 31 December 2010
Group
2010
Nmillion
Group
2009
Nmillion
Bank
2010
Nmillion
Bank
2009
Nmillion
13 Loan loss provision and interest in suspense
a. Movement in loan loss provision
At start of year
- non-performing 10,506 8,103 10,506 8,103
- performing 1,068 960 1,068 960
11,574 9,063 11,574 9,063
Additional provision
- non-performing 2,958 6,123 2,958 6,123
- performing 575 108 575 108
Provision no longer required (3,616) (2,401) (3,616) (2,401)
Reinstatement of provision previously written off - 31 - 31
Reclassification to finance lease (165) - (165) -
Amounts written off (4,004) (1,350) (4,004) (1,350)
(4,252) 2,511 (4,252) 2,511
At end of year
- non-performing 5,679 10,506 5,679 10,506
- performing 1,643 1,068 1,643 1,068
7,322 11,574 7,322 11,574
Stanbic IBTC Bank PLC Annual Report 2010 96
Annualreportand
financialstatements
Group
2010
Nmillion
Group
2009
Nmillion
Bank
2010
Nmillion
Bank
2009
Nmillion
14 Provision for losses
The charge for the year is analysed as follows:
Loans and advances - specific 2,958 6,123 2,958 6,123
Loans and advances - general 575 108 575 108
Advances under finance lease - specific 856 40 856 40
Advances under finance lease - general 48 48 48 48
Recoveries/provision no longer required:
- Loans and advances (3,616) (2,401) (3,616) (2,401)
- Advances under finance lease (305) - (305) -
Recovery on previously written-off accounts (522) (269) (522) (269)
Bad debt written off - 25 - 25
Provision for diminution of investments (206) 986 (206) 881
Provision for other known losses 832 198 832 303
620 4,858 620 4,858
Annualreportand
financialstatements
97
Group
2010
Nmillion
Group
2009
Nmillion
Bank
2010
Nmillion
Bank
2009
Nmillion
15 Advances under finance lease
Gross investment 17,730 11,974 17,730 11,974
Less: Unearned income (3,332) (2,465) (3,332) (2,465)
Net investment 14,398 9,509 14,398 9,509
Less: total provision (896) (132) (896) (132)
13,502 9,377 13,502 9,377
Analysis by performance:
Performing 12,064 8,381 12,064 8,381
Non-performing:
- substandard 1,079 905 1,079 905
- doubtful 1,194 212 1,194 212
- lost 61 11 61 11
14,398 9,509 14,398 9,509
Analysis by maturity:
0-30 days 1,150 145 1,150 145
1-3 months 975 776 975 776
3-6 months 442 13 442 13
6-12 months 408 982 408 982
Over 12 months 11,423 7,593 11,423 7,593
14,398 9,509 14,398 9,509
Movement in advances under finance lease provision
At start of year
- non-performing 40 - 40 -
- performing 92 44 92 44
132 44 132 44
Additional provision:
- non-performing 856 40 856 40
- performing 48 48 48 48
Reclassification from loans and advances 165 - 165 -
Provision no longer required (305) - (305) -
764 88 764 88
At end of year
- non-performing 756 40 756 40
- performing 140 92 140 92
896 132 896 132
Notes to the financial statements
For the year ended 31 December 2010
Stanbic IBTC Bank PLC Annual Report 2010 98
Annualreportand
financialstatements
Group
2010
Nmillion
Group
2009
Nmillion
Bank
2010
Nmillion
Bank
2009
Nmillion
16 Investment securities
a. Investment securities comprise:
Long term investments:
Debt securities:
- Listed 38,695 62,282 36,543 61,247
- Unlisted 27 27 27 27
Equity securities:
- Listed 1,591 1,792 - -
- Unlisted 1,794 2,175 1,794 1,965
42,107 66,276 38,364 63,239
Provisions for diminution in value (675) (986) (675) (881)
41,432 65,290 37,689 62,358
Short term investments:
Debt securities:
- Listed - - - -
- Unlisted 6,153 6,172 - -
6,153 6,172 - -
Total investment securities 47,585 71,462 37,689 62,358
b. Listed long term debt securities comprise:
Federal Government of Nigeria (FGN) bonds (market value:
Group - N29.97 billion; Bank - N27.76 billion)
27,457 46,545 26,009 46,010
Asset Management Corporation of Nigeria (AMCON) bonds 13 - 13 -
Other bonds 11,225 15,737 10,521 15,237
38,695 62,282 36,543 61,247
Movement in long term investments
At start of year 65,290 75,977 62,358 71,406
Additions 17,330 49,773 15,679 49,773
Redemption of long term bonds (19,145) (31,455) (19,145) (31,455)
Provision for diminution in value 206 (986) 206 (881)
Disposals (22,249) (28,019) (21,409) (26,485)
At end of year 41,432 65,290 37,689 62,358
i.	 The short term investments represents unlisted commercial papers held by the group. 			
ii. 	 Included in unlisted long term investments are the bank’s investment under the Small and Medium Enterprises Equity Investment
	 Scheme (SMEEIS). The Bank made the investments under the Small and Medium Enterprises Equity Investment Scheme (SMEEIS)
	 per the Policy Guidelines for 2001 Fiscal Year (Monetary Policy Circular No. 35). A total of N1.64 billion (2009: N1.73 billion) have
	 so far been invested under the scheme. Due to the effective percentage holding of the bank in these companies, some of them qualify
	 as associates. However, they are not consolidated as the bank, based on regulatory requirement is not expected to exercise influence
	 and control.
iii. 	 Included in listed debt securities is N26.01 billion (Market value: N27.76 billion) in various Federal Government of Nigeria bonds.
99
Group
2010
Nmillion
Group
2009
Nmillion
Bank
2010
Nmillion
Bank
2009
Nmillion
17 Investment in subsidiaries %
Stanbic IBTC Ventures Limited (“SIVL”) 100 - - 500 500
Stanbic IBTC Asset Management Limited (“SIAML”) 100 - - 710 710
Stanbic IBTC Pension Managers Limited (“SIPML”) 70.59 - - 565 565
Stanbic IBTC Trustees Limited (“SITL”) 100 - - 40 40
Stanbic Nominees Nigeria Limited (“SNNL”) 100 - - - -
Stanbic IBTC Stockbrokers Limited (“SISL”) 100 - - 109 109
RB Resources Limited 100 - 1 - 1
- 1 1,924 1,925
Group
2010
Nmillion
Group
2009
Nmillion
Bank
2010
Nmillion
Bank
2009
Nmillion
Investment in small  medium scale industries
Direct investment:
Freezone Plant Fabrications Int’l Limited 120 120 120 120
Tinapa Business Resort Limited 500 500 500 500
Credit Reference Company Limited 50 50 50 50
Onward Paper Mills Limited 385 385 385 385
CR Services Limited 87 87 87 87
1,142 1,142 1,142 1,142
Indirect investment:
Through African Capital Alliance Limited
- (SME Partnership)
437 446 437 446
Through First SMI Investment Company Limited 61 137 61 137
498 583 498 583
Total 1,640 1,725 1,640 1,725
i. 	 In 1996, the bank acquired majority shareholdings (99.99%) in two companies incorporated in Nigeria, namely Stanbic IBTC
	 Ventures Limited (“SIVL”) and Stanbic IBTC Asset Management Limited (“SIAML”). As at December 2008, SIVL had a 70.59%
	 equity holding in Stanbic IBTC Pension Managers Limited (“SIPML”) which is a licenced Pension Fund Administrator, up from an initial
	 holding of 60%. In December 2008, the shareholding of SIVL in SIPML was acquired by the bank. 				
											
ii. 	 The financial statements of SIVL, SIAML, SIPML, SISL, SITL and SNNL have been consolidated in the group financial statements.
Notes to the financial statements
For the year ended 31 December 2010
Stanbic IBTC Bank PLC Annual Report 2010 100
Annualreportand
financialstatements
iii	 Stanbic Nominees Limited being the custody arm of the group, acts in a nominee capacity for clients’ transactions in securities
	 and other investments. The securities are not assets of the company, and as such are not reflected in its balance sheet. All
	 operating and administrative expenses of the company are borne by the bank, and no revenue accrues to the company for
	 services rendered. Accordingly, no income statement and cashflow statement have been presented.
iv	 The winding up of R B Resources Limited, a subsidiary it acquired as a result of its merger with the legacy Regent Bank PLC in
	 December 2005 was concluded in April 2010.
All the group companies have the same reporting period.
Group
2010
Nmillion
Group
2009
Nmillion
Bank
2010
Nmillion
Bank
2009
Nmillion
18 Other assets
Interest and fee receivable 6,570 4,180 5,390 3,866
Prepayments 4,246 4,460 3,718 3,761
Accounts receivable 2,003 1,330 1,231 184
Open buy back instruments - 12,300 - 12,300
Other receivables 5,049 4,897 5,036 5,943
Provision for doubtful receivables (1,692) (1,601) (1,692) (1,601)
16,176 25,566 13,683 24,453
Movement in provision for doubtful receivables:
At start of year (1,601) (1,845) (1,601) (1,845)
- Additional provision (892) (589) (892) (589)
- Write-back to income statement 580 391 580 286
- Amount written off 221 442 221 547
At end of year (1,692) (1,601) (1,692) (1,601)
Bond holdings sold under repurchase agreement are classified as other asset balances in accordance with Central Bank of Nigeria circular
BSD/8/2003.
101
31 December 2010
Bank
Nmillion
Stanbic IBTC
Asset Mgt Ltd
Nmillion
Stanbic IBTC
Pension Mgt Ltd
Nmillion
Operating income 40,627 2,102 6,507
Operating expenses (29,820) (1,080) (3,234)
Risk and other asset provision (620) - -
Profit before tax 10,187 1,022 3,273
Tax (2,376) (347) (1,050)
Profit after tax 7,811 675 2,223
31 December 2009 6,258 772 1,665
Balance sheet
Assets:
Cash and short term funds 10,048 - -
Treasury bills 12,428 - -
Due from other banks 87,439 123 898
Loans and advances to customers 164,203 - -
Advances under finance lease 13,502 - -
Investment securities 37,689 2,609 4,846
Investment in subsidiaries 1,924 - -
Deferred tax assets 939 - -
Other assets 13,683 763 1,054
Fixed assets 30,757 104 372
31 December 2010 372,612 3,599 7,170
31 December 2009 331,000 3,639 5,270
Notes to the financial statements
For the year ended 31 December 2010
19. Condensed financial statement for the group
Profit and loss account
Stanbic IBTC Bank PLC Annual Report 2010 102
Annualreportand
financialstatements
Stanbic IBTC
Ventures Ltd
Nmillion
Stanbic IBTC
Trustees Ltd
Nmillion
Stanbic
Nominees Ltd*
Nmillion
Stanbic IBTC
Stockbroking Ltd
Nmillion
Consolidations/
eliminations
Nmillion
Group total
Nmillion
51 - - 1,590 (2,483) 48,394
(33) - - (701) 622 (34,246)
- - - - - (620)
18 - - 889 (1,861) 13,528
(8) - - (292) - (4,073)
10 - - 597 (1,861) 9,455
37 - - 319 (913) 8,138
- - - - - 10,048
- - - - - 12,428
315 40 - 973 (1,129) 88,659
- - - - (251) 163,952
- - - - - 13,502
1,591 - - 850 47,585
- - - - (1,924) -
- - - - - 939
- - - 405 271 16,176
- - - 19 - 31,252
1,906 40 - 2,247 (3,033) 384,541
2,800 40 - 2,490 (4,749) 340,490
103
31 December 2010
Bank
Nmillion
Stanbic IBTC
Asset Mgt Ltd
Nmillion
Stanbic IBTC
Pension Mgt Ltd
Nmillion
Liabilities:
Customer deposits 187,595 - -
Due to other banks 56,152 - -
Other borrowings 18,272 -
Other liabilities 30,983 713 1,364
Current income tax 2,051 684 1,073
Deferred tax liability - 12 54
Equity and reserves 77,559 2,190 4,679
31 December 2010 372,612 3,599 7,170
31 December 2009 331,000 3,639 5,270
Cash flow
Net cash from operating activities (4,253) 408 2,988
Net cash from financing activities - (660) (1,000)
Net cash from investing activities 18,555 (246) (939)
Increase/(decrease) in cash and cash equivalents 14,302 (498) 1,049
										
Notes to the financial statements
For the year ended 31 December 2010
19. Condensed financial statement for the group (continued)
* Included in the disclosure for Stanbic Nominees is share capital of N100,000. This balance does not reflect above as the financial statement
is presented in Nmillion thus shown as zero (-).
Stanbic IBTC Bank PLC Annual Report 2010 104
Annualreportand
financialstatements
Stanbic IBTC
Ventures Ltd
Nmillion
Stanbic IBTC
Trustees Ltd
Nmillion
Stanbic
Nominees Ltd*
Nmillion
Stanbic IBTC
Stockbroking Ltd
Nmillion
Consolidations/
eliminations
Nmillion
Group total
Nmillion
- - - - (1,129) 186,466
251 - - - (251) 56,152
- - - - - 18,272
14 - 1,146 - 34,220
83 - 306 - 4,197
40 - - 2 - 108
1,518 40 - 793 (1,653) 85,126
1,906 40 - 2,247 (3,033) 384,541
2,800 40 - 2,490 (4,749) 340,490
(568) - - 712 (481) (1,194)
(260) - - (700) 2,326 (294)
335 - - 16 (1,756) 15,965
(493) - - 28 89 14,477
105
20 Property and equipment - group 2010
At start
of year
Nmillion
Additions
Nmillion
Disposals/
write-offs
Nmillion
Reclassifications
Nmillion
At end
of year
Nmillion
Cost
Leasehold land and buildings 11,182 438 (1) 4,272 15,891
Motor vehicles 2,872 692 (258) 58 3,364
Furniture, fittings  equipment 2,979 746 (182) 2,941 6,484
Computer hardware 3,516 190 (83) 1,465 5,088
Computer software 532 - - - 532
Work in progress 11,969 9,906 (3,457) (8,736) 9,682
33,050 11,972 (3,981) - 41,041
Work in progress represents construction costs in respect of new branches and offices. On completion of construction, the related amounts
are transferred to other categories of property and equipment.					
						
At start
of year
Nmillion
Charge for
the year
Nmillion
Disposals/
write-offs
Nmillion
Reclassifications
Nmillion
At end
of year
Nmillion
Accumulated depreciation
Leasehold land and buildings 1,438 957 (1) - 2,394
Motor vehicles 1,328 757 (183) - 1,902
Furniture, fittings  equipment 1,686 895 (165) - 2,416
Computer hardware 1,459 1,322 (68) - 2,713
Computer software 261 103 - - 364
6,172 4,034 (417) - 9,789
At start
of year
Nmillion
At end
of year
Nmillion
Net book value
Leasehold land and buildings 9,744 13,497
Motor vehicles 1,544 1,462
Furniture, fittings  equipment 1,292 4,068
Computer hardware 2,058 2,375
Computer software 271 168
Work in progress 11,969 9,682
26,878 31,252
Notes to the financial statements
For the year ended 31 December 2010
Stanbic IBTC Bank PLC Annual Report 2010 106
Annualreportand
financialstatements
20 Property and equipment - bank 2010
At start
of year
Nmillion
Additions
Nmillion
Disposals/
write-offs
Nmillion
Reclassifications
Nmillion
At end
of year
Nmillion
Cost
Leasehold land and buildings 11,181 438 (1) 4,272 15,890
Motor vehicles 2,583 526 (173) 58 2,994
Furniture, fittings  equipment 2,677 710 (158) 2,941 6,170
Computer hardware 3,079 144 (27) 1,465 4,661
Computer software 329 - - - 329
Work in progress 11,969 9,906 (3,457) (8,736) 9,682
31,818 11,724 (3,816) - 39,726
At start
of year
Nmillion
Charge for
the year
Nmillion
Disposals/
write-offs
Nmillion
Reclassifications
Nmillion
At end
of year
Nmillion
Accumulated depreciation
Leasehold land and buildings 1,438 957 (1) - 2,394
Motor vehicles 1,193 664 (120) - 1,737
Furniture, fittings  equipment 1,562 822 (154) - 2,230
Computer hardware 1,179 1,211 (25) - 2,365
Computer software 179 64 - - 243
5,551 3,718 (300) - 8,969
At start
of year
Nmillion
At end
of year
Nmillion
Net book value
Leasehold land and buildings 9,743 13,496
Motor vehicles 1,390 1,257
Furniture, fittings  equipment 1,115 3,940
Computer hardware 1,900 2,296
Computer software 150 86
Work in progress 11,969 9,682
26,267 30,757
Work in progress represents construction costs in respect of new branches and offices. On completion of construction, the related amounts
are transferred to other categories of property and equipment.
107
Group
2010
Nmillion
Group
2009
Nmillion
Bank
2010
Nmillion
Bank
2009
Nmillion
21 Customer deposits
Current deposits 77,211 67,646 78,103 68,611
Savings deposits 9,485 5,880 9,485 5,880
Term deposits 84,030 80,558 84,030 80,558
Domiciliary deposits 15,740 15,115 15,977 15,361
Electronic purse - 1 - 1
186,466 169,200 187,595 170,411
Analysis by maturity
0 - 30 days 172,702 134,287 173,831 135,498
1-3 months 8,496 28,404 8,496 28,404
3-6 months 2,290 5,706 2,290 5,706
6-12 months 2,900 652 2,900 652
Over 12 months 78 151 78 151
186,466 169,200 187,595 170,411
22 Due to other banks
Current balances with banks 293 953 293 953
Inter-bank taking 55,859 37,381 55,859 37,381
56,152 38,334 56,152 38,334
23 Other borrowings
FMO - Netherland Development Finance Company 10,117 11,089 10,117 11,089
International Finance Corporation (IFC) 802 1,184 802 1,184
European Investment Bank 3,443 374 3,443 374
Bank of Industry 2,560 - 2,560 -
CBN Commercial Agricultural Credit Scheme (CACS) 1,350 - 1,350 -
18,272 12,647 18,272 12,647
i.	 The bank’s dollar denominated on-lending credit obtained from the IFC expires on or after 15 December 2012 and has a rate of
	 3% above 3 month’s LIBOR. 								
ii. 	 The dollar denominated facility from European Investment Bank expires on or after 15 March 2012 and has a rate of 2.5% above
	 3 month’s LIBOR.	
iii. 	 The on-lending dollar denominated loan obtained from Netherland Development Finance Company (FMO) expires on or after 15
	 January 2015, and has a rate of 2.0% above 6 month’s LIBOR.				
iv. 	 The bank obtained a Central Bank of Nigeria (CBN) initiated on-lending naira facilty from Bank of Industry in September 2010
	 at a fixed rate of 1% p.a. on a tenor based on agreement with individual customer and beneficiary.			
v. 	 The bank during the year received free interest bearing loan from the Central Bank of Nigeria (CBN) for purpose of on - lending
	 under the Commercial Agricultural Credit Scheme (CACS). The disbursement of these funds are represented in customers loans
	 and advances.
Notes to the financial statements
For the year ended 31 December 2010
Included in customer deposits is N255 million (2009:N155 million) representing cash collateral held against advances.
Stanbic IBTC Bank PLC Annual Report 2010 108
Annualreportand
financialstatements
24 Other liabilities
Customers’ deposit for letters of credit 5,528 8,804 5,528 8,804
Interest payable 1,838 3,372 1,822 3,372
Unearned income 291 1,034 257 967
Accrued expenses 5,611 2,845 4,889 2,556
Account payables 16,357 13,934 14,035 11,739
Collections/remittances payable 3,999 1,905 3,856 1,723
Proceeds from public offers 10 2,016 10 2,016
Provision on losses for off balance sheet 586 142 586 142
34,220 34,052 30,983 31,319
Group
2010
Nmillion
Group
2009
Nmillion
Bank
2010
Nmillion
Bank
2009
Nmillion
Analysis by maturity
0 - 30 days 1,126 - 1,126 -
1-3 months 220 42 220 42
3-6 months 590 239 590 239
6-12 months 2,142 1,389 2,142 1,389
Over 12 months 14,194 10,977 14,194 10,977
18,272 12,647 18,272 12,647
Provision on losses for off balance sheet represents provisions recommended on some pending legal proceedings disclosed in note 30.	
							
Group
2010
Nmillion
Group
2009
Nmillion
Bank
2010
Nmillion
Bank
2009
Nmillion
25 Deferred taxes
Deferred tax liabilities 108 100 - -
Deferred tax assets (939) (594) (939) (594)
(831) (494) (939) (594)
Movement in deferred taxes:
At start of year (494) 378 (594) 236
(Write-back)/charge for the year (360) (830) (345) (830)
Reclassification from current income tax (13) 49 - -
Prior year adjustment on revaluation of securities (4) (3) - -
(Write-back)/charge on revaluation of securities 40 (88) - -
At end of year (831) (494) (939) (594)
109
27 Share capital
Authorised
20 billion ordinary shares of 50 kobo each
(2009: 20 billion ordinary shares of 50 kobo each) 10,000 10,000 10,000 10,000
Group
2010
Nmillion
Group
2009
Nmillion
Bank
2010
Nmillion
Bank
2009
Nmillion
26 Non controlling interest
At start of year 1,017 711 - -
Transfer from profit and loss 653 490 - -
Dividend paid (294) (147) - -
Increase in shareholding in subsidiary company - (37) - -
At end of year 1,376 1,017 - -
ii. Share premium Group
Nmillion
Bank
Nmillion
At start of year 47,469 47,469
At end of year 47,469 47,469
Notes to the financial statements
For the year ended 31 December 2010
Issued and fully paid
i. Ordinary shares Number
million
Group
Nmillion
Bank
Nmillion
At start of year 18,750 9,375 9,375
At end of year 18,750 9,375 9,375
Stanbic IBTC Bank PLC Annual Report 2010 110
Annualreportand
financialstatements
28 Reserves
Statutory
reserve
Nmillion
SMIEIS
reserve
Nmillion
Revaluation
reserve
Nmillion
Capital
reserve
Nmillion
Retained
earnings
Nmillion
Total
Nmillion
Group
At prior period start - 1 January 2009 10,419 1,039 272 129 11,961 23,820
Increase in subsidiary shareholding - - - 294 - 294
On revaluation of securities - - (272) - - (272)
Dividend paid - - - - (7,500) (7,500)
Bonus issues (354) (354)
Transfer from profit and loss account 1,147 - - - 6,501 7,648
At 31 December 2009/ 1 January 2010 11,566 1,039 - 423 10,608 23,636
On revaluation of securities - - 93 - - 93
Dividend paid - - - - (5,625) (5,625)
Transfer from profit and loss account 1,450 - - - 7,352 8,802
At period end 31 December 2010 13,016 1,039 93 423 12,335 26,906
Bank
At prior period start - 1 January 2009 10,135 1,039 - - 8,597 19,771
Dividend paid - - - - (7,500) (7,500)
Transfer from profit and loss account 939 - - - 5,319 6,258
At 31 December 2009/ 1 January 2010 11,074 1,039 - - 6,416 18,529
Dividend paid - - - - (5,625) (5,625)
Transfer from profit and loss account 1,172 - - - 6,639 7,811
At period end 31 December 2010 12,246 1,039 - - 7,430 20,715
29	 Retirement benefit obligations	
						
The group operates a defined contribution pension scheme in line with the provisions of the Pension Reform Act, with contributions based on
the sum of employees’ basic salary, housing and transport allowance in the ratio 7.5% by the employee and 7.5% by the employer. The amount
contributed by the group, and remitted to the Pension Fund Administrators, during the period was N631 million (2009: N549.97 million).
The group’s contributions to this scheme is charged to the profit and loss account in the period to which they relate. Contributions to the
scheme are managed by SIPML, and other appointed pension managers on behalf of the beneficiary staff in line with the provisions of the
Pension Reform Act. Consequently, the group has no legal or constructive obligations to pay further contributions if the funds do not hold
sufficient assets to meet the related obligations to employees.
111
30	 Contingent liabilities and commitments	 							
									
a)	 Legal proceedings									
	 There were 136 legal proceedings outstanding at 31 December 2010 with claims amounting to N30.3 billion (2009: N31 billion). The
	 claims are considered without merit, and the bank is defending them vigorously. It is not expected that the ultimate resolution of any of
	 the proceedings will have a significantly adverse effect on the financial position of the bank. 					
			
	 On 6 December 2010 a judgement of N2.5 billion was delivered in favour of one of the claims noted above. The bank has lodged an
	 appeal against the judgement, and intends to vigorously defend its position in the appeal court. Furthermore legal advice was obtained
	 from independent Senior Advocates of Nigeria (SANs) to assess the merits of the appeal. Their respective advice indicates that it is
	 unlikely that any significant loss will arise in the ultimate resolution of this matter.
								
	 Based on professional advice received and management’s opinion, adequate provisions have been made on the various cases. These
	 provisions are included in loan loss provisions (for credit - related cases) and ‘other liabilities’ for other cases.			
													
b) 	 Capital commitments								
	 As at the balance sheet date, the group had capital commitments amounting to N36.08 million (2009: N4.14 biIllion) in respect
	 of various construction work being undertaken on branch expension, and revamping project.
2010
Nmillion
2009
Nmillion
a) Aggregate or estimated amount of contracts for capital expenditure so far as not
provided for; and
36 3,364
b) Aggregate or estimated amount of capital expenditure authorised by the directors
which has not been contracted.
- 777
36 4,141
c)	 Off balance sheet engagements								
	 In the normal course of business, the group is party to financial instruments with off-balance sheet risk. The instruments are used to
	 meet the credit and other financial requirements of customers. The contractual amounts of the off-balance sheet financial
	 instruments are:								
Group
2010
Nmillion
Group
2009
Nmillion
Bank
2010
Nmillion
Bank
2009
Nmillion
Performance bonds and guarantees 5,280 3,371 5,280 3,371
Letters of credit 9,327 12,376 9,327 12,376
Forward and swap contracts 254 451 254 451
14,861 16,198 14,861 16,198
Notes to the financial statements
For the year ended 31 December 2010
Stanbic IBTC Bank PLC Annual Report 2010 112
Annualreportand
financialstatements
Dividends are not accounted for until they have been ratified at the Annual General Meeting (AGM). At the next AGM, a dividend in respect of 2010
of 39 kobo per share (2009: 30 kobo) amounting to a total of N7.3 billion (2009:N5.6 billion) will be proposed. These financial statements do not
reflect this resolution, which will be accounted as an appropriation of retained earnings in the year ending 31 December 2011.		
32	 Earnings per share
	 							
Earnings per share (actual) is calculated by dividing the profit after tax by the number of shares in issue during the period, while earnings
per share (basic) is calculated by using the weighted average number of shares in issue during the period as the denominator. Earnings per
share (adjusted) is calculated by using the number of shares outstanding as at the balance sheet date as a common denominator for all years,
while earnings per share (diluted) is calculated by adjusting the number of shares in issue during the period with the effects of all potential
ordinary shares.
Group
2010
Nmillion
Group
2009
Nmillion
Bank
2010
Nmillion
Bank
2009
Nmillion
Profit after tax 9,455 8,138 7,811 6,258
Number of shares (in millions) 18,750 18,750 18,750 18,750
Weighted average number of shares (in millions) 18,750 18,750 18,750 18,750
Earnings per share (EPS) - basic 50 k 43 k 42 k 33 k
There was no change in the number of shares in issue during the period. Consequently, the weighted average number of shares is the same as
absolute number of shares in issue, and outstanding as at the year ended 31 December 2010.
33	 Compliance with banking regulation
			
The bank was penalised by the Central Bank of Nigeria (CBN) during the year for the following infraction:				
- 	 Infraction of Section 60 (1) of BOFIA, 1991 - write off of insider related loan RB Resources (fine: N2 million)
- 	 Penalty imposed arising from the Nigerian Financial Intelligence Unit (NFIU) examination of the bank conducted in April 2009
	 (fine: N4 million)
	
				
34	 Comparatives					
Where necessary, comparative figures have been restated to conform to changes in presentation in the current year.
Group
2010
Nmillion
Group
2009
Nmillion
Bank
2010
Nmillion
Bank
2009
Nmillion
Proposed dividend 39 kobo (2009: 30 kobo) per share 7,313 5,625 7,313 5,625
31	 Dividend
113
Group
2010
Number
Group
2009
Number
Bank
2010
Number
Bank
2009
Number
Executive directors 5 5 5 5
Management 411 361 377 330
Non-management 1,832 1,643 1,566 1,387
2,248 2,009 1,948 1,722
Group
2010
Nmillion
Group
2009
Nmillion
Bank
2010
Nmillion
Bank
2009
Nmillion
Salaries and wages 14,271 12,919 12,533 11,311
Retirement benefit - Pension (note 29) 627 550 539 479
14,898 13,469 13,072 11,790
Compensation for the above staff (excluding executive directors):		
35	 Employees and directors 			
a)	 Employees
	 The average number of persons employed by the group during the year by category:			
The number of employees of the group, other than directors, who received emoluments in the following ranges (excluding pension
contributions), were:							
Number Number Number Number
Below N1,000,001 - 30 - 20
N1,000,001 - N2,000,000 106 97 56 50
N2,000,001 - N3,000,000 841 833 819 788
N3,000,001 - N4,000,000 408 319 304 244
N4,000,001 - N5,000,000 253 212 205 161
N5,000,001 - N6,000,000 100 55 79 41
N6,000,001 and above 540 463 485 418
2,248 2,009 1,948 1,722
Notes to the financial statements
For the year ended 31 December 2010
Stanbic IBTC Bank PLC Annual Report 2010 114
Annualreportand
financialstatements
Annualreportand
financialstatements
Group
2010
Nmillion
Group
2009
Nmillion
Bank
2010
Nmillion
Bank
2009
Nmillion
Fees and sitting allowances 151 142 151 142
Executive compensation
(salary including all benefits) 568 644 568 609
719 786 719 751
Directors’ other expenses 1 2 1 2
720 788 720 753
Fees and other emoluments disclosed above
include amounts paid to:
(i) the chairman 36 33 36 33
(ii) the highest paid director 177 211 177 211
b)	 Directors
	 The remuneration to the directors is as follows:
115
(a) (i)	 Schedule of insider related credits
Name of company/individual Relationship Name of
related
interest
Facility type Date granted Expiry date
Flour Mills of Nigeria Plc Chairman Atedo
Peterside
Overdraft 30-Nov-10 12-Jan-11
Presco Plc Chairman Atedo
Peterside
Term loan 1-Oct-08 31-Dec-11
International Glass Industries Limited. Director B.I. Mahtani Finance lease 6-Oct-08 20-Oct-12
PPC Limited Director Sam U
Unuigbe/
Ahmed I
Dasuki
Finance lease 23-Jul-09 31-Jul-13
MTN Nigeria Communications Ltd Director Ahmed I
Dasuki
Term loan 30-Dec-10 30-Mar-11
Acorn Petroleum Plc Director Christopher
Kolade
Finance lease 2-Nov-09 30-Oct-12
Acorn Petroleum Plc Director Christopher
Kolade
Term loan 13-Jul-10 1-Mar-11
Various staff Staff Various staff Staff loan Various Various
Total - Insider related credits
36	 Related party transactions	 					
	 The bank is controlled by Stanbic Africa Holding Limited which is incorporated in the United Kingdom. The ultimate parent of the group
	 is Standard Bank Group Limited incorporated in South Africa.							
					
	 The bank manages the operations of SIAML, SISL and SIPML under the terms of a management and advisory services agreement for
	 a fee. 												
	 Included in loans and advances is an amount of N18.73 billion (2009 : N6.95 billion) representing credit facilities to staff, shareholders
	 and companies in which some directors have interests. These facilities were granted at rates and terms comparable to other facilities in
	 the bank’s portfolio. There were no non-performing insider related credit as at balance sheet date.				
								
	 The balances in the accounts as at 31 December 2010 are as stated below:	
Notes to the financial statements
For the year ended 31 December 2010
Name of company Relationship Name of related
interest
Facility type Outstanding
N’000
Status
Flour Mills Nig Plc Chairman Atedo Peterside Unconfirmed LC 1,071,309 Performing
Nigeria Breweries Chairman Atedo Peterside Unconfirmed LC 134,190 Performing
Total 1,205,499
(ii)	 Off balance sheet engagements
Stanbic IBTC Bank PLC Annual Report 2010 116
Annualreportand
financialstatements
Approved
credit limit
N000
Outstanding
N000
Status Interest rate Perfected security Deposit
outstanding
N000
Type of
deposit
Security nature Security value
N000
4,500,000 198,692 Performing 20.00% Negative Pledge - 22,382 Current a/c
548,239 171,540 Performing 5.29% - 5,749 Time/current
account
16,296 5,721 Performing 18.50% Asset financed 5,721 -
58,928 25,970 Performing 19.00% Asset financed 25,970 4,395 Time/current
account
12,365,040 12,365,040 Performing 11.91% Negative pledge - 7,841,368 Time/current
account
11,742 5,550 Performing 16.50% Asset financed 5,550 1,185 Current a/c
1,583,134 258,280 Performing 9.00% Cross guarantee
of sister
companies
2,412,432 -
6,944,303 5,696,466 Performing 10% to 15.5% - - 902,585 Time/current
account
26,027,682 18,727,259 8,777,664
(b)	 Other related party items
	 Significant transaction balances involving the bank and related parties are as detailed below:			
Related party items Standard Bank
Group
SIAML SIVL SIPML SISL
Relationship to the bank Parent
N000
Subsidiary
N000
Subsidiary
N000
Subsidiary
N000
Subsidiary
N000
Deposit balances 21,978,468 117,756 314,122 328,067 324,337
Account receivables - 327,843 6,783 138,134 24,567
Loans (due to SIBTC) - - 251,100 - -
Account payables - - - - 337
117
Notes to the financial statements
For the year ended 31 December 2010
37	 Cash and cash equivalents
	 					
a.	 For the purposes of the cash flow statement, cash and cash equivalents include cash and non restricted balances with the central bank
	 of Nigeria, treasury bills and other eligible bills, operating account balances with other banks, amounts due from other banks and short
	 term government securities.
Group
2010
Nmillion
Group
2009
Nmillion
Bank
2010
Nmillion
Bank
2009
Nmillion
Cash and balances with central banks
(less restricted balances)
8,206 6,484 8,206 6,480
Treasury bills and eligible bills 12,428 11,378 12,428 11,378
Due from other banks 88,659 76,954 87,439 75,913
109,293 94,816 108,073 93,771
b. Cash generated from operations
Reconciliation of profit before tax to cash
generated from operations:
Operating profit 13,528 10,342 10,187 7,141
Provision for loan loss 3,533 6,231 3,533 6,231
Amounts written back on previously
provisioned accounts (3,921) (2,670) (3,921) (2,670)
Provision for leases 904 88 904 88
Provision for forward cover gain 18 3,696 17 3,696
Provision for off balance sheet 444 110 444 110
Interest in suspense (note 13b) 1,329 1,282 1,329 1,282
Interest income written off (note 13b) (1,368) (1,101) (1,368) (1,101)
Loans written off (note 13a) (4,004) (1,350) (4,004) (1,350)
Witholding tax charge (90) (99) (90) (82)
Provision for other assets 312 198 312 303
(Write back of)/ provision for diminution
in value of investment (311) 986 (206) 881
(Profit)/ loss on disposal of fixed asset (note 7) (8) 4 (2) 3
Gain on disposal of investment - (456) - (30)
Depreciation (note 7) 4,034 2,567 3,718 2,267
Interest received (note 3) (34,359) (40,920) (33,808) (39,952)
Interest paid (note 4) 7,989 15,813 8,012 15,870
Dividend received (note 6) (103) (169) (1,886) (975)
Operating profit before changes in operating
assets and liabilities
(12,073) (5,448) (16,829) (8,288)
Stanbic IBTC Bank PLC Annual Report 2010 118
Annualreportand
financialstatements
Group
2010
Nmillion
Group
2009
Nmillion
Bank
2010
Nmillion
Bank
2009
Nmillion
(Increase)/decrease in operating assets:
Cash reserve balances (554) 606 (554) 606
Loans to customers (49,153) (14,802) (48,945) (14,649)
Advances under finance leases (4,889) (5,204) (4,889) (5,204)
Short term investments 19 (4,724) - 440
Interest receivable and prepayment (2,176) 2,172 (1,481) 1,782
Accounts receivable (673) 423 (1,047) 861
Other receivables, net of sundry receivables in
acquiree 11,912 (13,107) 12,970 (12,306)
(45,514) (34,636) (43,946) (28,470)
Increase/(decrease) in operating liabilities
Customer deposits 17,266 73,938 17,184 71,497
Due to other banks 17,818 (43,868) 17,818 (43,868)
Customers’ deposit for foreign currency
denominated obligations
(3,276) (5,191) (3,276) (5,191)
Interest payable and unearned income (2,277) (1,946) (2,260) (1,956)
Accounts payable 7,291 (3,295) 6,762 (4,322)
Public offer proceeds, and other payables (2,006) (28,763) (2,006) (28,763)
34,816 (9,125) 34,222 (12,603)
Cash used in operations (22,771) (49,209) (26,553) (49,361)
119
Financial risk analysis
For the year ended 31 December 2010	
Enterprise risk review	
Fundamental to the business activities and future growth
prospects of Stanbic IBTC is a strong risk management practice,
which is the bedrock of the group’s avowed commitment to
the objectives of enhancing shareholders’ value at all times by
developing and growing the business in strict adherence to the
risk appetite set by the board as well as balancing this objective
with the wider interest of other stakeholders including regulators
and depositors. The group seeks to achieve an appropriate balance
between risk and reward in its businesses, and continues to build
and enhance the risk management capabilities that will assist in
achieving its dynamic growth plans in a controlled environment.	
							
Risk management is at the core of the operating and management
structures of the group. The group seeks to limit adverse
variations in earnings and equity by managing the balance sheet
and capital within specified levels of risk appetite. Managing and
controlling risks, and in particular avoiding undue concentrations
of exposure and limiting potential losses from stress events are
essential elements of the group’s risk management and control
framework, which ultimately leads to the protection of the
group’s reputation and brand. 	
Within the group, responsibility and accountability for risk
management resides at all levels, from the executive down through
the organisation to each business manager and independent
risk officer. Internal audit provides an independent assessment
of the adequacy and effectiveness of controls and procedures
and reports independently to the statutory audit committee,
whilst external audit reports independently on the group annual
financial statements to shareholders and regulators.
Subsidiary entities within the group are guided by the group
enterprise risk management (ERM) framework in establishing
their respective risk management frameworks.
The major subsidiaries of the bank; Stanbic IBTC Asset
Management Limited, Stanbic IBTC Stockbroking Limited and
Stanbic IBTC Pension Managers Limited are committed to aligning
their respective risk management practices to that of the group
and adopting acceptable risk tolerance parameters in line with
the group. 	
Key aspects of risk management are the risk governance and the
organisational structures established by the group to manage
risk according to a set of risk governance standards, which are
implemented across the group and are supported by appropriate
risk policies and procedures.
Risks are controlled at the level of individual exposure, at a portfolio
level, and in aggregate across all business and risk types. The bank
and its subsidiaries have an independent control process which
provides an objective view of risk taking activities where required.
All exposures are independently monitored and reviewed. 	
						
	
Key achievements in 2010				
				
The past year has been another very challenging one for the
world economy and financial markets even as a few of the
emerging economies have started to show some recovery in
macro-economic indices. Nevertheless, it has also been a year
of diversifying and deepening the group’s experience in many
dimensions as high impact events, hitherto considered highly
improbable including new regulatory guidelines unfolded
at random, creating a platform for the group to distinguish
itself in the market place by the quality and robustness of its
risk management practices and tools. Some of the challenges
included raising the practical knowledge of the risk governance
standards, policies and procedures within the group, deploying
and embedding risk management tools at lower management
levels, creating the appropriate risk culture and sensitivity,
strengthening the control functions, adopting proactive
approaches to risk identification and fortifying the risk
management team with strategic and tactical upskilling.	
						
At the same time, the group had to handle expansion in
branch and point of sale network into many new regions and
states, launching of new retail products, deployment of new
distributions channels, maintaining low credit loss ratio in the
face of increasing risk assets, unstable inter-bank money market
coupled with almost a total collapse of government yield curve,
inconsistent access to repo facilities as well as high regulatory
intervention and rapid policy changes. The group’s current control
framework and procedures displayed the required resilience and
dynamism in the face of rising uncertainty and vulnerability while
oversight functions including monitoring and reporting were
reinforced through the full implementation of risk assurance
functions and an escalation matrix. 			
						
•	 The group continued its comprehensive review of its risk
	 management standards, policies and procedures in
	 order to achieve a better coverage of emerging risk
	 issues and enhance the effectiveness and efficiency
	 of its risk management practices and tools;
• 	 The group established and implemented standards
	 and policies for information risk management, which define
	 the principle and practices that are necessary to ensure the
	 protection of information resources;		
• 	 In order to further strengthen its liquidity management
	 framework and promote short and long-term resilience
Stanbic IBTC Bank PLC Annual Report 2010 120
Annualreportand
financialstatements
	 to potential liquidity disruption, the group implemented
	 two minimum standards for liquidity management as
	 proposed under Basel III, which are the 30-day liquidity
	 coverage ratio (LCR) and net stable funding ratio (NSFR);
•	 As as way of broadening its breadth of risk expertise and
	 plan for future demand, the group established an
	 internship scheme through which undergraduates with
	 requisite quantitative aptitude are identified and exposed
	 early to basic risk management tools;
•	 The group conducted a business continuity management
	 (BCM) test using a desktop walkthrough approach in order
	 to assess the group’s ability to recover and restore total
	 business operations in the event of unexpected operational
	 disruptions or disasters. The exercise, which was conducted
	 mainly by alternate members of the crisis management
	 team also provided opportunities to test their response
	 ability in the absence of key crisis management team
	 members;thegroupalsoconductedfourtestsontherecovery
	 site infrastructure to determine its suitability for meeting
	 its recovery time objectives;	
•	 Risk assurance (RA) function conducted independent
	 assurance regarding risks, processes and controls in 63
	 units, regarded as low-medium risk entities;		
•	 As part of its commitment to global best practice and ethical
	 conduct, the group developed and implemented a
	 surveillance procedure for identification and resolution of
	 conflict of interest situations by accessing the global
	 conflict control room (GCCR) and obtaining conflict
	 clearance on CIB pipeline deals;	
•	 In order to enable the business to achieve its set objective by
	 providing adequate risk management support at a more
	 granular level, the group established dedicated risk teams
	 for the 3 key business segments;
•	 Enhancement of credit capabilities with the establishment
	 of a collection call centre and scalable origination and
	 account management modules;	
• 	 Establishment of an in-house verification unit and the
	 use of two commercial credit bureaus to curtail potential
	 losses related to defective loan applications.
Focus areas for 2011	
			
The reaction of governments and regulators to the recent turmoil
in the world financial markets, which has led to the current
wave of very intensive financial market regulations as well as
the introduction of more rigorous regulations on banks both
globally and locally is expected to position risk management as
part of strategic focus of any financial institutions aiming to play
a leading role in the global economic recovery. Additionally, a
significant change in Nigeria’s banking landscape through the
revocation of universal banking regime and its replacement
with specialist banking regime has made it imperative for risk
management practices to become more sophisticated, dynamic,
and well resourced than ever before with fit-for-purpose systems
capabilities. To this extent, we will focus on:
• 	 Continued upholding of liquidity resilience over short and
	 long-term time horizons by maintaining a conservative
	 structural liquidity mismatch profile, supported by adequate
	 levels of marketable assets and net stable funding;	
• 	 Entrenching the principles and methodologies of scenario
	 and stress testing in market and liquidity risks by adding
	 seven new stress test scenarios including the Russian Crisis
	 of 1988;
• 	 Continued embedding of risk culture and enhancement
	 of control environment at all management levels of the
	 group through ownership of risk management practices and
	 tools by business units and designation of dedicated risk
	 officers within business units;
• 	 Strengthening the group’s ability to preserve its brand
	 value from any adverse perception through the
	 development of a reputation risk management framework,
	 standard and procedure;	
• 	 Continued enhancement of readiness level of people,
	 process and system for the implementation of a new core
	 banking application as well as addressing post-
	 implementation issues;	
• 	 Raise the readiness level for the introduction and
	 implementation of advanced measurement approach
	 (AMA) in the assessment of group’s operational risks; as
	 well as the deployment of a robust system which supports
	 data capture, management and measurement of risks,
	 together with decision-making and business performance
	 tools on a single, highly scalable platform.
• 	 Continued enhancement of the group’s business recovery
	 capabilities through the establishment of a dedicated
	 command centre and a new purposed built business
	 recovery site;
• 	 Reinforcing the group’s ability to proactively identify and
	 respond to financial crimes by establishing financial crimes
	 control function to provide independent forensic auditing
	 and investigation;
• 	 Continued building of credit capabilities by the setting-up
	 of specialist credit units coupled with an enhanced portfolio
	 and transaction monitoring unit.
121
Financial risk analysis
For the year ended 31 December 2010	
Risk management framework
Governance structure		
The group’s activities are complex, diverse and expanding rapidly
into market segments and regions with different challenges.
Hence, it is imperative that there is strong and independent
oversight at all levels across the group.		
The risk governance structure (see diagram overleaf) provides
executive management and the board, through the various
committees, with the forums to evaluate, consider and debate
key risks faced by the group and assess the effectiveness of the
management of these risks through a number of reports received
from the chief risk officers across Stanbic IBTC. The board
committees comprise the statutory audit committee, credit
board committee, risk management board committee, while
executive management oversight at a bank and group level is
achieved through management committees focusing on specific
risks. Each of these committees has a mandate which describes
the membership and responsibilities of such committees.	
	
Approach and structure
The group’s approach to risk management is based on
well established governance processes and relies both on
individual responsibility and collective oversight, supported
by comprehensive reporting. This approach balances strong
corporate oversight at senior management level with independent
risk management structures in the business. Business unit heads
are specifically responsible for the management of risk within
their business units. As such, they are responsible for ensuring
that they have appropriate risk management frameworks that are
adequate in design, effective in operation and meet minimum
group standards.
This responsibility is achieved either through the establishment
of dedicated business unit risk management functions in some
subsidiary companies or through centralised risk functions
servicing a number of business units. In the former case,
adequate provision for the independence of the business unit risk
management structures is essential in recognition of different
regulatory requirements.
An important element that underpins the group’s approach to
the management of all risk is independence and appropriate
segregation of responsibilities between business and risk. Risk
officers report separately to the head of group risk who reports
to the chief executive officer of Stanbic IBTC and also through a
matrix reporting line to the Standard Bank Group (SBG). All key
risks are supported by the risk department
Stanbic IBTC Bank PLC Annual Report 2010 122
Annualreportand
financialstatements
Stanbic IBTC board
Shareholders
Management committee
REMCOCreditRiskExco Audit
Credit ALCO
Operational risk
 compliance
Investment Country Risk Subsidiaries Pricing
Board sub-committees Statutory committee
Risk governance standards, policies and procedures
The group has developed a set of risk governance standards for
each major risk type. The standards set out and ensure alignment
and consistency in the manner in which the major risk types
across the group are governed, identified, measured, managed,
controlled and reported.				
					
All standards are applied consistently across the group and
are approved by the board. It is the responsibility of business
unit executive management to ensure that the requirements
of the risk governance standards, policies and procedures are
implemented within the business units.			
	
Each standard is supported by group policies and business
unit policies and procedural documents as required. Business
units and group risk functions are required to self assess, at
least annually, their compliance with group risk standards and
policies. Risk governance standards set out the framework for
managing each major risk type and policies are developed where
required on specific items as stated within the standards. Details
with regards to the implementation of these policies within
each particular business unit are set out in the processes and
procedures documentation.			
Risk appetite	 				
					
Risk appetite is an expression of the maximum level of residual
risk that the group is prepared to accept in order to deliver its
business objectives. It is the balance of return and risk determined
by the board through the board and executive risk committees
in consultation with the business units as the group implements
business plans, recognising a range of possible outcomes. 	
					
The board establishes the group’s parameters for risk appetite by:
						
•	 providing strategic leadership and guidance;
• 	 reviewing and approving annual budgets and forecasts
	 for the group and each business unit; and		
• 	 regularly reviewing and monitoring the group’s performance
	 in relation to risk through quarterly board reports.	
				
Risk appetite is expressed by balancing:			
							
• 	 budgetary provisions for expected losses that are consistent
	 with the risk appetite implied by the business plans;	
• 	 an agreed tolerance for profit and loss volatility – an
	 acceptable scenario that is lower than budget by an amount
123
Financial risk analysis
	 that is consistent with the risk appetite implied by the
	 business plans;				
• 	 the risk adjusted returns generated from risk-taking being
	 acceptable; and		
• 	 in the context of stress tests, portfolio analyses and
	 concentration limits, risk assessments, risk indicators and
	 other measures devised by the business unit risk functions
	 which serve to identify and constrain threats to earnings
	 and capital.					
					
Risk appetite is determined with reference to measures such as:	
						
• 	 budgeted loss write-offs and provisions;		
• 	 limits on exposures to individual counterparties, sectors,
	 industries or geographies;
• 	 limits on trading exposures; and			
• 	 interest rate. 					
			
	
Stress testing	 				
			
Stress testing serves as a diagnostic and forward looking tool
to improve the group’s understanding of its market and liquidity
risks profile under event based scenarios.			
							
Management reviews the outcome of stress tests and selects
appropriate mitigating actions to minimise and manage the risks
to the group. Residual risk is then evaluated against the risk
appetite. Examples of potential action to take are:		
• 	 reviewing and changing limits;			
• 	 limiting exposures in selected sectors or products; and	
• 	 re-balancing of portfolio to reduce risk sensitivity	
Risk categories					
						
The bank’s enterprise risk management framework is designed
to govern, identify, measure, manage, control and report on the
principal risks to which the group is exposed. These risks, with
applicability as appropriate, are defined as follows:		
			
Credit risk	 				
Credit risk arises primarily in the bank operations where an obligor
fails to perform obligations, in accordance with agreed terms or
the counterparty’s ability to meet such contractual obligation is
impaired.						
Credit risk comprises counterparty risk, settlement risk, country
risk and concentration risk.				
							
Counterparty risk 	 			
Counterparty risk is the risk of loss to Stanbic IBTC as a result of
failure by a counterparty to meet its financial and/or contractual
obligations to the bank. It has three components:		
• 	 primary credit risk which is the exposure at default (EAD)
	 arising from lending and related banking product activities,
	 including their underwriting;			
• 	 pre-settlement credit risk which is the EAD arising from
	 unsettled forward and derivative transactions, arising from
	 the default of the counterparty to the transaction and
	 measured as the cost of replacing the transaction at current
	 market rates; and				
• 	 issuer risk which is the EAD arising from traded credit and
	 equity products, and including their underwriting.	
Settlement risk				
Settlement risk is the risk of loss to Stanbic IBTC from a
transaction settlement, where value is exchanged, failing such
that the counter value is not received in whole or part.		
Country and cross border risk	 			
Country and cross border risk is the risk of loss arising from
political or economical conditions or events in a particular
country which reduce the ability of counterparties (including
the relevant sovereign and other members of the Standard
Bank Group internationally) in that particular country to fulfil
their obligations to Stanbic IBTC. Cross border risks is the risk
of restriction on the transfer and convertibility of local currency
funds, into foreign currency funds thereby limiting payment by
offshore counterparties to the bank. 			
					
Concentration risk	 				
Concentration risk refers to any single exposure or group of
exposures large enough to cause credit losses which threaten
Stanbic IBTC’s capital adequacy or ability to maintain its core
operations. It is the risk that a common factor within a risk type
or across risk types causes credit losses or an event occurs within
a risk type which results to credit losses.			
Market risk	 			
Market risk is defined as the risk of a change in the actual or
effective market value or earnings of a portfolio of financial
instruments caused by adverse moves in market variables such
as equity, bond and commodity prices, foreign exchange rates,
interest rates, credit spreads, recovery rates, correlations and
implied volatilities in all of the above. Market risk covers both
the impact of these risk factors on the market value of traded
instrument as well as the impact on the group’s net interest
margin as a consequence of interest rate risk on banking book
assets and liabilities.		
For the year ended 31 December 2010
Stanbic IBTC Bank PLC Annual Report 2010 124
Annualreportand
financialstatements
Liquidity risk				
Liquidity risk is defined as the risk that the bank, although
balance-sheet solvent, cannot maintain or generate sufficient
cash resources to meet its payment obligations in full as they
fall due (as a result of funding liquidity risk), or can only do
so at materially disadvantageous terms (as a result of market
liquidity risk). Funding liquidity risk refers to the risk that the
counterparties, who provide the bank with funding, will withdraw
or not roll-over that funding. Market liquidity risk refers to the
risk of a generalised disruption in asset markets that makes
normal liquid assets illiquid and the potential loss through the
forced-sale of assets resulting in proceeds being below their fair
market value.					
					
Operational risk					
Operational risk is defined as the risk of loss resulting from
inadequate or failed processes, people and systems (including
information technology and infrastructure) or from external
events. The definition of operational risk also includes:	
	
•	 information risk – the risk of unauthorised use, modification
	 of disclosure of information resources;		
• 	 fraud risk – the risk of losses resulting from fraudulent
	 activities;				
• 	 environmental risk – the risk of inadvertently participating
	 in the destruction of the environment;		
• 	 legal risk - the risk that the bank will be exposed to
	 litigation;					
• 	 taxation risk – the risk that the bank will incur a financial
	 loss due to incorrect interpretation and application
	 of taxation legislation or due to the impact of new taxation
	 legislation on existing business;			
•	 compliance risk - the risk that the bank does not comply
	 with applicable laws and regulations or supervisory
	 requirements.					
Business risk					
Business risk is the risk of loss due to adverse local and global
operating conditions such as decrease in demand, increased
competition, increased cost, or by entity specific causes such
as inefficient cost structures, poor choice of strategy,
reputation damage or the decision to absorb costs or losses to
preserve reputation. 					
Credit risk
Principal credit policies				
				
The group’s credit risk standard, as updated regularly, establishes
and defines the principles to be applied in credit risk decisions
and sets out the overall framework for the consistent and unified
governance, identification, measurement, management and
reporting of credit risk in Stanbic IBTC.
Deriving from the credit risk standard, the Corporate and
Investment Banking (CIB) credit policy, and the Personal and
Business Banking (PBB) credit policy have been formulated to
complement and operationalise the principles set out in the
credit standard. These policies provide a comprehensive
framework within which all credit risk emanating from the
operations of Stanbic IBTC are properly identified, quantified,
assessed, approved, legally executed, monitored and
controlled in order to minimize the risk of financial loss; and
assure consistency of approach in the treatment of regulatory
compliance requirements. 				
					
In addition to the credit standard, CIB and PBB policies, a number
of related credit policies and documents have been developed,
with contents that are relevant to the full implementation and
understanding of the credit policies. Some of these policies/
documents are as stated below:
	
·         Credit counterparty rating policy	
·         Country risk standard			
·         Credit governance framework
·         The Basel II Accord		
·         Credit risk review policy		
·         Credit portfolio limit framework	
·         Collateral valuation guideline		
·         Controls breach framework
Methodology for risk rating	
The starting point of all credit risk assessment and evaluation
lies in the counterparty risk grading, which is quantified and
calculated in compliance with the group’s credit rating policy and
using such Basel-2 compliant models as are in current use and
which are updated or enhanced from time to time. 		
			
Credit risk quantification for any exposure or portfolio is
summarised by the calculation of the expected loss (EL), which
125
Financial risk analysis
is arrived at in the following way: 			
		
·	 Based on the risk grading foundation which yields the
	 counterparty’s probability of default (PD), the nature and
	 quantum of the credit facilities are considered;	
· 	 A forward-looking quantification of the exposure at
	 default (EAD) is determined in accordance with group
	 standard guidelines.
·	 Risk mitigants such as security and asset recovery
	 propensities are then quantified to moderate exposure at
	 default to yield the loss given default (LGD).
· 	 Finally, the EL is a function of the PD, the LGD and the EAD.
		
These parameters are in turn used in quantifying the required
regulatory capital reserving, using the regulatory Capital
Calculator developed, maintained and updated in terms of Basel
2, and the economic capital implications through the use of
Credit Portfolio Management’s (CPM’s) Economic Capital tools.
Furthermore, bearing in mind the quantum of the facility and
the risk/reward thereof, an appropriate consideration of Basel
2 capital requirements (where applicable) and the revenue and
return on equity implications of the credit proposal is mandatory
in all credit applications and reviews.
Framework and governance	 			
Credit risk remains a key component of financial risks faced by
any bank given the very nature of its business. The importance
of credit risk management cannot be over emphasized as
consequences can be severe when neglected. Stanbic IBTC has
established sound governance principles to ensure that credit risk
is managed effectively within a comprehensive risk management
control framework.
The principles guiding the assumption of credit risk and the
overall framework for its application, governance, and reporting
is defined in the Credit Risk Standard. 			
	
The standard covers all forms of credit risk, intentional or
otherwise, and is supported by credit risk policies and procedures
to the extent required to further define the credit risk framework
and its implementation across the bank. 			
					
In reaching credit decisions and taking credit risk, both the credit
and business functions must consistently and responsibly balance
risk and return, as return is not the sole prerogative of business
neither is credit risk the sole prerogative of credit. Credit (and
the other risk functions, as applicable) and business must work
in partnership to understand the risk and apply appropriate
risk pricing, with the overall aim of optimising the bank’s risk
adjusted performance.				
							
The standard, policies and procedures and compliance therewith are
not substitutes for common sense and good business judgment.	
The reporting lines, responsibilities and authority for managing
credit risk in Stanbic IBTC are very clear and independent.
However, ultimate responsibility for credit risk rests with the
board and which has delegated this to the following organs: 	
Board credit committee	
The purpose of the board credit committee is to ensure that
effective credit governance is in place in order to provide for the
adequate management, measurement, monitoring and control of
credit risk including country risk. In addition to its pre-existing
role, the committee has also been vested with the following
responsibilities as may be set by the board:		
• 	 setting overall risk appetite;			
• 	 reviewing and approving credit facilities that are within
	 monetary amounts as approved by the board;		
• 	 ensuring committees within the structure operate according
	 to defined mandates and delegated authorities; 		
• 	 maintaining overall accountability and authority for the
	 adequacy and appropriateness of all aspects of the bank
	 credit risk management process;			
• 	 utilising appropriate tools to measure, monitor and control
	 credit risk in line with the SBG policies whilst taking into
	 account local circumstances;			
• 	 recommending the bank’s credit policies and guidelines for
	 board approval; and				
• 	 any other matters relating to credit as may be delegated to
	 the committee by the board.
Credit risk management committee
The credit risk management committee (CRMC) is the senior
management credit decision-making function and it operates within
defined authority as determined by the board credit committee.	
				
The CRMC effectively enhances credit discipline within the
bank and is responsible for controlling, inter alia, delegated
authorities, concentration risk, distressed debt and regulatory
issues pertaining to credit, credit audits, policy and governance.	
		
In addition to the above, the CRMC provides oversight of
governance; recommends to the board credit committee the
level of the bank’s risk appetite; monitors model performance,
development and validation; determine counterparty and
For the year ended 31 December 2010
Stanbic IBTC Bank PLC Annual Report 2010 126
Annualreportand
financialstatements
portfolio risk limits and approval, country, industry, market,
product, customer segment and maturity concentration risk; risk
mitigation; impairments and risk usage. 		
Head of credit 					
		
The head of credit has functional responsibility for credit risk
management across the bank and is positioned at a sufficiently
senior level in order to ensure the necessary experience and
independence of judgment. 				
				
The head of credit is responsible for providing an independent
and objective check on credit risk taking activities to safeguard
the integrity of the entire credit risk process. The head of credit
is ably supported by the heads of CIB credit and PBB credit to
ensure granularity and function-specific details at the business
unit levels.						
Credit risk mitigation 				
						
Guarantees, collateral and the transaction structure are used
by the bank to mitigate credit risks both identified and inherent
though the amount and type of credit risk is determined on a
case by case basis. The bank’s credit policy and guidelines are
used in a consistent manner while security is valued appropriately
and reviewed regularly for enforceability and to meet changing
business needs. 					
						
The main types of collateral taken comprise bonds over
residential, commercial and industrial properties, bonds over
plant and equipment, liquid and tradable financial instruments
and, for leases, the underlying moveable assets financed.	
						
The group has a collateral policy which establishes and defines
the principles of accepting, verifying, maintaining, and releasing
collateral. Processes and procedures are well documented in order
to ensure appropriate application of the collateral management
techniques, which cover at least the following requirements:	
					
• 	 Acceptable collateral management techniques and any
	 conditions or restrictions applicable to them;		
• 	 Acceptable methodologies for the initial and subsequent
	 valuations including how often collateral will be re-valued;	
• 	 Process and completion of the collateral documentation in
	 a timely manner;				
• 	 The valuation, verification, and appraisal of all collateral;	
• 	 The maximum loan-to-value percentages, minimum haircuts
	 or other volatility adjustments applicable to each type of
	 collateral;	
• 	 The means by which legal enforceability and certainty is
	 to be established, including required documentation and all
	 necessary steps required to establish legal rights;	
•	 Lien and title perfection for the collateral;		
•	 Recognition and management of any correlation between
	 the credit risk of the customer and the value of collateral;	
• 	 The rigorous monitoring and control of collateral to ensure
	 its continued effectiveness;			
• 	 Actions to be taken in the event the current value of
	 collateral falls below required levels;			
• 	 Management of concentration risks, e.g. setting maximum
	 limits on the acceptability of the collateral from a number
	 of customers;					
• 	 Timely liquidation of the collateral;			
• 	 Filing of collateral claims properly and timely;		
• 	 Determining price at which the collateral may be sold;	
• 	 Receiving and releasing of collateral must be handled by
	 individuals other than those who record the collateral.
127
NGN000,000
Group’s rating Global  Africa Credit Committee
/ Board Credit Committee
Management
Credit Committee
Country
Credit Head/
Head of CIB Credit
Maximum Approval Limit (Nmillion)
Corporate  investment banking
SB01 - SB10 Up to legal lending limit Up to legal lending limit Up to legal lending limit
SB11 - SB12 Up to legal lending limit Up to legal lending limit 10,600
SB13 Up to legal lending limit Up to legal lending limit 7,600
SB14 - SB15 Up to legal lending limit Up to legal lending limit 4,500
SB16 - SB18 Up to legal lending limit 12,000 3,800
SB19 - SB20 Up to legal lending limit 6,000 1,500
SB21 Up to legal lending limit 4,500 1,500
SB22 - SB23 Up to legal lending limit 4,500 800
SB24 - SB25 Up to legal lending limit 4,500 600
Personal  business banking
SB01 - SB25 Up to legal lending limit 2,250 930
Corporate  investment banking (CIB)
Financial risk analysis
For the year ended 31 December 2010	
Credit delegated authority	 		
Authority for approval of any credit facilities accorded to
counterparties is vested only in individuals, and/or groups of
individuals acting in concert, and/or credit committees, in terms
of specific delegated authority (DA) levels approved (and updated
from time to time) by the board upon advise. Such DA levels are
quantified according to counterparty risk grade. Individuals may
be accorded DA levels on the authority of the parties specifically
mandated to do so in terms of the credit governance framework.
In responding to credit applications, named parties or committees
exercising their DA mandates will only do so against:		
			
• 	 a recommendation from the business and credit sponsor(s)
	 of the credit proposal;				
• 	 a recommendation from the relevant balance sheet owner
	 for all committed term lending exposures in excess of
	 3 months; 					
• 	 a recommendation from the respective product houses
	 materially represented in the credit proposal; 		
• 	 where total facilities to be approved for any counterparty
	 exceed the relevant credit evaluation manager’s (CEM) own
	 DA level, support is required from that CEM;	
• 	 a recommendation from distribution committee/team; and
• 	 a sign off from country risk committee for any cross border
	 facilities.				
			
Delegated authority mandates held by committees or individuals
may not be further delegated.				
					
Where a credit facility is originated by the holder of a DA, that
proposal requires to be submitted to another DA holder for
approval, in keeping with the spirit of the four-eyes principle.
The internal credit approval limits is shown in the table below.	
The global credit committee approves based on the mandate given to them by the board credit committee.
All approvals are sanctioned by the board credit committee.
The board credit committee approves all insider-related credit irrespective of the amount.
Stanbic IBTC Bank PLC Annual Report 2010 128
Annualreportand
financialstatements
Credit risk measurement	 			
				
The global credit committee and Africa credit committee
approve based on the mandate given to them by the board
credit committee. All approvals are sanctioned by the board
credit committee.					
				
The board credit committee approves all insider-related credit
irrespective of the amount.				
A key element in the measurement of credit risk is the
assignment of credit ratings. All customers including corporate,
individuals and institutions and special purpose vehicles (SPVs)
are awarded risk gradings to determine expected defaults across
asset portfolios and risk bands. The risk ratings attributed to
counterparties are based on a combination of factors which
cover business and financial risks: 			
			
•	 all counterparties for which the bank has facility limits in
	 place are assigned a credit rating. The rating is forward
	 looking (i.e. predictive in nature) and discriminatory (i.e.
	 ability to rank order). However, all local ratings are capped
	 by the country rating;		
•	 a foreign currency rating and associated probability of
	 default(PD)mustbeusedforallexposurestocounterparties
	 in a currency other than naira;
•	 facility risk arising from exposure and/or facility specific
	 factors such as collateral and seniority must be measured
	 and addressed as part of the credit risk
	 mitigation analysis and should not affect or impact on
	 the counterparty rating;	
•	 external support, as distinct from mitigants, can be
	 recognised in the rating process on a defined basis provided
	 it is consistently applied;
•	 the process and methodology to assign a rating to each
	 counterparty and a PD to each rating must be the
	 responsibility of, and signed off by, the credit committee;
	 and		
•	 pricing must be based on the risk grades assigned to the
	 counterparty.	
The group has adopted the PD Master Scale rating concept with
a single scale to measure the credit riskiness of all counterparty
types. The grading system changed from a 21-point scale for
performing assets, with three additional default grades, to a 25-
point scale, with three additional default grades (unchanged).	
			
Some advantages of a PD Master Scale include the ability
to compare entities in terms of default risk across portfolios
andtheremovalofalldependencyonaspecificmodel’scalibration
going forward, making future enhancements to models easier
to implement.					
The table below shows a view of an indicative external rating
equivalent bearing in mind that these equivalents may change
from time to time i.e.
Group’s rating Grade description External
rating
SB01 - SB12/SB13 Investment grades AAA to BBB-
SB13 - SB25 Speculative grades BB- to CCC
Provisioning policies	 		
The internal and external rating systems focus more on credit-
quality mapping from the inception of the lending and investment
activities. In contrast, loan loss provisions are recognised for
financial reporting purposes only for losses that have been
incurred at the balance sheet date based on criteria set out in the
Prudential Guidelines for licenced bank.
129
Financial risk analysis
Provision against credit risk	 	
Provision is made in accordance with the Statement of Accounting Standard for Banks and Non-Bank Financial Institutions (SAS 10) issued by
the Nigerian Accounting Standard Board and Prudential Guidelines issues by the Central Bank of Nigeria.
Provision adequacy						
Nmillion Gross NPL
balance
Interest in
suspense
Net NPL Provision Provision
adequacy
Security value
(NPV)
Margin lending 1,031 328 703 606 86% 304
Oil  gas 8,025 686 7,339 3,457 47% 9,190
Others 5,181 456 4,725 2,372 50% 4,088
Closing balances 14,237 1,470 12,767 6,435 50% 13,582
For the year ended 31 December 2010	
Non performing loan analysis				
The tables below show analyses of non performing loans as at 31 December 2010.
Group
2010
Nmillion
Group
2009
Nmillion
Performing 172,905 114,270
Non-performing: - substandard 1,499 1,764
- doubtful 9,990 11,501
- lost 2,748 5,565
187,142 133,100
Performing but past due loans
									
Loans and advances less than 90 days past due are considered performing, unless other information is available to indicate the contrary. Gross
amount of loans and advances by class to customers that were past due but performing were as follows:				
										
At 31 December 2010 Retail
Nmillion
Corporate
Nmillion
SME
Nmillion
Financial institutions
Nmillion
Total
Nmillion
Past due up to 30 days 9,843 8,664 - - 18,507
Past due 30 - 60 days 826 - - - 826
Past due 60 - 90 days 179 636 - - 815
10,848 9,300 - - 20,148
At 31 December 2009
Past due up to 30 days 6,152 13,766 - - 19,918
Past due 30 - 60 days 308 1,194 - - 1,502
Past due 60 - 90 days 187 2,215 - - 2,402
6,647 17,175 - - 23,822
Risk assets (loans and advances, advances under finance leases, off-balance sheet direct credit substitutes, etc)
Loans  advances and advances under finance leases are summarised as follows:
Stanbic IBTC Bank PLC Annual Report 2010 130
Annualreportand
financialstatements
Group
2010
Nmillion
Group
2009
Nmillion
Agriculture 2 -
General commerce 3,194 7,212
Manufacturing 12 284
Mining and quarrying 8,025 8,134
Real estate and construction 6 2,274
Finance and insurance 800 559
Government - -
Transportation 1,814 108
Communication 384 259
14,237 18,830
				
Group
2010
Nmillion
Group
2009
Nmillion
South South 1 226
South West 13,004 17,610
South East 63 70
North West 275 72
North Central 893 852
North East 1 -
14,237 18,830
										
Non-performing loans by industry
Non-performing loans by geography
131
Financial risk analysis
									
At 31 December 2010 Due from
banks
Nmillion
Loans and
advances
Nmillion
Advances under
finance lease
Nmillion
Debt
instruments
Nmillion
Total
Nmillion
South South - 3,758 97 - 3,855
South West 33,688 154,853 11,743 38,722 239,006
South East - 1,632 1,437 - 3,069
North West - 5,938 343 - 6,281
North Central - 6,342 498 - 6,840
North East - 221 280 - 501
Outside Nigeria 54,971 - - - 54,971
88,659 172,744 14,398 38,722 314,523
At 31 December 2009 Due from
banks
Nmillion
Loans and
advances
Nmillion
Advances under
finance lease
Nmillion
Debt
instruments
Nmillion
Total
Nmillion
South South - 2,045 - - 2,045
South West 30,313 116,496 9,509 62,309 218,627
South East - 959 - - 959
North West - 1,784 - - 1,784
North Central - 2,249 - - 2,249
North East - 58 - - 58
Outside Nigeria 46,641 - - - 46,641
76,954 123,591 9,509 62,309 272,363
Concentration of risks of financial assets with credit risk exposure						
	 		
(a) 	 Geographical sectors				
	 The following table breaks down the group’s main credit exposure at their carrying amounts, as categorised by geographical region as of
	 31 December 2009. For this table, the group has allocated exposures to regions based on the region of domicile of our counterparties.
For the year ended 31 December 2010
Stanbic IBTC Bank PLC Annual Report 2010 132
Annualreportand
financialstatements
(b) 	 Industry sectors	
										
At 31 December 2010 Due from
banks
Nmillion
Loans and
advances
Nmillion
Advances under
finance lease
Nmillion
Debt
instruments
Nmillion
Total
Nmillion
Agriculture - 1,393 82 - 1,475
Oil and gas - 10,325 329 - 10,654
Capital market - 662 - - 662
Consumer credit - 19,746 3,045 - 22,791
Manufacturing - 37,255 1,205 - 38,460
Mining and quarrying - 10,581 63 - 10,644
Mortgage - 10,643 - - 10,643
Real estate and construction - 7,595 35 1,000 8,630
Finance and insurance 88,659 376 114 2,502 91,651
Government - 3,668 258 35,220 39,146
Power - 11,512 - - 11,512
General commerce - 25,868 3,927 - 29,795
Public utilities - 343 - - 343
Transportation - 775 5,179 - 5,954
Communication - 31,978 115 - 32,093
Education - 24 47 - 71
88,659 172,744 14,399 38,722 314,524
At 31 December 2009 Due from
banks
Nmillion
Loans and
advances
Nmillion
Advances under
finance lease
Nmillion
Debt
instruments
Nmillion
Total
Nmillion
Agriculture - 637 2 - 639
Oil and gas - 25,982 291 - 26,273
Capital Market - 13 619 - 632
Consumer credit - 11,265 2,471 - 13,736
Manufacturing - 40,419 950 - 41,369
Mining and quarrying - 80 - - 80
Mortgage - 2,341 3 - 2,344
Real estate and construction - 2,320 4 - 2,324
Finance and insurance 76,954 1,371 1,286 3,739 83,350
Government - 406 - 58,570 58,976
Power - 2,262 - - 2,262
General commerce - 18,370 1,905 - 20,275
Public utilities - 2,376 51 - 2,427
Transportation - 900 1,635 - 2,535
Communication - 14,602 247 - 14,849
Education - 247 45 - 292
76,954 123,591 9,509 62,309 272,363
133
Financial risk analysis
		
At 31 December 2010 A+ to A- BBB+ to BB- Below BB- Unrated Total
- 197,762 93,411 23,321 314,524
- 197,762 93,411 23,321 314,524
Analysis by portfolio distribution and risk rating
At 31 December 2009 A+ to A- BBB+ to BB- Below BB- Unrated Total
- 140,477 118,175 13,711 272,363
- 140,477 118,175 13,711 272,363
For the year ended 31 December 2010
Stanbic IBTC Bank PLC Annual Report 2010 134
Annualreportand
financialstatements
Foreign exchange risk
								
The group takes on exposure to the effects of fluctuations in the prevailing foreign currency exchange rates on its financial position and
cash flows. The board sets limits on the level of exposure by currency and in aggregate for both overnight and intra day positions, which are
monitored daily. The table below summarises the group’s exposure to foreign currency exchange risk at 31 December.
				
At 31 December 2010
Asset
Naira
Nmillion
US Dollar
Nmillion
GBP
Nmillion
Euro
Nmillion
Others
Nmillion
Total
Nmillion
Cash and balances with CBN 8,945 433 457 180 33 10,048
Treasury Bills 12,428 - - - - 12,428
Due from other banks 22,518 62,852 791 1,862 636 88,659
Loans and advances to customers 123,496 40,451 - 5 - 163,952
Advances under finance lease 13,502 - - - - 13,502
Investment securities 47,306 279 - - - 47,585
Investment in subsidiaries - - - - - -
Deffered tax asset 939 - - - - 939
Other assets 3,106 9,093 17 20 3,940 16,176
Property and equipment 31,252 - - - - 31,252
Total assets 263,492 113,108 1,265 2,067 4,609 384,541
Liabilities
Customer deposits 157,767 25,832 2,307 526 34 186,466
Due to other banks 36,337 19,795 - - 20 56,152
Other borrowings 3,910 14,362 - - - 18,272
Other liabilities 21,365 6,572 162 1,556 4,565 34,220
Current income tax 4,197 - - - - 4,197
Deffered tax liabilities 108 - - - - 108
Total liabilities 223,684 66,561 2,469 2,082 4,619 299,415
Net on-balance sheet financial position 39,808 46,547 (1,204) (15) (10) 85,126
Off balance sheet 56,237 (44,186) 1,255 1,014 541 14,861
At 31 December 2009 Naira
Nmillion
US Dollar
Nmillion
GBP
Nmillion
Euro
Nmillion
Others
Nmillion
Total
Nmillion
Total assets 262,778 71,516 1,167 4,854 175 340,490
Total liabilities (194,570) (58,994) (1,373) (3,949) (107) (258,993)
Net on-balance sheet financial position 68,208 12,522 (206) 905 68 81,497
Off balance sheet 28,274 (11,602) 426 (827) (73) 16,198
Concentrations of currency risk – on- and off-balance sheet financial instruments
135
Financial risk analysis
For the year ended 31 December 2010	
Market risk	
			
The identification, management, control, measurement and
reporting of market risk is categorised as follows:
			
Trading market risk	
These risks arise in trading activities where the bank acts as a
principal with clients in the market. The group policy is that all
trading activities are contained within the group’s CIB trading
operations.
				
Banking book interest rate risk
These risks arise from the structural interest rate risk caused
by the differing repricing characteristics of banking assets and
liabilities.						
			
Foreign currency risk			
These risks arise as a result of changes in the fair value or future
cash flows of financial exposures as a result of changes in foreign
exchange rates other than those included in the Value at Risk
(VaR) analysis for CIB’s trading positions.			
		
Equity investment risk			
These risks arise from equity price changes caused by listed
and unlisted investments. This risk is managed through the
equity investment committee, which is a sub-committee of the
executive committee.
				
Framework and governance		
The board approves the market risk appetite and standards for
all types of market risk. The board grants general authority to
take on market risk exposure to the asset and liability committee
(ALCO). ALCO sets market risk policies to ensure that the
measurement, reporting, monitoring and management of market
risk associated with operations of the bank follow a common
governance framework. The bank’s ALCO reports to EXCO and
also to board risk committee.
				
The in-country risk management is subject to SBG oversight for
compliance with group standards and minimum requirements.	
The market risk management unit which is independent of
trading operations and accountable to ALCO, monitors market
risk exposures due to trading and banking activities. This unit
monitors exposures and respective excesses daily, report monthly
to ALCO and quarterly to the board risk committee.		
Market risk measurement	 			
					
The techniques used to measure and control market risk
include:						
				
•	 daily net open position				
• 	 daily VaR;					
• 	 back-testing;					
• 	 PV01;					
•	 other market risk measures; and		
• 	 annual net interest income at risk.			
				
Daily net open position			
The board on the input of ALCO sets limits on the level of exposure
by currency and in aggregate for overnight positions. The latter
is also aligned to the net open position limit as specified by the
regulators, which is usually a proportion of the group’s capital.	
					
Daily value-at-risk (VaR)			
VaR is a technique that estimates the potential losses that occur
resulting from market movements over a specified time period
and a predetermined probability. 			
				
VaR limits and exposure measurements are in place for foreign
currency risks. The bank generally uses the historical VaR
approach to derive quantitative measures, specifically for market
risk under normal market conditions. Normal VaR is based on a
holding period of one day and a confidence level of 95%. Daily
losses exceeding the VaR are likely to occur, on average, 13 times
in every 250 days.
The use of historic VaR has limitations as it is based on historical
correlations and volatilities in market prices and assumes that
future prices will follow the observed historical distribution.
Hence, there is a need to back-test the VaR model regularly.	
VaR back-testing	 				
The bank back-tests its foreign currency exposure VaR model
to verify the predictive ability of the VaR calculations thereby
ensuring the appropriateness of the model. Back-testing exercise
is an ex-post comparison of the daily hypothetical profit and loss
under the one-day buy and hold assumption to the prior day
VaR. Profit or loss for back-testing is based on the theoretical
profits or losses derived purely from foreign currency spot moves
and it is calculated over 250 cumulative trading-days at 95%
confidence level.
Stanbic IBTC Bank PLC Annual Report 2010 136
Annualreportand
financialstatements
Stress tests					
					
Stress testing provides an indication of the potential losses that
could occur in extreme market conditions and is carried out to
augment other risk measures that are used by the bank, such as
VaR and market risk factor sensitivities. These stress scenarios are
typically used to highlight exposures that may not be explicitly
incorporated by the VaR and specific sensitivity calculations,
such as basis or correlation risks and out of the money option
positions that can be the source of large losses when abnormally
large market movements occur. Stress testing also attempts to
indicate the size of the loss provoked by any of a number of
unlikely but possible shock events given current positions held.	
			
The stress tests carried out include individual market risk factor
testing and combinations of market factors on individual asset
classes and across different asset classes. Stress tests include a
combination of historical and hypothetical simulations.		
					
PV01						
PV01 is a risk measure used to assess the effect of a change of
rate of one basis point on the price of an asset. This limit is set
for the fixed income and money market trading portfolios.	
					
Other market risk measures	 			
Other market risk measures specific to individual business units
include permissible instruments, concentration of exposures,
gap limits, maximum tenor and stop loss triggers. In addition,
only approved products that can be independently priced and
properly processed are permitted to be traded. 		
					
Pricing models and risk metrics used in production systems,
whether these systems are off-the-shelf or in-house developed,
areindependentlyvalidatedbythemarketriskunitbeforetheiruse
and periodically thereafter to confirm the continued applicability
of the models. In addition, the market risk unit assesses the daily
liquid closing price inputs used to value instruments and performs
a review of less liquid prices from a reasonableness perspective
at least fortnightly. Where differences are significant, mark-to-
market adjustments are made.				
Annual net interest income at risk
A dynamic forward-looking annual net interest income forecast
is used to quantify the banks’ anticipated interest rate exposure.
This approach involves the forecasting of both changing balance
sheet structures and interest rate scenarios, to determine the
effect these changes may have on future earnings. The analysis
is completed under both normal market conditions as well as
stressed market conditions.				
	
Distribution of trading income in 2010
The histogram below shows the distribution of daily income
and losses during 2010. It captures trading income volatility
and shows the number of days in which the bank’s trading
related revenues fell within particular ranges. The distribution is
skewed to the profit side. Overall, it shows that trading income
was realised on 206 days out of a total of 248 days with 26
positive out-liers. 	
Analysis of fx value-at-risk (VaR) and actual income	
					
The graph below shows the normal VaR analysis and the actual
income of the foreign currency trading unit in 2010. It reflects
a relative stability in VaR amount despite the fluctuation in
trading income. 					
Frequency of Trading Days
Loss Profit
15
20
0
5
10
40
25
30
35
60
45
50
55
-120
-120≤-105
-105≤-90
-90≤-75
-75≤-60
-60≤-45
-45≤-30
-30≤-15
-15≤0
0≤15
15≤30
30≤45
45≤60
60≤75
75≤90
90≤105
105≤120
120
Foreign Exchange Trading Income  Normal VaR 2009/2010
-600
1,500
1,200
900
600
300
0
-300
Jan-09
Jan-09
Jan-09
Feb-09
Feb-09
Mar-09
Mar-09
Apr-09
Apr-09
May-09
May-09
Jun-09
Jun-09
Jul-09
Jul-09
Jul-09
Aug-09
Aug-09
Sep-09
Sep-09
Oct-09
Oct-09
Nov-09
Nov-09
Dec-10
Dec-10
Jan-10
Jan-10
Jan-10
Feb-10
Feb-10
Mar-10
Mar-10
Apr-10
Apr-10
May-10
May-10
Jun-10
Jun-10
Jul-10
Jul-10
Jul-10
Aug-10
Aug-10
Sep-10
Sep-10
Oct-10
Oct-10
Nov-10
Nov-10
Dec-10
Dec-10
FX PL (USD) Normal VaR
137
Financial risk analysis
For the year ended 31 December 2010	
The table below shows the historical VaR utilisation for the bank’s foreign currency trading positions. The minimum and maximum VaR
amounts stood at US$613 and US$158,060 respectively with an annual average of US$62,800, which translates to a very conservative
percentage VaR base limit utilisation of 23% on average.	
FX VaR (USD) Minimum Average Maximum 31 Dec 2010 31 Dec 2009
Normal VaR 613 62,800 158,060 47,705 29,553
Stress VaR 5,939 1,508,413 3,580,457 1,993,395 350,890
Analysis of PV01	 				
The table below shows the PV01 of the money market banking
and trading books as well as fixed income. The trading book PV01
exposure was N1.65 million and banking book PV01 exposure
stood at N5.62 million while the fixed income PV01 exposure
of N0.15 million, thus reflecting a very conservative exposure
utilisation. Overall, limit discipline was very good. 	
						
		 		
PVO1 (N000) 2010 2009 Limit
Money market
trading book
1,659 6,137 7,780
Money market
banking book
5,625 6,651 13,230
Fixed income 151 265 3,400
Analysis of banking book market risk exposures
				
Banking-related market risk exposure principally involves
the management of the potential adverse effect of interest
movement on net interest income. 			
The risk is transferred to and managed within the bank’s
treasury operations under supervision of ALCO. A dynamic,
forward-looking net interest income forecast is used to quantify
the bank’s anticipated interest rate exposure. This approach
involves the forecasting of both changing balance sheet
structures and interest rate scenarios, to determine the effect
these changes may have on future earnings. Balance sheet
projections and the impact on net interest income due to rate
changes normally cover a minimum of 12 months forecasting.
The analysis allows for the dynamic interaction of payments,
new business and interest rates, and also captures the effects of
embedded or explicit options.				
					
Stress
condition
Utilisation
(%age)
31 Dec 2010
Limit
LCY interest
rate shock
Rates up
200 bps
6.69 10%
Rates down
200 bps
(7.75) 10%
FCY interest
rate shock
Rates up 75
bps
(2.25) 10%
Rates down
75 bps
1.00 10%
Market risk on equity investment
The equity committee has governance and oversight of all
investment decisions. The committee is tasked with the
formulation of risk appetite and oversight of investment
performance. In this regard, a loss trigger is in place for the non-
strategic portion.				
			
The analyses are done under normal market conditions i.e.
under a bullish, expected and bearish interest rate scenario and,
under stressed market conditions in which the banking book is
subjected to an upward and downward 200 basis points parallel
rate shock for local currency and 75 basis points for foreign
currency.	
The table below shows the sensitivity of the bank’s net interest
income in response to standardised parallel rate shocks. The
impacts of the rate shocks on the bank’s net interest income are
well within the 10% limit.
Stanbic IBTC Bank PLC Annual Report 2010 138
Annualreportand
financialstatements
Liquidity risk
Framework and governance
The nature of banking and trading activities results in a
continuous exposure to liquidity risk. Liquidity problems can
have an adverse impact on a bank’s earnings and capital and,
in extreme circumstances, may even lead to the collapse of a
bank which is otherwise solvent. Hence, sound liquidity risk
management is pivotal to the viability of every bank and the
maintenance of overall banking stability. 			
						
The bank’s liquidity risk management framework is designed to
measure and manage the liquidity position at various levels of
consolidation such that payment obligations can be met at all
times, under both normal and considerably stressed conditions.
Under the delegated authority of the board of directors,
ALCO sets liquidity risk policies in accordance with regulatory
requirements and international best practice. 		
						
Limits and guidelines are prudently set and reflect the bank’s
conservative appetite for liquidity risk. ALCO is charged with
ensuring compliance with liquidity risk standards and policies. 	
	
Liquidity and funding management			
			
A sound and robust liquidity process is required to measure,
monitor and manage liquidity exposures. The bank has
incorporated the following liquidity principles as part of a
cohesive liquidity management process:			
• 	 structural liquidity mismatch management;		
• 	 long-term funding ratio;				
• 	 back-testing;					
• 	 maintaining minimum levels of liquid and marketable 	
	 securities;					
• 	 depositor concentration;				
• 	 local currency loan to deposit limit;		
• 	 foreign currency loan to deposit limit;			
• 	 intra-day liquidity management;			
• 	 daily cash flow management;			
•	 liquidity stress and scenario testing; and		
•	 liquidity contingency planning.
		
The cumulative impact of the above principle is monitored, at
least monthly by ALCO and the process is underpinned by a
system of extensive controls. The latter includes the application
of purpose-built technology, documented processes and
procedures, independent oversight and regular independent
reviews and evaluations of the effectiveness of the system.	
Structural liquidity mismatch management
The mismatch approach measures a bank’s liquidity by assessing
the mismatch between its inflow and outflow of funds within
different time bands on a maturity ladder. The structural
liquidity mismatch is based on behaviourally-adjusted cash flows
which factors a probability of maturity into the various time
bands. Detailed assumptions and reasoning applied in compiling
the structural liquidity mismatch are well documented. 	
							
• 	 In the main, readily available liquidity is profiled based on
	 realistic liquidation periods (including appropriate forced-
	 sale discounts), while other cash flows with a predetermined
	 runoff must are profiled according to their remaining
	 contractual maturity;				
• 	 ambiguous maturity loan and advance products are profiled
	 using an attrition analysis;				
• 	 ambiguous maturity deposit and borrowing products are
	 profiled using a volatility analysis, except where such
	 products do not exhibit term behaviour, in which case they
	 are profiled in the sight-to-7 day maturity bucket;	
• 	 material, off-balance sheet facilities granted by the bank
	 are profiled on the basis of probable drawdown;	
• 	 all other cash flow items or positions in respect of which no
	 right or obligation in respect of maturity exists are profiled
	 in the 12 months maturity bucket.		
A net mismatch figure is obtained by subtracting liabilities and
net off-balance sheet positions from assets in each time band.
The bank’s liquidity position is assessed by means of the net
cumulative mismatch position (aggregation of net position in
each successive time band), expressed as a percentage of total
funding related liabilities to the public.			
			
The maturity analysis for financial liabilities represents the basis
for effective management of exposure to structural liquidity
risk. Behavioural profiling is applied to assets, liabilities and off-
balance sheet commitments with an indeterminable maturity
or draw-down period, as well as to certain liquid assets. The
monitoring of liquidity risk using the behavioural adjusted basis
is facilitated by the adoption of maximum mismatch limits and
guidelines to restrict the mismatch between the expected
inflows and outflows of funds in different time buckets. The
tables below show that the bank’s net cumulative anticipated
mismatches between assets and liabilities for both local currency
and foreign currency were positive in the shortest time band.
139
Financial risk analysis
For the year ended 31 December 2010	
Anticipated liquidity gap (local currency) - All figures in millions
	 							
Period Overnight
1
month
2
months
3
months
4-6
months
7-12
months
13-24
months
 24
months
Period gap 23,123 (27,113) (12,505) 10,792 (4,621) (3,482) 81,049 (27,242)
Cumulative gap 23,123 (3,990) (16,495) (5,703) (10,324) (13,806) 67,243 40,001
Anticipated liquidity gap (foreign currency) - All figures in millions	
	 						
Period Overnight
1
month
2
months
3
months
4-6
months
7-12
months
13-24
months
 24
months
Period gap 44 (62) 6 6 (10) (30) (251) 42
Cumulative gap 44 (18) (12) (6) (16) (46) (297) (255)
The bank’s ability to withstand huge outflow was very strong as shown in the tables below where the net cumulative mismatch
positions as a percentage of total funding related liabilities were in excess of the limits in all the time bands.
Cumulative gap as a % of TFLRP (local currency)
					
Cumulative gap as a %
of TFLRP* Overnight
1
month
2
months
3
months
4 - 6
months
7 - 12
months
Dec’10 11.60% (2.00%) (8.30%) (2.90%) (5.20%) (6.90%)
Dec’09 33.90% 23.40% 22.00% 26.40% 16.10% 8.30%
Limit 0% (5%) (10%) (10%) (15%) (20%)
Cumulative gap as a % of TFLRP* (foreign currency)
					
Cumulative gap as a %
of TFLRP* Overnight
1
month
2
months
3
months
4 - 6
months
7 - 12
months
Dec’10 10.80% (4.20%) (2.90%) (1.40%) (3.80%) (11.20%)
Dec’09 45.30% 67.90% 70.80% 60.50% 54.00% 46.70%
Limit 0% (5%) (10%) (10%) (15%) (20%)
* TFLRP - Total funding liability related to public.	 					
Based on forecast business growth and the structural dynamics of the balance sheet, ALCO projects long-term funding requirements, thereby
setting targets for long-term funding ratios. The projected long-term ratio is a transparent and practical measure for the funding desk to target
and monitor the pace of raising long-term deposits. There are no limits for mismatches due to contractually based inflows and outflows.
Stanbic IBTC Bank PLC Annual Report 2010 140
Annualreportand
financialstatements
Maintaining minimum levels of liquid and marketable assets
Minimum levels of prudential liquid assets are held in accordance
with all prudential requirements as specified by the regulatory
authorities. The bank holds additional unencumbered
marketable assets, in excess of any minimum prudential liquid
asset requirement, to cater for volatile depositor withdrawals,
draw-downs under committed facilities, collateral calls, etc. The
following criteria apply to readily marketable securities:	
• 	 prices must be quoted by a range of counterparties;	
•	 the asset class must be regularly traded;		
•	 the asset may be sold or repurchased in a liquid market, for
	 payment in cash; and				
•	 settlement must be according to a prescribed, rather than a
	 negotiated, timetable. 				
	
Depositor concentration
To ensure that the bank does not place undue reliance on any
single entity as a funding source, restrictions are imposed on
the short dated (0 – 3 months term) deposits accepted from any
entity. These include:			
• 	 the sum of 0 – 3 month deposits and standby facilities
	 provided by any single deposit counterparty must not, at
	 any time, exceed 10% of total funding related liabilities to
	 the public; and
• 	 the aggregate of 0 – 3 month deposits and standby facilities
	 from the 10 largest single deposit counterparties must not,
	 at any time, exceed 20% of total funding related liabilities
	 to the public.
			
Concentration risk limits are used to ensure that funding
diversification is maintained across products, sectors, and
counterparties. Primary sources of funding are in the form of
deposits across a spectrum of retail and wholesale clients. As
mitigants, the bank maintains marketable securities in excess of
regulatory requirement in order to condone occasional breaches
of concentration limits.
	
Loan to deposit limit 		 		
A limit is put in place, restricting the local currency loan to
deposit ratio to a maximum specified level, which is reviewed
periodically. Similarly, in order to restrict the extent of foreign
currency lending from the foreign currency deposit base, a
foreign currency loan to deposit limit, which is also referred to
as own resource lending, is observed. As mitigants, the bank
maintains high levels of unencumbered marketable and liquid
assets in excess of regulatory benchmark. 			
		
Intra-day liquidity management	 		
The bank manages its exposures in respect of payment and
settlement systems. Counterparties may view the failure to
settle payments when expected as a sign of financial weakness
and in turn delay payments to the bank. This can also disrupt the
functioning of payment and settlement systems. At a minimum,
following operational elements are included the bank’s intra-day
liquidity management: 				
			
• 	 capacity to measure expected daily gross liquidity inflows
	 and outflows, including anticipated timing where possible;	
• 	 capacity to monitor its intraday liquidity positions, including
	 available credit and collateral;			
•	 sufficient intraday funding to meet its objectives;	
• 	 ability to manage and mobilise collateral as required;	
• 	 robust capacity to manage the timing of its intraday
	 outflows; and					
• 	 readiness to deal with unexpected disruptions to its intraday
	 liquidity flows.					
Daily cash flow management		 		
The bank generates a daily report to monitor significant cash
flows. Maturities and withdrawals are forecast at least 3-months
in advance and management is alerted to large outflows. The
report, which is made available to the funding team, ALM and
market risk also summarises material daily new deposit as well as
the interbank and top depositor reliance (by value and product).	
	
The daily cash flow management report forms an integral part of
the ongoing liquidity management process and is a crucial tool to
proactively anticipate and plan for large cash outflows.	
						
Liquidity stress and scenario testing			
Anticipated on- and off-balance sheet cash flows are subjected
to a variety of bank specific and systemic stress scenarios in
order to evaluate the impact of unlikely but plausible events on
liquidity positions. Scenarios are based on both historical events,
such as past emerging markets crises, past local financial markets
crisis and hypothetical events, such as a bank specific crisis. The
results obtained from stress testing provide meaningful input
when defining target liquidity risk positions.
141
					
							
31 December 2010 0 - 30
days
Nmillion
1 - 3
months
Nmillion
3 - 6
months
Nmillion
6 - 12
months
Nmillion
1 - 5
years
Nmillion
Over 5
years
Nmillion
Total
Nmillion
Asset
Cash and balances with central bank 8,046 2,002 - - - - 10,048
Treasury bills 1,551 4,044 289 2,820 3,724 - 12,428
Due from other banks 72,042 16,617 - - - - 88,659
Loans and advances to customers 37,591 42,180 11,888 7,534 48,877 15,882 163,952
Advances under finance lease 624 966 436 403 11,057 16 13,502
Investment securities 12,326 74 1,150 1,156 15,044 17,835 47,585
Investment in subsidiaries - - - - - - -
Deffered tax asset - - - 939 - - 939
Other assets 3,632 9,014 3,296 234 - - 16,176
Property and equipment - - - 9,681 8,074 13,497 31,252
Total assets 135,812 74,897 17,059 22,767 86,776 47,230 384,541
Liabilities
Customer deposits 172,702 8,496 2,290 2,900 77 1 186,466
Due to other banks 45,409 3,796 6,947 - - - 56,152
Other borrowings 1,126 220 590 2,142 10,660 3,534 18,272
Other liabilities 2,065 9,536 10,135 12,484 - - 34,220
Current income tax - - - 4,197 - - 4,197
Deffered income tax - - - 108 - - 108
Total liabilities 221,302 22,048 19,962 21,831 10,737 3,535 299,415
Net liquidity gap (85,490) 52,849 (2,903) 936 76,039 43,695 85,126
For the year ended 31 December 2010	
Financial risk analysis
Maturities of assets and liabilities - group
Stanbic IBTC Bank PLC Annual Report 2010 142
Annualreportand
financialstatements
31 December 2009 0 - 30
days
Nmillion
1 - 3
months
Nmillion
3 - 6
months
Nmillion
6 - 12
months
Nmillion
1 - 5
years
Nmillion
Over 5
years
Nmillion
Total
Nmillion
Asset
Cash and balances with central bank 6,484 1,288 - - - - 7,772
Treasury bills 159 - 10,977 242 - - 11,378
Due from other banks 63,963 10,000 - - 2,991 - 76,954
Loans and advances to customers 29,058 45,573 3,760 10,192 14,191 7,734 110,508
Advances under finance lease 19 776 11 984 7,587 - 9,377
Investment securities 10,721 2,351 90 12,737 29,268 16,295 71,462
Investment in subsidiaries - - - - - 1 1
Deffered tax asset - - - 594 - - 594
Other assets 5,513 1,797 2,198 11,323 3,177 1,558 25,566
Property and equipment 1 1 15 57 17,130 9,674 26,878
Total assets 115,918 61,786 17,051 36,129 74,344 35,262 340,490
Liabilities
Customer deposits 134,287 28,404 5,706 652 151 - 169,200
Due to other banks 21,137 1,942 9,927 - 5,328 - 38,334
Other borrowings - - - - 12,647 - 12,647
Other liabilities 19,247 5,748 4,366 3,237 1,025 429 34,052
Current income tax - - - 4,508 152 - 4,660
Deferred tax liabilities - - - 100 - - 100
Total liabilities 174,671 36,094 19,999 8,497 19,303 429 258,993
Net liquidity gap (58,753) 25,692 (2,948) 27,632 55,041 34,833 81,497
143
Financial risk analysis
For the year ended 31 December 2010	
Maturity profile - Off balance sheet - group 							
							
31 December 2010 0 - 30
days
Nmillion
1 - 3
months
Nmillion
3 - 6
months
Nmillion
6 - 12
months
Nmillion
1 - 5
years
Nmillion
Over 5
years
Nmillion
Total
Nmillion
Performance bonds and financial
guarantees
1,458 404 113 633 1,500 1,172 5,279
Contingent letters of credits 9,327 - - - - - 9,327
Forward contracts 254 - - - - - 254
Total 11,039 404 113 633 1,500 1,172 14,861
			
31 December 2009 0 - 30
days
Nmillion
1 - 3
months
Nmillion
3 - 6
months
Nmillion
6 - 12
months
Nmillion
1 - 5
years
Nmillion
Over 5
years
Nmillion
Total
Nmillion
Performance bonds and financial
guarantees
906 490 219 461 1,293 2 3,371
Contingent letters of credits 3,766 4,077 4,358 175 - - 12,376
Guaranteed commerical papers 451 - - - - - 451
Total 5,123 4,567 4,577 636 1,293 2 16,198
Liquidity contingency plans
	 							
The bank recognises that it is not possible to hold sufficiently large enough quantity of readily available liquidity to cover the least likely
liquidity events. However, as such event can have devastating consequences, it is imperative to bridge the gap between the liquidity the bank
chooses to hold and the maximum liquidity the bank might need. 								
The bank’s liquidity contingency plan is designed to, as far as possible, protect stakeholder interests and maintain market confidence in order to
ensure a positive outcome in the event of a liquidity crisis. The plan incorporates an extensive early warning indicator methodology supported
by a clear and decisive crisis response strategy. Early warning indicators span bank specific crises, systemic crises, contingency planning, and
liquidity risk management governance and are monitored based on assigned frequencies and tolerance levels. The crisis response strategy
is formulated around the relevant crisis management structures and addresses internal and external communications, liquidity generation,
operations, as well as heightened and supplementary information requirements.
Stanbic IBTC Bank PLC Annual Report 2010 144
Annualreportand
financialstatements
	
	
Operational risk				
		
The operational risk and compliance committee (ORCC) serves
as the oversight body in the application of the group’s risk
management framework. This is achieved through enforcing
standards for identification, assessing, controlling, monitoring
and reporting. ORCC reviews and recommends operational risk
appetite and tolerance to the executive committee and BRMC.	
		
Approach to managing operational risk			
The Stanbic IBTC approach to managing operational risk is to
adopt practices that are fit for purpose, to increase the efficiency
and effectiveness of the group’s resources, minimise losses and
utilise opportunities. This approach is aligned to Stanbic IBTC’s
and SBG’s enterprise risk management framework, policies,
procedures and tools to identify, assess, monitor, control and
report such risks as well as adopt sound practices recommended
by various sources, including the Basel II Accord’s Sound Practices
for the Management and Supervision of Operational Risk and
the regulators. The group continues to embed operational risk
management practices into its day-to-day business activities. 	
						
Governance					
The board risk management committee (BRMC), as the delegated
risk oversight body on behalf of the board, has the ultimate
responsibility for operational risk management. It ensures
quality, integrity and reliability of operational risk management
across the group. 					
	
		
Management and measurement of operational risk	
The operational risk management framework serves to ensure
that risk owners are clearly accountable for the risk inherent
within the business activities of the group. The key element in
the framework includes methodologies and tools to identify,
measure, and manage operational risks, a governance model,
and processes to ensure internal training and awareness,
communication, and change management. 	
Risk and control self assessments are designed to be forward-
looking. Management is required to identify risks that could
threaten the achievement of business objectives and together
with the required set of controls and actions, mitigate the risks.	
	
The loss data collection process ensures that all operational
risk loss events and near misses are captured into a centralised
database. The flow of information into the loss event database
is a bottom-up approach. The capture process identifies and
classifies all incidents in terms of an incident classification list.
This information is used to monitor the state of operational
efficiency, address trends, implement corrective action and
manage recovery, where possible.			
The group uses key risk indicators (KRIs) to monitor the risks
highlighted in the risk and control self-assessment (RCSA)
process. The implementation of the KRIs is an integral element
of the framework and is therefore compulsory throughout the
group. Business units are required to report on a regular and
event-driven basis. The reports include a profile of the key risk
to the achievement of their business objectives, control issues of
group-level significance, and operational risks events. 		
	
The group maintains adequate insurance to cover key operational
and other risks. Insurance is considered an effective tool for
mitigating operational risks by reducing the economic impact
operational losses, and therefore should have explicit recognition
within the capital framework of the new Basel Capital Accord to
appropriately reflect the risk profile of financial institutions and
encourage prudent and sound risk management.		
					
Business continuity management (BCM)
The group applies the SBG definition for BCM as a guide for
developing its BCM programme. In line with this definition, the
core focus in 2010 was to conduct a BCM simulation and test
its ability of the crisis management team (CMT) to recover and
restore total business operations in the event of unexpected
operational disruptions or disasters as well as testing the
recovery site infrastructure to determine its suitability for
meeting its recovery objectives. A disaster simulation is a role
play of the recovery plan and any associated processes and
procedures that would be used in a real disaster. A scenario is
defined, and each team member play out his/her role as defined
in the recovery plan. 				
				
The main objectives are to:	 			
					
• 	 rehearse team members in the type of issues and problems
	 that they will face in the event of a real disaster;		
• 	 encourage staff from different functions to work together
	 towards a common goal, relying on each other and learning
	 about each other’s strengths and weaknesses; and”	
• 	 realistically activate a disaster under a given scenario
	 without necessarily interrupting business operations.
145
Financial risk analysis
		
Information risk management
	
Information risk is defined as the risk of accidental or intentional
unauthorised use, modification, disclosure or destruction of
information resources, which compromises their confidentiality,
integrity or availability.				
					
From a strategic perspective, information risk management
is treated as a particular discipline within the operational risk
framework. In essence, information risk management not only
protects the group’s information resources from a wide range of
threats, but also enhances business operations, ensures business
continuity, maximises return on investments and supports
the implementation of various services. The approach to the
management of information risk in the group is in accordance
with global best practice, applicable laws and regulations.	
The group has embarked on an enterprise-wide comprehensive
awareness/education campaign to ensure that the culture of
information protection is entrenched and the risks associated
with handling information are mitigated.	
Fraud risk management				
					
Stanbic IBTC has a set of values that embraces honesty, integrity
and ethics and, in this regard, has a “Zero Tolerance” approach
to fraud and corruption. Where necessary, disciplinary, civil
and criminal actions are taken against staff and third parties
who perpetrate fraud; staff found guilty of dishonesty through
the group’s disciplinary processes will be listed on appropriate
industry databases of dismissed staff.
	
The group’s forensic unit, which is responsible for fraud risk
management practices, in conjunction with law enforcement
agencies, investigates all losses incurred as a result of misconduct
of staff and criminal intent of third parties with the end result
being a criminal conviction and recovery of the crime proceeds.	
		
There are anti-fraud mechanisms and regular campaigns in
place to mitigate fraud risk. These measures include constant
review and re-engineering of the group’s internal processes,
engagement of law enforcement agencies, industry forums and
collaborative workshops to discuss best practices to combat
fraud and group-wide fraud prevention incentive programme.
Risk assurance					
The risk assurance (RA) function was established in response to
regulatory (i.e. SARB) and business requirements, in order to give
assurance on the level of adherence to policies, procedures and
processes within the business units. The RA function was part
of the operational risk management processes until November
2010. 						
			
Effective December 2010, the RA function was merged with
Internal Audit in line with the bank’s strategic plan to accord the
function an independent status. 				
Environmental risk management	 		
					
Stanbic IBTC acknowledges that the development of a corporate
culture whereby environmental protection and the sound
management of natural resources in both its own operating
environment and with all the parties with which it has a business
association is crucial to sustainable development. The bank
adopts a precautionary approach to environmental management,
striving to anticipate and prevent environmental risk degradation.
The group’s approach is in line with the guidelines set out in the
Equator Principles and the provisions of the environmental laws
of the country.					
						
Legal risk management
As a financial institution, the group remains vigilant of the
potential loss that may be suffered as a result of the imposition
of a court judgment, loss from a contract that cannot be legally
enforced or liability suffered for damages to third parties. To
mitigate the occurrence of these incidents, the group has a legal
risk unit that works in conjunction with the legal department and
which manages legal risk issues. 			
						
The legal risk unit carries out, amongst others, the following
functions as part of its legal risk management process: 	
• 	 ensuring that service level agreements (SLAs) are executed
	 between the group and service providers;		
• 	 reviewing and monitoring legal claims made against the
	 group; and					
• 	 obtaining legal opinion in respect of all the litigations
	 that the group is involved in, to ascertain if there is a need
	 for provision to be made in cases where the likelihood of
	 success against the bank is high.
Provision is made in all instances where the group is of the
opinion that there is a likelihood that the legal claims instituted
against it may succeed.
As mitigants, the group encourages alternative dispute
resolution mechanisms to avoid lengthy and time-consuming
judicial process in order to speedily and amicably resolve
otherwise difficult litigation.				
				
For the year ended 31 December 2010
Stanbic IBTC Bank PLC Annual Report 2010 146
Annualreportand
financialstatements
Compliance risk management	 			
		
Compliance risk management is an independent core risk
management activity overseen by the group’s compliance
unit, which is overseen by the chief compliance officer. The
unit provides independent reports to the ORCC, EXCO and
BRMC. The group chief compliance officer has unrestricted
access to the chief executive officer and the chairperson of the
board risk management committee. The group’s approach to
managing legislative risk exposures is proactive and premised
on internationally accepted principles of risk management. The
group fosters a culture of compliance which is seen not only as a
requirement of law but also a good business practice.
Compliance unit is well positioned to guard against the risk
of failure to comply with applicable laws, regulators, codes of
conduct and standards of good practice, which may result in
regulatory sanctions, financial or reputation loss. It focuses on
ensuring that the group complies with laid down regulations that
are applicable to its business and operations.		
The compliance risk function of the group carries out, amongst
others, the following functions as part of its compliance risk
management process: 				
• 	 maintain compliance risk management plans for at least 5
	 regulatory requirements that are rated highest in terms of
	 their impact of the group’s business;			
• 	 maintain an appropriate and relevant schedule of all the laws
	 that are applicable to the group and circulate this to all the
	 business units within the group;		
• 	 liaise with regulators to co-ordinate inspections and
	 examinations and ensure that findings contained in the
	 inspection or examination reports are satisfactorily closed
	 out; and
• 	 respond to regulatory requests for information and
	 documents.					
					
In line with the foregoing responsibilities, the compliance unit
ensures that recently enacted laws, regulations and circulars are
obtained and circulated to all the relevant departments of the
group to guide them appropriately. 	
	
Furthermore, newly enacted laws are reviewed and included in
the group’s regulatory schedule which contains the provisions of
all the laws that are applicable to the group in its day-to-day
activities. The regulatory schedule is circulated amongst business
units accordingly for their guidance.
	
The compliance unit serves as the interface between the bank and
primary regulators during spot checks and routine examinations
carried out by the regulators with the aim of ensuring that all
issues raised by the regulators during the spot checks and routine
examinations are properly addressed. 			
					
In this regard, the compliance unit regularly interacts with
different regulators and law enforcement agencies, such as
the Nigerian Police; Nigerian Financial Intelligence Unit (NFIU);
Economic and Financial Crimes Commission (EFCC); National
Drug Law Enforcement Agency (NDLEA); Central Bank of Nigeria
(CBN) and Nigeria Deposit Insurance Corporation (NDIC);
Security and Exchange Commission (SEC), amongst others. 	
		
Conflict of interest and personal account trading	
The group is highly committed to conducting business
professionally, ethically, with integrity and in accordance
with international best practice at all times. In line with its
established framework and policy, conflict of interest situations
are constantly identified and managed. In the course of the year,
over three dozens of investment banking pipelines deals were
cleared through SBG’s global conflict control room.
In line with its personal account trading policy, personal trades
carried out by members of staff on their individual stock holding
through the group’s stockbroking subsidiary are reviewed
regularly to ensure that staff have not traded on the shares of
companies that they have material non-public price-sensitive
information on by virtue of their jobs. 			
	
Furthermore, all the senior management staff members including
131 embargoed and nominated employees were prohibited from
trading on the group’s shares with effect from 1st December
2010 until the group’s annual financial results are formally
announced to the public.
147
Capital management 				
					
Capital adequacy				
The group manages its capital base to achieve a prudent balance
between maintaining capital ratios to support business growth
and depositor confidence, and providing competitive returns
to shareholders. The capital management process ensures that
each group entity maintain sufficient capital levels for legal and
regulatory compliance purposes. The group ensures that its
actions do not compromise sound governance and appropriate
business practices and it eliminates any negative effect on
payment capacity, liquidity and profitability.		
	
Capital adequacy ratio, which reflects the capital strength of
an entity compared to the minimum regulatory requirements,
is monitored daily by the management, essentially employing
approaches based on the guideliens developed by the regulators
for supervisory purposes. It is calculated by dividing the capital
held by the bank by its risk-weighted assets. Risk weighted assets
are determined by applying prescribed risk weighting to on and
off balance sheet exposures according to the relative credit risk
of the counterparty.					
	
The regulators require each bank to hold a minimum regulatory
capital of N25 billion and maintain a minimum of 10% capital
adequacy ratio. The required information is filed monthly with
the Central Bank of Nigeria (CBN) while the group’s auditors
are also required to render an annual certificate to the Nigerian
Deposit Insurance Corporation (NDIC).			
				
In line with regulatory specification, the group’s regulatory
capital is divided into two tiers:				
				
Tier 1 capital: share capital, retained earnings and reserves
created by appropriations of retained earnings.		
						
Tier 2 capital: minority interest arising from consolidation,
fixed asset revaluation reserves, foreign currency revaluation
reserves and general provision subject to a maximum of 1.25% of
risk assets.						
						
Investment in unconsolidated subsidiaries and associations
are deducted from Tier 1 and 2 capital to arrive at the
regulatory capital.					
						
For the year ended 31 December 2010	
Financial risk analysis
Money laundering control				
			
The group attaches utmost importance to ensuring that the
know your customer (KYC), anti-money laundering (AML) and
terrorist financing control legislations are strictly adhered to.
These legislations impose certain obligations on the group such
as ensuring that all customers of the group have passed through
a KYC scrutiny; that necessary awareness is created amongst
members of staff on KYC/AML/CFT issues; that records of
customers and their transactions are kept for a five-year period
as prescribed by law; and that certain threshold transactions are
reported on a weekly basis including suspicious transactions. 	
			
Key legislations and regulations that govern anti-money
laundering are the Money Laundering (Prohibition) Act; Central
Bank of Nigeria (CBN) KYC Regulation; various CBN circulars, and
the Economic and Financial Crimes Commission (EFCC) Act. 	
		
In accordance with the relevant provisions of the Money
Laundering (Prohibition) Act, up to date training programmes
are organised for the group’s employees regularly and over
80% employees of the group (including all customer facing
employees) were trained in the course of the year. The trainings
are normally carried out in an easy to understand manner that
allows members of staff to have a good grasp of key issues such
as KYC, money laundering, suspicious transactions and terrorist
financing. Members of staff who are trained are required to write
an on-line test to determine their level of understanding with the
issues discussed during the training. 			
					
All active accounts are categorised into categories A, B, and C
for high, medium and low risk accounts respectively to allow for
a risk based monitoring of customer accounts.		
				
As part of the commitment and resolve to combat the scourge
of money laundering an automated anti-money laundering
(AML) solution was upgraded in accordance with regulatory
requirements in order to ensure that the process of identifying
and capturing suspicious transactions is made more effective.
This process enables the group to monitor transactions of
customers that are viewed to be unusual on a continuous basis.
Stanbic IBTC Bank PLC Annual Report 2010 148
Annualreportand
financialstatements
The risk-weighted assets are measured by means of a hierarchy
of five risk weights classified according to the nature of – and
reflecting an estimate of credit, market and other risks associated
with – each asset and counterparty, taking into account any
eligible collateral or guarantees. A similar treatment is adopted
for off balance sheet exposures, with some adjustments to
reflect the more contingent nature of the potential losses.
Capital management 	 			
The table below summarises the composition of regulatory
capital and the ratios of the group for the years ended 31
December. During those two years, the individual entities within
the group and the group complied with all of the externally
imposed capital requirements to which they are subject.
						
Group
2010
Nmillion
Group
2009
Nmillion
Tier 1 capital:
Share capital 9,375 9,375
Share premium 47,469 47,469
Statutory reserves 13,016 11,566
SMIEIS reserve 1,039 1,039
Capital Reserve 423 423
Retained earnings 12,335 10,608
Total qualifying Tier 1 capital 83,657 80,480
Tier 2 capital:
Non-controlling interest 1,376 1,017
Revaluation reserve –
investment securities
93 -
General provision 1,783 1,160
Total qualifying Tier 2 capital 3,252 2,177
Total regulatory capital 86,909 82,657
Risk-weighted assets:
On-balance sheet 256,769 210,102
Off-balance sheet 9,995 14,512
Total risk-weighted assets 266,764 224,614
Capital Adequacy Ratio (CAR) 32.58% 36.80%
						
The decrease in capital adequacy ratio in 2010 is a reflection of
the groups growth in risk assest as result of its expanding foot
print across the federation. However, despite this decline the
group remains well capitalized and the adequacy ratio of 32%
remains in the excess of th regulatory requirement of 10%.	
			
Regulatory capital compliance		
The bank complied with minimum capital requirements imposed
by the regulators during the period under review. Apart from
the local requirements, the group is also required to comply
with the capital adequacy requirement in terms of South African
banking regulations measured on Basel II principles. This act
of compliance coupled with the risk governance structure and
implementation of ERM framework as well as collation of loss
data, amongst others, have continued to reinforce the group’s
readiness for a regulatory regime that is anchored on Basel II
principles in the near future.
149
2010
Group
Nmillion %
2009
Group
Nmillion %
2010
Bank
Nmillion %
2009
Bank
Nmillion %
Gross earnings 56,745 59,781 48,934 52,850
Interest paid:
- local (7,435) (14,709) (7,458) (14,766)
- foreign (554) (1,104) (554) (1,104)
(7,989) (15,813) (8,012) (15,870)
Administrative overhead:
- local (12,856) (10,731) (10,505) (8,958)
- foreign (2,100) (1,212) (2,100) (1,212)
(14,956) (11,943) (12,605) (10,170)
Provision for losses (620) (4,858) (620) (4,858)
Value added 33,180 100 27,167 100 27,697 100 21,952 100
Distribution
Employees  directors
Salaries and benefits 15,618 47 14,256 53 13,792 50 12,542 57
Government
Taxation 4,073 12 2,204 8 2,376 9 883 4
The Future
Asset replacement (depreciation) 4,034 2,569 3,718 2,269
Expansion (retained in the business) 9,455 8,138 7,811 6,258
Total 13,489 41 10,707 39 11,529 41 8,527 39
33,180 100 27,167 100 27,697 100 21,952 100
Statement of value added
For the year ended 31 December 2010
Stanbic IBTC Bank PLC Annual Report 2010 150
Annualreportand
financialstatements
Annualreportand
financialstatements
150
151
Group
2010
Nmillion
Group
2009
Nmillion
Group
2008
Nmillion
Group
2007 Dec
Nmillion
Group
2007 Mar
Nmillion
Assets employed
Cash and balances with central banks 10,048 7,772 11,587 13,038 10,832
Treasury bills 12,428 11,378 13,101 47,563 13,956
Due from other banks 88,659 76,954 111,593 79,579 46,873
Loans and advances to customers 163,952 110,508 98,398 79,465 36,607
Advances under finance lease 13,502 9,377 4,261 1,989 314
Investment securities 47,585 71,462 79,022 73,708 32,749
Investment in subsidiaries - 1 1 1 1
Deferred tax assets 939 594 - - -
Other assets 16,176 25,566 17,331 10,978 2,860
Goodwill/ intangible asset - - - - 9,750
Equipment on lease - - - - 484
Property and equipment 31,252 26,878 15,432 8,662 6,217
384,541 340,490 350,726 314,983 160,643
Financed by
Ordinary share capital 9,375 9,375 9,375 9,375 6,250
Reserves 74,375 71,105 71,289 66,188 44,696
Non-controling interest 1,376 1,017 711 455 184
Customer deposits 186,466 169,200 95,262 71,391 68,031
Due to other banks 56,152 38,334 82,202 67,298 5,840
Other borrowings 18,272 12,647 12,201 27,533 5,609
Other liabilities 34,220 34,052 73,487 66,660 27,040
Current income tax 4,197 4,660 5,821 5,641 2,213
Deferred tax liabilities 108 100 378 442 780
384,541 340,490 350,726 314,983 160,643
Acceptances and guarantees 14,861 16,198 50,861 56,259 5,688
Five year financial summary
As at 31 December 2010
Stanbic IBTC Bank PLC Annual Report 2010 152
Annualreportand
financialstatements
Bank
2010
Nmillion
Bank
2009
Nmillion
Bank
2008
Nmillion
Bank
2007 Dec
Nmillion
Bank
2007 Mar
Nmillion
Assets employed
Cash and balances with central banks 10,048 7,768 11,441 13,036 10,831
Treasury bills 12,428 11,378 13,101 47,563 13,956
Due from other banks 87,439 75,913 110,159 71,800 46,090
Loans and advances to customers 164,203 110,967 99,010 79,636 35,590
Advances under finance lease 13,502 9,377 4,261 1,989 314
Investment securities 37,689 62,358 73,443 68,831 28,544
Investment in subsidiaries 1,924 1,925 1,819 554 511
Deferred tax assets 939 594 - - -
Other assets 13,683 24,453 17,067 12,640 4,723
Goodwill/ intangible asset - - - - 9,750
Equipment on lease - - - - 484
Property and equipment 30,757 26,267 14,905 8,345 5,958
372,612 331,000 345,206 304,394 156,751
Financed by
Ordinary share capital 9,375 9,375 9,375 9,375 6,250
Reserves 68,184 65,998 67,240 63,047 42,358
Non-controling interest - - - - -
Customer deposits 187,595 170,411 98,914 72,455 72,896
Due to other banks 56,152 38,334 82,202 66,852 5,840
Other borrowings 18,272 12,647 12,201 27,533 5,609
Other liabilities 30,983 31,319 71,797 61,468 22,082
Current income tax 2,051 2,916 3,240 3,613 1,334
Deferred tax liabilities - - 237 51 382
372,612 331,000 345,206 304,394 156,751
Acceptances and guarantees 14,861 27,834 50,861 56,259 5,688
153
Group
2010
Nmillion
Group
2009
Nmillion
Group
2008
Nmillion
Group
2007 Dec
Nmillion
Group
2007 Mar
Nmillion
Profit and loss account
Net operating income 48,394 43,823 42,495 22,480 15,877
Operating expenses and provisions (34,866) (33,481) (27,870) (11,488) (8,442)
Profit/(loss) before tax 13,528 10,342 14,625 10,992 7,435
Taxation (4,073) (2,204) (2,632) (3,142) (1,673)
Profit after taxation 9,455 8,138 11,993 7,850 5,762
Non-controlling interest (653) (490) (430) (265) (58)
Profit attributable to the group 8,802 7,648 11,563 7,585 5,704
Transfer to reserves 8,802 7,648 11,563 7,585 5,704
Statistical information
Gross interest margin % 77 61 55 61 58
% Shareholders’ funds /total assets 22 24 23 24 27
% Loans and overdrafts/total assets 43 32 28 25 24
% Loans and overdrafts/deposits 88 65 103 111 54
% Provision/Loans and overdrafts 5 10 10 13 19
Earnings per share (EPS) - actual 50 k 43 k 64 k 42 k 46 k
Earnings per share (EPS) - basic 50 k 43 k 64 k 71 k 47 k
Earnings per share (EPS) - adjusted 50 k 43 k 64 k 42 k 31 k
Earnings per share (EPS) - diluted 50 k 43 k 64 k 42 k 46 k
Average number of employees 2,248 2,009 1,659 1,202 931
Five year financial summary
For the year ended 31 December 2010
Stanbic IBTC Bank PLC Annual Report 2010 154
Annualreportand
financialstatements
Bank
2010
Nmillion
Bank
2009
Nmillion
Bank
2008
Nmillion
Bank
2007 Dec
Nmillion
Bank
2007 Mar
Nmillion
Profit and loss account
Net operating income 40,627 36,835 35,087 18,734 12,991
Operating expenses and provisions (30,440) (29,694) (24,545) (9,937) (6,806)
Profit/(loss) before tax 10,187 7,141 10,542 8,797 6,185
Taxation (2,376) (883) (1,328) (1,855) (822)
Profit after taxation 7,811 6,258 9,214 6,942 5,363
Non-controlling interest - - - - -
Profit attributable to the group 7,811 6,258 9,214 6,942 5,363
Transfer to reserves 7,811 6,258 9,214 6,942 5,363
Statistical information
Gross interest margin % 76 60 54 61 59
% Shareholders’ funds /total assets 21 23 22 24 26
% Loans and overdrafts/total assets 44 33 29 26 24
% Loans and overdrafts/deposits 88 65 100 110 49
% Provision/Loans and overdrafts 5 10 9 13 19
Earnings per share (EPS) - actual 42 k 33 k 49 k 37 k 43 k
Earnings per share (EPS) - basic 42 k 33 k 49 k 63 k 44 k
Earnings per share (EPS) - adjusted 42 k 33 k 49 k 37 k 29 k
Earnings per share (EPS) - diluted 42 k 33 k 49 k 37 k 43 k
Average number of employees 1,948 1,722 1,343 1,071 874
Stanbic IBTC Bank PLC Annual Report 2010 156
Other
Information
152
Otherinformation
Management team
Branch network
Contact information
	
	
157
162
166
157
Management team
1
4
2
5
3Wole Adeniyi
Business support
6
Aishah Ahmad
Private client services
Barene Beard
Marketing
Adesola Adegbesan
Global markets
Abas Alhassan
Internal audit
Bimbo Ashiru
Corporate affairs 
corporate social investments
1
4
2
5
3
6
Stanbic IBTC Bank PLC Annual Report 2010
Otherinformation
7
10
8
11
9
12Francois Fourie
PBB Branch expansion and self
service channels
Eric Fajemisin
Investment management
Mathys Buitendag
Business banking
Fatai Baruwa
Payment strategy
Sola Mahoney
Financial institutions
7
10
8
11
9
12
Mike McMullen
Project management office
158
Otherinformation
159
13
16
14
17
15
18
Patrick Mgbenwelu
Project finance
Management team
Andrew Mashanda
Transactional products  services
Akeem Oyewale
Stanbic IBTC Stockbroking
Limited
Yewande Sadiku
Investment banking
Olumide Oyetan
Stanbic IBTC Asset
Management Limited
Anne Rinu
Premises and projects
13
16
14
17
15
18
Stanbic IBTC Bank PLC Annual Report 2010 160
Otherinformation
19
22
20
23
21
24
Segun Sanni
Investor services
Alubani Sibanda
Corporate banking
Delein Van Schallkwyk
Operations
John Smit
Personal banking
Babayo Saidu
Agriculture  sharia banking
19
22
20
23
21
24
Olufemi Solomon
PBB sales  service support
161
25 26 27
Management team
Hentie Stemmet
Vehicle and asset finance
Dele Sotubo
Stanbic IBTC
Stockbroking Ltd
25 26 27
Louis Lehmann
Information technology
Stanbic IBTC Bank PLC Annual Report 2010 162
Otherinformation
Branch network
FCT ABUJA REGION		
				
1.	 Ahmadu Bello Way branch
	 Plot 1049, Ahmadu Bello Way
	 Area 11, Garki, Abuja
2.	 Deidei branch
	 Deidei-Gwaga road
	 Deidei Abuja
3.	 Edo House branch
	 No. 75, Ralph Sodeinde street
	 Central Business District
	 Garki, Abuja
4.	 Garki, Area 7 branch
	 Plot 593, Area 7, Ringim close
	 Abuja
5.	 Garki Model Market branch
	 Plot CBN 2 Ladoke Akintola bvld
	 Garki 11, Abuja
6.	 Kubwa branch
	 Plot No. CM71/72 Gado Nasko road
	 Kubwa, Abuja
7.	 Maitama branch
	 Plot 2777, Cadastral Zone A6
	 Maitama District, Abuja
8.	 Mararaba branch
	 Shop 1A Kwad Shopping Complex
	 Mararaba Gurku, Abuja
LAGOS ISLAND REGION	 	
		
1.	 Adetokunbo Ademola branch
	 No. 76, Adetokunbo Ademola street,
	 Victoria Island, Lagos
2.	 Afribank Street branch
	 Churchgate Towers,
	 Plot 30, Afribank street
	 Victoria Island, Lagos
3.	 Ajah branch
	 Mega Wave Plaza,
	 4A Addo roundabout,
	 Off Badore road, Ajah,
	 Lagos
4.	 Awolowo Road branch
	 No. 85, Awolowo road, Ikoyi
	 Lagos
5.	 Federal Palace Hotel branch	
	 Ahmadu Bello way
	 Victoria Island, Lagos
6.	 Head office branch
	 IBTC Place,
	 Walter Carrington Crescent,
	 Victoria Island, Lagos
7.	 Idejo branch
	 Plot 1712, Idejo street
	 Victoria Island,
	 Lagos
8.	 Idumagbo branch
	 No. 16, Idumagbo Avenue
	 Lagos
9.	 Ikota branch
	 Shop 167-194, Block 1,
	 Ikota Shopping Complex
	 Ajah, Lagos
10.	 Karimu Kotun branch
	 Plot 1321B, Karimu Kotun street,
	 Victoria Island, Lagos
11.	 Lekki-Ajah Expressway branch
	 Km 18, Lekki-Epe Expressway,
	 Agungi, Lekki,
	 Lagos
12.	 Lekki Phase 1 branch
	 The Palms Shopping Complex,
	 Lekki, Lagos
13.	 Martins Street branch
	 No. 19, Martins Street
	 Lagos
14.	 Muri-Okunola branch
	 Plot 226A, Muri Okunola street,
	 Victoria Island, Lagos
15.	 Offin branch
	 No. 25, Offin road, Apongbon
	 Lagos
16.	 Oke Arin branch
	 120, Alakoro Street, Oke Arin,
	 Lagos Island, Lagos
	
LAGOS MAINLAND REGION-1	
			
1.	 Alausa branch
	 WAPCO Building, Alausa
	 Ikeja, Lagos
2.	 Agege branch
	 173, Old Abeokuta motor road,
	 Agege, Lagos
3.	 Allen Avenue branch
	 No. 80, Allen Avenue
	 Ikeja, Lagos
4.	 Awolowo Model Market branch
	 Shop M1/M48 Awolowo Ultra
	 Modern market,
	 Mushin, Lago
5.	 Daleko branch
	 Bank road, Daleko market,
	 off Isolo road
	 Mushin, Lagos
6.	 Egbeda branch
	 38, Shasha road
	 Egbeda, Lagos
7.	 Ikorodu branch
	 No. 108, Lagos road
	 Ikorodu, Lagos
8.	 Ketu branch
	 463, Ikorodu road
	 Ketu, Lagos
9.	 Murtala Mohammed International
	 Airport branch
	 Arrival hall, MMIA
	 Ikeja, Lagos
10.	 Oba Akran branch
	 No. 20, Oba Akran Avenue
	 Ikeja, Lagos
11.	 Ogba branch
	 No. 32, Ijaiye road
	 Ogba, Lagos
12.	 Ojuwoye branch
	 No. 214, Agege motor road,
	 Ojuwoye, Mushin, Lagos
13.	 Oko-Oba branch
	 Abattoire Market, New Oko Oba
	 Agege, Lagos
14.	 Opebi branch
	 No. 43, Opebi road
	 Ikeja, Lagos
15.	 Oshodi branch
	 6/8 Brown street, Oshodi market
	 Lagos
16.	 Palms Avenue branch
	 103, Ladipo street
	 Mushin, Lagos
17.	 Toyin street branch
	 No. 36A, Toyin street
	 Ikeja, Lagos
163
Branch network
	
LAGOS MAINLAND REGION-2	
1.	 Ajegunle branch
	 No. 11, Orodu street
	 Ajegunle, Lagos
2.	 Akoka branch
	 No. 100, St. Finbarr’s road
	 Akoka, Lagos state
3.	 Alaba branch
	 H48/H49,
	 Alaba international market
	 Ojo, Lagos
4.	 Balogun Business Association branch
	 Executive plaza, No.12, BBA market,
	 Trade fair complex
	 Badagry, Lagos
5.	 Ejigbo branch
	 Isolo ikotun road
	 Ejigbo, Lagos
6.	 Festac branch
	 Gacoun shopping plaza,
	 23 road, off 2nd avenue
	 Festac town, Lagos
7.	 Herbert Macaulay branch
	 No. 220, Herbert Macaulay way
	 Yaba, Lagos
8.	 Igando branch
	 No. 51, Lasu-Iba road
	 Igando, Lagos
9.	 Gbaja market branch
	 No. 12, Gbaja market
	 Surulere, Lagos
10.	 Lawanson branch
	 35, Lawanson road
	 Lawanson, Lagos
11.	 Nigeria Ports Authority branch
	 Account block, NPA
	 Wharf road, Apapa, Lagos
12.	 Oyingbo branch
	 7, Coates street, Ebute metta,
	 Oyingbo, Lagos
13.	 Surulere branch
	 No. 39, Adeniran ogunsanya street
	 Surulere, Lagos
14.	 Tejuosho branch
	 No. 77, Ojuelegba road
	 Yaba, Lagos
15.	 Tin can branch
	 Suite 7  27, container complex
	 Lagos
16.	 Trade fair branch
	 International trade fair complex, 	
	 ASPAMDA plaza
	 Alaba, Lagos
17.	 Warehouse road branch
	 No. 10/12, Warehouse road
	 Apapa, Lagos
18.	 Yinka folawiyo branch
	 No. 38, warehouse road,
	 Folawiyo plaza
	 Apapa, Lagos
NORTH EAST REGION		
	 			
1.	 Bauchi branch
	 No. 16, Yandoka road
	 Bauchi state
2.	 Damaturu branch
	 Plot 591A, Njiwaji layout
	 Damaturu, Yobe state
3.	 Gombe branch
	 No. 1, Biu road
	 Gombe state
4.	 Maiduguri branch
	 No. 38, Baga road
	 Maiduguri, Borno State
5.	 Yola branch
	 No. 1, Muhammad Mustapha way, 	
	 Jimeta, Yola, Adamawa State
NORTH CENTRAL REGION		
		
1.	 Gboko branch
	 Along Captain Downs street
	 Gboko, Benue State
2.	 Illorin branch
	 11, Unity road (Amosun House),
	 Illorin, Kwara state
3.	 Jos branch
	 No.34, Ahmadu Bello way
	 Jos, Plateau state
4.	 Kontagora branch
	 Lagos-Kaduna road
	 Kontagora
	 Niger State
5.	 Lokoja branch
	 IBB Way, Opposite new Specialist 	
	 Hospital
	 Lokoja, Kogi State
6.	 Makurdi branch
	 No.12, Ali Akilu road
	 Makurdi, Benue state
7.	 Minna branch
	 Paiko road, Minna
	 Niger State
8.	 Suleja branch
	 Minna road,
	 Opposite Forec A Division, Suleja
	 Niger State
Stanbic IBTC Bank PLC Annual Report 2010 164
Otherinformation
NORTH WEST REGION		
		
1.	 Bello road branch
	 No. 13, Bello road, Kano
	 Kano state
2.	 Birnin-Kebbi branch
	 No. 68, Ahmadu Bello Way
	 Birnin-Kebbi, Kebbi state
3.	 Dutse branch
	 Plot 14/15, Sanni Abacha Way
	 Dutse, Jigawa state
4.	 Gusua branch
	 No. 10 Sanni Abacha road
	 Gusua, Zamfara state
5.	 Hotoro market branch
	 No. 4 Maiduguri road, Kano
	 Kano state
6.	 Jalingo branch
	 22, Hammaruwa Way, Jalingo
	 Taraba State
7.	 Kachia road branch
	 No. 7A, Kachia road, Kaduna south
	 Kaduna state
8.	 Kaduna branch
	 No. 14, Ahmadu Bello Way,
	 Kaduna, Kaduna state
9.	 Kaduna Central Market branch
	 No. 001 Bayajida road,
	 Central Market, Kaduna North, 	
	 Kaduna state
10.	 Kasuwa Barci branch
	 AH6 Kasuwa Barci, Tundun Wada
	 Kaduna, Kaduna state
11.	 Katsina branch
	 No. 175, Kurfi House, IBB Way
	 Katsina, Katsina state
12.	 KSC Bank road branch
	 No. 4 Bank Road,
	 Kano, Kano state
13.	 Lafia branch
	 Plot 1 Jos road, Lafia
	 Nasarawa state
14.	 PPMC/NNPC branch
	 Kaduna Refining and Petrochemical 	
	 complex
	 Sabon Tasha road, Kaduna South
	 Kaduna state
15.	 Sabon Gari branch
	 No. 4A, Galadinma road, Sabon Gari,
	 Kano, Kano state
16.	 Sabon Tasha branch
	 No. 32, Kachia road, Sabon Tasha
	 Kaduna, Kaduna state
17.	 Samaru branch
	 2 Sokoto road, Samaru
	 Zaria, Kaduna state
18.	 Shauchi branch
	 1, Rimi Quarters, Umma Bayero road
	 Kano, Kano state
19.	 Sokoto branch
	 No. 8, Maiduguri road
	 Sokoto, Sokoto state
20.	Zaria branch
	 No. 9, Kaduna road
	 Zaria, Kaduna state
21.	 Zaria City branch
	 No. 90 Anguwan,
	 Mallam Sule Kasuwa
	 Zaria, Kaduns State
SOUTH-EAST REGION		
		
1.	 Aba Main branch
	 No. 7, Aba-Owerri road
	 Abia state
2.	 Aba Market branch
	 No. 7, Duru Street, off Cemetry road
	 Aba, Abia state
3.	 Ariaria Market branch
	 189 Faulks road, Ariaria market,
	 Aba, Abia state
4.	 Awka branch
	 No. 49, Zik avenue
	 Awka, Anambra state
5.	 Enugu branch
	 No. 252, Ogui Road
	 Enugu, Enugu state
6.	 Head-bridge branch
	 No. 56, Port Harcourt road,
	 Onitsha, Anambra state
7.	 Onitsha branch
	 No. 13, Bright street
	 Onitsha, Anambra state
8.	 Owerri branch
	 No. 8, Wetheral road
	 Owerri, Imo state
165
Branch network
SOUTH-SOUTH REGION		
		
1.	 Asaba branch
	 No. 206, Nnebisi street
	 Asaba, Delta state
2.	 Benin branch
	 No. 71, Akpakpava street
	 Benin, Edo state
3.	 Calabar branch
	 No. 71, Ndidem Isong road
	 Calabar, Cross River state
4.	 Eleme Petrochemical branch
	 EPCL Complex
	 Port Harcourt, Rivers state
5.	 Ikom branch
	 28, Calabar road
	 Ikom, Cross River state
6.	 Olu Obasanjo branch
	 No. 133A, Olu Obasanjo road
	 Port Harcourt, Rivers state
7.	 Olu Obasanjo road branch
	 No. 58, Olu Obasanjo Road
	 Port Harcourt, Rivers state
8.	 Port Harcourt Airport branch
	 International Airport, Port Harcourt
	 Rivers state
9.	 Sapele road branch
	 No. 131A Sapele road
	 Benin, Edo state
10.	 Trans Amadi branch
	 No. 7, Trans Amadi road,
	 Port Harcourt, Rivers state
11.	 Uyo Branch
	 No. 5B, Nwaniba road
	 Uyo, Akwa Ibom state
12.	 New Benin branch
	 136, Upper Mission road,
	 New Benin market
	 Benin, Edo state
13.	 Warri branch
	 84, Warri-Sapele road
	 Warri, Delta state
14.	 WATT Market branch
	 CITA House Complex,
	 54 Bedwell street
	 Calabar, Cross River state
15.	 Yenagoa branch
	 No. 623, Mbiama-Yenagoa road
	 Yenagoa, Bayelsa state
16.	 Mokola branch
	 No. 18B, Oyo road,
	 Mokola, Ibadan
	 Oyo state
17.	 New Gbagi Market branch
	 Bashmur  Ayimur Plaza
	 Old Ife road, Gbagi,
	 Ibadan, Oyo state
18.	 Orita Challenge branch
No 127 Orita challenge
Ibadan, Oyo state
19.	 Oshogbo branch
	 No. 201, Gbogan/Ibadan road
	 Oshogbo, Osun state
20.	Oyo Town branch
	 Oyo- Ogbomosho road, beside Oyo 	
	 East Local Government Secretariat
	 Oyo Town, Oyo state
21.	 Ring road branch
	 18, Moshood Abiola Way,
	 Ring road, Ibadan
	 Oyo state
22.	Sagamu branch
	 167, Akarigbo street
	 Sagamu, Ogun state
23.	Saki branch
	 Sango-Ajegunle road (beside Saki
	 West Local Government secretariat)
	 Saki, Oyo state
24.	 Sango-Otta branch
	 No. 101, Idi-iroko/Otta road
	 Sango –Otta, Ogun state
25.	Sapon branch
	 House 42a, Isale Igbehin
	 Sapon Abeokuta
	 Ogun state
SOUTH WEST REGION	 	
		
1.	 Abeokuta branch
	 No. 2A, Lantoro road, Isale-Ake,
	 Abeokuta, Ogun state
2.	 Ado –Ekiti branch
	 Ado/Iyin express (old secretariat) rd
	 Ado- Ekiti, Ekiti state
3.	 Agbara branch
	 Agbara Estate Shopping Mall
	 Agbara, Ogun state
4.	 Agodi Gate branch
	 Inaolaji Business Complex
	 Agodi Gate, Ibadan
	 Oyo state
5.	 Akure branch
	 Great Nigerian Insurance House
	 Owo/Ado Ekiti road
	 Akure, Ondo State
6.	 Aleshinloye branch
	 Shop 37-39, Nigerian Army Post
	 Service Housing Scheme, Phase 2
	 Eleyele road, Ibadan
	 Oyo state
7.	 Apata branch
	 Abeokuta-Ibadan road
	 Apata, Ibadan
	 Oyo state
8.	 Bodija market branch
	 Trans Wonderland, 	
	 Opposite Bodija market
	 Secretariat road, Bodija
	 Ibadan, Oyo state
9.	 Gbagi branch
	 No. 15, Jimoh Odutola street
	 Ogunpa/Dugbe
	 Ibadan, Oyo state
10.	 Ibadan Main branch
	 UCH/Secretariat road
	 Total Garden, Ibadan
	 Oyo state
11.	 Ife branch
	 No. 5 Obalofun Lagere road
	 Lagere junction, Ile–Ife
	 Osun state
12.	 Ijebu-Ode branch
	 58 Ibadan road,
	 Ijebu-Ode, Ogun state
13.	 Ilesha branch
	 A198 Oshogbo road,
	 Ishokun, Ilesha
	 Osun state
14.	 Iwo road branch
	 32 Iwo road, (beside Tantalizers)
	 Ibadan, Oyo state
15.	 Iyana Church branch
	 Ibitola Plaza, Iyana Church
	 Ibadan, Oyo state
Stanbic IBTC Bank PLC Annual Report 2010 166
Contact information
Chief financial officer
Ronald Pfende
Tel: +234 1 4488900
e-mail : ronald.pfende@stanbic.com
Company secretary
Angela Omo-Dare
Tel: +234 1 4488900
e-mail: angela.omo-dare@stanbic.com
Head, investor relations
Oluwatosin Odutayo
Tel: +234 1 4488900
e-mail: oluwatosin.odutayo@stanbic.com
25
Subsidiaries
Stanbic IBTC Asset Management Ltd.
Stanbic IBTC Ventures Ltd.
Stanbic IBTC Pension Managers Ltd.
Stanbic Nominees (Nigeria) Ltd.
R.B. Resources Ltd. (deregistered on
26 April 2010)
Stanbic IBTC Stockbrokers Ltd.
Stanbic IBTC Trustees Ltd.
Overseas correspondent banks
Standard Bank of South Africa
Standard Bank London
Standard Chartered Bank
Citibank
HSBC
ANZ
Deutsche Bank
SEB
UBA NY
Registered address  head office
Stanbic IBTC Bank PLC
I.B.T.C. Place
Walter Carrington Crescent
P. O. Box 71707
Victoria Island
Lagos, Nigeria
Telephone:	 +234 (1) 2712400
Swift:	 SBICNGLX
Facsmile:	 +234 (1) 2626541/2
E-Mail:	 info@stanbic.com
Web:	 www.stanbicibtcbank.com
e-mail: investor.relations@stanbic.com
Otherinformation
167
Stanbic IBTC Bank PLC Annual Report 2010 168
Otherinformation
Notes
www.stanbicibtcbank.com
Produced by Creative Interpartners, London
Email: ci@creativeinterpartners.co.uk
Photography by Jonathan Kennedy

Stanbic ibtc annual report 2010

  • 1.
    Stanbic IBTC BankPLC Annual Report 2010 RC 125097
  • 2.
    The flow andebb of the financial landscape is not always a predictable one. Constant trend fluctuations and ripples in global economics have resulted in Stanbic IBTC adopting a progressive attitude of intelligent flexibility, one that has seen them excel, not only in past challenges, but in our present fast-moving conditions. With our worldwide perspective, we can affect changes and advances fluidly - to not only individual accounts but the pattern and rhythm ofourbankingpractises.Keepingourcustomers, shareholders and staff ahead of the pack. We are fluent in forward-thinking business demands. We keep you moving forward. www.stanbicibtcbank.com Making the right connections can make the world of difference in the world of finance.
  • 3.
    BusinessreviewAnnualreportand financialstatements GroupoverviewOtherinformationBusinessreview 01 03 04 05 07 Table of contents Overview Ourvision & values Financial highlights A broad-based financial services business Recognition Standard Bank Group at a glance Business review Chairman’s statement Chief executive’s statement Economic review Financial review Executive committee Personal and Business Banking Case study – BT Technologies Limited Case study – Don P Communications Ltd Corporate and Investment Banking Case study – Oando Plc Case study – Dangote Cement Plc Case study – AccuGas Limited Case study – IHS Nigeria Plc Wealth Annual report and financial statements Board of directors Directors’ report Directors’ responsibility for annual financial statements Corporate governance report Audit committee report Report of the independent auditor Statement of accounting policies Profit and loss accounts Balance sheets Statement of cash flow Notes to the financial statements Financial risk analysis Statement of value added Five year financial summary Other information Management team Branch network Contact information 11 15 19 21 29 31 33 35 37 41 43 45 47 49 55 59 64 65 77 78 79 84 85 86 88 119 149 151 157 162 166 Annualreportand financialstatements GroupoverviewOtherinformation Connecting Africa to the world, and the world to Africa Stanbic IBTC Bank PLC Annual Report 2010
  • 4.
    Our vision values One vision To be the best financial solutions team - the customer’s choice. We will deploy our local knowledge and global emerging market expertise to deliver superior value to all our stakeholders. We will only succeed if we are able to attract, retain, develop and deploy teams of people with energy, passion and skills. Eight values • • • Serving our customers We do everything in our power to ensure that we provide our customers with the products, services and solutions to suit their needs, provided that everything we do for them is based on sound business principles. Upholding the highest levels of integrity Our entire business model is based on trust and integrity as perceived by our stakeholders, especially our customers. Respecting each other We have the highest regard for the dignityofallpeople.Werespecteach other and what Stanbic IBTC stands for. We recognise that there are corresponding obligations associated with our individual rights. Growing our people We encourage and help our people to develop to their full potential and measure our leaders on how well they grow and challenge the people they lead.
  • 5.
    Stanbic IBTC BankPLC Annual Report 2010 Groupoverview Being proactive We strive to stay ahead by anticipating rather than reacting, but our actions are always carefully considered. Delivering to our shareholders We understand that we earn the right to exist by providing appropriate long-term returns to our shareholders. We try extremely hard to meet our various targets and deliver on our commitments. Guarding against arrogance We have confidence in our ability to achieve ambitious goals and we celebrate success, but we never allow ourselves to become arrogant. Working in teams We, and all aspects of our work, are interdependent. We appreciate that, as teams, we can achieve much greater things than as individuals We value teams within and across business units, divisions and countries.
  • 6.
    Financial highlights Price tobook 2.0 times (2009: 1.7 times) Fitch ratings AAA(nga) (2009: AAA(nga)) NPL/total loan ratio 7.6% (2009: 14.1%) Deposit liabilities of N186,466 million 10% up Liquidity ratio 31.1% (statutory minimum: 25%) Net loans advances of� N177,454 million 48% up Cost-to-income ratio 70.8% (2009: 65.3%) Profit before tax of N13,528 million 31% up Total income of N48,394 million 10% up Profit after tax of N9,455 million 16% up Credit loss ratio 0.3% (2009: 3.6%) Gross earnings of N56,745 million 5% down Pre-tax return on average equity 16.5% (2009: 12.8%) Pre-tax return on average equity 16.5% (2009: 12.8%) Capital adequacy ratio 32.6% (2009: 36.8%) Earnings and dividend per share CAGR (2007-2010): Dividend per share 16% Points of representation CAGR (2007-2010): Branch network 32% ATMs 115% Dividend per share Earnings per share Dividend cover Kobo Times Dec’07 Dec’08 Dec’09 Dec’10 0 10 20 30 40 50 60 70 0.0 0.2 0.4 0.6 0.8 1.0 1.2 1.4 1.6 1.8 25 42 40 64 30 45 39 50 Number 250 200 150 100 50 0 Dec’08Dec’08 62 5961 20 Dec’09 Dec’10 Branch network ATMs 70 132 141 200
  • 7.
    Stanbic IBTC BankPLC Annual Report 2010 Groupoverview Gross revenue N33.7 billion Corporate and investment banking services to larger corporates, financial institutions and international counter-parties in Nigeria. Gross revenue N14.3 billion Banking and other financial services to individual customers and small to medium sized enterprises. Gross revenue N8.7billion Investment management in form of asset management, pension fund administration and trusteeship. Personal Business Banking (PBB) WealthCorporate Investment Banking (CIB) Total assetsTotal incomeGross revenue Groupoverview Wealth CIB PBB 60% 15% 25% Gross loans and advances Wealth CIB PBB 57% 18% 25% Wealth CIB PBB 65% 3% 32% CIBPBB 69% 31% A broad-based financial services business The Standard Bank Group (SBG) merged its Nigerian operations, Stanbic Bank Nigeria (SBN) with that of IBTC Chartered Bank PLC (IBTC) on 24 September 2007. The merger, by way of the first ever tender offer in Nigeria and $525 million in foreign direct investment, was the largest in Nigerian financial history. The Standard Bank Group, which has a controlling stake of 50.8% in Stanbic IBTC, has been in business for over 148 years and is Africa’s largest banking group ranked by assets and earnings. SBN was created in 1992 when SBG acquired ANZ Grindlays’ operations in Botswana, Ghana, Kenya, Nigeria, Uganda, Zaire, Zambia and Zimbabwe. SBN offered merchant banking services, while Investment Banking Trust Company (IBTC) was established 22 years ago to offer investment banking and investment management services. IBTC merged with Chartered Bank and Regent Bank in 2005 and was thereafter known as IBTC Chartered Bank PLC - a universal bank. At the time of the merger with Stanbic Bank Nigeria, IBTC Chartered Bank PLC was the leading investment bank in Nigeria. Stanbic IBTC Bank PLC is a universal bank and has consolidated its position in Nigeria as a diversified business with a proven track record. The group focuses on the three key business segments – Corporate Investment Banking, Personal Business Banking and Wealth Management that leverage the skills, economies of scale and synergies that come from being part of an international group, and our excellent Nigerian pedigree.
  • 8.
  • 9.
    Stanbic IBTC BankPLC Annual Report 2010 Groupoverview ACQ Country Award The ACQ Finance Magazine Country Awards is an annual event that celebrates the top Mergers Acquision dealmakers and their transactions. Stanbic IBTC Bank has been awarded ‘Bank of the Year, Investment Bank of the Year 2010 and Best Debt Advisory Firm of the Year. Getting an accolade of this value amidst several other notable competitors is a very important nod for Stanbic IBTC Bank. Best Custodian Bank in Nigeria The bank was voted the Best Custodian Bank in Nigeria in the Global Custodian 2010 Emerging Markets Awards in the domestic, cross border and leading client’s categories. The award affirms the bank’s position as a leading custodian in Nigeria. Finance Monthly Global Awards This is a celebration of companies which are considered the best in their class, particularly in the light of one of the most demanding periods commerce has experienced for decades. Stanbic IBTC Stockbrokers Limited (a subsidiary of the bank) was awarded the Best Stockbroker of the Year by Gobal Awards. Best Investment Bank in Nigeria 2010, EMEA Finance Awards Stanbic IBTC Bank won the Best Investment Bank Award 2010, from EMEA Finance, for its achievement, successes and notable transactions in the course of the year. Fair Play Award This was conferred on the bank during the Nigeria Banker’s games 2010 for displaying outstanding spirit or sportsmanship Other awards won by the Bank include: • Best Brokerage House, EMEA Finance, 2010 • Best Issuing House, EMEA Finance, 2010 • Best Investment Bank in Nigeria, Euromoney, 2010 • Best Investment Bank, EMEA Finance, 2010 • Physiotherapy Disabled Friendly Award, 2010 Nigeria Society of Physiotherapy • ADVAN Award for Marketing Excellence, 2010 - “Campaign of the year - Radio”
  • 10.
    Standard Bank Groupat a glance Where we operate * Market capitalisation R170 billion (US$26 billion) * Total assets R1.341 trillion (US$202 billion) * Operating in 17 African countries and 15 countries outside Africa * 53,351 employees (2,248 in Nigeria) * 1,216 branches (141 in Nigeria) * 6,816 ATMs (200 in Nigeria)
  • 11.
    Stanbic IBTC BankPLC Annual Report 2010 Groupoverview North West - 30 South East - 17 South South - 15 South West - 31 North West - 21 South East - 8 South South - 15 South West - 25 FCT Abuja - 8 Lagos Island - 16 Lagos Mainland - 35 North Central - 8 North East - 5 FCT Abuja - 12 Lagos Island - 35 Lagos Mainland - 44 North Central - 9 North East - 7 Branches in Nigeria ATMs Groupoverview
  • 13.
    Stanbic IBTC BankPLC Annual Report 2010 10 Businessreview 06 Business review Chairman’s statement Chief executive’s statement Economic review Financial review Executive committee Personal and Business Banking Case study – BT Technologies Limited Case study – Don P Communications Ltd Corporate and Investment Banking Case study – Oando Plc Case study – Dangote Cement Plc Case study – AccuGas Limited Case study – IHS Nigeria Plc Wealth 11 15 19 21 29 31 33 35 37 41 43 45 47 49
  • 14.
    11 Atedo N APeterside (OON) Chairman 2011 has become an important transition period for our bank and also for Nigeria. “I am however pleased to report that both Stanbic IBTC Bank PLC and our parent, Standard Bank Group, take succession planning very seriously as we realise that our business will only remain safe and secure if it continues to be overseen by safe and trusted hands.” Chairman’s statement
  • 15.
    Stanbic IBTC BankPLC Annual Report 2010 12 Businessreview In the build up towards this 22nd Annual General Meeting (AGM) of our bank, there was a beehive of activity in terms of personnel movements at the board level. This has naturally generated some mixed feelings for me and some of the older directors.  While we are pleased to welcome one new face, we are naturally saddened that so many of our longest serving non-executive directors have had to move on at about the same time.    I am however pleased to report that both Stanbic IBTC Bank PLC and our parent, Standard Bank Group, take succession planning very seriously as we realise that our business will only remain safe and secure if it continues to be overseen by safe and trusted hands. At the national level, there was intense political activity on account of party primaries early in the year which were a prelude to the April general elections. The year 2011 has therefore become an important transition period for our bank and also for Nigeria. The months preceding an election are also a very difficult period for curbing the fiscal excesses of governments. The virtual depletion of the excess crude account reserves, from nearly $20 billion in 2008 and the erosion of the nation’s external reserves which dwindled from $42 billion at the onset of the current administration to a little over $32 billion as at 31 December 2010 have also generated some controversy. This, added to the fact that the Government was borrowing domestically at negative real interest rates to finance a growing deficit which was largely funding recurrent expenditure, fuelled inflationary expectations as well as concerns over exchange rate stability. While the inflation rate has remained stubbornly in the double- digits, with core inflation closing the year 2010 at just below 11%, a significant spike in consumer prices has however not materialised, probably because the impact of fiscal expansion was offset by a weak money multiplier and a contraction in private sector credit. Yet public sector credit extension increased substantially, in line with Nigeria’s total debt stock which climbed from around $25 billion at the end of 2009 to above $34 billion as at 31 December 2010. The Federal Government moved to contain some of the concerns regarding its countercyclical policies by using the 2011 budget proposals (a projected 18% cutback in expenditures and a Businessreview reduction in its deficit as a percentage of GDP to 3.62%) as a signal that it was eager to place a lid on its own spending and gradually roll back the fiscal stimulus that saw its budget deficit target (as a percentage of GDP) climb to 6.10% in 2010. Unfortunately, the National Assembly hiked the projected total expenditure by as much as 13% before approving the budget. Income statement The Stanbic IBTC Group (Stanbic IBTC Bank PLC together with its subsidiaries) achieved gross earnings of N56.7 billion for the 12 months ended 31 December 2010, which was 5% below the N59.8 billion achieved in the corresponding period ended 31 December 2009. The decrease is largely a result of the extreme market liquidity in the first three quarters of the year which led to lower yields on inter bank and fixed income investments. There was however a partially offsetting decrease in interest paid on deposits arising from conscious efforts to replace expensive deposits with cheaper funds. Cautious growth of the loan book and improved revenues associated with transactional banking volumes and new advisory mandates also helped to mitigate the impact of the fall in gross earnings. Net interest income increased by 5% from N25.1 billion to N26.4 billion due to a reduction in our average deposit interest rates, which were partly offset by decreased revenue from money market and fixed income activities. Total assets increased by 13% to N384.5 billion. Consequently, the net interest margin decreased from 7.4% recorded in the prior year to 6.9%. Non-interest revenue increased by 18% from N18.7 billion in 2009 to N22.0 billion in 2010, as a result of new advisory mandates, increased transactional volumes and gradual recovery of the capital market which offset the negative impact of lower trading revenue due to the stability in exchange rates and the concomitant reduction in arbitrage opportunities. In line with the growth and expansion strategy of the group, investment in infrastructure, (doubling branch network to 141) skilled employees and systems enhancement continued in the period under review and this contributed to the increase in operating expenses by 20% to N34.2 billion. “On account of recent initiatives by the Central Bank of Nigeria to “ring fence” the business of investment banking from consumer banking, we expect to restructure our group operations along Holding Company lines.”
  • 16.
    13 as directors. Mr.Adedoyin, Mrs Esiri, Ms Roets and myself, all being eligible, are offering ourselves for re-election. Later in the meeting, we will be required to vote on the election of Mr. Arnold Gain, who was appointed a director after the last AGM. We will also be voting on nominations received in relation to our audit committee. Our Corporate Social Responsibility (CSR) initiatives in 2010 were focused on contributing to the improvement of the educational sector in Nigeria, making an impact in the health sector and also helping in the general development of society. Using Lagos as a pilot, we activated the Stanbic IBTC Adopt-a-School programme (which involves the overhaul and restoration of schools across the country). We also undertook the development and commissioning of the Stanbic IBTC Sickle Cell Library, whereby the facilities of a world class library are now in place to aid research into the Sickle Cell scourge. In general, we intensified our support for various social causes which offer value to the communities in which we operate.  As an important local bank, our CSR initiatives hope to streamline all these efforts with a view to enhancing our ability to take development even further amongst our people, and in so doing, contributing towards creating an enabling environment for more rapid economic growth. The social capital generated from this has assisted greatly in Stanbic IBTC Bank in the forefront of the new consciousness towards doing business responsibly in Nigeria. Overall, we are pleased with the way our business has shaped up during the course of 2010. However, on account of recent initiatives by the Central Bank of Nigeria to “ring fence” the business of investment banking from consumer banking, we expect to restructure our group operations along Holding Company lines and so we expect the bank, Stanbic IBTC Pensions, Stanbic IBTC Stockbrokers and other current subsidiaries of the bank to all operate as direct subsidiaries of a Stanbic IBTC Holding Company. Appropriate announcements will be made before these changes take place and necessary proposals in this regard will eventually be tabled before shareholders. On behalf of the board of directors, I would like to thank all those who have contributed in one way or the other towards the success of our business in 2010. These include our clients, staff, regulators, suppliers, host communities, shareholders etc. It is my sincere hope that we can continue to count on your support in the years ahead. Having made adequate provisions on delinquent facilities in prior years, the group was able to achieve substantial recoveries on some of these accounts and this resulted in a 87% reduction in net credit impairment charge, with the amount reducing from N4.9 billion in 2009 to N0.6 billion in 2010. Overall, group profit before tax increased by 31% from N10.3 billion in 2009 to N13.5 billion in 2010.   Balance sheet The group’s total assets increased by 13% from N340.5 billion as at 31 December 2009 to N384.5 billion as at 31 December 2010 due largely to a strong growth in loans and advances. In response to the lower interest rates on the money market and fixed rate instruments, the group focused on responsibly growing its lending book i.e. by concentrating its efforts on quality exposures. The gross risk asset portfolio increased by 41% from N133.1 billion to N187.1 billion.   Total liabilities recorded an increase of 16% from N259.0 billion in 2009 to N299.4 billion in 2010 largely driven by the increase in deposits. In line with its comprehensive risk management framework, the group continues to conservatively provide for its loans and advances portfolio. Substantial recoveries were however made on the significant portions of previously provisioned accounts and this resulted in the reduction in non-performing loans. As at 31 December 2010, non-performing loans amounted to N14.2 billion, representing 7.6% of total advances in comparison to N18.8 billion and 14.1% respectively in the prior year.   Shareholders’ funds grew by 4% to N83.8 billion as at 31 December 2010. The change in shareholders’ funds represents the undistributed portion of the current year’s profits. Having regard to all of the foregoing, your directors are pleased to recommend a dividend payout of 39 kobo per ordinary share of 50 kobo amounting to N7.3 billion, which is 30% higher than the 30 kobo per share paid in the prior year. General Since our last AGM, Dr Alewyn Burger, Mallam Ahmed Dasuki, Dr Christopher Kolade CON, Mr Bhagwan Mahtani and Sam Unuigbe have all resigned from the Board. In accordance with Article 81 of the bank’s Memorandum and Articles of Association, four directors - Mr. Moses Adedoyin, Mrs Ifeoma Esiri, Ms Marna Roets and myself are retiring today Atedo N A Peterside (OON) Chairman Chairman’s statement
  • 17.
    Businessreview Stanbic IBTC BankPLC Annual Report 2010 Businessreview 14
  • 18.
    15 Chris Newson Chief executiveofficer 2010 will be remembered as challenging for the Nigerian banking sector and Nigeria as a whole. “Given this environment, we deem the results of the group to be positive. Our capital and liquidity positions remain robust, as indicated by the confirmation of our Fitch AAA (nga) rating. In summary, on the back of our growth strategy we achieved a strong network expansion, good balance sheet growth and a loan and advances growth well in excess of the industry.” Chief executive’s review
  • 19.
    16 Overview As the yearunfolded there emerged a significant amount of political uncertainty, given the ailing health of the late president and upcoming elections, a global economy (particularly the developed countries) that continued to struggle to emerge from recession and on-going reform in the banking sector. The Nigerian economy however continued to reflect strong (in worldwide terms) GDP growth averaging 7.85% which was driven by both oil and non-oil sectors (agriculture, telecoms, construction). An improving oil price and production levels meant that Nigeria managed to achieve a strong current account surplus, which did not however translate into a growth in gross reserves. On the contrary, national reserves continued to fall, ending the year some $11 billion below where they had opened. Although, at over $32 billion, these reserve levels remain credible and strong when compared to levels of import cover. In addition, the almost complete depletion of the excess crude account and the high growth in public sector borrowing (+59%) all indicate the strong expansionary policies employed by the Federal Government. Of particular impact on the banking industry was the high level of market liquidity maintained by the CBN for most of the calendar year. Such excess liquidity, along with the ongoing CBN interbank guarantee, resulted in interest rates reducing dramatically from December 2009 levels and turn negative in real terms. However, the excess liquidity in the system did not immediately translate into sustained credit growth to the private sector which actually was negative for the first 7 months of 2010. During this period, the majority of the banking sector tended to place their liquidity in “safe havens”, while focusing on their risk asset portfolios and in some cases awaiting the implementation of AMCON. As a consequence of this prevailing “risk averseness”, competition for better quality assets became very high. The beneficiaries of this were undoubtedly the better quality counterparties who enjoyed considerably lower rates than in 2009. On the back of the CBN’s intervention, the last quarter of 2010 did however see a part reversal of some of these trends with reduced levels of liquidity and a general increase in the interest rate environment. It is also notable that credit growth to the private sector did turn positive in the latter few months of the year, thereby achieving an annual positive growth of around 6%. There were fears expressed that the expansionary nature of monetary and fiscal policies would translate into significant inflationary pressures. However, this was not the case; significantly due to the limited credit extension growth (i.e. a low money multiplier effect) which saw inflation ending the year up on 2009 but not significantly so. The capital markets performance was varied with periods of strong recovery generally followed by some pull back on profit taking. The market did however consolidate to achieve a net gain of 18.5% for 2010 although average daily activity declined from 414.7 million shares in 2009 to 377.9 million shares in 2010. One of the positive features of the markets recovery was the increase in foreign portfolio investment which saw net inflows of some N381 billion (USD2.5 billion) against N215 billion (USD1.4 billion) in 2009. Given this environment, we deem the results of the group to be positive. Our capital and liquidity positions remain robust, as indicated by the confirmation of our Fitch AAA (nga) rating. In summary, on the back of our growth strategy we achieved a strong network expansion, good balance sheet growth and a loan and advances growth well in excess of the industry. We remain confident that our risk management approach is appropriate and should ensure the sustainability of such growth. Average customer deposits grew a healthy 39%, which also reflects good growth in the level of current account balances, an important indicator of the success in delivering the expansion of our physical network and growth in the number of transactional banking relationships. The reports will also reflect the strong performances delivered by a number of our capital markets and advisory businesses. The group continued its investment drive in 2010 and showed some considerable progress in this regard. As mentioned, the delivery of an expanded physical infrastructure was very pleasing with the group now having a network of 141 branches spread throughout Nigeria. In addition, our ATM network has also expanded to 200 ATM’s. The critical project to move our core banking platform from Equinox to Finacle is currently on track and should see us “go live” in the 3rd quarter of 2011. As may be expected, all this investment has resulted in the continued increase in our cost base. In a year that proved challenging from a revenue generation perspective, the above has inevitably seen our cost to income ratio rise to our upper target level and is a key area of focus for the management team. There is clearly a need to balance future growth with sustainability. Businessreview Stanbic IBTC Bank PLC Annual Report 2010
  • 20.
    17 We are gratefulthat as an indicator of some key successes, 2010 saw Stanbic IBTC again receiving a number of accolades and awards, being: • Global Finance Awards for best Sub Custodian , 2010 • Best Investment Bank in Nigeria, Euromoney, 2010 • Best Brokerage House, EMEA Finance, 2010 • Best Investment Bank, EMEA Finance, 2010 • Best Issuing House in Africa, Africa Bankers Award, 2010 • Best Custodian in Nigeria, Global Custodian 2010 Emerging Markets Award • Stockbroker of the Year Award - Finance Monthly Magazine • Physiotherapy Disabled Friendly Award, 2010 Nigeria Society of Physiotherapy • 2010 ADVAN Award for Marketing Excellence - “Campaign of the year - Radio” • ACQ Global Award 2010 for Bank of the Year in Africa A very big thank you to all our customers and staff, without whom none of the above would have been possible. Stanbic IBTC’s core business units (Corporate Investment Banking, Personal Business Banking and Wealth) are all committed to the principle that the customer needs to be at the centre of everything we do. We believe that our long term success will be entirely reliant on our ability to understand those customer needs and the environment they operate in, while working seamlessly as a team across business units to serve them. This not only requires good “knowledge management” but significantly requires having the right people. Stanbic IBTC continues to invest in both. A key aspect of teamwork is our ability to leverage off our parentage, that being the Standard Bank Group. Senior management within Stanbic IBTC operate under a matrix reporting system designed to ensure maximum congruency of customers and product strategies, leverage off expertise and capabilities across all geographies that Standard Bank operates in and to ensure maximum exposure of our staff to “best practice” and career advancement. In particular, given that Industrial and Commercial Bank of China has a 20% strategic shareholding in our parent the Standard Bank Group, we deem ourselves to be uniquely placed to support China/Nigeria activities and believe this holds significant opportunities for ourselves. The events of 2009/10 within the Nigerian Banking sector brought home many lessons, the most critical being the importance of corporate governance and the need for a very robust risk management approach. As a response thereto, during the course of 2010 the Central Bank of Nigeria brought out a number of new and proposed regulations. Stanbic IBTC remains totally committed to all aspects of corporate governance and risk management and continues to strive to position itself at the forefront of these principles in Nigeria. One of the key pieces of regulation that was released is the repeal of the current universal banking model. Given that Stanbic IBTC currently operates as a full universal banking group and wishes to continue as such, it is our intention to comply therewith through a Holding Company structure. We believe effectively communicating with all our stakeholders is a critical aspect of building and managing the Stanbic IBTC brand. We have continued to invest in our capacity in this regard. I wish to say a big Thank You to all of those who have assisted in making 2010 a reality. I would particularly once again wish to thank our shareholders, customers, staff, the Executive team (especially my deputy Mrs. Sola David-Borha), the chairman (Mr. Atedo Peterside) and the rest of the board for their commitment, contribution and invaluable support. Due to a number of factors, 2011 is likely to also be a challenging year for most Nigerians. The successful conclusion of the general elections in April 2011 will be critical in setting the base for possible growth acceleration in the rest of 2011. December 2010 saw the implementation of the first phase of AMCON’s activities, which is certainly a positive step forward, however it is probably important to also recognize that it is only a part of the process to the ultimate sustainable reform of the sector. The present government has committed itself to addressing certain of Nigeria’s significant infrastructure deficiencies, particularly power. It is our sincere hope that momentum is not lost in this regard as we believe success herein will be a major catalyst for growth in the future. With Nigeria having an estimated GDP growth for 2011 of 7%, which again should exceed global growth estimates, we look forward to a successful and rewarding year for all. chris newson Chief executive officer Chief executive’s review
  • 21.
  • 22.
    19 Economic review Global economicenvironment The global economy continued to recover in 2010 as output expanded 4.8%, following a contraction of 0.6% in 2009, primarily driven by emerging and developing countries. Although growth also rebounded in advanced economies, there have been concerns over the still sluggish macroeconomic metrics in the US and the budget position of the Eurozone which ultimately forced several governments to introduce drastic fiscal consolidation programs. That said, a double-dip scenario did not materialise and policy makers in key developed countries remained determined to make the necessary de-leveraging process as smooth as possible. Overall, monetary stimulus was still on the agenda, supporting the substantial improvement in global risk appetite and leading to a rally in commodities. Indeed, the oil price closed the year at US$96.4/barrel from US$79.2/barrel in early 2010. Economic growth Nigeria’s real economy showed some improvement with GDP growing by 7.36% in the first quarter of the year, 7.69% in the second quarter, 7.86% in the third quarter and expected 8.29% in the last quarter. This would translate into an average growth rate of 7.85% in 2010, from 6.96% in 2009. Although agriculture was still the dominant sector in terms of contribution to GDP (39.0% in half year 2010), the fastest growth rates were recorded in the telecoms (33.7%), hotels and restaurants (12.1%) and construction sectors (12.0%). However, the Finance and insurance sector lagged aggregate growth, expanding by only 4.3%, which partially reflected the systemic issues in the banking system. In this context, the Asset Management Corporation of Nigeria (AMCON)’s initial launch in late 2010 was generally perceived as a positive step forward in addressing the meltdown in the financial sector and erasing the banks’ non performing loans. Increasing oil prices and the Nigerian economy The increasing crude oil price was positive for Nigeria’s external metrics as it implied relatively robust trade and to a lesser extent, current account surpluses (5.2%/GDP in the first three quarters of 2010), supported by the rebound in oil production associated with the amnesty programme in the Niger Delta region. In this regard, crude oil output averaged 2.05 mbpd in 2010, from 1.84 mbpd in 2009. Nevertheless, foreign reserves continued to consistently slide, reaching US$32.3bn by end December 2010, from USD42.4bn in January 2010. This reflected the sizeable monetization of the excess crude account on the back of countercyclical fiscal policies, but also episodic spikes in demand for dollars amid weak naira confidence and substantially negative interest rates. Still, on the upside, the import cover ratio of 13.8 months was still the third highest in Sub-Sahara Africa after those of Botswana and the Republic of Congo. Exchange rate and interest rate dynamics The naira came under pressure in September 2010 as a result of increased corporate, but also liquidity-driven, demand for dollars. Consequently, the Central Bank of Nigeria (CBN) reacted by hiking the standing deposit facility by 325 basis points between late September and November to 4.25% (and the MPR by 25 0.0 2.5 5.0 10.0 7.5 20 35 50 80 USDbn USDbn 65 Dec’07 Dec’08 Dec’09 Dec’10 Oil earnings per month (LHS) FX researves (RHS)
  • 23.
    Stanbic IBTC BankPLC Annual Report 2010 20 Businessreview basis points to 6.25%) in order to tighten liquidity and preserve exchange rate stability. The sharp rebound in money market and treasury bill rates in last quarter of 2010 was the product of this policy shift: 90-day NIBOR jumped to a range of 12-15% in fourth quarter 2010 from a low of around 6% in early September, while the 91-day Treasury-bill rate spiked to around 7.6% in the primary market in late 2010, from lows of 2% in first quarter of the year. This effectively ended the era of cheap money in Nigeria. While long-dated bond yields had started to rebound in late first half of the year, this trend accelerated in the second half of 2010 as the Debt Management Office (DMO)’s issuance surged to record high levels. Consequently, the yield on the 20- year bond reached 14.5% in last quarter of 2010 in the primary market, from lows of 7.0% in second quarter. However, the DMO gradually cut the size of domestic borrowing in November and December to prevent an unsustainable rise in the cost of funding, supporting a stabilisation and marginal rally in bonds yields by year-end. Average inflation rose to 13.7% year-on-year (YoY) in 2010, from 12.5% (YoY) in 2009, but the decline in consumer prices to 12.8% (YoY ) in November and 11.8% (YoY) in December ultimately contributed to the drop in long-dated yields. Also, it became increasingly obvious that the substantial fiscal expansion over the past two years had been offset by a weak money multiplier and failed to translate into sizeable core inflationary pressures. Besides, food prices still continued to drive the revised CPI basket, in which they account for 50.7%, from a previous 63.8%: food inflation stood at 14.8% (YoY) in 2010 as against 12.4% (YoY) for non-food inflation. were keen to tackle the issue of bad loans in the banking system. Furthermore, the upward trend in long-dated bond yields in the second half 2010 attracted foreign fixed income investors into the debt market for the first time since 2008. Nigerian policy environment Several policy avenues came to the fore in 2010 in addition to the exchange rate and interest rate interaction mentioned above. First, the CBN and policy-makers focused on the revival of the banking system by setting up AMCON and improving the regulatory framework in the financial system. AMCON officials indicated by year-end that they would soak up nearly N2.5 trillion of bad debts, of which margin loans represented an estimated 40% to 50%, by issuing zero-coupon bonds in early 2011, and non-tradeable consideration bonds in the meantime. AMCON’s success, and potential mergers acquisitions in the sector, become also critical factors to boost private sector lending which contracted by 4.9% (YoY) in 2010. Private sector credit growth began to rebound in the second half of 2010 and was positive for four consecutive months as of November 2010, but collapsed in December as the toxic assets brought back by AMCON were written-off. Meanwhile, public sector credit surged to record high levels, with its growth rate reaching 67.8% (YoY) in December. Second, the government pushed for the adoption of the Petroleum Industry Bill in parliament, as it sought to increase the participation of local companies in the oil industry and improve the efficiency and solvency of the Nigeria National Petroleum Company (among other issues). The administration also unveiled a comprehensive program to address chronic power shortages, including the privatisation of the Power Holding Company of Nigeria and incremental private sector involvement in the industry. Power generation had fluctuated between 2,000 megawatt and 3,000 megawatt in 2010, well below the government’s target of 6,000 megawatt, and this translated into significant price pressures in the manufacturing sector, and the economy as a whole. Summary Official figures suggest economic growth remained robust and broad-based; yet a turnaround in private sector credit has yet to materialise and reverse a previous downturn driven by the margin- lending crisis. Although the first quarter was associated with increased institutional uncertainty, the smooth political transition in 2010, coupled with the initiation of key reforms, paved the way for a structural transformation of the Nigerian economy in the coming years and its emergence as a core geopolitical force in Sub-Sahara Africa and the emerging-market space. Impact of international capital flows While the actual data of international capital inflows into Nigeria is yet to be released, foreign portfolio investments into the Nigerian Stock Exchange (NSE) stood at N381 billion in 2010 compared to N215 billion in 2009. The Nigerian Stock Exchange gained 18.5% in 2010, driven by both international and domestic investors, especially as it became evident that policy-makers 0 5 10 25 20 15 Jan’07 Jan’08 Jan’09 Jan’10 Headline inflation Food inflation 90- day NIBOR MPR %
  • 24.
    21 Financial review Overview offinancial results Despite the unprecedented lull in the economy following the slow and gradual recovery from the shocks of the global meltdown in the previous years, the group was able to post a good result for the year. The group commenced the year operating in a market characterized by excess liquidity, dwindling margins and cautiously recovering equity markets. The diversified nature of the group’s business helped in achieving the good performance for the year and this was driven by income from new advisory mandates, increased transactional volumes and asset under management and a gradually recovering capital market. Highlights of the 2010 results reflect increased customer confidence as evidenced by the growth in deposit liabilities as customers sought for flight to safety following the financial sector reforms and a responsible approach to asset growth in line with the group’s comprehensive risk management framework. Having made adequate provisions on delinquent facilities in prior years, the group was able to recover on some delinquent accounts and this resulted in 87% reduction in net credit impairment charge, with the amount reducing from N4.9 billion in 2009 to N0.6 billion in 2010. While total income before credit impairments grew by 10%, income after credit impairments was up by 23%. The group participated in the sale of toxic assets to Asset Management Corporation of Nigeria (AMCON) to the tune of N14 million. The sale had an insignificant impact on the reduction of credit impairment charges. Profit after tax increased by 16%, from N8.1 billion in 2009 to N9.5 billion due to increase in fees and commissions and improved quality of the risk asset book. Return on equity for the group improved from 12.8% in 2009 to 16.5% in 2010 as a result of improved earnings and fruitful recovery efforts. 0 10,000 20,000 30,000 40,000 50,000 60,000 70,000 80,000 90,000 Dec’07 Dec’08 Dec’09 Dec’10 0% 5% 10% 15% 20% 25% ROaE (PAT) Shareholders’ funds (average) ROaE (PBT) Nmillion Return on average equity 2010 2009 Return on average equity (pre tax) 16.5% 12.8% Return on average equity (post tax) 10.7% 9.5%
  • 25.
    Stanbic IBTC BankPLC Annual Report 2010 22 Businessreview Notwithstanding the lull in the economy and regulatory induced rationalisation in the banking industry, the group continues to grow its points of represenation by opening additional branches within the country in order to improve service and product delivery. The number of representations doubled from 70 in 2009 to 141 in 2010 and we expect that this trend will continue in 2011. Economic factors impacting the results Global economic activity slowed its rebound momentum towards the end of 2010, due to uncertainty surrounding the sustainability of growth, especially in the world’s three biggest financial markets – Europe, United States and China. Sovereign debt default concerns and policy responses in Europe, a mix of disappointing job and housing market data in the US and the tightening of monetary policy (credit growth) by China to cool its over-heated property market raised fears that global GDP growth may continue to stall. The sovereign debt default crisis has prompted fears of a double-dip recession, with negative implications for manufacturing activities, commodities prices, as well as the entire global financial system. Meanwhile, the World Bank expects growth in developing and emerging countries to support the rebound from the current sluggish global economic recovery. It also expects developing countries to account for one-half of global GDP growth in the years ahead. Real GDP data at the respective country levels have been relatively volatile, reflecting large fluctuations in net exports tied to a sharp deceleration in world trade growth. For the country, security concerns were a major issue during 2010 especially the issue of the Niger Delta crisis, but with the completion of the Amnesty program, crude oil production rose and averaged 2.1 mbpd from 1.8 mbpd in 2009. The Central Bank (CBN) had embarked on quantitative monetary policy since late 2009, which involved injecting liquidity into the market to ease the credit squeeze induced by the global financial crisis. The CBN in the third quarter of 2010 increased the standing deposit facility by 325 basis points between late September and November to 4.25% (and the MPR by 25 basis points to 6.25%) in order to tighten liquidity and preserve exchange rate stability and also make placement by banks with the CBN unattractive, therefore forcing the creation of new risk assets, especially towards the real sector. This action precipitated an immediate reduction in interbank rates across varying maturities. Interest rates, treasury bill rates and savings deposit rates decreased to record lows and remained so for most of the early Performance indicator 2010 2009 Total income growth 10% 3% Credit impairment charges growth (87%) (3%) Profit before tax growth 31% (29%) Gross loans and advances growth 41% 18% Deposit growth 10% 78% Capital adequacy 32.6% 36.8% Net interest margin 6.9% 7.4% Return on average equity (pre-tax) 16.5% 12.8% Return on average assets (pre-tax) 3.7% 3.0% Earnings per share 50k 43k Price to book (times) 2.0 1.7 Long term Fitch rating AAA(nga) AAA(nga) Profit and loss analysis Net interest income Net interest income grew by 5% to N26.4 billion on the back of strong growth in loan book and decrease in interest paid on deposits, which were more than enough to douse the impact of the reduction in lending rates and low yields in investment securities. While interest income decreased from N40.9 billion in 2009 to N34.4 billion as a result of decline in market interest rates, the group was able to reduce its interest expense by 49%, from N15.8 billion to N8.0 billion through a proactive restructuring of the funding base and replacement of expensive deposits with cheaper funding in line with market opportunities. Total assets increased by 13% to N384.5 billion. Consequently, the net interest margin decreased from 7.4% recorded in prior year to 6.9%. Personal and business banking year on year net interest income decreased by 4% from N8.1 billion in 2009 to N7.7 billion in 2010 due to negative endowment as interest rates declined. Corporate and investment banking net interest income increased by 12% from N16.1 billion in 2009 to N18.1 billion in 2010 chiefly due to the significant 54% reduction in interest expenses as a result of lower funding cost and a positive change in deposit mix. part of the year thereby leading to the reduction in income from interest yielding investment opportunities. Key financial highlights
  • 26.
    23 Credit loss ratioCreditimpairment charge on NPLs Credit impairment charge on PLs (2,000) Dec’07 Dec’08 Dec’09 Dec’10 5,000 4,000 3,000 2,000 1,000 0 3% 4% 5% 2% 1% 0% (1,000) 1,681 362 4,607 413 4,504 354 (835) 1,455 Nmillion 2010 Nmillion 2009 Nmillion Change % Specific provisions (835) 4,504 (100) General provisions 1,455 354 100 Total 620 4,858 (87) The credit impairment charges decreased by 87% resulting from recoveries on some major accounts which were provisioned in prior years. This is without prejudice to the group’s robust risk management processes which demands for a prudent approach to credit impairments. The substantial recoveries resulted in the credit loss ratio improving from 3.6% in 2009 to 0.3% in 2010. The group has not modified its provisioning policy and continues to impair assets using the same principles it used in previous years inclusive of a general debt provision. Credit impairment charges Financial review Commissions Fees Other income Dec’07 Dec’08 Dec’09 Dec’10 6 24 17 19 64 50 57 67 15 15 20 6 22 12 2 Trading revenue 0 20 40 60 80 100 120 % 4 Non-interest revenue Credit impairment charges and credit loss ratio Interest income 2010 Nmillion 2009 Nmillion Change % Interest income 34,359 40,920 (16) Interest expense (7,989) (15,813) (49) Net interest income 26,370 25,107 5 Non-interest revenue Net fee and commission revenue increased by 38%, largely due to new advisory mandates, increased asset under management, improved transactional volumes and a gradual recovery of the capital market. However, trading revenue which is largely foreign exchange based registered a decrease of 36% due to relative stability of the exchange rate and lesser arbitrage opportunities. Net fees and commissions accounted for 86% (2009: 73%) of total non-interest revenue in 2010. 2010 Nmillion 2009 Nmillion Change % Net fee commission 18,983 13,707 38 Trading income 2,658 4,169 (36) Other income 383 840 (54) Total 22,024 18,716 18
  • 27.
    Stanbic IBTC BankPLC Annual Report 2010 24 Businessreview Operating expenses The group investment in infrastructure, people and skills continued in 2010. Despite doubling branch network (and consequently staff increase of 12%) and increasing the number of ATMs by 52%, the group was able to contain expense growth to only 20%. Operating expenses increased to N34.2 billion from N28.6 billion in 2009. As a function of this, the cost to income ratio increased from 65.3% in 2009 to 70.8%. The increase in cost is unexpected given our continued drive to expand on our points of representation, automate and upgrade our IT infrastructure and the need to attract quality people. In addition, in order to improve our service offering and delivery especially, in the personal and business banking market, the average staff headcount increased by 12% to 2,248, whilst number of branches doubled from 70 in 2009 to 141 at the end of 2010. 2010 Nmillion 2009 Nmillion Change % Staff costs 14,781 13,469 10 Other operating expenses: Auditor’s remuneration 135 138 (2) Communication 534 638 (16) Depreciation 4,034 2,567 57 Information technology 2,431 1,538 58 Marketing expenses 1,318 1,197 10 Premises 2,764 2,527 9 Training, travel and accommodation 1,814 1,878 (4) Others 6,435 4,671 38 Total other operating expenses 19,465 15,154 12 Total operating expenses 34,246 28,623 20 Cost-to-income ratio 70.8% 65.3% Balance sheet analysis The group’s total assets increased by 13% from N340.5 billion as at 31 December 2009 to N384.5 billion as at 31 December 2010. Key balance sheet indicators 2010 Nmillion 2009 Nmillion Change % Loans and advances to banks 88,659 76,954 15 Net loans and advances to customers 177,454 119,885 48 Total loans and advances 266,113 196,839 35 Deposits and current accounts 186,466 169,200 10 Shareholders’ funds 83,750 80,480 4 Loans and advances Loans and advances to customers (net), which accounted for 46% (2009: 35%) of total assets, grew by 48% to N177.5 billion. Personal and Business Banking net loans and advances increased by 105% to N53.6 billion in response to our group’s retail footprint. The Corporate and Investment Banking net loans and advances grew by 32% to N123.9 billion largely due to strong growth in infrastructural project and structured finance. The non-performing loans (NPL) declined by 24% to N14.2 billion. The NPL to total loan ratio also improved significantly to 7.6% (2009: 14.1%), evidencing fruitful recovery efforts notwithstanding the group’s comprehensive risk management framework and prudent provisioning policies. The participation by the group in the sale of a few toxic assets amounting to N14 million to AMCON had no significant impact on the decrease in non-performing loans. The NPL coverage ratio (excluding the net present value of security) of 68% was slightly lower than 70% recorded in 2009, while the coverage ratio with security was 163% in 2010.
  • 28.
    25 Financial review Composition ofgross loans and advances Term loans constitute 51.3% (2009: 43.1% ) of total loans with home loans increasing to 5.7% from 4.1% in 2009. Breakdown of loan book Funding and liquidity Total deposits and current accounts, which represent 49% of total liabilities and equity, increased by 10% to N186.5 billion. The growth in deposit liabilities is evidence of increased customer confidence in the group in a very competitive market, a consequence of the growing branch footprint. Personal and Business Banking deposits increased by 10%, while Corporate and Investment Banking deposits increased by 11%. Deposits Other liabilities Borrowings Equity 49% 22% 10% 19% 186,466 0 Dec’07 Dec’08 Dec’09 Dec’10 200,000 Nmillion 160,000 140,000 100,000 60,000 40,000 180,000 120,000 80,000 20,000 71,391 95,262 169,200 14.2 0 120% 100% 80% 60% 40% 20% 200 Nbillion 160 140 100 60 40 0 Dec’07 Dec’08 Dec’09 Dec’10 180 120 80 20 11.2 15.5 18.8 93.1 113.1 133.1 187.1 Gross loans and advances Non-performing loans Cumulative provision on NPLs Gross loans advances and non performing loans Funding mix Deposit liabilities CAGR (2007-2010):36% Overdrafts Home loans Term loans Instalment sales (VAF) 35% 6% 51% 8%
  • 29.
    Stanbic IBTC BankPLC Annual Report 2010 26 Businessreview Capital adequacy Total shareholders’ funds grew by 4% from N80.5 billion to N83.8 billion, however, the group continued to be very well capitalised. Tier 1 capital adequacy ratio was 31.4% (2009: 35.8%), while the total capital adequacy ratio was 32.6% (2009: 36.8%). The ratio is significantly higher than the regulatory minimum of 10%. The group’s capital is deemed adequate to support business risks and contingencies and the growth strategy of the group. 2010 Nmillion 2009 Nmillion Change % Tier I capital 83,657 80,480 4 Tier II capital 3,252 2,177 49 Total qualifying capital 86,909 82,657 5 Risk weighted assets 266,764 224,614 19 Capital adequacy Tier I 31.4% 35.8% Tier II 32.6% 36.8% Proposed dividend The board of directors has proposed a dividend of 39 kobo per share, amounting to N7.3 billion for the 12 months ended 31 December 2010 on the issued share capital of 18.75 billion ordinary shares, subject to the approval by the shareholders at the next annual general meeting (AGM). This represents an increase of 30% over the dividend paid for the period ended 31 December 2009 of 30 kobo per share on the issued share capital of 18.75 billion ordinary shares amounting to N5.6 billion. IFRS results The Standard Bank Group (‘SBG’) reports its results in accordance with International Financial Reporting Standards (IFRS). Accordingly the group prepares IFRS results for inclusion in SBG’s results. Below are extracts of the income statements and balance sheets for the comparative years 31 December 2009 and 2010 prepared in accordance with IFRS. The fundamental differences between Nigerian GAAP (NGAAP) and IFRS are: • NGAAP employs a historical cost convention whereas IFRS employs fair value. • Credit impairments are calculated based on expected losses (a set percentage based on prudential guidelines) instead of the IFRS incurred loss methodology with fair value calculations for security. • Under NGAAP revenue on yield instruments is recognized purely on an accrual basis with no mark to market adjustments.
  • 30.
    27 IFRS income statement Group 2010 Nmillion Group 2009 Nmillion Change % Interestincome 24,342 25,609 (5) Interest expense 3,895 9,685 (60) Net interest income 20,447 15,924 28 Non-interest revenue 29,823 28,221 6 Net fee and commission revenue 17,751 13,707 30 Trading revenue 11,689 13,674 (15) Other revenue 382 840 (54) Total income 50,270 44,145 14 Credit impairment charges 191 3,956 (95) Impairments for non-performing loans (2,167) 4,059 (100) Impairments for performing loans 2,358 (103) (100) Income after credit impairment charges 50,079 40,189 25 Operating expenses 34,476 29,752 20 Staff costs 15,011 13,598 10 Other operating expenses 19,465 15154 28 Profit before tax 15,603 11,437 36 Financial review
  • 31.
    Stanbic IBTC BankPLC Annual Report 2010 28 Businessreview IFRS balance sheet Group 2010 Nmillion Group 2009 Nmillion Change % Assets Cash and balances with central banks 10,048 7,772 29 Pledged assets 18,573 16,966 9 Derivative assets 263 188 40 Trading securities 70,886 95,520 (26) Financial investments 28,936 30,192 (4) Loans and advances 212,396 153,371 38 Loans and advances to customers 179,105 111,976 60 Loans and advances to banks 33,291 41,395 (20) Other assets 15,740 14,010 12 Current and deferred taxation 939 594 58 Equity investment in group companies - 1 (100) Property and equipment 31,252 26,878 16 Total assets 389,033 345,492 13 Equity and liabilities Equity 89,805 85,012 6 Equity attributable to ordinary shareholders 88,429 83,995 5 Ordinary share capital 9,375 9,375 - Ordinary share premium 47,469 47,469 - Reserves 31,585 27,151 16 Minority interest 1,376 1,017 35 Liabilities 299,228 260,480 15 Trading liabilities 50,116 97,448 (49) Deposit and current accounts 192,350 111,186 73 Deposits and current accounts with customers 186,118 110,931 68 Deposits and current accounts with banks 6,232 255 100 Other liabilities 52,139 47,013 11 Current and deferred tax liabilities 4,623 4,833 (4) Total equity and liabilities 389,033 345,492 13
  • 32.
    29 Executive committee 01 SolaDavid-Borha Deputy chief executive officer 02 Marna Roets Executive director, Business support 03 Yinka Sanni Deputy chief executive officer 04 Jacques Troost Executive director, Personal business banking 05 06 Chris Newson Chief executive officer Angela Omo-Dare Company secretary and head, legal 04 05 06 01 02 03
  • 33.
    Stanbic IBTC BankPLC Annual Report 2010 30 Otherinformation 10 11 12Ronald Pfende Chief financial officer Demola Sogunle Head, group risk Kayode Solola Head, Corporate investment banking 10 11 12 Obinnia Abajue Acting CEO, Stanbic IBTC Pension Managers Limited 07 Kandolo Kasongo Head, credit 08 Isioma Ogodazi Head, human resources 09 07 08 09
  • 34.
    31 Net commissions andfees N4,545 million 2009: N2, 636 million Total Income N12,236 million 2009: N11,318 million Deposits N82,244 million 2009: N75,014 million Loans and advances (net) N53,560 million 2009: N26,150 million Personal Business Banking What we offer We provide financial solutions to personal and business customers by offering the correct range of products and services at competitive pricing through the correctly placed and cost effective channels. Channels include the branches, ATM network, internet and telephone banking. Products include overdrafts, medium term loan, mortgage loans, vehicle and asset finance, credit cards, trade finance and a variety of savings and investment products. 2010 highlights • Gross loans and advances increased by 93% to N57.3 billion • Savings accounts balances increase by 60% to N9.4 billion • Current accounts balances up 25% to N49.7 billion • Branch network rose 101% to 141 • ATM footprint increased by 52% to 200 • Customer based increased by 30% to about 600,000 • Cash withdrawals at ATMs increased by 62% to N28.1 billion • Significant improvement in deposit mix. Stable and lower priced deposits accounted for 72% (2009: 61%) of total PBB deposit • Volume of transactions on ATMs increased by 51% to 80.6 million 2011 priorities • Continue to grow branch and ATM networks • Continue to grow customer base in all segments of the market • Continue to responsibly grow loans and advances • Continue to grow liability base with special focus on current and savings account balances • Focus to responsibly grow Agricultural business • Continue to improve on service quality as a key market differentiator • Continue to focus on cost containment and operational efficiencies • Focus on continuous improvement of the quality of PBB leadership and staff • Sweating the “investment” in PBB business • Focus on internal credit and risk management processes and systems Personal banking Business banking 61% 39% Revenue by business unit
  • 35.
    Stanbic IBTC BankPLC Annual Report 2010 32 Businessreview Overview Since the strategic decision in 2008 to reduce exposure to margin facilities, focus was placed on rebuilding the PBB asset book. With continuous focus on reviewing the PBB asset products portfolio and the risk appetite supported by effective credit approval processes, the business unit grew its asset book at 93%. Having a low risk assets to liabilities ratio, less emphasis was placed on growing the liabilities base and more focus was placed on reducing the cost of interest expenses by replacing more expensive term liabilities with lower priced short term liabilities. As a result, the deposit mix (i.e ratio of low cost deposits (savings and current accounts) to total deposits) improved to 72% from 61% recorded in 2009. We continued the journey to establish a profitable and long term sustainable retail business in Nigeria by focusing on both the Business and Personal markets. We continued to grow our physical and electronic channel presence in Nigeria. At the end of 2010, our branch and ATM networks have grown to 141 and 200 respectively. This increase in footprint is supported by the continuous on- boarding of clients and profitability of such clients is ensured by the delivering of a range of products and services to the client base, which are aligned to their needs and requirements. To ensure improved efficiency, continuous focus has been placed towards the productivity of our staff and improved processes and service delivery. To ensure client loyalty in a very competitive market, ongoing focus is to foster good long term relationships with our clients through the delivery of positive client experiences by recruiting the right quality of staff, ensuring they have adequate skills and motivated by team leaders to add value through the provision of offering financial solutions and unsurpassable service levels. Strategy Expanding our reach During 2010, we continued to grow our footprint and we now have representation in all of the States in Nigeria. We also followed the same approach regarding our ATM network while the internet platform was upgraded to offer additional functionality. Improving the customer experience With close to a hundred percent of our branch network both being upgraded or brand new, as well as having ATMs deployed at all the branches; client experience levels have improved while at the same time we are in closer reach to our client base. A fast growing branch network comes with a new and young workforce and much time and resources have been deployed to ensure that they are adequately trained and developed. Various leadership interventions were also arranged to ensure that the workforce are well motivated and focus on positive client interventions. To further improve service levels, a fully integrated call centre, which has the ability to handle both inbound and outbound calls, was established to deliver client enquiry and complaints management processes. Containing cost The PBB business is in an expanding phase but it remains important to manage costs effectively and continued focus is being placed on the productivity levels of our workforce together with the improvement of processes and procedures and the centralization of certain functions whilst at the same time focusing on increasing transactional activities and revenues. Financial performance 2010 Nmillion 2009 Nmillion Growth % Total Income 12,236 11,318 8 Staff costs 6,124 4,572 34 Other operating expenses 6,408 4,582 40 Provision for risk assets 1,133 1,038 9 Tax provision (429) 304 (100) Profit after tax (1,000) 882 (100) Deposits 82,224 75,014 10 Gross loans advances 57,335 29,721 93 Looking ahead We intend to continue growing our market share and share of clients’ wallets during 2011. To achieve this, we will continue to invest in the branch and ATM networks as well as continue to expand our portfolio of products and services. In 2011, we will be moving to a new core banking platform, which should assist us in our aspirations to further grow our market share, improve our service delivery and at the same time reduce our overall cost of delivery.
  • 36.
    33 Case study BT TechnologiesLimited BT Technologies Limited – Incorporated on the 5th of September 2001 with 100% Nigeria ownership, the firm is a fast growing truly Nigerian firm with speciality in telecommunication infrastructure.
  • 37.
    Stanbic IBTC BankPLC Annual Report 2010 34 Businessreview The company has over 250 employees and has developed core competencies locally in the maintenance of fibre optic networks, structured cabling External Line Plant provisioning (ELP), networking of optic fibre and survey and design of optic fibre networks. From a humbling beginning as an IT training firm, the company has evolved into a major telecom infrastructure firm providing specialised services to some of the largest Telecom service providers in Nigeria including Multilinks, Airtel, Glo and MTN. The programme To meet the growing expansion in its network, Multilinks awarded BT Technologies Limited a N2.04 billion contract which entails providing fibre optic infrastructure (ELP) across 650 km of road covering six states in the south east and south south regions of the country. Financing Stanbic IBTC granted a N415 million facility in the form of a project finance facility to enable BT Technologies to take delivery of fibre optic cable, execute civil works and deliver the telecom infrastructure within the time frame of the project. The facility has since been paid down and over 97% of the job delivered as at end December 2010. The market The advent of GSM has ushered in an era of massive infrastructural development in telephony and telecommunication operations in the country, with a subscriber base exploding to over 57 million in 2010. The exponential growth in subscriber base is putting lots of pressure on telecommunication infrastructure. This gap is what truly Nigerian firms like BT Technologies have exploited to build core competences and expertise employing and up skilling over 250 Nigerians, majority of them engineers, to meet the challenges of GSM network operators. The company has demonstrated a reputation for timely delivery, competence, reliability and use of appropriate technology to service delivery to the market place. The company has demonstrated a reputation for timely delivery, competence, reliability and use of appropriate technology in service delivery to the market place.
  • 38.
    35 Case study Don-P CommunicationsLtd Don-P Communications Ltd (“Don-P”) with headquarters in Abuja was incorporated in April 2003. The company is primarily into wholesale marketing of GSM telecommunication recharge cards as well as mobile phones and accessories. They are the leading key dealer and trade partner to all the major telecommunication network providers in Nigeria, namely; MTN, Airtel, Glomobile, Multilinks, Starcomms and Visafone. The emergence of Don-P Communication Ltd as a formidable GSM dealer was predicated by the huge opportunities offered by the telecom industry following the first GSM license issued in 2001 by the Nigeria Government.
  • 39.
    Stanbic IBTC BankPLC Annual Report 2010 36 Businessreview The programme For easy and effective distribution, the telecommunication network providers partner with major telecoms dealers like Don-P Ltd to retail their products through their established marketing channels. In their stride to fully harness the evolving opportunities and market network expansion to various states of the federation, the dire need for steady working capital for the purchase of GSM stock to meet the increasing demand by their teeming customers became evident. Financing Stanbic IBTC financed their business with a total of N2.8 billion in the form of an overdraft, term loans and bank guarantees. This enabled Don-P to expand their market to Lagos, while growing their distribution network in Abuja, Jos and Enugu. The market Nigeria is the fastest growing telecoms market in the world. The teledensity has increased from 0.4% in 2001 to 40% i.e 57 million subscribers in 2010. Don-P as a company controls over 6% of the MTN market share in GSM recharge cards and accessories marketed in Nigeria. This is through their established channels in specific regions. The company is also an active partner in the distribution of GSM recharge cards for other notable networks such as Glo and Airtel etc. With the support of Stanbic IBTC Bank, Don-P has won several awards over the years including; • Drummer Award = MTN, Zain, Glo • Best Dealer, Abuja Region = Glo • Best Dealer Award Scholarship= Visafone, MTN
  • 40.
    37 The CIB teamhas shown resilience in the face of the challenging banking environment witnessed during the year. The persistent excess liquidity in the system coupled with the on-going banking reforms made the banking terrain unusually challenging. Nonetheless, our corporate investment business passed the test credibly, deploying its various products in Global Markets (GM), Investment Banking (IB) and Transactional Products and Services (TPS) to the delight of our various customers and recording growth in many of its performance indices in 2010. Net commission and fees N6,526 million 2009: N5,467 million Total income N27,487 million 2009:N25,586 million Deposits N104,222 million 2009: N94,186 million Loans and advances (net) N123,894 million 2009: N93,735 million Global markets Transactional products and services Investment banking 33% 38% 29% What we offer Corporate and Investment Banking (CIB) is the wholesale banking arm of Stanbic IBTC Bank PLC. We provide innovative investment and financing solutions to large local and multinational corporates, as well as to institutional and public sector clients in strategic sectors of the economy. We are appropriately positioned to meet our clients’ varying needs both within Nigeria and across the border as a result of a combination of our industry expertise, cross-border linkages with Standard Bank’s Global CIB team, a very strong balance sheet, our team of highly skilled and experienced professionals, and a strong and well respected brand in the Nigerian market. 2010 highlights • Restructured the trade finance business and process to enable greater participation in this market segment. • Maintained market leadership in project finance investment banking and global market businesses. • Intensified our Chinese Corporates focus, with a view to leveraging Standard Bank’s strategic partnership with the Industrial Commercial Bank of China (ICBC) • Intensified the lengthening of the tenor of loan book by a deliberate focus on medium to long term tenured risk assets. • Successfully defended and grew the asset book by 26% during the year versus a low single digit growth recorded by the banking industry. • Maintained our dominance of the secondary equity stock market with a market share in excess of 30% during the period. • Grew holdings under custody by 44% to N525 billion. • Refocused the relationship management team to create an Investment Banking Coverage team and a Corporate Banking Coverage team. The former team is devoted to creating and facilitating strategic opportunities for identified large corporate clients, including those of cross border nature by leveraging on Standard Bank’s Global/Emerging Market footprint while the latter focuses on identifying, recruiting and “selling” our bank and all its product offerings to corporate clients in identified sectors of the economy. • Set up a carbon trading desk Corporate Investment Banking Revenue by business unit
  • 41.
    Stanbic IBTC BankPLC Annual Report 2010 38 BusinessreviewBusinessreview Stanbic IBTC Bank PLC Annual Report 2010 Overview We carried out some internal restructuring during the year, to improve efficiency and the performance of each of the product houses within CIB. The Investment Banking Coverage team was carved out of the subsisting Coverage team to focus on those large corporate entities that require cross-border linkages. In addition, the sales team in TPS business was combined with the Corporate Banking Coverage team to provide clearer focus on clients and internal efficiency. This has enabled us to have a holistic view of the client and provide value-adding services to our clients. The credit process was equally reviewed during the year to provide a faster throughput time for our credit applications. The old structure of layering credit application review was disposed of and a new structure where all the concerned parties are present in one approval meeting was introduced. This process review has been partly contributory to the growth of our loan book. The budding TPS business contributed significantly to CIB’s position during the year. The coming together of the hitherto Structure Trade Finance capability within the IB space and the Trade Services business within TPS to form the new Trade Finance business within TPS has led to a more concerted effort to grow trade business. The growth in the bank’s branch network aided the TPS franchise by increasing our reach and thus increasing the volume of collections for TPS. The upgrade of existing cash management applications and the introduction of new and more robust ones boosted the performance of the segment. The Investor Services unit within TPS won the Global Finance Awards for Best Sub-Custodian, 2010, amongst a handful of accolades. The Global Markets pillar continued its leading role internally as the highest revenue generating segment as well as externally by being one of major market makers in foreign exchange (FX), money market (MM) and the fixed income (FI) businesses. The Investment Banking business had a remarkable year. The team continued its dominance of Nigeria’s investment banking space and this is buttressed by the sheer number and awards and accolades received by the team. The debt solutions team (compassing project finance, leveraged acquisition finance property finance units) within the IB business was instrumental in the impressive growth witnessed in the loan book thus securing a stream of annuity income. The Corporate Finance team was equally exceptional given the range of mandates won and the magnitude of deals executed. CIB business across the group became balance sheet conscious during the year and this has encouraged a foray into deals and transactions which were earlier thought to be too big for the local balance sheet by using Standard Bank’s distribution network. The importance of this innovative change could not be over-emphasized on the books of both the local CIB business as well as that of the group. It has equally fostered intra-group communication and co-operation. 38 2011 priorities • Continue emphasis on growing the trade finance business. • Increased focus on building quality long term loan books through the Investment Banking team, thereby creating a sustainable stream of annuity income. • Focus on the Equity and Debt Capital Markets as more companies and state governments are expected to approach the capital markets for financing. • Further repositioning of the relationship management team for effectiveness and closer working relationship with our transactional bankers. • An aggressive client acquisition program. • Continued improvement of service and processes. • Cost and operational efficiency.
  • 42.
    39 Corporate InvestmentBanking Strategic direction The challenging terrain witnessed in 2010 required clear and precise strategic initiatives from management aimed at not only defending our current market share but growing organically by increasing our wallet share of existing client business as well as attract new clients. The strategic initiatives include: • Continued growth in medium to long term risk asset book • Focus on trade finance, with the aim of increasing our market share • An aggressive client acquisition programme • Repositioning the balance sheet to lower the cost of funding Awards The relentless efforts and outstanding contributions made by units within CIB were not unnoticed in the course of the year. Awards and accolades were showered on the team by various reputable institutions amongst which are: • Global Finance Awards for best Sub Custodian , 2010 • Best Investment Bank in Nigeria, Euromoney, 2010 • Best Brokerage House, EMEA Finance, 2010 • Best Investment Bank, EMEA Finance, 2010 • Best Issuing House in Africa, Africa Bankers Award, 2010 • Best Custodian in Nigeria, Global Custodian 2010 Emerging Markets Award Financial performance Though the market terrain was quite challenging in 2010, CIB was able to post an impressive result on the back of clear strategic goals and team performance. The division’s total income grew by 7% during the year with significant portion of it coming from a 54% reduction in interest expense due to the repositioning of the balance sheet specifically change in deposit mix coupled with lower cost of funding. Looking forward The on-going banking reforms and the present economic situation present both challenges and opportunities for CIB. It is therefore imperative to be forward looking and approach the imminent challenges and opportunities in 2011 with some well articulated strategies that will ensure that we harness the emerging opportunities as well as increase our market share. Some of these strategies include: • One CIB – We expect to continue to develop our concept of One CIB whereby the CIB business will run group-wide on a balance sheet conscious model such that transactions can be booked on the balance sheet of any country provided the group has an appetite for the transaction and it does not violate any local regulatory laws. These will allow large ticket transactions to be done irrespective of the country of origination. The concept also encourages better working cooperation between CIB’s 3 product houses – GM, IB and TPS with a view to better serving our clients. • Improved coverage model – The segregation between investment banking coverage and corporate banking coverage will create client focused relationship teams. Specific needs of client will easily be accommodated under this model with the end result of providing tailor-made services for clients. Large corporate and multinationals will be able to access expertise knowledge on how to launch their business and access investment opportunities across the globe through our wide market presence. The key performance indicators are highlighted below: 2010 Nmillion 2009 Nmillion Growth % Total income 27,487 25,586 7 Staff costs 7,026 7,444 (6) Other operating expenses 10,307 8,541 21 Provision for risk assets (513) 3,820 (100) Tax provision 3,106 810 100 Profit after tax 7,561 4,971 52 Deposits 104,222 94,186 11 Gross loans advances 129,807 103,379 26
  • 43.
    BusinessreviewBusinessreview Stanbic IBTC BankPLC Annual Report 2010 • Efficiency in the credit process – Further reviews will be carried out on the credit review process across CIB in order to improve the process and make it more efficient whilst still maintaining the highest standard of credit review and approval process. • Client acquisition – The drive is to increase our client base across all our priority sectors. The bank has grown in branch network and several improvements have been carried out on the bank’s systems and infrastructure to better serve the clients. It is imperative to grow client base, to sweat the existing infrastructure and increase our market share. • Debt solutions – The debt solutions team has been adequately resourced to undertake several projects and grow the loan book in order to create a stream of annuity income. The team will be looking at the various opportunities within key sectors of the economy such as power, infrastructure and oil gas. • Cost optimisation – There is need to focus on ways of eliminating avoidable costs and optimizing the benefits from the unavoidable ones. • Trade business – The country remains an import dependent economy which means that increasing trade transactions remain an important part of our business strategy. It is expected that the fusion of structured and vanilla trade business will ensure a more successful year for the trade desk. • Cash management solutions – Our expectation is that more volumes will be pushed through our electronic payment platform called new Business Online (nBOL). The platform has been upgraded to include new features and it is more user friendly. New applications such as Bulk Cheque Writing solutions and Auto Safe will further complement the existing cash management solutions thereby catering for a variety of client needs. 40
  • 44.
    Oando PLC (“Oando”or the “Company”) is a leading Nigerian oil and gas company which generated over US$2 billion in revenue in 2009. Case study Oando PLC 41
  • 45.
    Stanbic IBTC BankPLC Annual Report 2010 42 Businessreview Oando’s business is organised into 6 business divisions: (i) Exploration production; (ii) Energy services (in the upstream sector); (iii) Gas and power (in the midstream sector); (iv) Marketing; (v) Supply and trading; and (vi) Refinery and terminals (in the downstream sector). The company had approximately US$660 million (naira equivalent) in short term debt which comprised overdraft, 90 day commercial paper, and trade finance facilities to 18 commercial banks and was seeking to implement an optimal capital structure in advance of executing a number of corporate finance initiatives and expansion programmes in its exploration and production business. The programme Stanbic IBTC Bank PLC (“Stanbic IBTC”) was mandated as Global Co-ordinator and Structuring Bank to restructure a portion of Oando’s short term debt into a term facility. US$400 million (naira equivalent) of the company’s total debt was restructured from previously unsecured 90 day commercial paper into a fully secured syndicated medium term facility, which was held at the group level with security taken on five of the subsidiaries of the Oando Group. The transaction required extensive financial and legal due diligence of the financing company’s operations at both the holding company and subsidiary level which ensured that an adequate financing structure was put in place for the transaction and furthermore that the company would not violate any terms and conditions of its existing facilities at both the holding company and subsidiary levels. Financing Stanbic IBTC acted as Joint Mandated Lead Arranger with two other banks on the transaction. In its additional capacity as The Bank won “Bank Arranger of the Year Award” from Africa Investor at the Ai Infrastructure Investment Awards 2010, on the back of this transaction, amongst others. Structuring Bank and Global Co-ordinator on the transaction, Stanbic IBTC also undertook the roles of Financial Modelling Bank and Documentation Bank. The transaction to date is the largest restructuring of a short term loan completed in 2010, in the Nigerian financial market. • The restructure of Oando’s commercial bank facilities was pertinent to the success of its corporate finance initiatives valued at US$640 million; • This transaction consolidated the administration of the company’s local commercial loans to a more efficiently managed process and Oando was able to streamline its banking operations in the process from 18 to 13 banks; • Local banks are now in a secured position with regards to their loan exposure to Oando; and • Stanbic IBTC in its capacity as Global Coordinator for the Oando transaction, was the de-facto financial adviser with respect to the restructuring of the company’s balance sheet. As Global Coordinator / Financial Adviser, we were responsible for preparing the financial model that was used during the debt financing for the transaction. In addition we were responsible for structuring the transaction and providing support to the company from the stage when the term sheet was signed until financial close (initial disbursement).
  • 46.
    43 Case study Dangote CementPlc Dangote Cement Plc (“DCP”) is a fully integrated cement company with operations in Nigeria, Benin and Ghana. It is the largest cement company in Nigeria with an expected production capacity of 20mpta in 2011 (representing 70% market share). The company owns and operates Obajana Cement Plant, the largest cement plant in Sub-Saharan Africa and the second largest in Africa.
  • 47.
    Stanbic IBTC BankPLC Annual Report 2010 44 Businessreview Dangote Cement Plc (DCP) was incorporated as Obajana Cement in 1992 to operate plants for the preparation, manufacture, control, research and distribution of cement and related products. In 2007, DCP commenced operation of multiple domestic manufacturing and bulk import terminal operations across Nigeria. These include Obajana Cement Plant, Ibese Cement Plant (a green field plant), Dangote Bail Cement Terminals and Lagos Cement Terminals. Pre-merger, 99% of the company was owned by Dangote Industries Limited (“DIL”). Benue Cement Company Plc (“BCC”) was incorporated as a private limited liability company in 1975. The company commenced cement production in 1980 and was listed on The Nigerian Stock Exchange (“The NSE”) in 1991. In 2000, DIL became a core shareholder in BCC and subsequently took over management control in 2004. Pre-merger, 75% of the company was owned by DIL. The programme Stanbic IBTC acted as financial adviser to BCC in its N66.7 billion merger with DCP. The objective of the merger was to consolidate the cement producing entities of DIL, thus presenting a better platform for the enlarged entity (post merger) to optimize the opportunities inherent in the Nigerian cement industry. Shareholders of BCC and DCP approved the merger by voting at separate court-ordered meetings and the transaction was sanctioned by the Federal High Court rendering it effective on 8th October 2010. In line with the terms of the merger, BCC minority shareholders received 1 share in DCP for every 2 BCC shares originally held. DCP was listed on The NSE on 26th October 2010 at N135 per share with a market capitalization of N2.1 trillion (representing 25% of The NSE’s total market capitalization). It was the biggest listing ever on The Nigerian Stock Exchange.
  • 48.
    45 Case study AccuGas Limited TheAccuGas Gas Pipeline Project (the “project”) involves the construction of a new 65km pipeline with a capacity of 100mmcf/d from Frontier Oil Limited’s / Septa Energy’s Uquo gas field to Ikot Abassi in Akwa Ibom State, Nigeria. The project also involves the construction of a gas and liquids processing facility (“CPF”) and liquids pipeline, which in aggregate will cost approximately US$250 million, of which AccuGas Limited (“AccuGas”) will be investing a total of US$190 million in equity and pre-payments and the additional US$60 million will be funded by debt.
  • 49.
    Stanbic IBTC BankPLC Annual Report 2010 46 Businessreview The gas pipeline will deliver gas to Ibom Power Company Limited, a 180MW Independent Power Producer, which began operation in December 2009 and is slated to expand to 550MW in the near future. AccuGas is a wholly owned subsidiary of Seven Energy International Limited (“Seven Energy”), a leading independent gas exploration and production company, which operates under the trade name of Septa Energy Nigeria Limited (“Septa Energy”) in Nigeria. AccuGas was set up as a special purpose vehicle (“SPV”) for the development of Seven Energy’s gas pipeline infrastructure operations across Nigeria. The programme Stanbic IBTC Bank PLC (“Stanbic IBTC”) was mandated as Lead Arranger, Global Coordinator and Structuring Bank, to arrange and raise the required debt financing for the project. In June 2010, AccuGas signed a US$60 million 8 year project finance facility with Stanbic IBTC and United Bank for Africa Plc (“UBA”) to part finance the project, which is the first phase in AccuGas’ and Septa Energy’s development programme to bring the South East Niger Delta’s substantial discovered gas reserves to market to meet the growing energy demand from power plants and industrial users in the region. This has been strongly supported by independent power companies, Akwa Ibom State and industrial companies, who require reliable gas supply for their operations. AccuGas and Septa Energy have achieved a major milestone in Nigeria’s gas development industry, as an indigenous gas producer, setting the pace for the nation’s industrial economic growth. The financing represents the first true project financing in Nigeria for an integrated mid-stream gas infrastructure network, which includes an extensive gas pipeline distribution network and a gas processing facility and is also one of the first in Nigeria to comply with both the Nigerian environmental regulations and the IFC’s Equator Principles. In its capacity as Structuring Bank and Global Coordinator on the transaction, Stanbic IBTC also undertook the roles of Financial Modeling Bank, Facility Agent and Documentation Bank. The Bank won “African Midstream Oil Gas Deal of the Year 2010” from Euromoney Project Finance Magazine, on the back of this, amongst others.
  • 50.
    47 Case study IHS NigeriaPlc IHS Nigeria Plc (“IHS”) is a telecommunication infrastructure support services provider with presence in Nigeria, Ghana, Tanzania, Sudan and other Sub-Saharan African markets. The company commenced operations in 2001 by providing turnkey solutions for telecommunications operators and vendors and has emerged as a formidable operator in the sub-sector with its three-tier approach: Site Deployment Services, Managed Services and Collocation Services. IHS has over 2,500 sites under management.
  • 51.
    Stanbic IBTC BankPLC Annual Report 2010 48 Businessreview Financing In June 2010, Stanbic IBTC, through its Leveraged and Acquisition Finance unit, provided a fully underwritten $74 million syndicated medium term refinancing and capital expenditure facility to IHS. The 5-year facility was structured as dual-currency financing consisting of a local currency (Naira) tranche and a foreign currency (USD) tranche. The USD tranche was structured with a currency hedge to minimize foreign exchange risks. The proportion of foreign currency and local currency in the facility structure was optimally weighted to achieve a lower cost of debt capital whilst providing IHS with the appropriate loan tenor. In summary, the financing allowed IHS to restructure its balance sheet. Stanbic IBTC acted as Mandated Lead Arranger for the financing which was also one of the largest funding led by a local bank to the telecoms infrastructure support sub-sector in 2010 and financial close was achieved within acutely tight timeline. Partnership Growth in the infrastructure support services sub-sector has been fueled by a cost management drive which has permeated the telecom industry landscape in 2010. In addition to the cost focus, the regulatory support for infrastructure sharing is also fuelling the growth of collocation services. This trend, which is expected to continue in Nigeria, is also expected to hold sway in other African telecoms markets. The financing provided by Stanbic IBTC will help position IHS to strengthen its position as the leading telecommunications solutions provider in Africa.
  • 52.
    49 Total income N8,671 million 2009:NGN6,919 million Cost to income ratio 50.5 % 2009: 50.4% Assets under management N580 billion 2009: N384 billion Retirement savings accounts 834,298 2009: 726,879 Wealth The Wealth Group continued to show resilience in the face of market uncertainties by exceeding 2009 income and profit by 25%. Assets under management (AuM) and client numbers also grew to sustain the position of component businesses as market leaders in their various industries. Asset management Pension management 24% 76% What we offer • The wealth division focuses on private non-pension asset management and pension fund administration and management. The division will commence the offering of trusteeship and estate planning business from 2011 having obtained both the local and international approval in 2010. 2010 highlights • Achieved record assets under management of N580billion to consolidate position as largest institutional investment business in Nigeria • Year on year revenue growth of 25% • Assets under management (AuM) grew by 51% over 2009 numbers to N580 billion (US$3.8b) • Launch of 2 fixed income focused funds (Stanbic IBTC Money Market and Bond Funds) • Regulatory approvals received for the commencement of Stanbic IBTC Trustees Limited (‘SITL”) • Established the foundation for a robust distribtion platform to drive growth strategy • Maintained cost efficiency by containing costs at about 50% of income 2011 priorities • Focus on service to improve customer experience and brand affinity • Continued growth in AuM and client numbers • SITL to commence operations • Add Shariah Compliant Investment theme for private clients Revenue by business unit
  • 53.
    Stanbic IBTC BankPLC Annual Report 2010 50 Businessreview Overview Thewealthgroupisthegroup’sthirdpartyinvestmentmanagement business. The wealth division comprised two companies: • private non-pension asset management through Stanbic IBTC Asset Management Limited (“SIAML”); and • pension fund administration (PFA) and management through Stanbic IBTC Pension Managers Limited (“SIPML”). All required local and international regulatory approvals have been received for the establishment and operation of Stanbic IBTC Trustees Limited (“SITL”), the group’s wholly owned trusteeship and estate planning subsidiary. SITL commenced business formally from 01 January 2011. The wealth group consolidated its position as the largest wealth business in Nigeria extending the franchise of the component businesses and hitting a record N580 billion (US$3.8b) in assets under management. SIAML remained the largest independent asset manager in Nigeria measured by assets under management and number and size of mutual funds, while SIPML also remained the largest PFA in Nigeria by client size and assets under management. Strategy The wealth business model remained focused on helping clients invest predominantly in the equities and fixed income markets in Nigeria to accumulate, preserve/protect and decumulate their assets. The inclusion of SITL allows us to extend the client offering to include the (inter-generational) transfer of assets. In 2010 we focused on growth – in client numbers; assets under management and the scope of our wealth operations. For the pension business, where the client numbers are important, we added over 100,000 new clients and grew assets under management by 43% to close at N489 billion (US$3.2b). We are still focused on our goal to reach a milestone of 1 million Retirement Savings accounts. For the asset management business, we more than doubled our assets under management from N43 billion in 2009 to N91 billion (US$600 million) on 31 December 2010. This result instantly positions SIAML as one of the top 10 asset managers in Nigeria when the PFAs are included. SIPML remains the largest asset manager in Nigeria by assets under management. Furthermore, the foundation for a robust distribution platform for the wealth group was established with the creation of a focused distribution (sales) team with the capability to cross sell 2010 Nmillion 2009 Nmillion Growth % Total income 8,671 6,919 25 Staff costs 1,631 1,453 12 Other operating expenses 2,750 2,031 35 Tax provision 1,396 1,090 28 Profit after tax 2,894 2,345 24 into other group client bases. We also commenced the extension of our client wealth offering to risk management by offering clients the opportunity to procure health insurance through our network from Liberty Health/THT, the local affiliate of the Standard Bank Group’s health insurance subsidiary. In addition, we maintained the focus on embedding a cost effective and scalable operating model and continuously improving internal operating efficiencies. After two years of implementation, the model is yielding the expected benefits and ensuring minimal cost growth despite a much larger operating scale. Finally, the process of leveraging the bank’s growing branch network was agreed and the accountability process defined. The pilot process highlighted the challenges and opportunities that should be managed and the appropriate attention is being paid to resolving the issues and harnessing the potential of an integrated financial services platform for our clients. Financial performance We were not overly ambitious about the market performance for 2010 based on an anticipated overhang from the financial crisis. This was exacerbated in Nigeria by the CBN induced banking reform and its impact on The Nigerian Stock Exchange. Our focus was therefore on strengthening our annuity and non-volatile income bases. The foregoing approach proved to be prescient and 2010 was remarkably successful for the wealth group. Revenues and net earnings grew by 25% each over the 2009 results. Although the fee pressure remains, the much improved performance reflected not only the strength of our underlying business, but the level of efficiency and savings that was extracted from our operational improvement strategy. Total assets under management grew by 51% to N580 billion (i.e. over $3.8 billion).
  • 54.
    51 Looking forward We expecta great deal of excitement in the financial markets in 2011. With the expected resolution and completion of the banking sector reforms, we expect an increase in general liquidity. Combined with the customary pre-election liquidity, and increasing compliance in the pension industry and insurance sector, we expect an increase in investment assets and have therefore positioned ourselves to take advantage of the possible mandate opportunities. Our focus vehicles for 2011 are the mutual funds and the RSA fund which should benefit from increasing retail participation via lower risk investment vehicles. We expect to launch a shariah- compliant investment avenue for our private clients in SIAML to address a market segment that is still underserved. Our client lifecycle management approach will continue to guide us as the synergy between the objectives of living a healthy life, investing safely and retiring well should provide us with ample opportunity to expose our clients – existing and potential - to the Stanbic IBTC Wealth offering. In so doing, we expect to drive client numbers and there from, asset growth. Wealth
  • 55.
    Stanbic IBTC BankPLC Annual Report 2010 52 BusinessreviewBusinessreview 52
  • 57.
    Stanbic IBTC BankPLC Annual Report 2010 54 Annualreportand financialstatements Annual report and financial statements Annualreportand financialstatements 50 Board of directors Directors’ report Directors’ responsibility for annual financial statements Corporate governance report Audit committee report Report of the independent auditor Statement of accounting policies Profit and loss accounts Balance sheets Statement of cash flow Notes to the financial statements Financial risk analysis Statement of value added Five year financial summary 55 59 64 65 77 78 79 84 85 86 88 119 149 151
  • 58.
    55 Yinka Sanni (45) B.SC,MBA, ACS, AMP Appointed: 2005 Directorships: Stanbic IBTC Bank PLC, Stanbic IBTC Asset Management Ltd, Stanbic IBTC Trustees Ltd, People Affairs Ltd Committee member: Board credit committee, Board risk management committee Board of directors Board 2010 01 04 02 05 03Atedo N.A. Peterside (oon) (55) BSc, MBA Appointed: Director 1989, Chairman 2007 Directorships: Stanbic IBTC Bank PLC, Stanbic IBTC Pension Managers Ltd, Cadbury Nigeria Plc, Nigerian Breweries Plc, Presco Plc, Unilever Nigeria Plc, Flour Mills of Nigeria Plc Committee member: None Chris Newson (46) B.Com, CA(SA), CSEP Appointed: 2008 Directorships: Stanbic IBTC Bank PLC, Stanbic IBTC Stockbrokers Ltd, Stanbic Nominees Nigeria Limited, Stanbic IBTC Asset Management Ltd, Stanbic IBTC Ventures Ltd Committee member: Board risk management committee Sola David-Borha (50) BSc (Econs), MBA Appointed: 1994 Directorships: Stanbic IBTC Bank PLC, Stanbic Nominees Nigeria Ltd, Stanbic IBTC Stockbrokers Ltd, Stanbic IBTC Asset Management Ltd, Stanbic IBTC Pension Managers Ltd, Stanbic IBTC Ventures Ltd, Board Member-Financial Institutions Training Centre (FITC), First Securities Discount House, Credit Reference Company, Frezone Plant Fabrication Int Ltd, First SMI Investment Company, Vectis Capital Nigeria Ltd, Fate Foundation, Redeemers International School Committee member: Board credit committee, Board risk management committee Marna Roets (44) B.Com (Hons) CA (SA) Appointed: 2007 Directorships: Stanbic IBTC Bank PLC, Stanbic Nominees Nigeria Ltd, Stanbic IBTC Stockbrokers Ltd Committee member: Board risk management committee 01 04 02 05 03
  • 59.
    Stanbic IBTC BankPLC Annual Report 2010 56 06 09 07 1008 Moses Adedoyin (62) FCIB Appointed: 2005 Directorships: Stanbic IBTC Bank PLC, Remofal Ltd, Allegiance Technologies Ltd, Bank Directors Association of Nigeria Committee member: Board credit committee, Audit committee Jacques Troost (47) B.Com (Hons) Appointed: 2007 Directorships: Stanbic IBTC Bank PLC Committee member: Board credit committee, Board risk management committee Alaibi Samuel Cookey (55) B.A. Hons A E D, B.Arch Hons Appointed: 2009 Directorships: Stanbic IBTC Bank PLC, Space Concepts Limited, Context Matrix Ltd, Mentor Trinity Ltd Committee member: Board risk management committee, Audit committee Ifeoma Esiri (58) LLB, BL, LLM Appointed: 2004 Directorships: Stanbic IBTC Bank PLC, Stanbic IBTC Asset Management Limited, Podini International Limited, Veritas Geophysical Nigeria Limited, Ashburt Leisures Limited, Ashburt Beverages Limited, Ashburt Oil and Gas Limited Committee member: Chairperson. Board risk management committee, Audit committee 06 09 07 1008 Arnold Gain (56) B.Com, FA, BDP Appointed 2011 Directorships: Stanbic IBTC Bank PLC Committee member: Board credit committee, Board risk management committee. Annualreportand financialstatements
  • 60.
    57 Board of directors Board2010 12 11 12 13 1311 Ben Kruger (51) B.Com (Hons) CA (SA) Appointed: 2007 Directorships: Stanbic IBTC, Standard Bank Plc, SSA Trading (Pty) Ltd Committee member: Board credit committee, Board risk management committee, Board remuneration committee Jacko Maree (55) B.Com, MA, PMD Appointed: 2007 Directorships: Stanbic IBTC Bank PLC, Standard Bank Group Ltd, The Standard Bank of South Africa Ltd, Standard International Holding SA, Standard Bank plc, SBIC Investments SA, Liberty Group Ltd, Liberty Holdings Ltd, Jobco, The River Club Ltd, Stanbic Africa Holdings, Banking Association of South Africa Committee member: Board remuneration committee Ratan Mahtani (55) Appointed: 2008 Directorships: Stanbic IBTC Bank PLC, Aegean Investments Limited, Churchgate Nigeria Limited, First Century International Limited, Foco International Investments Limited, T F Kuboye co, International Seafoods Limited Committee member: None
  • 61.
    Stanbic IBTC BankPLC Annual Report 2010 58 Annualreportand financialstatements
  • 62.
    59 Directors’ report For theyear ended 31 December 2010 The directors present their annual report on the affairs of Stanbic IBTC Bank PLC (“the bank”) and its subsidiaries (“the group”), together with the financial statements and auditor’s report for the year ended 31 December 2010. a. Legal form The bank was incorporated in Nigeria under the Companies Allied Matters Act (CAMA) as a private limited liability company on 2 February 1989. It was granted a licence on 3 February 1989 to carry on the business of merchant banking and commenced business on 1 March 1989. The bank was converted into a public limited liability company on 25 January 2005. The bank’s shares were listed on 25 April 2005 on the floor of The Nigerian Stock Exchange, by way of introduction. b. Principal activity and business review The principal activity of the bank is the provision of banking and other financial services to corporate and individual customers. Such services include the granting of loans and advances, corporate finance and money market activities. Its major subsidiaries carry on asset management, stock broking and pension fund administrator businesses. 2010 Group Nmillion 2009 Group Nmillion 2010 Bank Nmillion 2009 Bank Nmillion Gross earnings 56,745 59,781 48,934 52,850 Profit before tax 13,528 10,342 10,187 7,141 Taxation (4,073) (2,204) (2,376) (883) Profit after taxation 9,455 8,138 7,811 6,258 Non controlling interest (653) (490) - - Profit attributable to the group 8,802 7,648 7,811 6,258 Appropriations: Transfer to statutory reserve 1,450 1,147 1,172 939 Transfer to retained earnings reserve 7,352 6,501 6,639 5,319 8,802 7,648 7,811 6,258 Dividend proposed 7,313 5,625 7,313 5,625 The bank has five wholly owned subsidiaries: Stanbic IBTC Asset Management Limited, Stanbic IBTC Stockbrokers Limited, Stanbic IBTC Ventures Limited, Stanbic Nominees Nigeria Limited and Stanbic IBTC Trustees Limited. It is the majority shareholder in another subsidiary; Stanbic IBTC Pension Managers Limited. The winding up of R B Resources Limited, a subsidiary it acquired as a result of its merger with the legacy Regent Bank PLC in December 2005 was concluded in April 2010. Stanbic IBTC Trustees Limited, which was incorporated in 2009, is expected to commence operations in 2011. The bank prepares consolidated financial statements. Separate financial statements of the bank accompanies the consolidated financial statements. c. Operating results and dividends The group gross earnings decreased by 5%, while the profit before tax increased by 31%. The board recommended the approval of a final dividend of N0.39 kobo per share (2009: N0.30 kobo). Highlights of the group’s operating results for the year under review are as follows:
  • 63.
    Stanbic IBTC BankPLC Annual Report 2010 60 Annualreportand financialstatements d. Directors’ shareholding The direct interest of directors in the issued share capital of the bank as recorded in the register of directors’ shareholding and / or as notified by the directors for the purposes of section 275 and 276 of CAMA and the listing requirements of The Nigerian Stock Exchange are as follows: Direct shareholding Number of ordinary shares held Number of ordinary shares held 2010 2009 Atedo N. A. Peterside OON 220,000,000 220,000,000 Chris Newson - - Sola David - Borha 16,121,573 16,121,573 Marna Roets - - Jacques Troost - - Yinka Sanni 1,000,000 1,000,000 Moses Adedoyin 44,400,000 44,320,000 Sam Cookey 2,000,000 2,000,000 Ahmed Dasuki*** 109,000,722 109,000,722 Dr Alewyn Burger*** - - Ifeoma Esiri 100,844,394 113,844,394 Christopher Kolade CON*** - - Ben Kruger - - Bhagwan Mahtani * 53,373,333 53,373,333 Ratan Mahtani * 53,373,333 53,373,333 Jacko Maree - - Sam Unuigbe*** 121,605,600 121,605,600 Lt Gen (rtd) M.I. Wushishi CFR GCON** - - * Messrs Bhagwan Mahtani and Ratan Mahtani both have indirect shareholdings amounting to 2,002,457,635 ordinary shares (2009: 2,002,457,635) respectively through First Century International Limited, Churchgate Limited, International Seafoods Limited, Foco International Limited, Aegean Investments Limited and R B Investments Limited. **Lt General (rtd) Wushishi CFR GCON, who retired from the Board in June 2010, has an indirect shareholding amounting to 214,000,000 ordinary shares (2009: 214,000,000) through Umfat Holdings Limited. ***Dr. Alewyn Burger, Dr. Christopher Kolade CON, Mallam Ahmed Dasuki, Mr. Bhagwan Mahtani and Mr. Sam Unuigbe voluntarily retired during 2010. The board also appointed Mr. Arnold Gain as a director after the Annual General Meeting held in June 2010. His appointment is effective 25 February 2011. Shareholders will be requested to appoint Mr Gain as a director at the Annual General Meeting holding in 2011. Arnold Gain’s shareholding position which is nil is not reflected above because his appointment to the board took effect after 31 December 2010. The directors to retire by rotation at the next Annual General Meeting (AGM) are Mr Atedo N. A. Peterside OON, Mr Moses Adedoyin, Mrs Ifeoma Esiri and Ms Marna Roets. All of these directors, being eligible, offer themselves for re – election.
  • 64.
    61 Directors’ report For theyear ended 31 December 2010 e. Directors interest in contracts During the course of 2010, two directors, Mr Bhagwan Mahtani and Mr Ratan Mahtani, had an interest in a company which had a contract with the bank, which interest was disclosed to the board in compliance with the requirements of Section 277 of CAMA. f. Property and equipment Information relating to changes in property and equipment is given in Note 20 to the accounts. In the directors’ opinion the disclosures regarding the group’s properties are in line with the related statement of accounting policy of the group. g. Shareholding analysis The shareholding pattern of the Bank as at 31 December 2010 is as stated below: h. Substantial interest in shares According to the register of members as at 31 December 2010, no shareholder held more than 5% of the issued share capital of the bank except the following: Shareholder No of shares held Percentage shareholding Stanbic Africa Holdings Limited (SAHL) 9,518,617,926 50.77% First Century International Limited 1,400,790,732 7.47% Share range No. of shareholders Percentage of shareholders No. of holding Percentage holdings 1 - 1,000 27,455 25.1 22,910,238 0.10 1,001 - 5,000 47,041 43.0 130,213,858 0.70 5,001 - 10,000 14,029 12.8 118,917,909 0.60 10,001 - 50,000 15,487 14.2 371,398,470 2.00 50,001 - 100,000 2,581 2.4 206,346,836 1.10 100,001 - 500,000 2,225 2.0 506,010,291 2.70 500,001 - 1,000,000 281 0.3 219,130,334 1.20 1,000,001 - 5,000,000 204 0.2 421,406,877 2.20 5,000,001 - 10,000,000 41 0.0 292,779,376 1.60 10,000,001 - 50,000,000 54 0.0 1,310,095,341 7.00 50,000,001 - 18,750,000,000 35 0.0 15,150,790,470 80.80 Grand total 109,433 100 18,750,000,000 100 Foreign shareholders 148 9,759,536,445 52.05 Year ended Total amount paid Nmillion Dividend paid per share kobo 31 March 2000 240.0 40 31 March 2001 270.0 45 31 March 2002 300.0 30 31 March 2003 400.0 40 31 March 2004 500.0 25 31 March 2005 1,174.2 20 31 March 2006 2,411.4 20 31 March 2007 3,750.0 30 31 December 2007 4,687.5 25 31 December 2008 7,500.0 40 31 December 2009 5,625.0 30 i. Dividend payment history
  • 65.
    Stanbic IBTC BankPLC Annual Report 2010 62 Annualreportand financialstatements Year Authorized (N000) Issued fully paid-up (N000) Consideration Increase Cumulative Increase Cumulative 1989 - 20,000 - 12,000 Cash 1991 30,000 50,000 12,000 24,000 Bonus (1:1) 1992 - 50,000 16,000 40,000 Bonus (2:3) 1994 100,000 150,000 60,000 100,000 Bonus (3:2) 1996 50,000 200,000 100,000 200,000 Bonus (1:1) 1997 400,000 600,000 400,000 600,000 Bonus (2:1) 2001 400,000 1,000,000 400,000 1,000,000 Bonus (2:3) 2003 1,000,000 2,000,000 1,000,000 2,000,000 Bonus (1:1) 2004 2,000,000 4,000,000 - 2,000,000 2005 1,000,000 5,000,000 935,492 2,935,492 Cash 2006 1,500,000 6,500,000 3,314,508 6,250,000 Cash and share exchange 2007 3,500,000 10,000,000 3,125,000 9,375,000 Share exchange k. Donations and charitable gifts The group made contributions to charitable and non–political organizations amounting to N50,751,000 (2009: N81,310,000) during the year. N Stanbic IBTC adoption of Lagos Progressive School, Surulere 19,700,000 Stanbic IBTC Sickle Cell Library 10,000,000 Yaba College of Technology 6,426,000 The Nigerian Economic Summit 2010 5,000,000 The Lagos Economic Summit 1,500,000 The Musical Society of Nigeria 950,000 Fate Foundation 850,000 2010 International French Schools World Cup Sponsorship 750,000 Renovation of Gbagada Senior Grammar School 750,000 World Malaria Day 710,000 The African Refugee Foundation 500,000 Patrich Speech Languages Centre 500,000 Children Development Centre (CDC) 500,000 The Social Enterprise Report and Awards (SERA) 500,000 The Future Project 500,000 The International Women Organization for Charity 435,000 2010 Independence Day Parade for 40 Students 400,000 Loyola Jesuit College PTA Advocacy Project 250,000 Nigerian Heart Foundation 200,000 NYSC Anti-Trafficking Club 150,000 The Eko Awards 100,000 South African Social Day for Charity 80,000 Total 50,751,000 j. Share capital history
  • 66.
    63 Directors’ report For theyear ended 31 December 2010 l. Post balance sheet events There are no significant post balance sheet events after the balance sheet date. m. Human resources Employment of disabled persons The bank continues to maintain a policy of giving fair consideration to applications for employment made by disabled persons with due regard to their abilities and aptitude. The bank’s policy prohibits discrimination of disabled persons or persons with HIV in the recruitment, training and career development of its employees. In the event of members of staff becoming disabled efforts will be made to ensure that, as far as possible, their employment with the bank continues and appropriate training is arranged to ensure that they fit into the bank’s working environment. Health safety and welfare at work The bank enforces strict health and safety rules and practices at the work environment which are reviewed and tested regularly. The bank’s staff are covered under a comprehensive health insurance scheme (Liberty Blue) pursuant to which the medical expenses of staff and their immediate family are covered up to a defined limit. Fire prevention and fire fighting equipment are installed in strategic locations within the bank’s premises The bank has both Group Personal Accident and Workmen’s Compensation Insurance cover for the benefit of its employees. It also operates a contributory pension plan in line with the Pension Reform Act 2004. n. Employee involvement and training The bank ensures, through various fora, that employees are kept informed on matters concerning them. Formal and informal channels are employed for communication with employees with an appropriate two – way feedback mechanism. Inaccordancewiththebank’spolicyofcontinuousstaffdevelopment, training facilities are provided in the bank’s well equipped Training School (the Blue Academy). Employees of the bank attend training programmes organized by the Standard Bank Group (SBG) in South Africa and elsewhere and participate in programmes at the Standard Bank Global Leadership Centre in South Africa. The bank also provides its employees with on the job training in the bank and at various Standard Bank locations. o. Auditors The external auditors; PricewaterhouseCoopers who have acted as the bank’s auditors for a continuous period of more than 10 years have, as required by the CBN Code of Corporate Governance, indicated that from the 2011 financial year they will no longer act as auditors to the Company. Special approval was obtained from Central Bank of Nigeria to enable them act as auditors for the purpose of the 2010 financial statements. In accordance with Section 357(1) of CAMA a resolution will be proposed, and if considered appropriate passed, by shareholders, at the AGM, to appoint new auditors. Shareholders will also be required to authorise the directors to fix the remuneration of such new auditors. By order of the board Angela Omo-Dare Company secretary head legal 23 February 2011
  • 67.
    Annualreportand financialstatements Directors’ responsibility forannual financial statements For the year ended 31 December 2010 The Companies and Allied Matters Act, and the banks and Other Financial Institutions Act, require the directors to prepare financial statements for each financial year that give a true and fair view of the state of financial affairs of the bank at the end of the year and of its profit or loss. The responsibilities include ensuring that the bank: i. keeps proper accounting records that disclose, with reasonable accuracy, the financial position of the bank and comply with the requirements of the Companies and Allied Matters Act and the Banks and Other Financial Institutions Act; ii. establishes adequate internal controls to safeguard its assets and to prevent and detect fraud and other irregularities; and iii. prepares its financial statements using suitable accounting policies supported by reasonable and prudent judgements and estimates, that are consistently applied. The directors accept responsibility for the annual financial statements, which have been prepared using appropriate accounting policies supported by reasonable and prudent judgments and estimates, in conformity with: - Nigerian Accounting Standards; - Prudential Guidelines for Licensed Banks; - relevant circulars issued by the Central Bank of Nigeria; - the requirements of the Banks and Other Financial Institutions Act; and - the requirements of the Companies and Allied Matters Act. The directors are of the opinion that the financial statements give a true and fair view of the state of the financial affairs of the bank and group and of the profit for the year. The directors further accept responsibility for the maintenance of accounting records that may be relied upon in the preparation of financial statements, as well as adequate systems of internal financial control. Nothing has come to the attention of the directors to indicate that the group will not remain a going concern for at least twelve months from the date of this statement. Atedo N.A. Peterside OON Chairman 23 February 2011 Chris Newson Chief executive officer 23 February 2011 64Stanbic IBTC Bank PLC Annual Report 2010
  • 68.
    65 Corporate governance report Forthe year ended 31 December 2010 Introduction The bank is a member of the Standard Bank Group, which holds a 50.77% equity holding in the bank. Standard Bank Group (“SBG”) is committed to implementing initiatives that improve corporate governance for the benefit of all stakeholders. SBG’s board of directors remains steadfast in implementing governance practices that comply with international best practice, where substance prevails over form. Subsidiary entities within SBG are guided by these principles in establishing their respective governance frameworks, which are aligned to SBG’s standards in addition to meeting the relevant jurisdictional requirements in their areas of operation. Stanbic IBTC Bank PLC (“Stanbic IBTC or the bank”), and its subsidiaries (“the group”), as a member of SBG, operate under a governance framework which enables the board to balance its role of providing oversight and strategic counsel with its responsibility to ensure conformance with regulatory requirements, group standards and acceptable risk tolerance parameters. The major subsidiaries of the bank; Stanbic IBTC Asset Management Limited and Stanbic IBTC Pension Managers Limited have their own distinct boards and take account of the particular statutory and regulatory requirements of the businesses they operate. These subsidiaries operate under a governance framework that enables their boards to balance their roles in providing oversight and strategic counsel with their responsibility for ensuring compliance with the regulatory requirements that apply in their areas of operation and the standards and acceptable risk tolerance parameters adopted by the group. In this regard they have aligned their respective governance frameworks to that of the group. As the bank is the holding company for the subsidiaries in the group, the bank’s board also acts as the group board, with oversight of the full activities of the group. A number of committees have been established by the group’s board that assist the board in fulfilling its stated objectives. The committees’ roles and responsibilities are set out in their mandates, which are reviewed periodically to ensure they remain relevant. The mandates set out their roles, responsibilities, scope of authority, composition and procedures for reporting to the board. Codes and regulations The group operates in highly regulated industries and compliance with applicable legislation, regulations, standards and codes, including transparency and accountability, remain an essential characteristic of its culture. The board monitors compliance with these by means of management reports, which include information on the outcome of any significant interaction with key stakeholders such as SBG’s various regulators. The group complies with all applicable legislation, regulations, standards and codes. Shareholders’ responsibilities The shareholders’ role is to approve the appointments of the board of directors and the external auditors as well as to grant approval for certain corporate actions that are by legislation or the company’s articles of association specifically reserved for shareholders. Their role is extended to holding the board accountable and responsible for efficient and effective corporate governance. Developments during 2010 During 2010, the following developments in the group’s corporate governance practices occurred: - Full compliance with the requirements of the Central Bank of Nigeria’s Code of Corporate Governance in relation to independent directors was maintained until 31 December 2010, when one of the two independent directors on the board voluntarily retired. - Establishment of a nominations committee to assist in the process for selecting individuals for appointment to the board subsequent to the voluntary retirement of four directors at the end of 2010. - There was a continued focus on directors training via attendance at various courses. - The provision of an enhanced level of information in the financials provided to shareholders and investors on an annual and quarterly basis continued. Focus areas for 2011 The group intends during 2011 to: - continue the focus on directors’ training via formal training sessions and information bulletins on issues that are relevant; - ensure that the bank fully complies with the requirement for two independent directors;
  • 69.
    Stanbic IBTC BankPLC Annual Report 2010 66 Annualreportand financialstatements Board and directors Board structure and composition Ultimate responsibility for governance rests with the board of directors of the group, who ensure that appropriate controls, systems and practices are in place. The group has a unitary board structure and the roles of chairman and chief executive are separate and distinct. The group’s chairman is a non-executive director. The number and stature of non-executive directors ensures that sufficient consideration and debate are brought to bear on decision making thereby contributing to the efficient running of the board. One of the features of the manner in which the board operates is the role played by board committees, which facilitate the discharge of board responsibilities. The committees each have a board approved mandate that is regularly reviewed. Details on how these committees operate are provided elsewhere in this report. Strategy The board considers and approves the group’s strategy. Once the financial and governance objectives for the following year have been agreed, the board monitors performance against financial objectives and detailed budgets on an on-going basis, through quarterly reporting. Regular interaction between the board and the executive is encouraged. Management is invited, as required, to make presentations to the board on material issues under consideration. Directors are provided with unrestricted access to the group’s management and company information, as well as the resources required to carry out their responsibilities, including external legal advice, at the group’s expense. It is the board’s responsibility to ensure that effective management is in place to implement the agreed strategy, and to consider issues relating to succession planning. The board is satisfied that the current pool of talent available within the bank and the group, and the ongoing work to deepen the talent pool, provides adequate succession depth in both the short and long term. Skills, knowledge, experience and attributes of directors The board ensures that directors possess the skills, knowledge and experience necessary to fulfil their obligations. The directors bring a balanced mix of attributes to the board, including: - international and domestic experience; - operational experience; - knowledge and understanding of both the macroeconomic and the microeconomic factors affecting the group; - local knowledge and networks; and - financial, legal, entrepreneurial and banking skills. The credentials and demographic profile of the board are regularly reviewed, to ensure the board’s composition remains both operationally and strategically appropriate. Appointment philosophy The appointment philosophy ensures alignment with all necessary legislation and regulations which include, but are not limited to the requirements of the Companies Allied Matters Act and the Banks Other Financial Institutions Act as well as the Companies and Banks Act of SBG’s home country. Consideration for the appointment of directors and key executives take into account compliance with legal and regulatory requirements and appointments to external boards to monitor potential for conflicts of interest and ensure directors can dedicate sufficient focus to the group’s business. The board takes cognisance of the skills, knowledge and experience of the candidate, as well as other attributes considered necessary to the prospective role. - continue to enhance the level of information provided to and interaction with shareholders, investors and stakeholders generally; and - develop an appropriate governance framework for the operating structure it will be adopting pursuant to Central Bank of Nigeria’s regulation on the Scope of Banking Activities and Ancillary Matters No 3, 2010, which brought to an end the universal banking regime under which banks and banking groups in Nigeria, inclusive of Stanbic IBTC, had been operating since 2002.
  • 70.
    67 Corporate governance report Forthe year ended 31 December 2010 In June 2010, a non-executive director; Lt Gen (rtd) M. I. Wushishi CFR GCON voluntarily retired from the board. In August 2010, another non-executive director, Dr Alewyn Burger voluntarily retired from the board, while at that time Mr Arnold Gain was appointed as a non-executive director by the board subject to all regulatory approvals being obtained for his appointment. In terms of the articles of association, Mr Gain’s appointment will be tabled at the next annual general meeting, at which time shareholders will be asked to approve the appointment and elect him to the board. Dr Christopher Kolade CON, Mallam Ahmed Dasuki, Mr Bhagwan Matani and Mr Sam Unuigbe voluntarily retired from the board of the bank with effect from 31 December 2010. With these retirements the board’s size has reduced to five (5) executive directors and eight (8) non-executive directors. The number of independent directors was also reduced to one (1). The board has however put in place steps to appoint additional directors, at least one of whom will be an independent director. The board has the right mix of competencies and experience. Board responsibilities The key terms of reference in the board’s mandate, which forms the basis for its responsibilities, are to: - agree the group’s objectives, strategies and plans for achieving those objectives; - annually review the corporate governance process and assess achievement against objectives; - review its mandate at least annually and approve recommended changes; - delegate to the chief executive or any director holding any executive office or any senior executive any of the powers, authorities and discretions vested in the board’s directors, including the power of sub-delegation; and to delegate similarly such powers, authorities and discretions to any committee and subsidiary company boards as may exist or be created from time to time; - determine the terms of reference and procedures of all board committees and review their reports and minutes; - consider and evaluate reports submitted by members of the executive; - ensure that an effective risk management process exists and is maintained throughout the bank and its subsidiaries to ensure financial integrity and safeguarding of the group’s assets; - review and monitor the performance of the chief executive and the executive team; - ensure consideration is given to succession planning for the chief executive and executive management; - establish and review annually, and approve major changes to, relevant group policies; - approve the remuneration of non-executive directors on theboardandboardcommittees,basedonrecommendations made by the remuneration committee, and recommended to shareholders for approval; - approve capital funding for the group, and the terms and conditions of rights or other issues and any prospectus in connection therewith; - ensure that an adequate budget and planning process exists, performance is measured against budgets and plans, and approve annual budgets for the group; - approve significant acquisitions, mergers, take-overs, divestmentsofoperatingcompanies,equityinvestmentsand new strategic alliances by the group; - consider and approve capital expenditure recommended by the executive committee; - consider and approve any significant changes proposed in accounting policy or practice, and consider the recommendations of the statutory audit committee; - consider and approve the annual financial statements, quarterly results and dividend announcements and notices to shareholders, and consider the basis for determining that the group will be a going concern as per the recommendation of the audit committee; - assume ultimate responsibility for financial, operational and internal systems of control, and ensure adequate reporting on these by committees to which they are delegated; - take ultimate responsibility for regulatory compliance and ensure that reporting to the board is comprehensive; - ensure a balanced and understandable assessment of the group’s position in reporting to stakeholders; - review non financial matters that have not been specifically delegated to a management committee; and - specifically agree, from time to time, matters that are reserved for its decision, retaining the right to delegate any of these matters to any committee from time to time in accordance with the articles of association.
  • 71.
    Stanbic IBTC BankPLC Annual Report 2010 68 Annualreportand financialstatements Stanbic IBTC board Shareholders Credit committee Remuneration committee (REMCO) Risk management committee Audit committee Country risk committee Executive committee Asset liabiliy committee (ALCO) Credit committee Risk management committee IT steering committee (Program of works) Personal business banking exco Operational risk compliance committee Corporate investment banking exco Investment committee Business support exco Career management committee Wealth excoNew products committee Board committee Statutory committee Management committee Delegation of authority The ultimate responsibility for the bank’s and group’s operations rests with the board. The board retains effective control through a well-developed governance structure of board committees. These committees provide in-depth focus on specific areas of board responsibility. The board delegates authority to the chief executive to manage the business and affairs of the group. The executive committee assists the chief executive when the board is not in session, subject to specified parameters and any limits on the board’s delegation of authority to the chief executive. Membership of the executive committee is set out on page 29. In addition, a governance framework for executive management assists the chief executive in his task. Board-delegated authorities are regularly monitored by the company secretary’s office. The corporate governance framework adopted by the board on 25 October 2007 and formalised with mandate approvals on 29 January 2008 is set out below:
  • 72.
    69 Corporate governance report Forthe year ended 31 December 2010 Board effectiveness and evaluation The board is focused on continued improvements in its corporate governance performance and effectiveness. During the year the board of directors underwent an evaluation conducted by an independent consultant. The aim of this evaluation was to assist the board and committees to constantly improve their effectiveness. The assessment conducted in 2010 focused on structure, process and effectiveness. The report on this evaluation was discussed at a board meeting and relevant action points have been noted for implementation to further improve board functioning. The performance of the chairman and chief executive are assessed annually, providing a basis to set their remuneration. Induction and training An induction programme designed to meet the needs of each new director is being implemented. One-on-one meetings are scheduled with management to introduce new directors to the group and its operations. The company secretary manages the induction programme. The CBN’s code of conduct is provided to new directors on their appointment. Directors are kept abreast of all relevant legislation and regulations as well as sector developments leading to changing risks to the organisation on an on - going basis. This is achieved by way of management reporting and quarterly board meetings, which are structured to form part of ongoing training. Directors attended various workshops that included money laundering and risk programmes conducted by the regulatory authorities during the second half of 2010. These workshops were aimed at enhancing the understanding of key issues, and skills of bank directors. Board meetings The board meets, at a minimum, once every quarter with ad-hoc meetings being held whenever deemed necessary. The board held a strategy session in October 2010. Directors, in accordance with the articles of association of the bank, attend meetings either in person or via tele conferencing. Directors are provided with comprehensive board documentation at least four days prior to each of the scheduled meetings.
  • 73.
    Stanbic IBTC BankPLC Annual Report 2010 70 Annualreportand financialstatements Attendance at board meetings from 1 January – 31 December 2010 is set out in the following table: Name Feb Apr Aug Oct Atedo Peterside OON (Chairman) Chris Newson Sola David-Borha Marna Roets Jacques Troost Moses Adedoyin Dr Alewyn Burger1 Sam Cookey Ahmed Dasuki Ifeoma Esiri Dr Christopher Kolade CON Ben Kruger Bhagwan Mahtani Ratan Mahtani Jacko Maree Yinka Sanni Sam Unuigbe Lt. Gen. (rtd) M. Wushishi CFR, GCON2 = Attendance A = Apology - = Not applicable 1 Retired from the Board on 03 August 2010 2 Retired from the Board on 07 June 2010 Board committees Some of the functions of the board have been delegated to board committees, consisting of board members appointed by the board, which operate under mandates originally established on 29 January 2008. The composition and mandates of the committees were reviewed during the course of 2010. Credit committee The credit committee during the period under review was vested with the following responsibilities: - recommend credit policies and guidelines for the board’s approval; - review and approve credit facilities to be granted by the bank that fall under the category of insider related credits or which are being granted to the bank staff in the cadres Assistant General Manager and above; and - such other matters relating to the credit operations of the bank as may be specifically delegated to the committee by the board. The committee’s mandate is in line with SBG’s standards, while taking account of local circumstances. The mandate ensures that effective frameworks for credit governance are in place across the bank. This involves ensuring that the committees within the structure operate according to clearly defined mandates and delegated authority, and providing for the adequate management, measurement, monitoring and control of credit risk, including country risk. The committee reports on credit portfolios, adequacy of provisions and status of non-performing loans. The credit committee met its objectives in the year under review. The committee consists of the eight directors, four of whom, including the chairman, were non – executives during the year under review.
  • 74.
    71 Corporate governance report Forthe year ended 31 December 2010 Name Feb April July Oct Ben Kruger (chairman) Chris Newson Sola David-Borha Yinka Sanni Jacques Troost Sam Unuigbe Moses Adedoyin Dr Christopher Kolade CON = Attendance A = Apology Risk management committee The board is ultimately responsible for risk management. The main purpose of the risk management committee, as specified in its mandate is the provision of independent and objective oversight of risk management within the group. The committee is assisted in fulfilling its mandate by a number of management committees. To achieve effective oversight, the committee reviews and assesses the integrity of risk control systems and ensures that risk policies and strategies are effectively managed and contribute to a culture of discipline and control that reduces the opportunity for fraud. The risk management committee during the period under review was vested, among others, with the following responsibilities: - to oversee management’s activities in managing credit, market, liquidity, operational, legal and other risks of the bank; - to periodically review the group’s risk management systems and report thereon to the board; - to ensure that the group’s material business risks are being effectively identified, quantified, monitored and controlled and that the systems in place to achieve this are operating effectively at all times; and - such other matters relating to the group’s risk assets as may be specifically delegated to the committee by the board. The committee’s mandate is in line with SBG’s standards, while taking account of local circumstances. A more in-depth risk management section which provides details of the overall framework for risk management in the group commences on page 119 of this annual report. The committee consisted of nine directors, four of whom, including the chairman were non – executives during the year under review. Members’ attendance at risk management committee meetings during the financial year ended 31 December 2010 is stated below: Name Feb April July Oct Ifeoma Esiri (chairman) Lt. Gen M.I. Wushishi CFR GCON Ben Kruger Yinka Sanni Chris Newson Sola David-Borha Marna Roets Jacques Troost Sam Cookey = Attendance A = Apology - = Not applicable Remuneration committee The remuneration committee (REMCO) was vested with responsibilities during the year under review that included: - reviewing the remuneration philosophy and policy; - considering the guaranteed remuneration, annual performance bonus and pension incentives of the group’s highest-paid executive directors and managers; - reviewing the performance measures and criteria to be used for annual incentive payments for all employees; - determining the remuneration of executive directors; - determining the remuneration of the chairman and non- executive directors, which are subject to board and shareholder approval; - considering the average percentage increases of the guaranteed remuneration of executive management across the group, as well as long-term and short-term incentives; and - agreeing incentive schemes across the group. Members’ attendance at credit committee meetings during the financial year ended 31 December 2010 are stated below:
  • 75.
    Stanbic IBTC BankPLC Annual Report 2010 72 Annualreportand financialstatements The chief executive attends meetings by invitation. Other members of executive management are invited to attend when appropriate. No individual, irrespective of position, is expected to be present when his or her remuneration is discussed. When determining the remuneration of executive and non-executive directors as well as senior executives, REMCO is expected to review market and competitive data, taking into account the groups performance using indicators such as earnings. REMCO utilises the services of a number of suppliers and advisors to assist it in tracking market trends relating to all levels of staff, including fees for non-executive directors. In 2010 the following suppliers were used: • KPMG Professional services - Participated in a renumeration survey co-sponsored by the bank. • International Remuneration, Human Resources and Compensation Consulting (IRRCC) - global market specific survey sponsored by Standard Bank Group. The board reviews REMCO’s proposals and, where relevant, will submit them to shareholders for approval at the annual general meeting (AGM.) The board remains ultimately responsible for the remuneration policy. The committee consists of four directors, all of whom are non–executives. Members’ attendance at REMCO meetings during the financial year ended 31 December 2010 is stated below: Name Jan Apr July Oct Jacko Maree (chairman) Ben Kruger Ahmed Dasuki Dr Christopher Kolade CON = Attendance A = Apology Remuneration Introduction The purpose of this section is to provide stakeholders with an understanding of the remuneration philosophy and policy applied across the group for executive management, employees, and directors (executive and non-executive). Remuneration philosophy The group’s board and remuneration committee set a remuneration philosophy which is guided by SBG’s philosophy and policy as well as the specific social, regulatory, legal and economic context of Nigeria. In this regard, the group employs a cost to company structure, where all benefits are included in the listed salary and appropriately taxed. The following key factors have informed the implementation of reward policies and procedures that support the achievement of business goals: • the provision of rewards that enable the attraction, retentionandmotivationofemployeesandthedevelopment of a high performance culture; • maintaining competitive remuneration in line with the market, trends and required statutory obligations; • rewarding people according to their contribution; • allowing a reasonable degree of flexibility in remuneration processes and choice of benefits by employees; • utilising a cost-to-company remuneration structure; and • educating employees on the full employee value proposition; The group’s remuneration philosophy aligns with its core values, including growing our people, remunerating appropriately high performers and delivering value to our shareholders. The philosophy emphasises the fundamental value of our people and their role in ensuring sustainable growth. This approach is crucial in an environment where skills remain scarce. The group board sets the principles for the group‘s remuneration philosophy in line with the approved business strategy and objectives. The philosophy aims to maintain an appropriate balance between employee and shareholder interests. The deliberations of REMCO inform the philosophy, taking into account reviews of performance at a number of absolute and relative levels – from a business, an individual and a competitive point of view. A key success factor for the group is its ability to attract, retain and motivate the talent it requires to achieve its strategic and operational objectives. The group’s remuneration philosophy includes short-term and long-term incentives to support this ability. Short-term incentives, which are delivery specific, are viewed as strong drivers of competitiveness and performance. A significant portion of top management’s reward is therefore variable, being determined by financial performance and personal contribution
  • 76.
    73 Corporate governance report Forthe year ended 31 December 2010 against specific criteria set in advance. This incentivises the commitment and focus required to achieve targets. Long-term incentives seek to ensure that the objectives of management and shareholders are broadly aligned over longer time periods. Remuneration policy The group has always had a clear policy on the remuneration of staff, executive and non-executive directors which set such remunerationatlevelsthatarefairandreasonableinacompetitive market for the skills, knowledge, experience required and which complies with all relevant tax laws. REMCOassiststhegroup’sboardinmonitoringtheimplementation of the group remuneration policy, which ensures that: • salary structures and policies, as well as cash and long term incentives, motivate sustained high performance and are linked to corporate performance objectives; • stakeholders are able to make a reasonable assessment of reward practices and the governance process; and • the group complies with all applicable laws and codes. Remuneration structure Non-executive directors Terms of service Directors are appointed by the shareholders at the AGM, although board appointments may be made between AGMs. These appointments are made in terms of the group’s policy. Shareholder approvals for such interim appointments are however sought at the annual general meeting that holds immediately after such appointments are made. Non-executive directors are required to retire after three years and may offer themselves for re-election. If recommended by the board, their re-election is proposed to shareholders at the AGM. In terms of regulations, a non-executive director can not hold office for more than 10 consecutive years. If a director over the age of 70 is seeking re-election to the board his age must be disclosed to shareholders at the meeting at which such re- election is to occur. Fees Non-executive directors receive fixed annual fees and sitting allowances for service on boards and board committees in line with the Central Bank of Nigeria’s guidelines on the remuneration payable to such directors. There are no contractual arrangements for compensation for loss of office. Non-executive directors do not receive short-term incentives, nor do they participate in any long-term incentive schemes. REMCO reviews the non-executive directors’ fees annually and make recommendations on same to the board for consideration. Based on these recommendations the Board in turn recommends a gross fee to shareholders for approval at the Annual General Meeting (AGM Fees are payable for the reporting period 1 January to 31 December of each year). Category 2011* 2010 Chairman 37,211,125 34,615,000 Non executive directors 10,342,844 9,621,250 Sitting allowances for board meetings**: - Chairman 192,425 179,000 - Non executive directors 121,475 113,000 * Proposed for approval by shareholders at the AGM taking place in 2011. ** Fees quoted as sitting allowance represent per meeting sitting allowance paid for board, board committee and ad hoc meetings. No annual fees are payable to committee members with respect to their roles on such committees. Retirement benefits Non-executive directors do not participate in the pension scheme. Executive directors The group currently has five executive directors. Executive directors receive a remuneration package and qualify for long-term incentives on the same basis as other employees. Executive directors’ bonuses and pension incentives are subject to an assessment by REMCO of performance against various criteria. The criteria include the financial performance of the
  • 77.
    Stanbic IBTC BankPLC Annual Report 2010 74 Annualreportand financialstatements group, based on key financial measures and qualitative aspects of performance, such as effective implementation of group strategy and human resource leadership. The employment contracts of executive directors have a termination clause of three months. Executive directors, other than the CEO, are required to retire from the board on a rotational basis, that usually occurs after three years and may offer themselves for re-election. If recommended by the board, their re-election is proposed to shareholders at the AGM. Management and general staff Total remuneration packages for employees comprise the following: • guaranteed remuneration – based on market value and the role played; • annual bonus – used to incentivise the achievement of group objectives; • Long term incentives – rewards the sustainable creation of shareholder value and aligns behaviour to this goal; • pension – provides a competitive post-retirement benefit in line with other employees; and • where applicable, expatriate benefits in line with other expatriates in Nigeria. Terms of service The minimum terms and conditions for managers are governed by relevant legislation and the notice period is one month. Employees on international assignments have notice periods of three months. Fixed remuneration Managerial remuneration is based on a total cost-to-company structure. Cost-to-company comprises a fixed cash portion, compulsory benefits (medical aid and retirement fund membership) and optional benefits. Market data is used to benchmark salary levels and benefits. Salaries are normally reviewed annually in March. For all employees, performance-related payments have formed an increasing proportion of total remuneration over time to achieve business objectives and reward individual contribution. All employees (executives, managers and general staff) are rated on the basis of performance and potential and this is used to influence performance-related remuneration Rating and the consequent pay decision is done on an individual basis. There is therefore a link between rating, measuring individual performance and reward. Short-term incentives All staff participate in a performance bonus scheme. Individual awards are based on a combination of business unit performance, job level and individual performance. In keeping with the remuneration philosophy, the bonus scheme seeks to attract and retain high-performing managers. As well as taking performance factors into account, the size of the award is assessed in terms of market-related issues and pay levels for each skill set, which may for instance be influenced by the scarcity of skills in that area. Long-term incentives It is essential for the group to retain key skills over the longer term. The group has put in place an equity growth scheme for qualifying managers. Participation rights in such scheme are be granted to qualifying managers in accordance with the rules of the scheme approved by the board. Retention agreements As part of the group’s strategy to retain highly mobile and talented employees, the group has selectively entered into agreements in terms of which retention payments are made. Retention payments have to be repaid should the individual concerned leave within a stipulated period Post-retirement benefits Pension Retirement benefits are typically provided on the same basis for employees of all levels and are in line and full comply with the Pension Reform Act 2004. Remuneration for 2010 The amounts specified below represent the total remuneration paid to executive and non-executive directors for the period under review: Group Nmillion Bank Nmillion Fees sitting allowance 151 151 Executive compensation 568 568 Total 719 719
  • 78.
    75 Corporate governance report Forthe year ended 31 December 2010 The group will continue to ensure its remuneration policies and practices remain competitive, incentivise performance and are aligned across the group and with its values. The audit committee The role of the audit committee is defined by the Companies Allied Matters Act and includes making recommendations to the board on financial matters. These matters include assessing the integrity and effectiveness of accounting, financial, compliance and other control systems. The committee also ensures effective communication between internal auditors, external auditors, the board and management. The committee’s key terms of reference comprise various categories of responsibilities and include the following: - review the audit plan with the external auditors with specific reference to the proposed audit scope, and approach to risk activities and the audit fee; - meet with external auditors to discuss the audit findings and consider detailed internal audit reports with the internal auditors; - annually evaluate the role, independence and effectiveness of the internal audit function in the overall context of the risk management systems; - review the accounting policies adopted by the group and all proposed changes in accounting policies and practices; - consider the adequacy of disclosures; - review the significant differences of opinion between management and internal audit; - review the independence and objectivity of the auditors; and - all such other matters as are reserved to the audit committee by the Companies Allied Matters Act and the Bank’s Articles of Association. As specified in the Central Bank of Nigeria (CBN) Code of Corporate Governance (“the CBN code”), the audit committee members have recent and relevant financial experience. Composition The committee is made up of six members, three of whom are non - executive directors while the remaining three members are shareholders elected at the Annual General Meeting (AGM). The committee, whose membership is stated below, as required by the CBN code, is chaired by a shareholder representative. As at 1 January 2010 the committee consisted of the following persons: Engr. Oluyomi Adeyemi – Wilson* Chairman Mr. Sam Unuigbe** Member Mr. Sam Cookey** Member Mr. Moses Adedoyin** Member Mrs. Oshuwa Gbadebo – Smith* Member Mr. Waheed Adegbite* Member * = Shareholders representative ** = Non Executive Director The shareholders re-elected the entire shareholder representatives on the audit committee at the AGM held on 7 June 2010. Members’ attendance at audit committee meetings during the financial year ended 31 December 2010 is stated below: Name Feb April July Oct Engr. Oluyomi Adeyemi – Wilson Mr. Sam Unuigbe Mr. Moses Adedoyin Mrs. Oshuwa Gbadebo – Smith Mr. Sam Cookey Mr. Waheed Adegbite = Attendance A = Apology Company secretary It is the role of the company secretary to ensure the board remains cognisant of its duties and responsibilities. In addition to providing the board with guidance on its responsibilities, the company secretary keeps the board abreast of relevant changes in legislation and governance best practices. The company secretary oversees the induction of new directors, including subsidiary directors, as well as the ongoing training of directors. All directors have access to the services of the company secretary.
  • 79.
    Stanbic IBTC BankPLC Annual Report 2010 76 Annualreportand financialstatements Going concern On the recommendation of the audit committee, the board annually considers and assesses the going concern basis for the preparation of the financial statements at the year end. The board continues to view the company as a going concern for the foreseeable future. Management committees The group has the following management committees: Stanbic IBTC Group executive committee (EXCO) Corporate and Investment Banking (CIB) Exco Private and Business Banking (PBB) Exco Wealth Exco Credit committee Risk committee Business support Exco Asset and liability committee (ALCO) Risk management committee IT steering committee (“program of works”) Investment committee Operational risk and compliance committee Career management committee New products committee Relationship with shareholders As an indication of its fundamental responsibility to create shareholder value, effective and ongoing communication with shareholders is seen as essential. In addition to the ongoing engagement facilitated by the company secretary and the head of investor relations, the group encourages shareholders to attend the annual general meeting and other shareholder meetings where interaction is welcomed. The chairman of the group’s audit committee is available at the meeting to respond to questions from shareholders. Voting at general meetings is conducted either on a show of hands or a poll depending on the subject matter of the resolution on which a vote is being cast and separate resolutions are proposed on each significant issue. Dealing in securities In line with its commitment to conduct business professionally and ethically, the group has introduced policies to restrict the dealing in securities by directors, shareholder representatives on the audit committee and employees. A personal account trading policy is in place to prohibit employees and directors from trading in group securities during closed periods, which period commences from 1 December to publication of final results. Compliance with this policy is monitored on an ongoing basis. Sustainability Social and environmental responsibility remains an important part of the group’s culture. The monitoring and reporting of sustainability issues is still an evolving discipline within our organisation. Social responsibility As an African business, the group understands the challenges and benefits of doing business in Africa, and owes its existence to the people and societies within which it operates. The group is committed therefore not only to the promotion of economic development but also to the strengthening of civil society and human well being. The group is concentrating its social investment expenditure in defined focus areas which currently include education in order to make the greatest impact. These areas of focus will be subject to annual revision as the countries socio-economic needs change. The Bank during the year established a Unit to handle this issue . Ethics and organisational integrity The Code of Ethics rolled out in the bank in 2008 continued to operate during 2010. Breaches of the code The bank on a number of occasions breached the requirement that anticipatory approvals granted by board committees should be ratified at a committee meeting held within 30 days of the grant of such approval. However all such anticipatory approvals were subsequently ratified by the relevant committee, albeit outside of the specified time line.
  • 80.
    77 Audit committee report Incompliance with the provisions of Section 359(3) to (6) of the Companies Allied Matters Act Cap C20 Laws of the Federation of Nigeria 2004 the Committee considered the Audited Financial Statements for the year ended 31 December 2010 together with the Management Controls Report from the auditors and the bank’s response to this report at its meeting held on 31 January 2011. In our opinion, the scope and planning of the audit for the year ended 31 December 2010 were adequate. After due consideration, the Committee accepted the Report of the Auditors that the Financial Statements were in accordance with ethical practice and generally accepted accounting principles and give a true and fair view of the state of the bank’s financial affairs. The Committee reviewed management’s response to the auditors findings in respect of management matters and we and the auditors are satisfied with management’s response thereto. On a review of insider / related party transactions the committee was satisfied with their status. The Committee therefore recommended that the Audited Financial Statements of the bank for the year ended 31 December 2010 and the auditor’s report thereon be presented for adoption by the company at the Annual General Meeting. The Committee also approved the provision made in the Financial Statements in relation to the remuneration of the Auditors. Eng. Oluyomi Adeyemi-Wilson Chairman, Audit committee 31 January 2011
  • 81.
    Stanbic IBTC BankPLC Annual Report 2010 78 Annualreportand financialstatements We believe that the audit evidence we have obtained is sufficient and appropriate to provide a basis for our opinion. Opinion In our opinion the accompanying financial statements give a true and fair view of the state of the financial affairs of the bank and the group at 31 December 2010 and of their profits and cash flows for the year then ended in accordance with Nigerian Statements of Accounting Standards, the Companies and Allied Matters Act and the Banks and Other Financial Institutions Act. Report on other legal requirements The Companies and Allied Matters Act and the Banks and Other Financial Institutions Act require that in carrying out our audit we consider and report to you on the following matters. We confirm that: i) we have obtained all the information and explanations which to the best of our knowledge and belief were necessary for the purposes of our audit; ii) in our opinion proper books of account have been kept by the bank, so far as appears from our examination of those books; iii) the bank’s balance sheet and profit and loss account are in agreement with the books of account; iv) our examination of loans and advances was carried out in accordance with the Prudential Guidelines for licensed banks issued by the Central Bank of Nigeria; v) related party transactions and balances are disclosed in Note 36 to the financial statements in accordance with the Central Bank of Nigeria circular BSD/1/2004; vi) the bank contravened certain sections of the Banks and Other Financial Institutions Act during the year as explained in Note 33 to the financial statements; and vii) except for the contraventions disclosed in Note 33 to the financial statements, the bank has complied with the requirements of the relevant circulars issued by the Central Bank of Nigeria. Chartered Accountants Lagos, Nigeria 24 February 2011 Report on the financial statements We have audited the accompanying separate and consolidated financial statements of Stanbic IBTC Bank Plc (“the bank”) and its subsidiaries (together,“the group”) which comprise the balance sheets as of 31 December 2010 and the profit and loss accounts and statements of cash flows for the year then ended and a summary of significant accounting policies and other explanatory notes. Directors’ responsibility for the financial statements The directors are responsible for the preparation and fair presentation of these financial statements in accordance with Nigerian Statements of Accounting Standards and with the requirements of the Companies and Allied Matters Act and the Banks and Other Financial Institutions Act. This responsibility includes: designing, implementing and maintaining internal controls relevant to the preparation and fair presentation of financial statements that are free from material misstatement, whether due to fraud or error; selecting and applying appropriate accounting policies; and making accounting estimates that are reasonable in the circumstances. Auditor’s responsibility Our responsibility is to express an independent opinion on the financial statements based on our audit. We conducted our audit in accordance with International Standards on Auditing. Those standards require that we comply with ethical requirements and plan and perform our audit to obtain reasonable assurance that the financial statements are free from material misstatement. An audit involves performing procedures to obtain audit evidence about the amounts and disclosures in the financial statements. The procedures selected depend on the auditor’s judgement, including the assessment of the risks of material misstatement of the financial statements, whether due to fraud or error. In making those risk assessments, the auditor considers internal controls relevant to the entity’s preparation and fair presentation of the financial statements in order to design audit procedures that are appropriate in the circumstances, but not for the purpose of expressing an opinion on the effectiveness of the company’s internal control. An audit also includes evaluating the appropriateness of accounting policies used and the reasonableness of accounting estimates made by the directors, as well as evaluating the overall presentation of the financial statements. Report of the independent auditor Report of independent auditor to members of Stanbic IBTC Bank PLC
  • 82.
    79 The principal accountingpolicies adopted in the preparation of these financial statements are set out below. These policies have been consistently applied to all years presented, unless otherwise stated. a. Basis of preparation These financial statements are the consolidated and separate financial statements of Stanbic IBTC Bank Plc, a company incorporated in Nigeria on 2 February 1989 and its subsidiaries (hereinafter collectively referred to as “the group”). The financial statements are prepared in compliance with Nigerian Statements of Accounting Standards (SAS) issued by the Nigerian Accounting Standards Board (NASB). The financial statements are presented in the functional currency, Nigerian Naira (N), and prepared under the historical cost convention as modified by the revaluation of certain investment securities, property and equipment. The preparation of financial statements in conformity with Generally Accepted Accounting Principles in Nigeria requires the use of estimates and assumptions that affect the reported amounts of assets and liabilities, and disclosure of contingent assets and liabilities at the date of the financial statements and the reported amounts of revenues and expenses during the reporting period. Although these estimates are based on the directors’ best knowledge of current events and actions, actual results may differ from those estimates. b. Basis of consolidation Subsidiaries undertaking, which are those companies in which the group directly or indirectly, has interest of more than half the voting rights or otherwise has power to control, have been consolidated.Subsidiariesareconsolidatedfromthedateeffective control is transferred to the group. Subsidiaries cease to be consolidated from the date of disposal. All intercompany transactions, balances and unrealised surpluses and deficits on transactions between group companies have been eliminated. Where necessary, accounting policies for subsidiaries have been adjusted to ensure consistency with the policies adopted by the group. Separate disclosure is made for non-controlling interest. The acquisition method of accounting is used to account for the acquisition of subsidiaries and other entities by the group. The cost of an acquisition is measured as the market value of the assets given, equity instruments issued and liabilities incurred or assumed at the date of exchange, plus costs directly attributable to the acquisition. Identifiable assets acquired, liabilities and contigent liabilities assumed in a business combination are measured at their fair values at the acquisition date, irrespective of the extent of any minority interest. The excess of the cost of acquisition over the fair value of the group’s share of the identifiable net assets acquired is recorded as goodwill. If the cost of acquisition is less than the fair value of the net assets of the entities acquired, the difference is recognised directly in the profit and loss account. Inter-company transactions, balances and unrealised gains on transactions between Group companies are eliminated. Unrealised losses are also eliminated unless the transaction provides evidence of impairment of the asset transferred. c. Segment reporting An operating segment is a component of the group engaged in business activities, whose operating results are regularly reviewed by management in order to make decisions about resources to be allocated to segments and assessing segment performance. The group’s identification of segments and the measurement of segment results is based on the group’s internal reporting to management. It represents the classification of the group’s activities in segments that reflect the risk and return of the group’s product offerings in different product markets. Additional information relating to products and services, geographic areas and major customers is provided. Segments whose total revenue (internal and external), absolute profit or loss or total assets are 10% or more of the group total, are reported separately. Transactions between segments are priced at market-related rates. Statement of accounting policies
  • 83.
    Stanbic IBTC BankPLC Annual Report 2010 80 Annualreportand financialstatements d. Foreign currency transactions Transactions denominated in foreign currency are converted into Naira at the rate of exchange ruling at the date of the transaction. Foreign currency balances are translated at the rate of exchange prevailing at the balance sheet date or, where appropriate, at the related forward exchange rate. Exchange differences are included in the profit and loss account in the period in which they arise. e Recognition of interest income and expense i. Interest income and expense are recognised in the profit and loss account for all interest bearing instruments on an accrual basis except for interest income overdue for more than 90 days, which is suspended and recognised only to the extent that cash is received. ii. Income accruing on advances under finance lease is amortised over the lease period to achieve a constant rate of return on the outstanding net investment. Rental income on equipment leased to customers is recognised on a straight line basis over the lease term. iii. Income earned on bonds and guarantees are amortised over the life of the guarantee, while other fees are recognised as commissions in the period in which they occur. f. Provision against credit risk Provision is made in accordance with the Statement of Accounting Standard for Banks and Non-Bank Financial Institutions, (SAS 10) issued by the Nigerian Accounting Standards Board, and Prudential Guidelines issued by the Central Bank of Nigeria. For each account that is not performing in accordance with the terms of the related facility, provision is made as follows: Interest and/or principal outstanding for over: Classification Minimum provision 90 days but less than 180 days Substandard 10% 180 days but less than 360 days Doubtful 50% Over 360 days Lost 100% When a loan is deemed uncollectible, it is written off against the related provision for impairments. Subsequent recoveries are credited to the provision for loan losses in the profit and loss account. If the amount of the impairment subsequently decreases due to an event occuring after the write-down, the release of the provision is credited as a reduction of the provision for impairment in the profit and loss account. A minimum of 1% general provision on performing loans is made in accordance with the prudential guidelines. g. Investment securities The group categorises its investment securities as short term investments and long term investments. Investment securities are initially recognised at cost and management determines classification at initial investment. i. Short term investments Short-term investments are investments held temporarily in place of cash and which can be converted into cash when current financing needs make such conversion desirable. They include debt and equity securities intended to be held for a period not exceeding one year. Short-term investments in marketable securities are subsequently re-measured at net realisable value. The gain/loss on revaluation is credited/charged to profit and loss account for the period. Other short-term investments are subsequently re- measured at the lower of cost and market value (quoted bid prices). The amount by which cost exceeds market value (unrealized loss) is charged to the profit and loss account for the period. ii. Long term investments Investment securities intended to be held for an indefinite period of time, or until maturity, and which may be sold in response to needs for liquidity or change in market rates, exchange rates or equity prices are classified as long term investments. Long-term investments may include debt and equity securities.
  • 84.
    81 Long-term investmentsin marketable securities are carried at lower of cost and net realizable value. Unrealised losses are charged to the profit and loss account. Other long term investments are carried at cost less impairment. An investment is impaired if its carrying amount is greater than its estimated recoverable amount. Any discount or premium arising on acquisition of bonds is included in the original cost of the investment and is amortised over the period of purchase to maturity. Interest earned whilst holding investment securities is reported as interest income. Dividends receivable are included separately in dividend income when a dividend is declared. A change in market value of investment securities is not taken into account unless it is considered to be permanent. h. Investments in subsidiaries Investments in subsidiaries are carried in the bank’s balance sheet at cost less provisions for impairment losses. Where, in the opinion of the directors, there has been impairment in the value of an investment, the loss is recognised as an expense in the period in which the impairment is identified. On disposal of an investment, the difference between the net disposal proceeeds and the carrying amount is charged to the profit and loss account. i. Property and equipment All categories of fixed assets are initially recorded at historical cost. They are subsequently stated at historical cost less depreciation. Historical cost includes expenditure that is directly attributable to the acquisition of the assets. Subsequent costs are included in the asset’s carrying amount or recognised as a separate asset, as appropriate, only when it is probable that future economic benefits associated with the item flow to the company and the cost of the item can be measured reliably. All other repairs and maintenance are charged to the profit and loss account during the financial period in which they are incurred. Construction cost in respect of offices is carried at cost as work in progress. On completion of construction, the related amounts are transferred to the appropriate category of property and equipment. No depreciation is charged until the assets are put into use. Depreciation is calculated on a straight line basis to write-off fixed assets and equipment on lease over their estimated useful life. The basis of calculation for each class of asset are set out below: j. Leases Investments under finance lease arrangements are recorded as receivables at an amount equal to the net investment in the lease i.e. the present value of the lease payments including any residual value payable on the lease. The difference between the gross receivable and the present value of the receivable is recognised as unearned income. Income accruing on the lease is amortised over the lease period on a basis reflecting a constant periodic rate of return on the outstanding net investment. Leases in which a significant portion of the risks and rewards of ownership are retained by the bank are classified as operating leases, and accounted for by the bank as an item of fixed asset. The depreciation of these assets is on the basis of the bank’s normal depreciation policy for the various classes of assets leased out. The periodic lease rentals receivable are treated as rental income in the income statement during the period they occur; while initial direct costs incurred are written off to the income statement in the period incurred. k. Goodwill Goodwill represents the excess of the cost of an acquisition over the group’s interest in the net fair value of the identifiable assets, liabilities and contingent liabilities of the acquired entity, associate or joint venture at the date of acquisition. Goodwill arising on the acquisition of an entity is reported in the balance sheet as an intangible asset. Leasehold land and building Minimum of 6 years or life of the lease Buildings 25 yrs Motor vehicles 4 yrs Furniture, fittings equipments 4 yrs Computer hardware 3 yrs Computer software 3 yrs Leasehold assets, machinery and equipment Over the life of the lease Statement of accounting policies
  • 85.
    Stanbic IBTC BankPLC Annual Report 2010 82 Annualreportand financialstatements Goodwill arising on acquisitions is allocated to cash generating units and tested annually for impairment. Negative goodwill is recognised as income in the period in which it arises. Where there has been impairment in the value of goodwill, the loss is identified in the year in which the impairment was made. Gains or losses on the disposal of an entity include the carrying amount of goodwill relating to the entity sold. l. Cash and cash equivalents Cash comprises cash on hand and demand deposits denominated in Naira and foreign currencies. Cash equivalents are short-term, highly liquid instruments which are: (a) readily convertible into cash, whether in local or foreign currency; and (b) so close to their maturity dates as to present insignificant risk of changes in value as a result of changes in interest rates. m. Provisions, contingent liabilities and contigent assets Provisions are liabilities that are uncertain in timing or amount. Provisions are recognised when: the group has a present legal or constructive obligation as a result of past events; it is more likely than not that an outflow of resources will be required to settle the obligation; and the amount has been reliably estimated. A contingent liability is a possible obligation that arises from past events and whose existence will be confirmed only by the occurrence or non-occurrence of one or more uncertain future events not wholly within the control of the Group or the Group has a present obligation as a result of past events but is not recognised because it is not likely that an outflow of resources will be required to settle the obligation; or the amount cannot be reliably estimated. A contingent asset is a possible asset that arises from past events and whose existence will be confirmed only by the occurrence or non-occurrence of one or more uncertain future events not wholly within the control of the Group. n. Retirement benefits The group operates a defined contribution pension scheme in line with the provisions of the Pension Reform Act, with contributions based on the sum that consists of employees basic salary, housing and transport allowance in the ratio 7.5% by the employee and 7.5% by the employer. The group’s contributions to the scheme are charged to the profit and loss account in the period to which they relate, and the scheme’s assets are held by pension fund administrators on behalf of the beneficiary staff. o. Deferred taxation Deferred income tax is provided in full using the liability method on all temporary differences arising between the tax bases of assets and liabilities and their carrying values for financial reporting purposes. Deferred income tax is determined using tax rates enacted or substantively enacted at the balance sheet date and are expected to apply when the deferred income tax liability is settled. Deferred income tax assets are recognised only to the extent that it is probable that future taxable profits will be available against which the temporary difference can be utilised. p. Borrowed funds Borrowed funds are recognised initially at their issue proceeds and subsequently stated at cost less any repayments. Transaction costs where immaterial, are recognized immediately in the profit and loss account. Where transaction costs are material, they are capitalized and amortised over the life of the loan. Interest paid on borrowings is recognised in the profit and loss account for the year. q. Ordinary share capital i. Share issue costs Incremental costs directly attributable to the issue of new shares or to the acquisition of a business are shown in equity as a deduction, net of tax, from the proceeds.
  • 86.
    83 Statement of accountingpolicies ii. Dividends on ordinary shares Dividends on ordinary shares are appropriated from revenue reserve in the period they are approved by the bank’s shareholders. Dividends for the year that are approved by the share holders after the balance sheet date are dealt with in the subsequent events note. Dividends proposed by the directors’ but not yet approved by members are disclosed in the financial statements in accordance with the requirements of the Companies and Allied Matters Act. r. Off balance sheet transactions Off-balancesheetengagementscomprisedirectcreditsubstitutes and transaction related contingencies such as guarantees, acceptances, bid bonds, performance guarantees and forward contracts which the bank is a party to in its normal course of business. Income earned on bonds and guarantees are amortised over the life of the guarantee, while other fees are recognised as commissions in the period in which they occur. s. Sale of loans or securities A sale of loans or securities without recourse to the seller is accounted for as a disposal and the assets excluded from the balance sheet. Profits or losses on sale of loans or securities without recourse to the seller is recognised by the seller when the transaction is completed. The Group regards a sale of loans or securities as without recourse, if it satisfies all the following conditions. Any sale not satisfying these conditions will be regarded as with recourse. - control over the economic benefits of the asset must be passed on to the buyer; - the seller can reasonably estimate any outstanding cost; and - there must not be any repurchase obligations. A sale or transfer of loans or securities with recourse where there is an obligation to, or an assumption of, repurchase is not treated as a sale, and the asset remains in the Group’s balance sheet, with any related cash received recognised as a liability. Profit arising from sale or transfer of loan or securities with recourse to the seller is amortised over the remaining life. However, losses are recognised as soon as they can be reasonably estimated. Where there is no obligation to or assumption of repurchase, the sale should be treated as a disposal and the asset excluded from the balance sheet, and any contingent liability disclosed. t. Fiduciary activities Where the group acts in a fiduciary capacity such as nominee, assets and liabilities arising there on together with the related undertakings to return such assets to the customers are excluded from the financial statements.
  • 87.
    Stanbic IBTC BankPLC Annual Report 2010 84 Annualreportand financialstatements u. Fees and commission Fees and commission are generally recognised on an accrual basis when the service has been provided. Commissions and fees arising from negotiating, or participating in the negotiation of a transaction for a third party such as establishing letters of credit, arrangement of the acquisition of shares or other securities or the purchase or sale of businesses are recognised on completion of the underlying transaction. Portfolio and other management advisory and services fees are recognised based on the applicable service contracts, usually on a time - apportionment basis. Asset management fees related to investment funds are recognised rateably over the period the service is provided. v. Dividend Proposed dividends on ordinary shares are disclosed as a note to the financial statements in the period in which they are proposed by the directors, amounts ratified for dividend payment by the shareholders are recognised as charge against the distributable reserve in the period in which the payment become obligatory. w. Income taxation Income tax expense is the aggregate of the charges to the profit and loss account in respect of current income tax, education tax, information technology development tax and deferred income tax. Current income tax is the amount of income tax payable on the taxable profit for the period determined in accordance with the Company Income Tax Act (CITA). Education tax is assessed at 2% of the assessable profits whilst information technology development tax is assessed at 1% of profit before tax.
  • 88.
    85 For the yearended 31 December 2010 Note Group 2010 Nmillion Group 2009 Nmillion Bank 2010 Nmillion Bank 2009 Nmillion Gross earnings 56,745 59,781 48,934 52,850 Interest and similar income 3 34,359 40,920 33,808 39,952 Interest and similar expense 4 (7,989) (15,813) (8,012) (15,870) Net interest income 26,370 25,107 25,796 24,082 Fee and commission income 5 19,345 13,852 10,531 7,532 Fee and commission expense (362) (145) (295) (145) Net fee and commission income 18,983 13,707 10,236 7,387 Foreign exchange income 2,658 4,169 2,658 4,149 Income from investments 6 132 274 1,917 1,034 Other income 251 566 20 183 Operating income 48,394 43,823 40,627 36,835 Operating expenses 7 (34,246) (28,623) (29,820) (24,836) Provision for losses 14 (620) (4,858) (620) (4,858) Profit before tax 13,528 10,342 10,187 7,141 Taxation 8 (4,073) (2,204) (2,376) (883) Profit after tax 9,455 8,138 7,811 6,258 Non-controlling interest 26 (653) (490) - - Profit attributable to the group/bank 8,802 7,648 7,811 6,258 Appropriated as follows: Transfer to statutory reserve 28 1,450 1,147 1,172 939 Transfer to retained earnings 28 7,352 6,501 6,639 5,319 8,802 7,648 7,811 6,258 Earnings per share (basic/diluted) 32 50 k 43 k 42 k 33 k Dividend per share (proposed/paid) 31 39 k 30 k 39 k 30 k The accounting policies on pages 79 to 84 and notes on pages 88 to 118 form an integral part of these financial statements. Profit and loss accounts
  • 89.
    Stanbic IBTC BankPLC Annual Report 2010 86 Annualreportand financialstatements Balance sheets As at 31 December 2010 Note Group 2010 Nmillion Group 2009 Nmillion Bank 2010 Nmillion Bank 2009 Nmillion Assets Cash and balances with central banks 9 10,048 7,772 10,048 7,768 Treasury bills 10 12,428 11,378 12,428 11,378 Due from other banks 11 88,659 76,954 87,439 75,913 Loans and advances to customers 12 163,952 110,508 164,203 110,967 Advances under finance lease 15 13,502 9,377 13,502 9,377 Investment securities 16 47,585 71,462 37,689 62,358 Investment in subsidiaries 17 - 1 1,924 1,925 Deferred tax assets 25 939 594 939 594 Other assets 18 16,176 25,566 13,683 24,453 Property and equipment 20 31,252 26,878 30,757 26,267 Total assets 384,541 340,490 372,612 331,000 Liabilities Customer deposits 21 186,466 169,200 187,595 170,411 Due to other banks 22 56,152 38,334 56,152 38,334 Other borrowings 23 18,272 12,647 18,272 12,647 Other liabilities 24 34,220 34,052 30,983 31,319 Current income tax 8 4,197 4,660 2,051 2,916 Deferred tax liabilities 25 108 100 - - Total liabilities 299,415 258,993 295,053 255,627 Equity Ordinary share capital 27 9,375 9,375 9,375 9,375 Share premium account 27 47,469 47,469 47,469 47,469 Revaluation reserve 28 93 - - - Retained earnings 28 12,335 10,608 7,430 6,416 Other reserves 28 14,478 13,028 13,285 12,113 Attributable to equity holders of the parent 83,750 80,480 77,559 75,373 Non-controlling interest 26 1,376 1,017 - - Total equity 85,126 81,497 77,559 75,373 Total equity and liabilities 384,541 340,490 372,612 331,000 Acceptances and guarantees 30 14,861 16,198 14,861 16,198 The accounting policies on pages 79 to 84 and notes on pages 88 to 118 form an integral part of these financial statements and were approved by the Board of Directors on 02 February 2011 and signed on its behalf by: Atedo N. A. Peterside OON Chairman Chris Newson Chief Executive Officer
  • 90.
    87 Statement of cashflows For the year ended 31 December 2010 Note Group 2010 Nmillion Group 2009 Nmillion Bank 2010 Nmillion Bank 2009 Nmillion Operating activities Cash used in operations 37 (22,771) (49,209) (26,553) (49,361) Interest received 3 34,359 40,920 33,808 39,952 Interest paid 4 (7,989) (15,813) (8,012) (15,870) VAT paid (59) (116) (59) (116) Tax paid 8 (4,734) (3,931) (3,437) (1,839) Net cash used in operating activities (1,194) (28,149) (4,253) (27,234) Financing activities Dividend paid to shareholders 28 (5,919) (7,647) (5,625) (7,500) Proceeds from long term loan 5,625 446 5,625 446 Net cash used in financing activities (294) (7,201) - (7,054) Investing activities Disposal of long term investment, net 24,262 10,283 24,875 8,749 Dividend received 6 103 169 1,886 975 Additional investment in subsidiaries - - - (106) Purchase of property, plant and equipment 20 (11,972) (14,941) (11,724) (14,452) Proceeds from sale of property and equipment 3,572 268 3,518 86 Net cash generated from/(used in) investing activities 15,965 (4,221) 18,555 (4,748) Increase/ (decrease) in cash and cash equivalents 14,477 (39,571) 14,302 (39,036) Analysis of changes in cash and cash equivalents At start of year 37 94,816 134,387 93,771 132,807 At end of year 37 109,293 94,816 108,073 93,771 Increase/ (decrease) in cash and cash equivalents 14,477 (39,571) 14,302 (39,036)
  • 91.
    Stanbic IBTC BankPLC Annual Report 2010 88 Annualreportand financialstatements Notes to the financial statements For the year ended 31 December 2010 1. General information Stanbic IBTC Bank Plc (“the bank) was incorporated as a private limited liability company on 2 February 1989, granted a merchant banking license on 3 February 1989, and commenced operations on 1 March 1989. Its merchant banking license was converted into universal banking license in January 2002, pursuant to the universal banking scheme of the Central Bank of Nigeria. The bank’s shares are quoted on the Nigerian Stock Exchange and held by both foreign and Nigerian individuals and corporate investors. The group comprises the bank and its subsidiaries undertaking (‘’the group’’). The group provides corporate and investment banking, stockbroking, asset management, personal and business banking services. The bank, which was incorporated as Investment Banking Trust Company Plc (“IBTC”), merged with Chartered Bank Plc and Regent Bank Plc on 19 December 2005, and changed its name to IBTC Chartered Bank Plc. On 24 September 2007, the bank merged with Stanbic Bank Nigeria Limited (“SBN”), a wholly owned subsidiary of Stanbic Africa Holdings Limited (‘’SAHL’’). SAHL, a subsidiary of Standard Bank Group (“SBG”) of South Africa, in accordance with the scheme of merger, acquired majority shareholding (50.77%) in the bank whose name was subsequently changed to Stanbic IBTC Bank Plc. The Bank has six subsidiaries as analysed below: Stanbic IBTC Ventures Limited (“SIVL”) 100% Stanbic IBTC Asset Management Limited (“SIAML”) 100% Stanbic IBTC Pension Managers Limited (“SIPML”) 70.59% Stanbic Nominees Nigeria Limited (“SNNL”) 100% Stanbic IBTC Stockbrokers Limited (“SISL”) 100% Stanbic IBTC Trustees Limited (“SITL”) 100% 2. Segment analysis The Directors confirm that the financial statements comply with the information reported to the bank’s Board of Directors, and top management for the purposes of evaluating units’ past performance as it relates to performance of the bank and its subsidiaries during the period. The group is structured on the basis of products and services, and the segments have been identified on this basis. The principal business units in the group are as follows: Business units: Personal Business Banking (PBB) Corporate Investment Banking (CIB) Wealth - Banking and other financial services to individual customers and small-to-medium-sized enterprises. - Mortgage lending – Provides residential accommodation loans to mainly personal market customers. - Instalment sale and finance leases – Provides instalments finance to personal market customers and finance of vehicles and equipment in the business market. - Card products – Provides credit and debit card facilities for individuals and businesses. - Transactional and lending products – Transactions in products associated with the various points of contact channels such as ATMs, internet, telephone banking and branches. This includes deposit taking activities, electronic banking, cheque accounts and other lending products coupled with debit card facilities to both personal and business market customers. - Corporate and investment banking services to larger corporates, financial institutions and international counterparties. - Global markets – includes foreign exchange, fixed income, interest rates and equity trading. - Transactional products and services – includes transactional banking and investor services. - Investment banking – includes project finance, structured finance, equity investments, advisory, corporate lending, primary markets acquisition and leverage finance and structured trade finance. - The wealth group is made up of the bank’s subsidiaries, whose activities involve investment management, portfolio management, unit trust/funds management, trusteeship, and pension fund management and administration.
  • 92.
    89 Segment analysis (continued) Thegroup’s operations by major operating segment during the period is contained below: 2010 Corporate Investment Banking Personal Business Banking Wealth Elimination Group Nmillion Nmillion Nmillion Nmillion Nmillion Total revenue: Derived from external customers 33,890 14,204 8,651 - 56,745 Derived from other business segments 560 121 20 (701) - Total revenue 34,450 14,325 8,671 (701) 56,745 Total cost: Interest expense 5,976 2,089 - (76) 7,989 Risk and other asset provisions (513) 1,133 - - 620 Other operating expenses 18,320 12,532 4,381 (625) 34,608 Total cost 23,783 15,754 4,381 (701) 43,217 Profit before tax 10,667 (1,429) 4,290 - 13,528 Tax (3,106) 429 (1,396) - (4,073) Profit after tax 7,561 (1,000) 2,894 - 9,455 Segment assets 254,788 122,016 10,771 (3,034) 384,541 Segment liabilities 200,399 96,498 3,899 (1,381) 299,415 Net asset 54,389 25,518 6,872 (1,653) 85,126 Notes to the financial statements For the year ended 31 December 2010
  • 93.
    Stanbic IBTC BankPLC Annual Report 2010 90 Annualreportand financialstatements 2009 Corporate Investment Banking Personal Business Banking Wealth Elimination Group Nmillion Nmillion Nmillion Nmillion Nmillion Total revenue: Derived from external customers 39,478 13,439 6,864 - 59,781 Derived from other business segments 574 832 55 (1,461) - Total revenue 40,052 14,271 6,919 (1,461) 59,781 Total cost: Interest expense 12,974 2,953 - (114) 15,813 Risk and other asset provisions 3,820 1,038 - - 4,858 Other operating expenses 17,477 9,154 3,484 (1,347) 28,768 Total cost 34,271 13,145 3,484 (1,461) 49,439 Profit before tax 5,781 1,126 3,435 - 10,342 Tax (810) (304) (1,090) - (2,204) Profit after tax 4,971 822 2,345 - 8,138 Segment assets 193,365 142,721 9,159 (4,755) 340,490 Segment liabilities 161,173 97,618 3,033 (2,831) 258,993 Net asset 32,192 45,103 6,126 (1,924) 81,497 All transactions between business units were conducted at arms length. Internal charges and transfer pricing adjustments are reflected in the performance of each segment. The bank operates in a single geographical location, thus no segmentation based on geographical location is presented in this financial statement.
  • 94.
    91 Group 2010 Nmillion Group 2009 Nmillion Bank 2010 Nmillion Bank 2009 Nmillion 3 Interest andsimilar income Placements 3,686 4,602 3,686 4,602 Treasury bills and investment securities 10,395 12,302 10,278 12,083 Loans and advances 18,306 22,862 17,872 22,113 Advances under finance leases 1,972 1,154 1,972 1,154 34,359 40,920 33,808 39,952 Interest income earned in Nigeria 34,183 40,074 33,632 39,110 Interest income earned outside Nigeria 176 846 176 842 34,359 40,920 33,808 39,952 4 Interest and similar expense Current accounts 590 387 667 558 Savings accounts 248 102 248 102 Time deposits 5,561 12,433 5,507 12,319 Inter-bank takings 1,036 1,787 1,036 1,787 Borrowed funds 554 1,104 554 1,104 7,989 15,813 8,012 15,870 Interest expense paid outside Nigeria amounted to Group N0.85 billion (2009: N1.10 billion) and Bank N0.85 billion (2009: N1.10 billion). 5 Fees and commission income Credit related fees 2,902 2,553 2,902 2,553 Commission on turnover 1,904 753 1,904 753 Commission on off-balance sheet transactions 170 184 170 184 Letters of credit commissions and fees 388 620 388 620 Facility management fee 12,267 8,234 3,552 1,914 Other fees and commissions 1,714 1,508 1,615 1,508 19,345 13,852 10,531 7,532 Notes to the financial statements For the year ended 31 December 2010
  • 95.
    Stanbic IBTC BankPLC Annual Report 2010 92 Annualreportand financialstatements Group 2010 Nmillion Group 2009 Nmillion Bank 2010 Nmillion Group 2009 Nmillion 6 Income from investments Dividend income 103 169 1,886 975 Profit on sale of securities - - - 28 Other investment income 23 74 23 - Rental income 6 31 8 31 132 274 1,917 1,034 7 Operating expenses Staff costs (note 35) 14,898 13,469 13,072 11,790 Depreciation (note 20) 4,034 2,567 3,718 2,267 Auditors’ remuneration 135 138 103 104 Directors’ emoluments (note 35) 720 788 720 753 (Profit)/ loss on disposal of property and equipment (8) 4 (2) 3 Other operating expenses 14,467 11,657 12,209 9,919 34,246 28,623 29,820 24,836 8 Taxation Charge Current tax 3,328 3,231 1,721 2,024 Education tax 165 207 60 142 Technology tax 71 103 71 71 Income tax charge 3,564 3,541 1,852 2,237 Under/(over) provision in prior years 720 (722) 720 (722) Deferred tax (note 25) (360) (830) (345) (830) Charge for the year 3,924 1,989 2,227 685 Withholding tax charge 149 215 149 198 4,073 2,204 2,376 883 Payable At start of year 4,660 5,821 2,916 3,240 Tax paid (4,734) (3,931) (3,437) (1,839) Income tax charge 3,564 3,541 1,852 2,237 Reclassification to deferred tax (13) (49) - - Under/(over) provision in prior years 720 (722) 720 (722) At end of year 4,197 4,660 2,051 2,916
  • 96.
    93 Group 2010 Nmillion Group 2009 Nmillion Bank 2010 Nmillion Bank 2009 Nmillion 9 Cash andbalances with Central Bank Cash 7,367 4,020 7,367 4,016 Operating account with Central Bank 839 2,464 839 2,464 Included in cash and cash equivalents 8,206 6,484 8,206 6,480 Mandatory reserve deposits with Central Bank 1,842 1,288 1,842 1,288 10,048 7,772 10,048 7,768 Mandatory reserve deposits are not available for use in the group’s day to day operations. 10 Treasury bills Treasury bills 12,428 11,378 12,428 11,378 Included in Treasury bills are bills amounting to N9.38 billion (2009: N4.31billion) held by third parties as collateral for various transactions. 11 Due from other banks Current balances with banks within Nigeria 1,293 1,113 73 72 Current balances with banks outside Nigeria 20,524 20,750 20,524 20,750 Placements with banks and discount houses 66,842 55,091 66,842 55,091 88,659 76,954 87,439 75,913 Notes to the financial statements For the year ended 31 December 2010 Balances with banks outside Nigeria include N5.3 billion (2009: N8.32 billion), which represents the Naira value of foreign currency bank balances held on behalf of customers in respect of letters of credit transactions. The corresponding liability is included in other liabilities. The amount is not available for the day to day operations of the bank. Included in placements with banks and discount houses are placements with banks within Nigeria of N32.4 billion (2009: N29.2 billion).
  • 97.
    Stanbic IBTC BankPLC Annual Report 2010 94 Annualreportand financialstatements Group 2010 Nmillion Group 2009 Nmillion Bank 2010 Nmillion Bank 2009 Nmillion 12 Loans and advances Overdrafts 26,920 28,531 26,920 28,531 Term loans 145,753 57,334 146,004 57,793 Others 71 37,726 71 37,726 172,744 123,591 172,995 124,050 Loan loss provision (note 13a) (7,322) (11,574) (7,322) (11,574) Interest in suspense (note 13b) (1,470) (1,509) (1,470) (1,509) 163,952 110,508 164,203 110,967 Analysis by performance: Performing 160,841 105,889 161,092 106,348 Non-performing: - substandard 420 859 420 859 - doubtful 8,796 11,289 8,796 11,289 - lost 2,687 5,554 2,687 5,554 172,744 123,591 172,995 124,050 Analysis by maturity: 0–30 days 44,176 42,217 44,176 42,218 1-3 months 42,907 45,594 42,907 45,594 3-6 months 11,874 3,762 12,125 3,762 6-12 months 7,756 10,843 7,756 10,843 Over 12 months 66,031 21,175 66,031 21,633 172,744 123,591 172,995 124,050 Analysis by security: Secured against real estate 24,779 13,945 24,779 13,945 Secured by shares of quoted companies 920 1,394 920 1,394 Otherwise secured 40,099 50,315 40,099 50,315 Unsecured 106,946 57,937 107,197 58,396 172,744 123,591 172,995 124,050
  • 98.
    95 b. Movement ininterest-in-suspense At start of year 1,509 1,328 1,509 1,328 Suspended during the year 1,954 1,741 1,954 1,741 Amounts written back (625) (459) (625) (459) Amounts written off (1,368) (1,101) (1,368) (1,101) At end of year 1,470 1,509 1,470 1,509 Summary: - General provision 1,643 1,068 1,643 1,068 - Specific provision 5,679 10,506 5,679 10,506 - Interest in suspense 1,470 1,509 1,470 1,509 8,792 13,083 8,792 13,083 Notes to the financial statements For the year ended 31 December 2010 Group 2010 Nmillion Group 2009 Nmillion Bank 2010 Nmillion Bank 2009 Nmillion 13 Loan loss provision and interest in suspense a. Movement in loan loss provision At start of year - non-performing 10,506 8,103 10,506 8,103 - performing 1,068 960 1,068 960 11,574 9,063 11,574 9,063 Additional provision - non-performing 2,958 6,123 2,958 6,123 - performing 575 108 575 108 Provision no longer required (3,616) (2,401) (3,616) (2,401) Reinstatement of provision previously written off - 31 - 31 Reclassification to finance lease (165) - (165) - Amounts written off (4,004) (1,350) (4,004) (1,350) (4,252) 2,511 (4,252) 2,511 At end of year - non-performing 5,679 10,506 5,679 10,506 - performing 1,643 1,068 1,643 1,068 7,322 11,574 7,322 11,574
  • 99.
    Stanbic IBTC BankPLC Annual Report 2010 96 Annualreportand financialstatements Group 2010 Nmillion Group 2009 Nmillion Bank 2010 Nmillion Bank 2009 Nmillion 14 Provision for losses The charge for the year is analysed as follows: Loans and advances - specific 2,958 6,123 2,958 6,123 Loans and advances - general 575 108 575 108 Advances under finance lease - specific 856 40 856 40 Advances under finance lease - general 48 48 48 48 Recoveries/provision no longer required: - Loans and advances (3,616) (2,401) (3,616) (2,401) - Advances under finance lease (305) - (305) - Recovery on previously written-off accounts (522) (269) (522) (269) Bad debt written off - 25 - 25 Provision for diminution of investments (206) 986 (206) 881 Provision for other known losses 832 198 832 303 620 4,858 620 4,858 Annualreportand financialstatements
  • 100.
    97 Group 2010 Nmillion Group 2009 Nmillion Bank 2010 Nmillion Bank 2009 Nmillion 15 Advances underfinance lease Gross investment 17,730 11,974 17,730 11,974 Less: Unearned income (3,332) (2,465) (3,332) (2,465) Net investment 14,398 9,509 14,398 9,509 Less: total provision (896) (132) (896) (132) 13,502 9,377 13,502 9,377 Analysis by performance: Performing 12,064 8,381 12,064 8,381 Non-performing: - substandard 1,079 905 1,079 905 - doubtful 1,194 212 1,194 212 - lost 61 11 61 11 14,398 9,509 14,398 9,509 Analysis by maturity: 0-30 days 1,150 145 1,150 145 1-3 months 975 776 975 776 3-6 months 442 13 442 13 6-12 months 408 982 408 982 Over 12 months 11,423 7,593 11,423 7,593 14,398 9,509 14,398 9,509 Movement in advances under finance lease provision At start of year - non-performing 40 - 40 - - performing 92 44 92 44 132 44 132 44 Additional provision: - non-performing 856 40 856 40 - performing 48 48 48 48 Reclassification from loans and advances 165 - 165 - Provision no longer required (305) - (305) - 764 88 764 88 At end of year - non-performing 756 40 756 40 - performing 140 92 140 92 896 132 896 132 Notes to the financial statements For the year ended 31 December 2010
  • 101.
    Stanbic IBTC BankPLC Annual Report 2010 98 Annualreportand financialstatements Group 2010 Nmillion Group 2009 Nmillion Bank 2010 Nmillion Bank 2009 Nmillion 16 Investment securities a. Investment securities comprise: Long term investments: Debt securities: - Listed 38,695 62,282 36,543 61,247 - Unlisted 27 27 27 27 Equity securities: - Listed 1,591 1,792 - - - Unlisted 1,794 2,175 1,794 1,965 42,107 66,276 38,364 63,239 Provisions for diminution in value (675) (986) (675) (881) 41,432 65,290 37,689 62,358 Short term investments: Debt securities: - Listed - - - - - Unlisted 6,153 6,172 - - 6,153 6,172 - - Total investment securities 47,585 71,462 37,689 62,358 b. Listed long term debt securities comprise: Federal Government of Nigeria (FGN) bonds (market value: Group - N29.97 billion; Bank - N27.76 billion) 27,457 46,545 26,009 46,010 Asset Management Corporation of Nigeria (AMCON) bonds 13 - 13 - Other bonds 11,225 15,737 10,521 15,237 38,695 62,282 36,543 61,247 Movement in long term investments At start of year 65,290 75,977 62,358 71,406 Additions 17,330 49,773 15,679 49,773 Redemption of long term bonds (19,145) (31,455) (19,145) (31,455) Provision for diminution in value 206 (986) 206 (881) Disposals (22,249) (28,019) (21,409) (26,485) At end of year 41,432 65,290 37,689 62,358 i. The short term investments represents unlisted commercial papers held by the group. ii. Included in unlisted long term investments are the bank’s investment under the Small and Medium Enterprises Equity Investment Scheme (SMEEIS). The Bank made the investments under the Small and Medium Enterprises Equity Investment Scheme (SMEEIS) per the Policy Guidelines for 2001 Fiscal Year (Monetary Policy Circular No. 35). A total of N1.64 billion (2009: N1.73 billion) have so far been invested under the scheme. Due to the effective percentage holding of the bank in these companies, some of them qualify as associates. However, they are not consolidated as the bank, based on regulatory requirement is not expected to exercise influence and control. iii. Included in listed debt securities is N26.01 billion (Market value: N27.76 billion) in various Federal Government of Nigeria bonds.
  • 102.
    99 Group 2010 Nmillion Group 2009 Nmillion Bank 2010 Nmillion Bank 2009 Nmillion 17 Investment insubsidiaries % Stanbic IBTC Ventures Limited (“SIVL”) 100 - - 500 500 Stanbic IBTC Asset Management Limited (“SIAML”) 100 - - 710 710 Stanbic IBTC Pension Managers Limited (“SIPML”) 70.59 - - 565 565 Stanbic IBTC Trustees Limited (“SITL”) 100 - - 40 40 Stanbic Nominees Nigeria Limited (“SNNL”) 100 - - - - Stanbic IBTC Stockbrokers Limited (“SISL”) 100 - - 109 109 RB Resources Limited 100 - 1 - 1 - 1 1,924 1,925 Group 2010 Nmillion Group 2009 Nmillion Bank 2010 Nmillion Bank 2009 Nmillion Investment in small medium scale industries Direct investment: Freezone Plant Fabrications Int’l Limited 120 120 120 120 Tinapa Business Resort Limited 500 500 500 500 Credit Reference Company Limited 50 50 50 50 Onward Paper Mills Limited 385 385 385 385 CR Services Limited 87 87 87 87 1,142 1,142 1,142 1,142 Indirect investment: Through African Capital Alliance Limited - (SME Partnership) 437 446 437 446 Through First SMI Investment Company Limited 61 137 61 137 498 583 498 583 Total 1,640 1,725 1,640 1,725 i. In 1996, the bank acquired majority shareholdings (99.99%) in two companies incorporated in Nigeria, namely Stanbic IBTC Ventures Limited (“SIVL”) and Stanbic IBTC Asset Management Limited (“SIAML”). As at December 2008, SIVL had a 70.59% equity holding in Stanbic IBTC Pension Managers Limited (“SIPML”) which is a licenced Pension Fund Administrator, up from an initial holding of 60%. In December 2008, the shareholding of SIVL in SIPML was acquired by the bank. ii. The financial statements of SIVL, SIAML, SIPML, SISL, SITL and SNNL have been consolidated in the group financial statements. Notes to the financial statements For the year ended 31 December 2010
  • 103.
    Stanbic IBTC BankPLC Annual Report 2010 100 Annualreportand financialstatements iii Stanbic Nominees Limited being the custody arm of the group, acts in a nominee capacity for clients’ transactions in securities and other investments. The securities are not assets of the company, and as such are not reflected in its balance sheet. All operating and administrative expenses of the company are borne by the bank, and no revenue accrues to the company for services rendered. Accordingly, no income statement and cashflow statement have been presented. iv The winding up of R B Resources Limited, a subsidiary it acquired as a result of its merger with the legacy Regent Bank PLC in December 2005 was concluded in April 2010. All the group companies have the same reporting period. Group 2010 Nmillion Group 2009 Nmillion Bank 2010 Nmillion Bank 2009 Nmillion 18 Other assets Interest and fee receivable 6,570 4,180 5,390 3,866 Prepayments 4,246 4,460 3,718 3,761 Accounts receivable 2,003 1,330 1,231 184 Open buy back instruments - 12,300 - 12,300 Other receivables 5,049 4,897 5,036 5,943 Provision for doubtful receivables (1,692) (1,601) (1,692) (1,601) 16,176 25,566 13,683 24,453 Movement in provision for doubtful receivables: At start of year (1,601) (1,845) (1,601) (1,845) - Additional provision (892) (589) (892) (589) - Write-back to income statement 580 391 580 286 - Amount written off 221 442 221 547 At end of year (1,692) (1,601) (1,692) (1,601) Bond holdings sold under repurchase agreement are classified as other asset balances in accordance with Central Bank of Nigeria circular BSD/8/2003.
  • 104.
    101 31 December 2010 Bank Nmillion StanbicIBTC Asset Mgt Ltd Nmillion Stanbic IBTC Pension Mgt Ltd Nmillion Operating income 40,627 2,102 6,507 Operating expenses (29,820) (1,080) (3,234) Risk and other asset provision (620) - - Profit before tax 10,187 1,022 3,273 Tax (2,376) (347) (1,050) Profit after tax 7,811 675 2,223 31 December 2009 6,258 772 1,665 Balance sheet Assets: Cash and short term funds 10,048 - - Treasury bills 12,428 - - Due from other banks 87,439 123 898 Loans and advances to customers 164,203 - - Advances under finance lease 13,502 - - Investment securities 37,689 2,609 4,846 Investment in subsidiaries 1,924 - - Deferred tax assets 939 - - Other assets 13,683 763 1,054 Fixed assets 30,757 104 372 31 December 2010 372,612 3,599 7,170 31 December 2009 331,000 3,639 5,270 Notes to the financial statements For the year ended 31 December 2010 19. Condensed financial statement for the group Profit and loss account
  • 105.
    Stanbic IBTC BankPLC Annual Report 2010 102 Annualreportand financialstatements Stanbic IBTC Ventures Ltd Nmillion Stanbic IBTC Trustees Ltd Nmillion Stanbic Nominees Ltd* Nmillion Stanbic IBTC Stockbroking Ltd Nmillion Consolidations/ eliminations Nmillion Group total Nmillion 51 - - 1,590 (2,483) 48,394 (33) - - (701) 622 (34,246) - - - - - (620) 18 - - 889 (1,861) 13,528 (8) - - (292) - (4,073) 10 - - 597 (1,861) 9,455 37 - - 319 (913) 8,138 - - - - - 10,048 - - - - - 12,428 315 40 - 973 (1,129) 88,659 - - - - (251) 163,952 - - - - - 13,502 1,591 - - 850 47,585 - - - - (1,924) - - - - - - 939 - - - 405 271 16,176 - - - 19 - 31,252 1,906 40 - 2,247 (3,033) 384,541 2,800 40 - 2,490 (4,749) 340,490
  • 106.
    103 31 December 2010 Bank Nmillion StanbicIBTC Asset Mgt Ltd Nmillion Stanbic IBTC Pension Mgt Ltd Nmillion Liabilities: Customer deposits 187,595 - - Due to other banks 56,152 - - Other borrowings 18,272 - Other liabilities 30,983 713 1,364 Current income tax 2,051 684 1,073 Deferred tax liability - 12 54 Equity and reserves 77,559 2,190 4,679 31 December 2010 372,612 3,599 7,170 31 December 2009 331,000 3,639 5,270 Cash flow Net cash from operating activities (4,253) 408 2,988 Net cash from financing activities - (660) (1,000) Net cash from investing activities 18,555 (246) (939) Increase/(decrease) in cash and cash equivalents 14,302 (498) 1,049 Notes to the financial statements For the year ended 31 December 2010 19. Condensed financial statement for the group (continued) * Included in the disclosure for Stanbic Nominees is share capital of N100,000. This balance does not reflect above as the financial statement is presented in Nmillion thus shown as zero (-).
  • 107.
    Stanbic IBTC BankPLC Annual Report 2010 104 Annualreportand financialstatements Stanbic IBTC Ventures Ltd Nmillion Stanbic IBTC Trustees Ltd Nmillion Stanbic Nominees Ltd* Nmillion Stanbic IBTC Stockbroking Ltd Nmillion Consolidations/ eliminations Nmillion Group total Nmillion - - - - (1,129) 186,466 251 - - - (251) 56,152 - - - - - 18,272 14 - 1,146 - 34,220 83 - 306 - 4,197 40 - - 2 - 108 1,518 40 - 793 (1,653) 85,126 1,906 40 - 2,247 (3,033) 384,541 2,800 40 - 2,490 (4,749) 340,490 (568) - - 712 (481) (1,194) (260) - - (700) 2,326 (294) 335 - - 16 (1,756) 15,965 (493) - - 28 89 14,477
  • 108.
    105 20 Property andequipment - group 2010 At start of year Nmillion Additions Nmillion Disposals/ write-offs Nmillion Reclassifications Nmillion At end of year Nmillion Cost Leasehold land and buildings 11,182 438 (1) 4,272 15,891 Motor vehicles 2,872 692 (258) 58 3,364 Furniture, fittings equipment 2,979 746 (182) 2,941 6,484 Computer hardware 3,516 190 (83) 1,465 5,088 Computer software 532 - - - 532 Work in progress 11,969 9,906 (3,457) (8,736) 9,682 33,050 11,972 (3,981) - 41,041 Work in progress represents construction costs in respect of new branches and offices. On completion of construction, the related amounts are transferred to other categories of property and equipment. At start of year Nmillion Charge for the year Nmillion Disposals/ write-offs Nmillion Reclassifications Nmillion At end of year Nmillion Accumulated depreciation Leasehold land and buildings 1,438 957 (1) - 2,394 Motor vehicles 1,328 757 (183) - 1,902 Furniture, fittings equipment 1,686 895 (165) - 2,416 Computer hardware 1,459 1,322 (68) - 2,713 Computer software 261 103 - - 364 6,172 4,034 (417) - 9,789 At start of year Nmillion At end of year Nmillion Net book value Leasehold land and buildings 9,744 13,497 Motor vehicles 1,544 1,462 Furniture, fittings equipment 1,292 4,068 Computer hardware 2,058 2,375 Computer software 271 168 Work in progress 11,969 9,682 26,878 31,252 Notes to the financial statements For the year ended 31 December 2010
  • 109.
    Stanbic IBTC BankPLC Annual Report 2010 106 Annualreportand financialstatements 20 Property and equipment - bank 2010 At start of year Nmillion Additions Nmillion Disposals/ write-offs Nmillion Reclassifications Nmillion At end of year Nmillion Cost Leasehold land and buildings 11,181 438 (1) 4,272 15,890 Motor vehicles 2,583 526 (173) 58 2,994 Furniture, fittings equipment 2,677 710 (158) 2,941 6,170 Computer hardware 3,079 144 (27) 1,465 4,661 Computer software 329 - - - 329 Work in progress 11,969 9,906 (3,457) (8,736) 9,682 31,818 11,724 (3,816) - 39,726 At start of year Nmillion Charge for the year Nmillion Disposals/ write-offs Nmillion Reclassifications Nmillion At end of year Nmillion Accumulated depreciation Leasehold land and buildings 1,438 957 (1) - 2,394 Motor vehicles 1,193 664 (120) - 1,737 Furniture, fittings equipment 1,562 822 (154) - 2,230 Computer hardware 1,179 1,211 (25) - 2,365 Computer software 179 64 - - 243 5,551 3,718 (300) - 8,969 At start of year Nmillion At end of year Nmillion Net book value Leasehold land and buildings 9,743 13,496 Motor vehicles 1,390 1,257 Furniture, fittings equipment 1,115 3,940 Computer hardware 1,900 2,296 Computer software 150 86 Work in progress 11,969 9,682 26,267 30,757 Work in progress represents construction costs in respect of new branches and offices. On completion of construction, the related amounts are transferred to other categories of property and equipment.
  • 110.
    107 Group 2010 Nmillion Group 2009 Nmillion Bank 2010 Nmillion Bank 2009 Nmillion 21 Customer deposits Currentdeposits 77,211 67,646 78,103 68,611 Savings deposits 9,485 5,880 9,485 5,880 Term deposits 84,030 80,558 84,030 80,558 Domiciliary deposits 15,740 15,115 15,977 15,361 Electronic purse - 1 - 1 186,466 169,200 187,595 170,411 Analysis by maturity 0 - 30 days 172,702 134,287 173,831 135,498 1-3 months 8,496 28,404 8,496 28,404 3-6 months 2,290 5,706 2,290 5,706 6-12 months 2,900 652 2,900 652 Over 12 months 78 151 78 151 186,466 169,200 187,595 170,411 22 Due to other banks Current balances with banks 293 953 293 953 Inter-bank taking 55,859 37,381 55,859 37,381 56,152 38,334 56,152 38,334 23 Other borrowings FMO - Netherland Development Finance Company 10,117 11,089 10,117 11,089 International Finance Corporation (IFC) 802 1,184 802 1,184 European Investment Bank 3,443 374 3,443 374 Bank of Industry 2,560 - 2,560 - CBN Commercial Agricultural Credit Scheme (CACS) 1,350 - 1,350 - 18,272 12,647 18,272 12,647 i. The bank’s dollar denominated on-lending credit obtained from the IFC expires on or after 15 December 2012 and has a rate of 3% above 3 month’s LIBOR. ii. The dollar denominated facility from European Investment Bank expires on or after 15 March 2012 and has a rate of 2.5% above 3 month’s LIBOR. iii. The on-lending dollar denominated loan obtained from Netherland Development Finance Company (FMO) expires on or after 15 January 2015, and has a rate of 2.0% above 6 month’s LIBOR. iv. The bank obtained a Central Bank of Nigeria (CBN) initiated on-lending naira facilty from Bank of Industry in September 2010 at a fixed rate of 1% p.a. on a tenor based on agreement with individual customer and beneficiary. v. The bank during the year received free interest bearing loan from the Central Bank of Nigeria (CBN) for purpose of on - lending under the Commercial Agricultural Credit Scheme (CACS). The disbursement of these funds are represented in customers loans and advances. Notes to the financial statements For the year ended 31 December 2010 Included in customer deposits is N255 million (2009:N155 million) representing cash collateral held against advances.
  • 111.
    Stanbic IBTC BankPLC Annual Report 2010 108 Annualreportand financialstatements 24 Other liabilities Customers’ deposit for letters of credit 5,528 8,804 5,528 8,804 Interest payable 1,838 3,372 1,822 3,372 Unearned income 291 1,034 257 967 Accrued expenses 5,611 2,845 4,889 2,556 Account payables 16,357 13,934 14,035 11,739 Collections/remittances payable 3,999 1,905 3,856 1,723 Proceeds from public offers 10 2,016 10 2,016 Provision on losses for off balance sheet 586 142 586 142 34,220 34,052 30,983 31,319 Group 2010 Nmillion Group 2009 Nmillion Bank 2010 Nmillion Bank 2009 Nmillion Analysis by maturity 0 - 30 days 1,126 - 1,126 - 1-3 months 220 42 220 42 3-6 months 590 239 590 239 6-12 months 2,142 1,389 2,142 1,389 Over 12 months 14,194 10,977 14,194 10,977 18,272 12,647 18,272 12,647 Provision on losses for off balance sheet represents provisions recommended on some pending legal proceedings disclosed in note 30. Group 2010 Nmillion Group 2009 Nmillion Bank 2010 Nmillion Bank 2009 Nmillion 25 Deferred taxes Deferred tax liabilities 108 100 - - Deferred tax assets (939) (594) (939) (594) (831) (494) (939) (594) Movement in deferred taxes: At start of year (494) 378 (594) 236 (Write-back)/charge for the year (360) (830) (345) (830) Reclassification from current income tax (13) 49 - - Prior year adjustment on revaluation of securities (4) (3) - - (Write-back)/charge on revaluation of securities 40 (88) - - At end of year (831) (494) (939) (594)
  • 112.
    109 27 Share capital Authorised 20billion ordinary shares of 50 kobo each (2009: 20 billion ordinary shares of 50 kobo each) 10,000 10,000 10,000 10,000 Group 2010 Nmillion Group 2009 Nmillion Bank 2010 Nmillion Bank 2009 Nmillion 26 Non controlling interest At start of year 1,017 711 - - Transfer from profit and loss 653 490 - - Dividend paid (294) (147) - - Increase in shareholding in subsidiary company - (37) - - At end of year 1,376 1,017 - - ii. Share premium Group Nmillion Bank Nmillion At start of year 47,469 47,469 At end of year 47,469 47,469 Notes to the financial statements For the year ended 31 December 2010 Issued and fully paid i. Ordinary shares Number million Group Nmillion Bank Nmillion At start of year 18,750 9,375 9,375 At end of year 18,750 9,375 9,375
  • 113.
    Stanbic IBTC BankPLC Annual Report 2010 110 Annualreportand financialstatements 28 Reserves Statutory reserve Nmillion SMIEIS reserve Nmillion Revaluation reserve Nmillion Capital reserve Nmillion Retained earnings Nmillion Total Nmillion Group At prior period start - 1 January 2009 10,419 1,039 272 129 11,961 23,820 Increase in subsidiary shareholding - - - 294 - 294 On revaluation of securities - - (272) - - (272) Dividend paid - - - - (7,500) (7,500) Bonus issues (354) (354) Transfer from profit and loss account 1,147 - - - 6,501 7,648 At 31 December 2009/ 1 January 2010 11,566 1,039 - 423 10,608 23,636 On revaluation of securities - - 93 - - 93 Dividend paid - - - - (5,625) (5,625) Transfer from profit and loss account 1,450 - - - 7,352 8,802 At period end 31 December 2010 13,016 1,039 93 423 12,335 26,906 Bank At prior period start - 1 January 2009 10,135 1,039 - - 8,597 19,771 Dividend paid - - - - (7,500) (7,500) Transfer from profit and loss account 939 - - - 5,319 6,258 At 31 December 2009/ 1 January 2010 11,074 1,039 - - 6,416 18,529 Dividend paid - - - - (5,625) (5,625) Transfer from profit and loss account 1,172 - - - 6,639 7,811 At period end 31 December 2010 12,246 1,039 - - 7,430 20,715 29 Retirement benefit obligations The group operates a defined contribution pension scheme in line with the provisions of the Pension Reform Act, with contributions based on the sum of employees’ basic salary, housing and transport allowance in the ratio 7.5% by the employee and 7.5% by the employer. The amount contributed by the group, and remitted to the Pension Fund Administrators, during the period was N631 million (2009: N549.97 million). The group’s contributions to this scheme is charged to the profit and loss account in the period to which they relate. Contributions to the scheme are managed by SIPML, and other appointed pension managers on behalf of the beneficiary staff in line with the provisions of the Pension Reform Act. Consequently, the group has no legal or constructive obligations to pay further contributions if the funds do not hold sufficient assets to meet the related obligations to employees.
  • 114.
    111 30 Contingent liabilitiesand commitments a) Legal proceedings There were 136 legal proceedings outstanding at 31 December 2010 with claims amounting to N30.3 billion (2009: N31 billion). The claims are considered without merit, and the bank is defending them vigorously. It is not expected that the ultimate resolution of any of the proceedings will have a significantly adverse effect on the financial position of the bank. On 6 December 2010 a judgement of N2.5 billion was delivered in favour of one of the claims noted above. The bank has lodged an appeal against the judgement, and intends to vigorously defend its position in the appeal court. Furthermore legal advice was obtained from independent Senior Advocates of Nigeria (SANs) to assess the merits of the appeal. Their respective advice indicates that it is unlikely that any significant loss will arise in the ultimate resolution of this matter. Based on professional advice received and management’s opinion, adequate provisions have been made on the various cases. These provisions are included in loan loss provisions (for credit - related cases) and ‘other liabilities’ for other cases. b) Capital commitments As at the balance sheet date, the group had capital commitments amounting to N36.08 million (2009: N4.14 biIllion) in respect of various construction work being undertaken on branch expension, and revamping project. 2010 Nmillion 2009 Nmillion a) Aggregate or estimated amount of contracts for capital expenditure so far as not provided for; and 36 3,364 b) Aggregate or estimated amount of capital expenditure authorised by the directors which has not been contracted. - 777 36 4,141 c) Off balance sheet engagements In the normal course of business, the group is party to financial instruments with off-balance sheet risk. The instruments are used to meet the credit and other financial requirements of customers. The contractual amounts of the off-balance sheet financial instruments are: Group 2010 Nmillion Group 2009 Nmillion Bank 2010 Nmillion Bank 2009 Nmillion Performance bonds and guarantees 5,280 3,371 5,280 3,371 Letters of credit 9,327 12,376 9,327 12,376 Forward and swap contracts 254 451 254 451 14,861 16,198 14,861 16,198 Notes to the financial statements For the year ended 31 December 2010
  • 115.
    Stanbic IBTC BankPLC Annual Report 2010 112 Annualreportand financialstatements Dividends are not accounted for until they have been ratified at the Annual General Meeting (AGM). At the next AGM, a dividend in respect of 2010 of 39 kobo per share (2009: 30 kobo) amounting to a total of N7.3 billion (2009:N5.6 billion) will be proposed. These financial statements do not reflect this resolution, which will be accounted as an appropriation of retained earnings in the year ending 31 December 2011. 32 Earnings per share Earnings per share (actual) is calculated by dividing the profit after tax by the number of shares in issue during the period, while earnings per share (basic) is calculated by using the weighted average number of shares in issue during the period as the denominator. Earnings per share (adjusted) is calculated by using the number of shares outstanding as at the balance sheet date as a common denominator for all years, while earnings per share (diluted) is calculated by adjusting the number of shares in issue during the period with the effects of all potential ordinary shares. Group 2010 Nmillion Group 2009 Nmillion Bank 2010 Nmillion Bank 2009 Nmillion Profit after tax 9,455 8,138 7,811 6,258 Number of shares (in millions) 18,750 18,750 18,750 18,750 Weighted average number of shares (in millions) 18,750 18,750 18,750 18,750 Earnings per share (EPS) - basic 50 k 43 k 42 k 33 k There was no change in the number of shares in issue during the period. Consequently, the weighted average number of shares is the same as absolute number of shares in issue, and outstanding as at the year ended 31 December 2010. 33 Compliance with banking regulation The bank was penalised by the Central Bank of Nigeria (CBN) during the year for the following infraction: - Infraction of Section 60 (1) of BOFIA, 1991 - write off of insider related loan RB Resources (fine: N2 million) - Penalty imposed arising from the Nigerian Financial Intelligence Unit (NFIU) examination of the bank conducted in April 2009 (fine: N4 million) 34 Comparatives Where necessary, comparative figures have been restated to conform to changes in presentation in the current year. Group 2010 Nmillion Group 2009 Nmillion Bank 2010 Nmillion Bank 2009 Nmillion Proposed dividend 39 kobo (2009: 30 kobo) per share 7,313 5,625 7,313 5,625 31 Dividend
  • 116.
    113 Group 2010 Number Group 2009 Number Bank 2010 Number Bank 2009 Number Executive directors 55 5 5 Management 411 361 377 330 Non-management 1,832 1,643 1,566 1,387 2,248 2,009 1,948 1,722 Group 2010 Nmillion Group 2009 Nmillion Bank 2010 Nmillion Bank 2009 Nmillion Salaries and wages 14,271 12,919 12,533 11,311 Retirement benefit - Pension (note 29) 627 550 539 479 14,898 13,469 13,072 11,790 Compensation for the above staff (excluding executive directors): 35 Employees and directors a) Employees The average number of persons employed by the group during the year by category: The number of employees of the group, other than directors, who received emoluments in the following ranges (excluding pension contributions), were: Number Number Number Number Below N1,000,001 - 30 - 20 N1,000,001 - N2,000,000 106 97 56 50 N2,000,001 - N3,000,000 841 833 819 788 N3,000,001 - N4,000,000 408 319 304 244 N4,000,001 - N5,000,000 253 212 205 161 N5,000,001 - N6,000,000 100 55 79 41 N6,000,001 and above 540 463 485 418 2,248 2,009 1,948 1,722 Notes to the financial statements For the year ended 31 December 2010
  • 117.
    Stanbic IBTC BankPLC Annual Report 2010 114 Annualreportand financialstatements Annualreportand financialstatements Group 2010 Nmillion Group 2009 Nmillion Bank 2010 Nmillion Bank 2009 Nmillion Fees and sitting allowances 151 142 151 142 Executive compensation (salary including all benefits) 568 644 568 609 719 786 719 751 Directors’ other expenses 1 2 1 2 720 788 720 753 Fees and other emoluments disclosed above include amounts paid to: (i) the chairman 36 33 36 33 (ii) the highest paid director 177 211 177 211 b) Directors The remuneration to the directors is as follows:
  • 118.
    115 (a) (i) Scheduleof insider related credits Name of company/individual Relationship Name of related interest Facility type Date granted Expiry date Flour Mills of Nigeria Plc Chairman Atedo Peterside Overdraft 30-Nov-10 12-Jan-11 Presco Plc Chairman Atedo Peterside Term loan 1-Oct-08 31-Dec-11 International Glass Industries Limited. Director B.I. Mahtani Finance lease 6-Oct-08 20-Oct-12 PPC Limited Director Sam U Unuigbe/ Ahmed I Dasuki Finance lease 23-Jul-09 31-Jul-13 MTN Nigeria Communications Ltd Director Ahmed I Dasuki Term loan 30-Dec-10 30-Mar-11 Acorn Petroleum Plc Director Christopher Kolade Finance lease 2-Nov-09 30-Oct-12 Acorn Petroleum Plc Director Christopher Kolade Term loan 13-Jul-10 1-Mar-11 Various staff Staff Various staff Staff loan Various Various Total - Insider related credits 36 Related party transactions The bank is controlled by Stanbic Africa Holding Limited which is incorporated in the United Kingdom. The ultimate parent of the group is Standard Bank Group Limited incorporated in South Africa. The bank manages the operations of SIAML, SISL and SIPML under the terms of a management and advisory services agreement for a fee. Included in loans and advances is an amount of N18.73 billion (2009 : N6.95 billion) representing credit facilities to staff, shareholders and companies in which some directors have interests. These facilities were granted at rates and terms comparable to other facilities in the bank’s portfolio. There were no non-performing insider related credit as at balance sheet date. The balances in the accounts as at 31 December 2010 are as stated below: Notes to the financial statements For the year ended 31 December 2010 Name of company Relationship Name of related interest Facility type Outstanding N’000 Status Flour Mills Nig Plc Chairman Atedo Peterside Unconfirmed LC 1,071,309 Performing Nigeria Breweries Chairman Atedo Peterside Unconfirmed LC 134,190 Performing Total 1,205,499 (ii) Off balance sheet engagements
  • 119.
    Stanbic IBTC BankPLC Annual Report 2010 116 Annualreportand financialstatements Approved credit limit N000 Outstanding N000 Status Interest rate Perfected security Deposit outstanding N000 Type of deposit Security nature Security value N000 4,500,000 198,692 Performing 20.00% Negative Pledge - 22,382 Current a/c 548,239 171,540 Performing 5.29% - 5,749 Time/current account 16,296 5,721 Performing 18.50% Asset financed 5,721 - 58,928 25,970 Performing 19.00% Asset financed 25,970 4,395 Time/current account 12,365,040 12,365,040 Performing 11.91% Negative pledge - 7,841,368 Time/current account 11,742 5,550 Performing 16.50% Asset financed 5,550 1,185 Current a/c 1,583,134 258,280 Performing 9.00% Cross guarantee of sister companies 2,412,432 - 6,944,303 5,696,466 Performing 10% to 15.5% - - 902,585 Time/current account 26,027,682 18,727,259 8,777,664 (b) Other related party items Significant transaction balances involving the bank and related parties are as detailed below: Related party items Standard Bank Group SIAML SIVL SIPML SISL Relationship to the bank Parent N000 Subsidiary N000 Subsidiary N000 Subsidiary N000 Subsidiary N000 Deposit balances 21,978,468 117,756 314,122 328,067 324,337 Account receivables - 327,843 6,783 138,134 24,567 Loans (due to SIBTC) - - 251,100 - - Account payables - - - - 337
  • 120.
    117 Notes to thefinancial statements For the year ended 31 December 2010 37 Cash and cash equivalents a. For the purposes of the cash flow statement, cash and cash equivalents include cash and non restricted balances with the central bank of Nigeria, treasury bills and other eligible bills, operating account balances with other banks, amounts due from other banks and short term government securities. Group 2010 Nmillion Group 2009 Nmillion Bank 2010 Nmillion Bank 2009 Nmillion Cash and balances with central banks (less restricted balances) 8,206 6,484 8,206 6,480 Treasury bills and eligible bills 12,428 11,378 12,428 11,378 Due from other banks 88,659 76,954 87,439 75,913 109,293 94,816 108,073 93,771 b. Cash generated from operations Reconciliation of profit before tax to cash generated from operations: Operating profit 13,528 10,342 10,187 7,141 Provision for loan loss 3,533 6,231 3,533 6,231 Amounts written back on previously provisioned accounts (3,921) (2,670) (3,921) (2,670) Provision for leases 904 88 904 88 Provision for forward cover gain 18 3,696 17 3,696 Provision for off balance sheet 444 110 444 110 Interest in suspense (note 13b) 1,329 1,282 1,329 1,282 Interest income written off (note 13b) (1,368) (1,101) (1,368) (1,101) Loans written off (note 13a) (4,004) (1,350) (4,004) (1,350) Witholding tax charge (90) (99) (90) (82) Provision for other assets 312 198 312 303 (Write back of)/ provision for diminution in value of investment (311) 986 (206) 881 (Profit)/ loss on disposal of fixed asset (note 7) (8) 4 (2) 3 Gain on disposal of investment - (456) - (30) Depreciation (note 7) 4,034 2,567 3,718 2,267 Interest received (note 3) (34,359) (40,920) (33,808) (39,952) Interest paid (note 4) 7,989 15,813 8,012 15,870 Dividend received (note 6) (103) (169) (1,886) (975) Operating profit before changes in operating assets and liabilities (12,073) (5,448) (16,829) (8,288)
  • 121.
    Stanbic IBTC BankPLC Annual Report 2010 118 Annualreportand financialstatements Group 2010 Nmillion Group 2009 Nmillion Bank 2010 Nmillion Bank 2009 Nmillion (Increase)/decrease in operating assets: Cash reserve balances (554) 606 (554) 606 Loans to customers (49,153) (14,802) (48,945) (14,649) Advances under finance leases (4,889) (5,204) (4,889) (5,204) Short term investments 19 (4,724) - 440 Interest receivable and prepayment (2,176) 2,172 (1,481) 1,782 Accounts receivable (673) 423 (1,047) 861 Other receivables, net of sundry receivables in acquiree 11,912 (13,107) 12,970 (12,306) (45,514) (34,636) (43,946) (28,470) Increase/(decrease) in operating liabilities Customer deposits 17,266 73,938 17,184 71,497 Due to other banks 17,818 (43,868) 17,818 (43,868) Customers’ deposit for foreign currency denominated obligations (3,276) (5,191) (3,276) (5,191) Interest payable and unearned income (2,277) (1,946) (2,260) (1,956) Accounts payable 7,291 (3,295) 6,762 (4,322) Public offer proceeds, and other payables (2,006) (28,763) (2,006) (28,763) 34,816 (9,125) 34,222 (12,603) Cash used in operations (22,771) (49,209) (26,553) (49,361)
  • 122.
    119 Financial risk analysis Forthe year ended 31 December 2010 Enterprise risk review Fundamental to the business activities and future growth prospects of Stanbic IBTC is a strong risk management practice, which is the bedrock of the group’s avowed commitment to the objectives of enhancing shareholders’ value at all times by developing and growing the business in strict adherence to the risk appetite set by the board as well as balancing this objective with the wider interest of other stakeholders including regulators and depositors. The group seeks to achieve an appropriate balance between risk and reward in its businesses, and continues to build and enhance the risk management capabilities that will assist in achieving its dynamic growth plans in a controlled environment. Risk management is at the core of the operating and management structures of the group. The group seeks to limit adverse variations in earnings and equity by managing the balance sheet and capital within specified levels of risk appetite. Managing and controlling risks, and in particular avoiding undue concentrations of exposure and limiting potential losses from stress events are essential elements of the group’s risk management and control framework, which ultimately leads to the protection of the group’s reputation and brand. Within the group, responsibility and accountability for risk management resides at all levels, from the executive down through the organisation to each business manager and independent risk officer. Internal audit provides an independent assessment of the adequacy and effectiveness of controls and procedures and reports independently to the statutory audit committee, whilst external audit reports independently on the group annual financial statements to shareholders and regulators. Subsidiary entities within the group are guided by the group enterprise risk management (ERM) framework in establishing their respective risk management frameworks. The major subsidiaries of the bank; Stanbic IBTC Asset Management Limited, Stanbic IBTC Stockbroking Limited and Stanbic IBTC Pension Managers Limited are committed to aligning their respective risk management practices to that of the group and adopting acceptable risk tolerance parameters in line with the group. Key aspects of risk management are the risk governance and the organisational structures established by the group to manage risk according to a set of risk governance standards, which are implemented across the group and are supported by appropriate risk policies and procedures. Risks are controlled at the level of individual exposure, at a portfolio level, and in aggregate across all business and risk types. The bank and its subsidiaries have an independent control process which provides an objective view of risk taking activities where required. All exposures are independently monitored and reviewed. Key achievements in 2010 The past year has been another very challenging one for the world economy and financial markets even as a few of the emerging economies have started to show some recovery in macro-economic indices. Nevertheless, it has also been a year of diversifying and deepening the group’s experience in many dimensions as high impact events, hitherto considered highly improbable including new regulatory guidelines unfolded at random, creating a platform for the group to distinguish itself in the market place by the quality and robustness of its risk management practices and tools. Some of the challenges included raising the practical knowledge of the risk governance standards, policies and procedures within the group, deploying and embedding risk management tools at lower management levels, creating the appropriate risk culture and sensitivity, strengthening the control functions, adopting proactive approaches to risk identification and fortifying the risk management team with strategic and tactical upskilling. At the same time, the group had to handle expansion in branch and point of sale network into many new regions and states, launching of new retail products, deployment of new distributions channels, maintaining low credit loss ratio in the face of increasing risk assets, unstable inter-bank money market coupled with almost a total collapse of government yield curve, inconsistent access to repo facilities as well as high regulatory intervention and rapid policy changes. The group’s current control framework and procedures displayed the required resilience and dynamism in the face of rising uncertainty and vulnerability while oversight functions including monitoring and reporting were reinforced through the full implementation of risk assurance functions and an escalation matrix. • The group continued its comprehensive review of its risk management standards, policies and procedures in order to achieve a better coverage of emerging risk issues and enhance the effectiveness and efficiency of its risk management practices and tools; • The group established and implemented standards and policies for information risk management, which define the principle and practices that are necessary to ensure the protection of information resources; • In order to further strengthen its liquidity management framework and promote short and long-term resilience
  • 123.
    Stanbic IBTC BankPLC Annual Report 2010 120 Annualreportand financialstatements to potential liquidity disruption, the group implemented two minimum standards for liquidity management as proposed under Basel III, which are the 30-day liquidity coverage ratio (LCR) and net stable funding ratio (NSFR); • As as way of broadening its breadth of risk expertise and plan for future demand, the group established an internship scheme through which undergraduates with requisite quantitative aptitude are identified and exposed early to basic risk management tools; • The group conducted a business continuity management (BCM) test using a desktop walkthrough approach in order to assess the group’s ability to recover and restore total business operations in the event of unexpected operational disruptions or disasters. The exercise, which was conducted mainly by alternate members of the crisis management team also provided opportunities to test their response ability in the absence of key crisis management team members;thegroupalsoconductedfourtestsontherecovery site infrastructure to determine its suitability for meeting its recovery time objectives; • Risk assurance (RA) function conducted independent assurance regarding risks, processes and controls in 63 units, regarded as low-medium risk entities; • As part of its commitment to global best practice and ethical conduct, the group developed and implemented a surveillance procedure for identification and resolution of conflict of interest situations by accessing the global conflict control room (GCCR) and obtaining conflict clearance on CIB pipeline deals; • In order to enable the business to achieve its set objective by providing adequate risk management support at a more granular level, the group established dedicated risk teams for the 3 key business segments; • Enhancement of credit capabilities with the establishment of a collection call centre and scalable origination and account management modules; • Establishment of an in-house verification unit and the use of two commercial credit bureaus to curtail potential losses related to defective loan applications. Focus areas for 2011 The reaction of governments and regulators to the recent turmoil in the world financial markets, which has led to the current wave of very intensive financial market regulations as well as the introduction of more rigorous regulations on banks both globally and locally is expected to position risk management as part of strategic focus of any financial institutions aiming to play a leading role in the global economic recovery. Additionally, a significant change in Nigeria’s banking landscape through the revocation of universal banking regime and its replacement with specialist banking regime has made it imperative for risk management practices to become more sophisticated, dynamic, and well resourced than ever before with fit-for-purpose systems capabilities. To this extent, we will focus on: • Continued upholding of liquidity resilience over short and long-term time horizons by maintaining a conservative structural liquidity mismatch profile, supported by adequate levels of marketable assets and net stable funding; • Entrenching the principles and methodologies of scenario and stress testing in market and liquidity risks by adding seven new stress test scenarios including the Russian Crisis of 1988; • Continued embedding of risk culture and enhancement of control environment at all management levels of the group through ownership of risk management practices and tools by business units and designation of dedicated risk officers within business units; • Strengthening the group’s ability to preserve its brand value from any adverse perception through the development of a reputation risk management framework, standard and procedure; • Continued enhancement of readiness level of people, process and system for the implementation of a new core banking application as well as addressing post- implementation issues; • Raise the readiness level for the introduction and implementation of advanced measurement approach (AMA) in the assessment of group’s operational risks; as well as the deployment of a robust system which supports data capture, management and measurement of risks, together with decision-making and business performance tools on a single, highly scalable platform. • Continued enhancement of the group’s business recovery capabilities through the establishment of a dedicated command centre and a new purposed built business recovery site; • Reinforcing the group’s ability to proactively identify and respond to financial crimes by establishing financial crimes control function to provide independent forensic auditing and investigation; • Continued building of credit capabilities by the setting-up of specialist credit units coupled with an enhanced portfolio and transaction monitoring unit.
  • 124.
    121 Financial risk analysis Forthe year ended 31 December 2010 Risk management framework Governance structure The group’s activities are complex, diverse and expanding rapidly into market segments and regions with different challenges. Hence, it is imperative that there is strong and independent oversight at all levels across the group. The risk governance structure (see diagram overleaf) provides executive management and the board, through the various committees, with the forums to evaluate, consider and debate key risks faced by the group and assess the effectiveness of the management of these risks through a number of reports received from the chief risk officers across Stanbic IBTC. The board committees comprise the statutory audit committee, credit board committee, risk management board committee, while executive management oversight at a bank and group level is achieved through management committees focusing on specific risks. Each of these committees has a mandate which describes the membership and responsibilities of such committees. Approach and structure The group’s approach to risk management is based on well established governance processes and relies both on individual responsibility and collective oversight, supported by comprehensive reporting. This approach balances strong corporate oversight at senior management level with independent risk management structures in the business. Business unit heads are specifically responsible for the management of risk within their business units. As such, they are responsible for ensuring that they have appropriate risk management frameworks that are adequate in design, effective in operation and meet minimum group standards. This responsibility is achieved either through the establishment of dedicated business unit risk management functions in some subsidiary companies or through centralised risk functions servicing a number of business units. In the former case, adequate provision for the independence of the business unit risk management structures is essential in recognition of different regulatory requirements. An important element that underpins the group’s approach to the management of all risk is independence and appropriate segregation of responsibilities between business and risk. Risk officers report separately to the head of group risk who reports to the chief executive officer of Stanbic IBTC and also through a matrix reporting line to the Standard Bank Group (SBG). All key risks are supported by the risk department
  • 125.
    Stanbic IBTC BankPLC Annual Report 2010 122 Annualreportand financialstatements Stanbic IBTC board Shareholders Management committee REMCOCreditRiskExco Audit Credit ALCO Operational risk compliance Investment Country Risk Subsidiaries Pricing Board sub-committees Statutory committee Risk governance standards, policies and procedures The group has developed a set of risk governance standards for each major risk type. The standards set out and ensure alignment and consistency in the manner in which the major risk types across the group are governed, identified, measured, managed, controlled and reported. All standards are applied consistently across the group and are approved by the board. It is the responsibility of business unit executive management to ensure that the requirements of the risk governance standards, policies and procedures are implemented within the business units. Each standard is supported by group policies and business unit policies and procedural documents as required. Business units and group risk functions are required to self assess, at least annually, their compliance with group risk standards and policies. Risk governance standards set out the framework for managing each major risk type and policies are developed where required on specific items as stated within the standards. Details with regards to the implementation of these policies within each particular business unit are set out in the processes and procedures documentation. Risk appetite Risk appetite is an expression of the maximum level of residual risk that the group is prepared to accept in order to deliver its business objectives. It is the balance of return and risk determined by the board through the board and executive risk committees in consultation with the business units as the group implements business plans, recognising a range of possible outcomes. The board establishes the group’s parameters for risk appetite by: • providing strategic leadership and guidance; • reviewing and approving annual budgets and forecasts for the group and each business unit; and • regularly reviewing and monitoring the group’s performance in relation to risk through quarterly board reports. Risk appetite is expressed by balancing: • budgetary provisions for expected losses that are consistent with the risk appetite implied by the business plans; • an agreed tolerance for profit and loss volatility – an acceptable scenario that is lower than budget by an amount
  • 126.
    123 Financial risk analysis that is consistent with the risk appetite implied by the business plans; • the risk adjusted returns generated from risk-taking being acceptable; and • in the context of stress tests, portfolio analyses and concentration limits, risk assessments, risk indicators and other measures devised by the business unit risk functions which serve to identify and constrain threats to earnings and capital. Risk appetite is determined with reference to measures such as: • budgeted loss write-offs and provisions; • limits on exposures to individual counterparties, sectors, industries or geographies; • limits on trading exposures; and • interest rate. Stress testing Stress testing serves as a diagnostic and forward looking tool to improve the group’s understanding of its market and liquidity risks profile under event based scenarios. Management reviews the outcome of stress tests and selects appropriate mitigating actions to minimise and manage the risks to the group. Residual risk is then evaluated against the risk appetite. Examples of potential action to take are: • reviewing and changing limits; • limiting exposures in selected sectors or products; and • re-balancing of portfolio to reduce risk sensitivity Risk categories The bank’s enterprise risk management framework is designed to govern, identify, measure, manage, control and report on the principal risks to which the group is exposed. These risks, with applicability as appropriate, are defined as follows: Credit risk Credit risk arises primarily in the bank operations where an obligor fails to perform obligations, in accordance with agreed terms or the counterparty’s ability to meet such contractual obligation is impaired. Credit risk comprises counterparty risk, settlement risk, country risk and concentration risk. Counterparty risk Counterparty risk is the risk of loss to Stanbic IBTC as a result of failure by a counterparty to meet its financial and/or contractual obligations to the bank. It has three components: • primary credit risk which is the exposure at default (EAD) arising from lending and related banking product activities, including their underwriting; • pre-settlement credit risk which is the EAD arising from unsettled forward and derivative transactions, arising from the default of the counterparty to the transaction and measured as the cost of replacing the transaction at current market rates; and • issuer risk which is the EAD arising from traded credit and equity products, and including their underwriting. Settlement risk Settlement risk is the risk of loss to Stanbic IBTC from a transaction settlement, where value is exchanged, failing such that the counter value is not received in whole or part. Country and cross border risk Country and cross border risk is the risk of loss arising from political or economical conditions or events in a particular country which reduce the ability of counterparties (including the relevant sovereign and other members of the Standard Bank Group internationally) in that particular country to fulfil their obligations to Stanbic IBTC. Cross border risks is the risk of restriction on the transfer and convertibility of local currency funds, into foreign currency funds thereby limiting payment by offshore counterparties to the bank. Concentration risk Concentration risk refers to any single exposure or group of exposures large enough to cause credit losses which threaten Stanbic IBTC’s capital adequacy or ability to maintain its core operations. It is the risk that a common factor within a risk type or across risk types causes credit losses or an event occurs within a risk type which results to credit losses. Market risk Market risk is defined as the risk of a change in the actual or effective market value or earnings of a portfolio of financial instruments caused by adverse moves in market variables such as equity, bond and commodity prices, foreign exchange rates, interest rates, credit spreads, recovery rates, correlations and implied volatilities in all of the above. Market risk covers both the impact of these risk factors on the market value of traded instrument as well as the impact on the group’s net interest margin as a consequence of interest rate risk on banking book assets and liabilities. For the year ended 31 December 2010
  • 127.
    Stanbic IBTC BankPLC Annual Report 2010 124 Annualreportand financialstatements Liquidity risk Liquidity risk is defined as the risk that the bank, although balance-sheet solvent, cannot maintain or generate sufficient cash resources to meet its payment obligations in full as they fall due (as a result of funding liquidity risk), or can only do so at materially disadvantageous terms (as a result of market liquidity risk). Funding liquidity risk refers to the risk that the counterparties, who provide the bank with funding, will withdraw or not roll-over that funding. Market liquidity risk refers to the risk of a generalised disruption in asset markets that makes normal liquid assets illiquid and the potential loss through the forced-sale of assets resulting in proceeds being below their fair market value. Operational risk Operational risk is defined as the risk of loss resulting from inadequate or failed processes, people and systems (including information technology and infrastructure) or from external events. The definition of operational risk also includes: • information risk – the risk of unauthorised use, modification of disclosure of information resources; • fraud risk – the risk of losses resulting from fraudulent activities; • environmental risk – the risk of inadvertently participating in the destruction of the environment; • legal risk - the risk that the bank will be exposed to litigation; • taxation risk – the risk that the bank will incur a financial loss due to incorrect interpretation and application of taxation legislation or due to the impact of new taxation legislation on existing business; • compliance risk - the risk that the bank does not comply with applicable laws and regulations or supervisory requirements. Business risk Business risk is the risk of loss due to adverse local and global operating conditions such as decrease in demand, increased competition, increased cost, or by entity specific causes such as inefficient cost structures, poor choice of strategy, reputation damage or the decision to absorb costs or losses to preserve reputation. Credit risk Principal credit policies The group’s credit risk standard, as updated regularly, establishes and defines the principles to be applied in credit risk decisions and sets out the overall framework for the consistent and unified governance, identification, measurement, management and reporting of credit risk in Stanbic IBTC. Deriving from the credit risk standard, the Corporate and Investment Banking (CIB) credit policy, and the Personal and Business Banking (PBB) credit policy have been formulated to complement and operationalise the principles set out in the credit standard. These policies provide a comprehensive framework within which all credit risk emanating from the operations of Stanbic IBTC are properly identified, quantified, assessed, approved, legally executed, monitored and controlled in order to minimize the risk of financial loss; and assure consistency of approach in the treatment of regulatory compliance requirements. In addition to the credit standard, CIB and PBB policies, a number of related credit policies and documents have been developed, with contents that are relevant to the full implementation and understanding of the credit policies. Some of these policies/ documents are as stated below: ·         Credit counterparty rating policy ·         Country risk standard ·         Credit governance framework ·         The Basel II Accord ·         Credit risk review policy ·         Credit portfolio limit framework ·         Collateral valuation guideline ·         Controls breach framework Methodology for risk rating The starting point of all credit risk assessment and evaluation lies in the counterparty risk grading, which is quantified and calculated in compliance with the group’s credit rating policy and using such Basel-2 compliant models as are in current use and which are updated or enhanced from time to time. Credit risk quantification for any exposure or portfolio is summarised by the calculation of the expected loss (EL), which
  • 128.
    125 Financial risk analysis isarrived at in the following way: · Based on the risk grading foundation which yields the counterparty’s probability of default (PD), the nature and quantum of the credit facilities are considered; ·  A forward-looking quantification of the exposure at default (EAD) is determined in accordance with group standard guidelines. · Risk mitigants such as security and asset recovery propensities are then quantified to moderate exposure at default to yield the loss given default (LGD). ·  Finally, the EL is a function of the PD, the LGD and the EAD. These parameters are in turn used in quantifying the required regulatory capital reserving, using the regulatory Capital Calculator developed, maintained and updated in terms of Basel 2, and the economic capital implications through the use of Credit Portfolio Management’s (CPM’s) Economic Capital tools. Furthermore, bearing in mind the quantum of the facility and the risk/reward thereof, an appropriate consideration of Basel 2 capital requirements (where applicable) and the revenue and return on equity implications of the credit proposal is mandatory in all credit applications and reviews. Framework and governance Credit risk remains a key component of financial risks faced by any bank given the very nature of its business. The importance of credit risk management cannot be over emphasized as consequences can be severe when neglected. Stanbic IBTC has established sound governance principles to ensure that credit risk is managed effectively within a comprehensive risk management control framework. The principles guiding the assumption of credit risk and the overall framework for its application, governance, and reporting is defined in the Credit Risk Standard. The standard covers all forms of credit risk, intentional or otherwise, and is supported by credit risk policies and procedures to the extent required to further define the credit risk framework and its implementation across the bank. In reaching credit decisions and taking credit risk, both the credit and business functions must consistently and responsibly balance risk and return, as return is not the sole prerogative of business neither is credit risk the sole prerogative of credit. Credit (and the other risk functions, as applicable) and business must work in partnership to understand the risk and apply appropriate risk pricing, with the overall aim of optimising the bank’s risk adjusted performance. The standard, policies and procedures and compliance therewith are not substitutes for common sense and good business judgment. The reporting lines, responsibilities and authority for managing credit risk in Stanbic IBTC are very clear and independent. However, ultimate responsibility for credit risk rests with the board and which has delegated this to the following organs: Board credit committee The purpose of the board credit committee is to ensure that effective credit governance is in place in order to provide for the adequate management, measurement, monitoring and control of credit risk including country risk. In addition to its pre-existing role, the committee has also been vested with the following responsibilities as may be set by the board: • setting overall risk appetite; • reviewing and approving credit facilities that are within monetary amounts as approved by the board; • ensuring committees within the structure operate according to defined mandates and delegated authorities; • maintaining overall accountability and authority for the adequacy and appropriateness of all aspects of the bank credit risk management process; • utilising appropriate tools to measure, monitor and control credit risk in line with the SBG policies whilst taking into account local circumstances; • recommending the bank’s credit policies and guidelines for board approval; and • any other matters relating to credit as may be delegated to the committee by the board. Credit risk management committee The credit risk management committee (CRMC) is the senior management credit decision-making function and it operates within defined authority as determined by the board credit committee. The CRMC effectively enhances credit discipline within the bank and is responsible for controlling, inter alia, delegated authorities, concentration risk, distressed debt and regulatory issues pertaining to credit, credit audits, policy and governance. In addition to the above, the CRMC provides oversight of governance; recommends to the board credit committee the level of the bank’s risk appetite; monitors model performance, development and validation; determine counterparty and For the year ended 31 December 2010
  • 129.
    Stanbic IBTC BankPLC Annual Report 2010 126 Annualreportand financialstatements portfolio risk limits and approval, country, industry, market, product, customer segment and maturity concentration risk; risk mitigation; impairments and risk usage. Head of credit The head of credit has functional responsibility for credit risk management across the bank and is positioned at a sufficiently senior level in order to ensure the necessary experience and independence of judgment. The head of credit is responsible for providing an independent and objective check on credit risk taking activities to safeguard the integrity of the entire credit risk process. The head of credit is ably supported by the heads of CIB credit and PBB credit to ensure granularity and function-specific details at the business unit levels. Credit risk mitigation Guarantees, collateral and the transaction structure are used by the bank to mitigate credit risks both identified and inherent though the amount and type of credit risk is determined on a case by case basis. The bank’s credit policy and guidelines are used in a consistent manner while security is valued appropriately and reviewed regularly for enforceability and to meet changing business needs. The main types of collateral taken comprise bonds over residential, commercial and industrial properties, bonds over plant and equipment, liquid and tradable financial instruments and, for leases, the underlying moveable assets financed. The group has a collateral policy which establishes and defines the principles of accepting, verifying, maintaining, and releasing collateral. Processes and procedures are well documented in order to ensure appropriate application of the collateral management techniques, which cover at least the following requirements: • Acceptable collateral management techniques and any conditions or restrictions applicable to them; • Acceptable methodologies for the initial and subsequent valuations including how often collateral will be re-valued; • Process and completion of the collateral documentation in a timely manner; • The valuation, verification, and appraisal of all collateral; • The maximum loan-to-value percentages, minimum haircuts or other volatility adjustments applicable to each type of collateral; • The means by which legal enforceability and certainty is to be established, including required documentation and all necessary steps required to establish legal rights; • Lien and title perfection for the collateral; • Recognition and management of any correlation between the credit risk of the customer and the value of collateral; • The rigorous monitoring and control of collateral to ensure its continued effectiveness; • Actions to be taken in the event the current value of collateral falls below required levels; • Management of concentration risks, e.g. setting maximum limits on the acceptability of the collateral from a number of customers; • Timely liquidation of the collateral; • Filing of collateral claims properly and timely; • Determining price at which the collateral may be sold; • Receiving and releasing of collateral must be handled by individuals other than those who record the collateral.
  • 130.
    127 NGN000,000 Group’s rating Global Africa Credit Committee / Board Credit Committee Management Credit Committee Country Credit Head/ Head of CIB Credit Maximum Approval Limit (Nmillion) Corporate investment banking SB01 - SB10 Up to legal lending limit Up to legal lending limit Up to legal lending limit SB11 - SB12 Up to legal lending limit Up to legal lending limit 10,600 SB13 Up to legal lending limit Up to legal lending limit 7,600 SB14 - SB15 Up to legal lending limit Up to legal lending limit 4,500 SB16 - SB18 Up to legal lending limit 12,000 3,800 SB19 - SB20 Up to legal lending limit 6,000 1,500 SB21 Up to legal lending limit 4,500 1,500 SB22 - SB23 Up to legal lending limit 4,500 800 SB24 - SB25 Up to legal lending limit 4,500 600 Personal business banking SB01 - SB25 Up to legal lending limit 2,250 930 Corporate investment banking (CIB) Financial risk analysis For the year ended 31 December 2010 Credit delegated authority Authority for approval of any credit facilities accorded to counterparties is vested only in individuals, and/or groups of individuals acting in concert, and/or credit committees, in terms of specific delegated authority (DA) levels approved (and updated from time to time) by the board upon advise. Such DA levels are quantified according to counterparty risk grade. Individuals may be accorded DA levels on the authority of the parties specifically mandated to do so in terms of the credit governance framework. In responding to credit applications, named parties or committees exercising their DA mandates will only do so against: • a recommendation from the business and credit sponsor(s) of the credit proposal; • a recommendation from the relevant balance sheet owner for all committed term lending exposures in excess of 3 months; • a recommendation from the respective product houses materially represented in the credit proposal; • where total facilities to be approved for any counterparty exceed the relevant credit evaluation manager’s (CEM) own DA level, support is required from that CEM; • a recommendation from distribution committee/team; and • a sign off from country risk committee for any cross border facilities. Delegated authority mandates held by committees or individuals may not be further delegated. Where a credit facility is originated by the holder of a DA, that proposal requires to be submitted to another DA holder for approval, in keeping with the spirit of the four-eyes principle. The internal credit approval limits is shown in the table below. The global credit committee approves based on the mandate given to them by the board credit committee. All approvals are sanctioned by the board credit committee. The board credit committee approves all insider-related credit irrespective of the amount.
  • 131.
    Stanbic IBTC BankPLC Annual Report 2010 128 Annualreportand financialstatements Credit risk measurement The global credit committee and Africa credit committee approve based on the mandate given to them by the board credit committee. All approvals are sanctioned by the board credit committee. The board credit committee approves all insider-related credit irrespective of the amount. A key element in the measurement of credit risk is the assignment of credit ratings. All customers including corporate, individuals and institutions and special purpose vehicles (SPVs) are awarded risk gradings to determine expected defaults across asset portfolios and risk bands. The risk ratings attributed to counterparties are based on a combination of factors which cover business and financial risks: • all counterparties for which the bank has facility limits in place are assigned a credit rating. The rating is forward looking (i.e. predictive in nature) and discriminatory (i.e. ability to rank order). However, all local ratings are capped by the country rating; • a foreign currency rating and associated probability of default(PD)mustbeusedforallexposurestocounterparties in a currency other than naira; • facility risk arising from exposure and/or facility specific factors such as collateral and seniority must be measured and addressed as part of the credit risk mitigation analysis and should not affect or impact on the counterparty rating; • external support, as distinct from mitigants, can be recognised in the rating process on a defined basis provided it is consistently applied; • the process and methodology to assign a rating to each counterparty and a PD to each rating must be the responsibility of, and signed off by, the credit committee; and • pricing must be based on the risk grades assigned to the counterparty. The group has adopted the PD Master Scale rating concept with a single scale to measure the credit riskiness of all counterparty types. The grading system changed from a 21-point scale for performing assets, with three additional default grades, to a 25- point scale, with three additional default grades (unchanged). Some advantages of a PD Master Scale include the ability to compare entities in terms of default risk across portfolios andtheremovalofalldependencyonaspecificmodel’scalibration going forward, making future enhancements to models easier to implement. The table below shows a view of an indicative external rating equivalent bearing in mind that these equivalents may change from time to time i.e. Group’s rating Grade description External rating SB01 - SB12/SB13 Investment grades AAA to BBB- SB13 - SB25 Speculative grades BB- to CCC Provisioning policies The internal and external rating systems focus more on credit- quality mapping from the inception of the lending and investment activities. In contrast, loan loss provisions are recognised for financial reporting purposes only for losses that have been incurred at the balance sheet date based on criteria set out in the Prudential Guidelines for licenced bank.
  • 132.
    129 Financial risk analysis Provisionagainst credit risk Provision is made in accordance with the Statement of Accounting Standard for Banks and Non-Bank Financial Institutions (SAS 10) issued by the Nigerian Accounting Standard Board and Prudential Guidelines issues by the Central Bank of Nigeria. Provision adequacy Nmillion Gross NPL balance Interest in suspense Net NPL Provision Provision adequacy Security value (NPV) Margin lending 1,031 328 703 606 86% 304 Oil gas 8,025 686 7,339 3,457 47% 9,190 Others 5,181 456 4,725 2,372 50% 4,088 Closing balances 14,237 1,470 12,767 6,435 50% 13,582 For the year ended 31 December 2010 Non performing loan analysis The tables below show analyses of non performing loans as at 31 December 2010. Group 2010 Nmillion Group 2009 Nmillion Performing 172,905 114,270 Non-performing: - substandard 1,499 1,764 - doubtful 9,990 11,501 - lost 2,748 5,565 187,142 133,100 Performing but past due loans Loans and advances less than 90 days past due are considered performing, unless other information is available to indicate the contrary. Gross amount of loans and advances by class to customers that were past due but performing were as follows: At 31 December 2010 Retail Nmillion Corporate Nmillion SME Nmillion Financial institutions Nmillion Total Nmillion Past due up to 30 days 9,843 8,664 - - 18,507 Past due 30 - 60 days 826 - - - 826 Past due 60 - 90 days 179 636 - - 815 10,848 9,300 - - 20,148 At 31 December 2009 Past due up to 30 days 6,152 13,766 - - 19,918 Past due 30 - 60 days 308 1,194 - - 1,502 Past due 60 - 90 days 187 2,215 - - 2,402 6,647 17,175 - - 23,822 Risk assets (loans and advances, advances under finance leases, off-balance sheet direct credit substitutes, etc) Loans advances and advances under finance leases are summarised as follows:
  • 133.
    Stanbic IBTC BankPLC Annual Report 2010 130 Annualreportand financialstatements Group 2010 Nmillion Group 2009 Nmillion Agriculture 2 - General commerce 3,194 7,212 Manufacturing 12 284 Mining and quarrying 8,025 8,134 Real estate and construction 6 2,274 Finance and insurance 800 559 Government - - Transportation 1,814 108 Communication 384 259 14,237 18,830 Group 2010 Nmillion Group 2009 Nmillion South South 1 226 South West 13,004 17,610 South East 63 70 North West 275 72 North Central 893 852 North East 1 - 14,237 18,830 Non-performing loans by industry Non-performing loans by geography
  • 134.
    131 Financial risk analysis At31 December 2010 Due from banks Nmillion Loans and advances Nmillion Advances under finance lease Nmillion Debt instruments Nmillion Total Nmillion South South - 3,758 97 - 3,855 South West 33,688 154,853 11,743 38,722 239,006 South East - 1,632 1,437 - 3,069 North West - 5,938 343 - 6,281 North Central - 6,342 498 - 6,840 North East - 221 280 - 501 Outside Nigeria 54,971 - - - 54,971 88,659 172,744 14,398 38,722 314,523 At 31 December 2009 Due from banks Nmillion Loans and advances Nmillion Advances under finance lease Nmillion Debt instruments Nmillion Total Nmillion South South - 2,045 - - 2,045 South West 30,313 116,496 9,509 62,309 218,627 South East - 959 - - 959 North West - 1,784 - - 1,784 North Central - 2,249 - - 2,249 North East - 58 - - 58 Outside Nigeria 46,641 - - - 46,641 76,954 123,591 9,509 62,309 272,363 Concentration of risks of financial assets with credit risk exposure (a) Geographical sectors The following table breaks down the group’s main credit exposure at their carrying amounts, as categorised by geographical region as of 31 December 2009. For this table, the group has allocated exposures to regions based on the region of domicile of our counterparties. For the year ended 31 December 2010
  • 135.
    Stanbic IBTC BankPLC Annual Report 2010 132 Annualreportand financialstatements (b) Industry sectors At 31 December 2010 Due from banks Nmillion Loans and advances Nmillion Advances under finance lease Nmillion Debt instruments Nmillion Total Nmillion Agriculture - 1,393 82 - 1,475 Oil and gas - 10,325 329 - 10,654 Capital market - 662 - - 662 Consumer credit - 19,746 3,045 - 22,791 Manufacturing - 37,255 1,205 - 38,460 Mining and quarrying - 10,581 63 - 10,644 Mortgage - 10,643 - - 10,643 Real estate and construction - 7,595 35 1,000 8,630 Finance and insurance 88,659 376 114 2,502 91,651 Government - 3,668 258 35,220 39,146 Power - 11,512 - - 11,512 General commerce - 25,868 3,927 - 29,795 Public utilities - 343 - - 343 Transportation - 775 5,179 - 5,954 Communication - 31,978 115 - 32,093 Education - 24 47 - 71 88,659 172,744 14,399 38,722 314,524 At 31 December 2009 Due from banks Nmillion Loans and advances Nmillion Advances under finance lease Nmillion Debt instruments Nmillion Total Nmillion Agriculture - 637 2 - 639 Oil and gas - 25,982 291 - 26,273 Capital Market - 13 619 - 632 Consumer credit - 11,265 2,471 - 13,736 Manufacturing - 40,419 950 - 41,369 Mining and quarrying - 80 - - 80 Mortgage - 2,341 3 - 2,344 Real estate and construction - 2,320 4 - 2,324 Finance and insurance 76,954 1,371 1,286 3,739 83,350 Government - 406 - 58,570 58,976 Power - 2,262 - - 2,262 General commerce - 18,370 1,905 - 20,275 Public utilities - 2,376 51 - 2,427 Transportation - 900 1,635 - 2,535 Communication - 14,602 247 - 14,849 Education - 247 45 - 292 76,954 123,591 9,509 62,309 272,363
  • 136.
    133 Financial risk analysis At31 December 2010 A+ to A- BBB+ to BB- Below BB- Unrated Total - 197,762 93,411 23,321 314,524 - 197,762 93,411 23,321 314,524 Analysis by portfolio distribution and risk rating At 31 December 2009 A+ to A- BBB+ to BB- Below BB- Unrated Total - 140,477 118,175 13,711 272,363 - 140,477 118,175 13,711 272,363 For the year ended 31 December 2010
  • 137.
    Stanbic IBTC BankPLC Annual Report 2010 134 Annualreportand financialstatements Foreign exchange risk The group takes on exposure to the effects of fluctuations in the prevailing foreign currency exchange rates on its financial position and cash flows. The board sets limits on the level of exposure by currency and in aggregate for both overnight and intra day positions, which are monitored daily. The table below summarises the group’s exposure to foreign currency exchange risk at 31 December. At 31 December 2010 Asset Naira Nmillion US Dollar Nmillion GBP Nmillion Euro Nmillion Others Nmillion Total Nmillion Cash and balances with CBN 8,945 433 457 180 33 10,048 Treasury Bills 12,428 - - - - 12,428 Due from other banks 22,518 62,852 791 1,862 636 88,659 Loans and advances to customers 123,496 40,451 - 5 - 163,952 Advances under finance lease 13,502 - - - - 13,502 Investment securities 47,306 279 - - - 47,585 Investment in subsidiaries - - - - - - Deffered tax asset 939 - - - - 939 Other assets 3,106 9,093 17 20 3,940 16,176 Property and equipment 31,252 - - - - 31,252 Total assets 263,492 113,108 1,265 2,067 4,609 384,541 Liabilities Customer deposits 157,767 25,832 2,307 526 34 186,466 Due to other banks 36,337 19,795 - - 20 56,152 Other borrowings 3,910 14,362 - - - 18,272 Other liabilities 21,365 6,572 162 1,556 4,565 34,220 Current income tax 4,197 - - - - 4,197 Deffered tax liabilities 108 - - - - 108 Total liabilities 223,684 66,561 2,469 2,082 4,619 299,415 Net on-balance sheet financial position 39,808 46,547 (1,204) (15) (10) 85,126 Off balance sheet 56,237 (44,186) 1,255 1,014 541 14,861 At 31 December 2009 Naira Nmillion US Dollar Nmillion GBP Nmillion Euro Nmillion Others Nmillion Total Nmillion Total assets 262,778 71,516 1,167 4,854 175 340,490 Total liabilities (194,570) (58,994) (1,373) (3,949) (107) (258,993) Net on-balance sheet financial position 68,208 12,522 (206) 905 68 81,497 Off balance sheet 28,274 (11,602) 426 (827) (73) 16,198 Concentrations of currency risk – on- and off-balance sheet financial instruments
  • 138.
    135 Financial risk analysis Forthe year ended 31 December 2010 Market risk The identification, management, control, measurement and reporting of market risk is categorised as follows: Trading market risk These risks arise in trading activities where the bank acts as a principal with clients in the market. The group policy is that all trading activities are contained within the group’s CIB trading operations. Banking book interest rate risk These risks arise from the structural interest rate risk caused by the differing repricing characteristics of banking assets and liabilities. Foreign currency risk These risks arise as a result of changes in the fair value or future cash flows of financial exposures as a result of changes in foreign exchange rates other than those included in the Value at Risk (VaR) analysis for CIB’s trading positions. Equity investment risk These risks arise from equity price changes caused by listed and unlisted investments. This risk is managed through the equity investment committee, which is a sub-committee of the executive committee. Framework and governance The board approves the market risk appetite and standards for all types of market risk. The board grants general authority to take on market risk exposure to the asset and liability committee (ALCO). ALCO sets market risk policies to ensure that the measurement, reporting, monitoring and management of market risk associated with operations of the bank follow a common governance framework. The bank’s ALCO reports to EXCO and also to board risk committee. The in-country risk management is subject to SBG oversight for compliance with group standards and minimum requirements. The market risk management unit which is independent of trading operations and accountable to ALCO, monitors market risk exposures due to trading and banking activities. This unit monitors exposures and respective excesses daily, report monthly to ALCO and quarterly to the board risk committee. Market risk measurement The techniques used to measure and control market risk include: • daily net open position • daily VaR; • back-testing; • PV01; • other market risk measures; and • annual net interest income at risk. Daily net open position The board on the input of ALCO sets limits on the level of exposure by currency and in aggregate for overnight positions. The latter is also aligned to the net open position limit as specified by the regulators, which is usually a proportion of the group’s capital. Daily value-at-risk (VaR) VaR is a technique that estimates the potential losses that occur resulting from market movements over a specified time period and a predetermined probability. VaR limits and exposure measurements are in place for foreign currency risks. The bank generally uses the historical VaR approach to derive quantitative measures, specifically for market risk under normal market conditions. Normal VaR is based on a holding period of one day and a confidence level of 95%. Daily losses exceeding the VaR are likely to occur, on average, 13 times in every 250 days. The use of historic VaR has limitations as it is based on historical correlations and volatilities in market prices and assumes that future prices will follow the observed historical distribution. Hence, there is a need to back-test the VaR model regularly. VaR back-testing The bank back-tests its foreign currency exposure VaR model to verify the predictive ability of the VaR calculations thereby ensuring the appropriateness of the model. Back-testing exercise is an ex-post comparison of the daily hypothetical profit and loss under the one-day buy and hold assumption to the prior day VaR. Profit or loss for back-testing is based on the theoretical profits or losses derived purely from foreign currency spot moves and it is calculated over 250 cumulative trading-days at 95% confidence level.
  • 139.
    Stanbic IBTC BankPLC Annual Report 2010 136 Annualreportand financialstatements Stress tests Stress testing provides an indication of the potential losses that could occur in extreme market conditions and is carried out to augment other risk measures that are used by the bank, such as VaR and market risk factor sensitivities. These stress scenarios are typically used to highlight exposures that may not be explicitly incorporated by the VaR and specific sensitivity calculations, such as basis or correlation risks and out of the money option positions that can be the source of large losses when abnormally large market movements occur. Stress testing also attempts to indicate the size of the loss provoked by any of a number of unlikely but possible shock events given current positions held. The stress tests carried out include individual market risk factor testing and combinations of market factors on individual asset classes and across different asset classes. Stress tests include a combination of historical and hypothetical simulations. PV01 PV01 is a risk measure used to assess the effect of a change of rate of one basis point on the price of an asset. This limit is set for the fixed income and money market trading portfolios. Other market risk measures Other market risk measures specific to individual business units include permissible instruments, concentration of exposures, gap limits, maximum tenor and stop loss triggers. In addition, only approved products that can be independently priced and properly processed are permitted to be traded. Pricing models and risk metrics used in production systems, whether these systems are off-the-shelf or in-house developed, areindependentlyvalidatedbythemarketriskunitbeforetheiruse and periodically thereafter to confirm the continued applicability of the models. In addition, the market risk unit assesses the daily liquid closing price inputs used to value instruments and performs a review of less liquid prices from a reasonableness perspective at least fortnightly. Where differences are significant, mark-to- market adjustments are made. Annual net interest income at risk A dynamic forward-looking annual net interest income forecast is used to quantify the banks’ anticipated interest rate exposure. This approach involves the forecasting of both changing balance sheet structures and interest rate scenarios, to determine the effect these changes may have on future earnings. The analysis is completed under both normal market conditions as well as stressed market conditions. Distribution of trading income in 2010 The histogram below shows the distribution of daily income and losses during 2010. It captures trading income volatility and shows the number of days in which the bank’s trading related revenues fell within particular ranges. The distribution is skewed to the profit side. Overall, it shows that trading income was realised on 206 days out of a total of 248 days with 26 positive out-liers. Analysis of fx value-at-risk (VaR) and actual income The graph below shows the normal VaR analysis and the actual income of the foreign currency trading unit in 2010. It reflects a relative stability in VaR amount despite the fluctuation in trading income. Frequency of Trading Days Loss Profit 15 20 0 5 10 40 25 30 35 60 45 50 55 -120 -120≤-105 -105≤-90 -90≤-75 -75≤-60 -60≤-45 -45≤-30 -30≤-15 -15≤0 0≤15 15≤30 30≤45 45≤60 60≤75 75≤90 90≤105 105≤120 120 Foreign Exchange Trading Income Normal VaR 2009/2010 -600 1,500 1,200 900 600 300 0 -300 Jan-09 Jan-09 Jan-09 Feb-09 Feb-09 Mar-09 Mar-09 Apr-09 Apr-09 May-09 May-09 Jun-09 Jun-09 Jul-09 Jul-09 Jul-09 Aug-09 Aug-09 Sep-09 Sep-09 Oct-09 Oct-09 Nov-09 Nov-09 Dec-10 Dec-10 Jan-10 Jan-10 Jan-10 Feb-10 Feb-10 Mar-10 Mar-10 Apr-10 Apr-10 May-10 May-10 Jun-10 Jun-10 Jul-10 Jul-10 Jul-10 Aug-10 Aug-10 Sep-10 Sep-10 Oct-10 Oct-10 Nov-10 Nov-10 Dec-10 Dec-10 FX PL (USD) Normal VaR
  • 140.
    137 Financial risk analysis Forthe year ended 31 December 2010 The table below shows the historical VaR utilisation for the bank’s foreign currency trading positions. The minimum and maximum VaR amounts stood at US$613 and US$158,060 respectively with an annual average of US$62,800, which translates to a very conservative percentage VaR base limit utilisation of 23% on average. FX VaR (USD) Minimum Average Maximum 31 Dec 2010 31 Dec 2009 Normal VaR 613 62,800 158,060 47,705 29,553 Stress VaR 5,939 1,508,413 3,580,457 1,993,395 350,890 Analysis of PV01 The table below shows the PV01 of the money market banking and trading books as well as fixed income. The trading book PV01 exposure was N1.65 million and banking book PV01 exposure stood at N5.62 million while the fixed income PV01 exposure of N0.15 million, thus reflecting a very conservative exposure utilisation. Overall, limit discipline was very good. PVO1 (N000) 2010 2009 Limit Money market trading book 1,659 6,137 7,780 Money market banking book 5,625 6,651 13,230 Fixed income 151 265 3,400 Analysis of banking book market risk exposures Banking-related market risk exposure principally involves the management of the potential adverse effect of interest movement on net interest income. The risk is transferred to and managed within the bank’s treasury operations under supervision of ALCO. A dynamic, forward-looking net interest income forecast is used to quantify the bank’s anticipated interest rate exposure. This approach involves the forecasting of both changing balance sheet structures and interest rate scenarios, to determine the effect these changes may have on future earnings. Balance sheet projections and the impact on net interest income due to rate changes normally cover a minimum of 12 months forecasting. The analysis allows for the dynamic interaction of payments, new business and interest rates, and also captures the effects of embedded or explicit options. Stress condition Utilisation (%age) 31 Dec 2010 Limit LCY interest rate shock Rates up 200 bps 6.69 10% Rates down 200 bps (7.75) 10% FCY interest rate shock Rates up 75 bps (2.25) 10% Rates down 75 bps 1.00 10% Market risk on equity investment The equity committee has governance and oversight of all investment decisions. The committee is tasked with the formulation of risk appetite and oversight of investment performance. In this regard, a loss trigger is in place for the non- strategic portion. The analyses are done under normal market conditions i.e. under a bullish, expected and bearish interest rate scenario and, under stressed market conditions in which the banking book is subjected to an upward and downward 200 basis points parallel rate shock for local currency and 75 basis points for foreign currency. The table below shows the sensitivity of the bank’s net interest income in response to standardised parallel rate shocks. The impacts of the rate shocks on the bank’s net interest income are well within the 10% limit.
  • 141.
    Stanbic IBTC BankPLC Annual Report 2010 138 Annualreportand financialstatements Liquidity risk Framework and governance The nature of banking and trading activities results in a continuous exposure to liquidity risk. Liquidity problems can have an adverse impact on a bank’s earnings and capital and, in extreme circumstances, may even lead to the collapse of a bank which is otherwise solvent. Hence, sound liquidity risk management is pivotal to the viability of every bank and the maintenance of overall banking stability. The bank’s liquidity risk management framework is designed to measure and manage the liquidity position at various levels of consolidation such that payment obligations can be met at all times, under both normal and considerably stressed conditions. Under the delegated authority of the board of directors, ALCO sets liquidity risk policies in accordance with regulatory requirements and international best practice. Limits and guidelines are prudently set and reflect the bank’s conservative appetite for liquidity risk. ALCO is charged with ensuring compliance with liquidity risk standards and policies. Liquidity and funding management A sound and robust liquidity process is required to measure, monitor and manage liquidity exposures. The bank has incorporated the following liquidity principles as part of a cohesive liquidity management process: • structural liquidity mismatch management; • long-term funding ratio; • back-testing; • maintaining minimum levels of liquid and marketable securities; • depositor concentration; • local currency loan to deposit limit; • foreign currency loan to deposit limit; • intra-day liquidity management; • daily cash flow management; • liquidity stress and scenario testing; and • liquidity contingency planning. The cumulative impact of the above principle is monitored, at least monthly by ALCO and the process is underpinned by a system of extensive controls. The latter includes the application of purpose-built technology, documented processes and procedures, independent oversight and regular independent reviews and evaluations of the effectiveness of the system. Structural liquidity mismatch management The mismatch approach measures a bank’s liquidity by assessing the mismatch between its inflow and outflow of funds within different time bands on a maturity ladder. The structural liquidity mismatch is based on behaviourally-adjusted cash flows which factors a probability of maturity into the various time bands. Detailed assumptions and reasoning applied in compiling the structural liquidity mismatch are well documented. • In the main, readily available liquidity is profiled based on realistic liquidation periods (including appropriate forced- sale discounts), while other cash flows with a predetermined runoff must are profiled according to their remaining contractual maturity; • ambiguous maturity loan and advance products are profiled using an attrition analysis; • ambiguous maturity deposit and borrowing products are profiled using a volatility analysis, except where such products do not exhibit term behaviour, in which case they are profiled in the sight-to-7 day maturity bucket; • material, off-balance sheet facilities granted by the bank are profiled on the basis of probable drawdown; • all other cash flow items or positions in respect of which no right or obligation in respect of maturity exists are profiled in the 12 months maturity bucket. A net mismatch figure is obtained by subtracting liabilities and net off-balance sheet positions from assets in each time band. The bank’s liquidity position is assessed by means of the net cumulative mismatch position (aggregation of net position in each successive time band), expressed as a percentage of total funding related liabilities to the public. The maturity analysis for financial liabilities represents the basis for effective management of exposure to structural liquidity risk. Behavioural profiling is applied to assets, liabilities and off- balance sheet commitments with an indeterminable maturity or draw-down period, as well as to certain liquid assets. The monitoring of liquidity risk using the behavioural adjusted basis is facilitated by the adoption of maximum mismatch limits and guidelines to restrict the mismatch between the expected inflows and outflows of funds in different time buckets. The tables below show that the bank’s net cumulative anticipated mismatches between assets and liabilities for both local currency and foreign currency were positive in the shortest time band.
  • 142.
    139 Financial risk analysis Forthe year ended 31 December 2010 Anticipated liquidity gap (local currency) - All figures in millions Period Overnight 1 month 2 months 3 months 4-6 months 7-12 months 13-24 months 24 months Period gap 23,123 (27,113) (12,505) 10,792 (4,621) (3,482) 81,049 (27,242) Cumulative gap 23,123 (3,990) (16,495) (5,703) (10,324) (13,806) 67,243 40,001 Anticipated liquidity gap (foreign currency) - All figures in millions Period Overnight 1 month 2 months 3 months 4-6 months 7-12 months 13-24 months 24 months Period gap 44 (62) 6 6 (10) (30) (251) 42 Cumulative gap 44 (18) (12) (6) (16) (46) (297) (255) The bank’s ability to withstand huge outflow was very strong as shown in the tables below where the net cumulative mismatch positions as a percentage of total funding related liabilities were in excess of the limits in all the time bands. Cumulative gap as a % of TFLRP (local currency) Cumulative gap as a % of TFLRP* Overnight 1 month 2 months 3 months 4 - 6 months 7 - 12 months Dec’10 11.60% (2.00%) (8.30%) (2.90%) (5.20%) (6.90%) Dec’09 33.90% 23.40% 22.00% 26.40% 16.10% 8.30% Limit 0% (5%) (10%) (10%) (15%) (20%) Cumulative gap as a % of TFLRP* (foreign currency) Cumulative gap as a % of TFLRP* Overnight 1 month 2 months 3 months 4 - 6 months 7 - 12 months Dec’10 10.80% (4.20%) (2.90%) (1.40%) (3.80%) (11.20%) Dec’09 45.30% 67.90% 70.80% 60.50% 54.00% 46.70% Limit 0% (5%) (10%) (10%) (15%) (20%) * TFLRP - Total funding liability related to public. Based on forecast business growth and the structural dynamics of the balance sheet, ALCO projects long-term funding requirements, thereby setting targets for long-term funding ratios. The projected long-term ratio is a transparent and practical measure for the funding desk to target and monitor the pace of raising long-term deposits. There are no limits for mismatches due to contractually based inflows and outflows.
  • 143.
    Stanbic IBTC BankPLC Annual Report 2010 140 Annualreportand financialstatements Maintaining minimum levels of liquid and marketable assets Minimum levels of prudential liquid assets are held in accordance with all prudential requirements as specified by the regulatory authorities. The bank holds additional unencumbered marketable assets, in excess of any minimum prudential liquid asset requirement, to cater for volatile depositor withdrawals, draw-downs under committed facilities, collateral calls, etc. The following criteria apply to readily marketable securities: • prices must be quoted by a range of counterparties; • the asset class must be regularly traded; • the asset may be sold or repurchased in a liquid market, for payment in cash; and • settlement must be according to a prescribed, rather than a negotiated, timetable. Depositor concentration To ensure that the bank does not place undue reliance on any single entity as a funding source, restrictions are imposed on the short dated (0 – 3 months term) deposits accepted from any entity. These include: • the sum of 0 – 3 month deposits and standby facilities provided by any single deposit counterparty must not, at any time, exceed 10% of total funding related liabilities to the public; and • the aggregate of 0 – 3 month deposits and standby facilities from the 10 largest single deposit counterparties must not, at any time, exceed 20% of total funding related liabilities to the public. Concentration risk limits are used to ensure that funding diversification is maintained across products, sectors, and counterparties. Primary sources of funding are in the form of deposits across a spectrum of retail and wholesale clients. As mitigants, the bank maintains marketable securities in excess of regulatory requirement in order to condone occasional breaches of concentration limits. Loan to deposit limit A limit is put in place, restricting the local currency loan to deposit ratio to a maximum specified level, which is reviewed periodically. Similarly, in order to restrict the extent of foreign currency lending from the foreign currency deposit base, a foreign currency loan to deposit limit, which is also referred to as own resource lending, is observed. As mitigants, the bank maintains high levels of unencumbered marketable and liquid assets in excess of regulatory benchmark. Intra-day liquidity management The bank manages its exposures in respect of payment and settlement systems. Counterparties may view the failure to settle payments when expected as a sign of financial weakness and in turn delay payments to the bank. This can also disrupt the functioning of payment and settlement systems. At a minimum, following operational elements are included the bank’s intra-day liquidity management: • capacity to measure expected daily gross liquidity inflows and outflows, including anticipated timing where possible; • capacity to monitor its intraday liquidity positions, including available credit and collateral; • sufficient intraday funding to meet its objectives; • ability to manage and mobilise collateral as required; • robust capacity to manage the timing of its intraday outflows; and • readiness to deal with unexpected disruptions to its intraday liquidity flows. Daily cash flow management The bank generates a daily report to monitor significant cash flows. Maturities and withdrawals are forecast at least 3-months in advance and management is alerted to large outflows. The report, which is made available to the funding team, ALM and market risk also summarises material daily new deposit as well as the interbank and top depositor reliance (by value and product). The daily cash flow management report forms an integral part of the ongoing liquidity management process and is a crucial tool to proactively anticipate and plan for large cash outflows. Liquidity stress and scenario testing Anticipated on- and off-balance sheet cash flows are subjected to a variety of bank specific and systemic stress scenarios in order to evaluate the impact of unlikely but plausible events on liquidity positions. Scenarios are based on both historical events, such as past emerging markets crises, past local financial markets crisis and hypothetical events, such as a bank specific crisis. The results obtained from stress testing provide meaningful input when defining target liquidity risk positions.
  • 144.
    141 31 December 20100 - 30 days Nmillion 1 - 3 months Nmillion 3 - 6 months Nmillion 6 - 12 months Nmillion 1 - 5 years Nmillion Over 5 years Nmillion Total Nmillion Asset Cash and balances with central bank 8,046 2,002 - - - - 10,048 Treasury bills 1,551 4,044 289 2,820 3,724 - 12,428 Due from other banks 72,042 16,617 - - - - 88,659 Loans and advances to customers 37,591 42,180 11,888 7,534 48,877 15,882 163,952 Advances under finance lease 624 966 436 403 11,057 16 13,502 Investment securities 12,326 74 1,150 1,156 15,044 17,835 47,585 Investment in subsidiaries - - - - - - - Deffered tax asset - - - 939 - - 939 Other assets 3,632 9,014 3,296 234 - - 16,176 Property and equipment - - - 9,681 8,074 13,497 31,252 Total assets 135,812 74,897 17,059 22,767 86,776 47,230 384,541 Liabilities Customer deposits 172,702 8,496 2,290 2,900 77 1 186,466 Due to other banks 45,409 3,796 6,947 - - - 56,152 Other borrowings 1,126 220 590 2,142 10,660 3,534 18,272 Other liabilities 2,065 9,536 10,135 12,484 - - 34,220 Current income tax - - - 4,197 - - 4,197 Deffered income tax - - - 108 - - 108 Total liabilities 221,302 22,048 19,962 21,831 10,737 3,535 299,415 Net liquidity gap (85,490) 52,849 (2,903) 936 76,039 43,695 85,126 For the year ended 31 December 2010 Financial risk analysis Maturities of assets and liabilities - group
  • 145.
    Stanbic IBTC BankPLC Annual Report 2010 142 Annualreportand financialstatements 31 December 2009 0 - 30 days Nmillion 1 - 3 months Nmillion 3 - 6 months Nmillion 6 - 12 months Nmillion 1 - 5 years Nmillion Over 5 years Nmillion Total Nmillion Asset Cash and balances with central bank 6,484 1,288 - - - - 7,772 Treasury bills 159 - 10,977 242 - - 11,378 Due from other banks 63,963 10,000 - - 2,991 - 76,954 Loans and advances to customers 29,058 45,573 3,760 10,192 14,191 7,734 110,508 Advances under finance lease 19 776 11 984 7,587 - 9,377 Investment securities 10,721 2,351 90 12,737 29,268 16,295 71,462 Investment in subsidiaries - - - - - 1 1 Deffered tax asset - - - 594 - - 594 Other assets 5,513 1,797 2,198 11,323 3,177 1,558 25,566 Property and equipment 1 1 15 57 17,130 9,674 26,878 Total assets 115,918 61,786 17,051 36,129 74,344 35,262 340,490 Liabilities Customer deposits 134,287 28,404 5,706 652 151 - 169,200 Due to other banks 21,137 1,942 9,927 - 5,328 - 38,334 Other borrowings - - - - 12,647 - 12,647 Other liabilities 19,247 5,748 4,366 3,237 1,025 429 34,052 Current income tax - - - 4,508 152 - 4,660 Deferred tax liabilities - - - 100 - - 100 Total liabilities 174,671 36,094 19,999 8,497 19,303 429 258,993 Net liquidity gap (58,753) 25,692 (2,948) 27,632 55,041 34,833 81,497
  • 146.
    143 Financial risk analysis Forthe year ended 31 December 2010 Maturity profile - Off balance sheet - group 31 December 2010 0 - 30 days Nmillion 1 - 3 months Nmillion 3 - 6 months Nmillion 6 - 12 months Nmillion 1 - 5 years Nmillion Over 5 years Nmillion Total Nmillion Performance bonds and financial guarantees 1,458 404 113 633 1,500 1,172 5,279 Contingent letters of credits 9,327 - - - - - 9,327 Forward contracts 254 - - - - - 254 Total 11,039 404 113 633 1,500 1,172 14,861 31 December 2009 0 - 30 days Nmillion 1 - 3 months Nmillion 3 - 6 months Nmillion 6 - 12 months Nmillion 1 - 5 years Nmillion Over 5 years Nmillion Total Nmillion Performance bonds and financial guarantees 906 490 219 461 1,293 2 3,371 Contingent letters of credits 3,766 4,077 4,358 175 - - 12,376 Guaranteed commerical papers 451 - - - - - 451 Total 5,123 4,567 4,577 636 1,293 2 16,198 Liquidity contingency plans The bank recognises that it is not possible to hold sufficiently large enough quantity of readily available liquidity to cover the least likely liquidity events. However, as such event can have devastating consequences, it is imperative to bridge the gap between the liquidity the bank chooses to hold and the maximum liquidity the bank might need. The bank’s liquidity contingency plan is designed to, as far as possible, protect stakeholder interests and maintain market confidence in order to ensure a positive outcome in the event of a liquidity crisis. The plan incorporates an extensive early warning indicator methodology supported by a clear and decisive crisis response strategy. Early warning indicators span bank specific crises, systemic crises, contingency planning, and liquidity risk management governance and are monitored based on assigned frequencies and tolerance levels. The crisis response strategy is formulated around the relevant crisis management structures and addresses internal and external communications, liquidity generation, operations, as well as heightened and supplementary information requirements.
  • 147.
    Stanbic IBTC BankPLC Annual Report 2010 144 Annualreportand financialstatements Operational risk The operational risk and compliance committee (ORCC) serves as the oversight body in the application of the group’s risk management framework. This is achieved through enforcing standards for identification, assessing, controlling, monitoring and reporting. ORCC reviews and recommends operational risk appetite and tolerance to the executive committee and BRMC. Approach to managing operational risk The Stanbic IBTC approach to managing operational risk is to adopt practices that are fit for purpose, to increase the efficiency and effectiveness of the group’s resources, minimise losses and utilise opportunities. This approach is aligned to Stanbic IBTC’s and SBG’s enterprise risk management framework, policies, procedures and tools to identify, assess, monitor, control and report such risks as well as adopt sound practices recommended by various sources, including the Basel II Accord’s Sound Practices for the Management and Supervision of Operational Risk and the regulators. The group continues to embed operational risk management practices into its day-to-day business activities. Governance The board risk management committee (BRMC), as the delegated risk oversight body on behalf of the board, has the ultimate responsibility for operational risk management. It ensures quality, integrity and reliability of operational risk management across the group. Management and measurement of operational risk The operational risk management framework serves to ensure that risk owners are clearly accountable for the risk inherent within the business activities of the group. The key element in the framework includes methodologies and tools to identify, measure, and manage operational risks, a governance model, and processes to ensure internal training and awareness, communication, and change management. Risk and control self assessments are designed to be forward- looking. Management is required to identify risks that could threaten the achievement of business objectives and together with the required set of controls and actions, mitigate the risks. The loss data collection process ensures that all operational risk loss events and near misses are captured into a centralised database. The flow of information into the loss event database is a bottom-up approach. The capture process identifies and classifies all incidents in terms of an incident classification list. This information is used to monitor the state of operational efficiency, address trends, implement corrective action and manage recovery, where possible. The group uses key risk indicators (KRIs) to monitor the risks highlighted in the risk and control self-assessment (RCSA) process. The implementation of the KRIs is an integral element of the framework and is therefore compulsory throughout the group. Business units are required to report on a regular and event-driven basis. The reports include a profile of the key risk to the achievement of their business objectives, control issues of group-level significance, and operational risks events. The group maintains adequate insurance to cover key operational and other risks. Insurance is considered an effective tool for mitigating operational risks by reducing the economic impact operational losses, and therefore should have explicit recognition within the capital framework of the new Basel Capital Accord to appropriately reflect the risk profile of financial institutions and encourage prudent and sound risk management. Business continuity management (BCM) The group applies the SBG definition for BCM as a guide for developing its BCM programme. In line with this definition, the core focus in 2010 was to conduct a BCM simulation and test its ability of the crisis management team (CMT) to recover and restore total business operations in the event of unexpected operational disruptions or disasters as well as testing the recovery site infrastructure to determine its suitability for meeting its recovery objectives. A disaster simulation is a role play of the recovery plan and any associated processes and procedures that would be used in a real disaster. A scenario is defined, and each team member play out his/her role as defined in the recovery plan. The main objectives are to: • rehearse team members in the type of issues and problems that they will face in the event of a real disaster; • encourage staff from different functions to work together towards a common goal, relying on each other and learning about each other’s strengths and weaknesses; and” • realistically activate a disaster under a given scenario without necessarily interrupting business operations.
  • 148.
    145 Financial risk analysis Informationrisk management Information risk is defined as the risk of accidental or intentional unauthorised use, modification, disclosure or destruction of information resources, which compromises their confidentiality, integrity or availability. From a strategic perspective, information risk management is treated as a particular discipline within the operational risk framework. In essence, information risk management not only protects the group’s information resources from a wide range of threats, but also enhances business operations, ensures business continuity, maximises return on investments and supports the implementation of various services. The approach to the management of information risk in the group is in accordance with global best practice, applicable laws and regulations. The group has embarked on an enterprise-wide comprehensive awareness/education campaign to ensure that the culture of information protection is entrenched and the risks associated with handling information are mitigated. Fraud risk management Stanbic IBTC has a set of values that embraces honesty, integrity and ethics and, in this regard, has a “Zero Tolerance” approach to fraud and corruption. Where necessary, disciplinary, civil and criminal actions are taken against staff and third parties who perpetrate fraud; staff found guilty of dishonesty through the group’s disciplinary processes will be listed on appropriate industry databases of dismissed staff. The group’s forensic unit, which is responsible for fraud risk management practices, in conjunction with law enforcement agencies, investigates all losses incurred as a result of misconduct of staff and criminal intent of third parties with the end result being a criminal conviction and recovery of the crime proceeds. There are anti-fraud mechanisms and regular campaigns in place to mitigate fraud risk. These measures include constant review and re-engineering of the group’s internal processes, engagement of law enforcement agencies, industry forums and collaborative workshops to discuss best practices to combat fraud and group-wide fraud prevention incentive programme. Risk assurance The risk assurance (RA) function was established in response to regulatory (i.e. SARB) and business requirements, in order to give assurance on the level of adherence to policies, procedures and processes within the business units. The RA function was part of the operational risk management processes until November 2010. Effective December 2010, the RA function was merged with Internal Audit in line with the bank’s strategic plan to accord the function an independent status. Environmental risk management Stanbic IBTC acknowledges that the development of a corporate culture whereby environmental protection and the sound management of natural resources in both its own operating environment and with all the parties with which it has a business association is crucial to sustainable development. The bank adopts a precautionary approach to environmental management, striving to anticipate and prevent environmental risk degradation. The group’s approach is in line with the guidelines set out in the Equator Principles and the provisions of the environmental laws of the country. Legal risk management As a financial institution, the group remains vigilant of the potential loss that may be suffered as a result of the imposition of a court judgment, loss from a contract that cannot be legally enforced or liability suffered for damages to third parties. To mitigate the occurrence of these incidents, the group has a legal risk unit that works in conjunction with the legal department and which manages legal risk issues. The legal risk unit carries out, amongst others, the following functions as part of its legal risk management process: • ensuring that service level agreements (SLAs) are executed between the group and service providers; • reviewing and monitoring legal claims made against the group; and • obtaining legal opinion in respect of all the litigations that the group is involved in, to ascertain if there is a need for provision to be made in cases where the likelihood of success against the bank is high. Provision is made in all instances where the group is of the opinion that there is a likelihood that the legal claims instituted against it may succeed. As mitigants, the group encourages alternative dispute resolution mechanisms to avoid lengthy and time-consuming judicial process in order to speedily and amicably resolve otherwise difficult litigation. For the year ended 31 December 2010
  • 149.
    Stanbic IBTC BankPLC Annual Report 2010 146 Annualreportand financialstatements Compliance risk management Compliance risk management is an independent core risk management activity overseen by the group’s compliance unit, which is overseen by the chief compliance officer. The unit provides independent reports to the ORCC, EXCO and BRMC. The group chief compliance officer has unrestricted access to the chief executive officer and the chairperson of the board risk management committee. The group’s approach to managing legislative risk exposures is proactive and premised on internationally accepted principles of risk management. The group fosters a culture of compliance which is seen not only as a requirement of law but also a good business practice. Compliance unit is well positioned to guard against the risk of failure to comply with applicable laws, regulators, codes of conduct and standards of good practice, which may result in regulatory sanctions, financial or reputation loss. It focuses on ensuring that the group complies with laid down regulations that are applicable to its business and operations. The compliance risk function of the group carries out, amongst others, the following functions as part of its compliance risk management process: • maintain compliance risk management plans for at least 5 regulatory requirements that are rated highest in terms of their impact of the group’s business; • maintain an appropriate and relevant schedule of all the laws that are applicable to the group and circulate this to all the business units within the group; • liaise with regulators to co-ordinate inspections and examinations and ensure that findings contained in the inspection or examination reports are satisfactorily closed out; and • respond to regulatory requests for information and documents. In line with the foregoing responsibilities, the compliance unit ensures that recently enacted laws, regulations and circulars are obtained and circulated to all the relevant departments of the group to guide them appropriately. Furthermore, newly enacted laws are reviewed and included in the group’s regulatory schedule which contains the provisions of all the laws that are applicable to the group in its day-to-day activities. The regulatory schedule is circulated amongst business units accordingly for their guidance. The compliance unit serves as the interface between the bank and primary regulators during spot checks and routine examinations carried out by the regulators with the aim of ensuring that all issues raised by the regulators during the spot checks and routine examinations are properly addressed. In this regard, the compliance unit regularly interacts with different regulators and law enforcement agencies, such as the Nigerian Police; Nigerian Financial Intelligence Unit (NFIU); Economic and Financial Crimes Commission (EFCC); National Drug Law Enforcement Agency (NDLEA); Central Bank of Nigeria (CBN) and Nigeria Deposit Insurance Corporation (NDIC); Security and Exchange Commission (SEC), amongst others. Conflict of interest and personal account trading The group is highly committed to conducting business professionally, ethically, with integrity and in accordance with international best practice at all times. In line with its established framework and policy, conflict of interest situations are constantly identified and managed. In the course of the year, over three dozens of investment banking pipelines deals were cleared through SBG’s global conflict control room. In line with its personal account trading policy, personal trades carried out by members of staff on their individual stock holding through the group’s stockbroking subsidiary are reviewed regularly to ensure that staff have not traded on the shares of companies that they have material non-public price-sensitive information on by virtue of their jobs. Furthermore, all the senior management staff members including 131 embargoed and nominated employees were prohibited from trading on the group’s shares with effect from 1st December 2010 until the group’s annual financial results are formally announced to the public.
  • 150.
    147 Capital management Capitaladequacy The group manages its capital base to achieve a prudent balance between maintaining capital ratios to support business growth and depositor confidence, and providing competitive returns to shareholders. The capital management process ensures that each group entity maintain sufficient capital levels for legal and regulatory compliance purposes. The group ensures that its actions do not compromise sound governance and appropriate business practices and it eliminates any negative effect on payment capacity, liquidity and profitability. Capital adequacy ratio, which reflects the capital strength of an entity compared to the minimum regulatory requirements, is monitored daily by the management, essentially employing approaches based on the guideliens developed by the regulators for supervisory purposes. It is calculated by dividing the capital held by the bank by its risk-weighted assets. Risk weighted assets are determined by applying prescribed risk weighting to on and off balance sheet exposures according to the relative credit risk of the counterparty. The regulators require each bank to hold a minimum regulatory capital of N25 billion and maintain a minimum of 10% capital adequacy ratio. The required information is filed monthly with the Central Bank of Nigeria (CBN) while the group’s auditors are also required to render an annual certificate to the Nigerian Deposit Insurance Corporation (NDIC). In line with regulatory specification, the group’s regulatory capital is divided into two tiers: Tier 1 capital: share capital, retained earnings and reserves created by appropriations of retained earnings. Tier 2 capital: minority interest arising from consolidation, fixed asset revaluation reserves, foreign currency revaluation reserves and general provision subject to a maximum of 1.25% of risk assets. Investment in unconsolidated subsidiaries and associations are deducted from Tier 1 and 2 capital to arrive at the regulatory capital. For the year ended 31 December 2010 Financial risk analysis Money laundering control The group attaches utmost importance to ensuring that the know your customer (KYC), anti-money laundering (AML) and terrorist financing control legislations are strictly adhered to. These legislations impose certain obligations on the group such as ensuring that all customers of the group have passed through a KYC scrutiny; that necessary awareness is created amongst members of staff on KYC/AML/CFT issues; that records of customers and their transactions are kept for a five-year period as prescribed by law; and that certain threshold transactions are reported on a weekly basis including suspicious transactions. Key legislations and regulations that govern anti-money laundering are the Money Laundering (Prohibition) Act; Central Bank of Nigeria (CBN) KYC Regulation; various CBN circulars, and the Economic and Financial Crimes Commission (EFCC) Act. In accordance with the relevant provisions of the Money Laundering (Prohibition) Act, up to date training programmes are organised for the group’s employees regularly and over 80% employees of the group (including all customer facing employees) were trained in the course of the year. The trainings are normally carried out in an easy to understand manner that allows members of staff to have a good grasp of key issues such as KYC, money laundering, suspicious transactions and terrorist financing. Members of staff who are trained are required to write an on-line test to determine their level of understanding with the issues discussed during the training. All active accounts are categorised into categories A, B, and C for high, medium and low risk accounts respectively to allow for a risk based monitoring of customer accounts. As part of the commitment and resolve to combat the scourge of money laundering an automated anti-money laundering (AML) solution was upgraded in accordance with regulatory requirements in order to ensure that the process of identifying and capturing suspicious transactions is made more effective. This process enables the group to monitor transactions of customers that are viewed to be unusual on a continuous basis.
  • 151.
    Stanbic IBTC BankPLC Annual Report 2010 148 Annualreportand financialstatements The risk-weighted assets are measured by means of a hierarchy of five risk weights classified according to the nature of – and reflecting an estimate of credit, market and other risks associated with – each asset and counterparty, taking into account any eligible collateral or guarantees. A similar treatment is adopted for off balance sheet exposures, with some adjustments to reflect the more contingent nature of the potential losses. Capital management The table below summarises the composition of regulatory capital and the ratios of the group for the years ended 31 December. During those two years, the individual entities within the group and the group complied with all of the externally imposed capital requirements to which they are subject. Group 2010 Nmillion Group 2009 Nmillion Tier 1 capital: Share capital 9,375 9,375 Share premium 47,469 47,469 Statutory reserves 13,016 11,566 SMIEIS reserve 1,039 1,039 Capital Reserve 423 423 Retained earnings 12,335 10,608 Total qualifying Tier 1 capital 83,657 80,480 Tier 2 capital: Non-controlling interest 1,376 1,017 Revaluation reserve – investment securities 93 - General provision 1,783 1,160 Total qualifying Tier 2 capital 3,252 2,177 Total regulatory capital 86,909 82,657 Risk-weighted assets: On-balance sheet 256,769 210,102 Off-balance sheet 9,995 14,512 Total risk-weighted assets 266,764 224,614 Capital Adequacy Ratio (CAR) 32.58% 36.80% The decrease in capital adequacy ratio in 2010 is a reflection of the groups growth in risk assest as result of its expanding foot print across the federation. However, despite this decline the group remains well capitalized and the adequacy ratio of 32% remains in the excess of th regulatory requirement of 10%. Regulatory capital compliance The bank complied with minimum capital requirements imposed by the regulators during the period under review. Apart from the local requirements, the group is also required to comply with the capital adequacy requirement in terms of South African banking regulations measured on Basel II principles. This act of compliance coupled with the risk governance structure and implementation of ERM framework as well as collation of loss data, amongst others, have continued to reinforce the group’s readiness for a regulatory regime that is anchored on Basel II principles in the near future.
  • 152.
    149 2010 Group Nmillion % 2009 Group Nmillion % 2010 Bank Nmillion% 2009 Bank Nmillion % Gross earnings 56,745 59,781 48,934 52,850 Interest paid: - local (7,435) (14,709) (7,458) (14,766) - foreign (554) (1,104) (554) (1,104) (7,989) (15,813) (8,012) (15,870) Administrative overhead: - local (12,856) (10,731) (10,505) (8,958) - foreign (2,100) (1,212) (2,100) (1,212) (14,956) (11,943) (12,605) (10,170) Provision for losses (620) (4,858) (620) (4,858) Value added 33,180 100 27,167 100 27,697 100 21,952 100 Distribution Employees directors Salaries and benefits 15,618 47 14,256 53 13,792 50 12,542 57 Government Taxation 4,073 12 2,204 8 2,376 9 883 4 The Future Asset replacement (depreciation) 4,034 2,569 3,718 2,269 Expansion (retained in the business) 9,455 8,138 7,811 6,258 Total 13,489 41 10,707 39 11,529 41 8,527 39 33,180 100 27,167 100 27,697 100 21,952 100 Statement of value added For the year ended 31 December 2010
  • 153.
    Stanbic IBTC BankPLC Annual Report 2010 150 Annualreportand financialstatements Annualreportand financialstatements 150
  • 154.
    151 Group 2010 Nmillion Group 2009 Nmillion Group 2008 Nmillion Group 2007 Dec Nmillion Group 2007 Mar Nmillion Assetsemployed Cash and balances with central banks 10,048 7,772 11,587 13,038 10,832 Treasury bills 12,428 11,378 13,101 47,563 13,956 Due from other banks 88,659 76,954 111,593 79,579 46,873 Loans and advances to customers 163,952 110,508 98,398 79,465 36,607 Advances under finance lease 13,502 9,377 4,261 1,989 314 Investment securities 47,585 71,462 79,022 73,708 32,749 Investment in subsidiaries - 1 1 1 1 Deferred tax assets 939 594 - - - Other assets 16,176 25,566 17,331 10,978 2,860 Goodwill/ intangible asset - - - - 9,750 Equipment on lease - - - - 484 Property and equipment 31,252 26,878 15,432 8,662 6,217 384,541 340,490 350,726 314,983 160,643 Financed by Ordinary share capital 9,375 9,375 9,375 9,375 6,250 Reserves 74,375 71,105 71,289 66,188 44,696 Non-controling interest 1,376 1,017 711 455 184 Customer deposits 186,466 169,200 95,262 71,391 68,031 Due to other banks 56,152 38,334 82,202 67,298 5,840 Other borrowings 18,272 12,647 12,201 27,533 5,609 Other liabilities 34,220 34,052 73,487 66,660 27,040 Current income tax 4,197 4,660 5,821 5,641 2,213 Deferred tax liabilities 108 100 378 442 780 384,541 340,490 350,726 314,983 160,643 Acceptances and guarantees 14,861 16,198 50,861 56,259 5,688 Five year financial summary As at 31 December 2010
  • 155.
    Stanbic IBTC BankPLC Annual Report 2010 152 Annualreportand financialstatements Bank 2010 Nmillion Bank 2009 Nmillion Bank 2008 Nmillion Bank 2007 Dec Nmillion Bank 2007 Mar Nmillion Assets employed Cash and balances with central banks 10,048 7,768 11,441 13,036 10,831 Treasury bills 12,428 11,378 13,101 47,563 13,956 Due from other banks 87,439 75,913 110,159 71,800 46,090 Loans and advances to customers 164,203 110,967 99,010 79,636 35,590 Advances under finance lease 13,502 9,377 4,261 1,989 314 Investment securities 37,689 62,358 73,443 68,831 28,544 Investment in subsidiaries 1,924 1,925 1,819 554 511 Deferred tax assets 939 594 - - - Other assets 13,683 24,453 17,067 12,640 4,723 Goodwill/ intangible asset - - - - 9,750 Equipment on lease - - - - 484 Property and equipment 30,757 26,267 14,905 8,345 5,958 372,612 331,000 345,206 304,394 156,751 Financed by Ordinary share capital 9,375 9,375 9,375 9,375 6,250 Reserves 68,184 65,998 67,240 63,047 42,358 Non-controling interest - - - - - Customer deposits 187,595 170,411 98,914 72,455 72,896 Due to other banks 56,152 38,334 82,202 66,852 5,840 Other borrowings 18,272 12,647 12,201 27,533 5,609 Other liabilities 30,983 31,319 71,797 61,468 22,082 Current income tax 2,051 2,916 3,240 3,613 1,334 Deferred tax liabilities - - 237 51 382 372,612 331,000 345,206 304,394 156,751 Acceptances and guarantees 14,861 27,834 50,861 56,259 5,688
  • 156.
    153 Group 2010 Nmillion Group 2009 Nmillion Group 2008 Nmillion Group 2007 Dec Nmillion Group 2007 Mar Nmillion Profitand loss account Net operating income 48,394 43,823 42,495 22,480 15,877 Operating expenses and provisions (34,866) (33,481) (27,870) (11,488) (8,442) Profit/(loss) before tax 13,528 10,342 14,625 10,992 7,435 Taxation (4,073) (2,204) (2,632) (3,142) (1,673) Profit after taxation 9,455 8,138 11,993 7,850 5,762 Non-controlling interest (653) (490) (430) (265) (58) Profit attributable to the group 8,802 7,648 11,563 7,585 5,704 Transfer to reserves 8,802 7,648 11,563 7,585 5,704 Statistical information Gross interest margin % 77 61 55 61 58 % Shareholders’ funds /total assets 22 24 23 24 27 % Loans and overdrafts/total assets 43 32 28 25 24 % Loans and overdrafts/deposits 88 65 103 111 54 % Provision/Loans and overdrafts 5 10 10 13 19 Earnings per share (EPS) - actual 50 k 43 k 64 k 42 k 46 k Earnings per share (EPS) - basic 50 k 43 k 64 k 71 k 47 k Earnings per share (EPS) - adjusted 50 k 43 k 64 k 42 k 31 k Earnings per share (EPS) - diluted 50 k 43 k 64 k 42 k 46 k Average number of employees 2,248 2,009 1,659 1,202 931 Five year financial summary For the year ended 31 December 2010
  • 157.
    Stanbic IBTC BankPLC Annual Report 2010 154 Annualreportand financialstatements Bank 2010 Nmillion Bank 2009 Nmillion Bank 2008 Nmillion Bank 2007 Dec Nmillion Bank 2007 Mar Nmillion Profit and loss account Net operating income 40,627 36,835 35,087 18,734 12,991 Operating expenses and provisions (30,440) (29,694) (24,545) (9,937) (6,806) Profit/(loss) before tax 10,187 7,141 10,542 8,797 6,185 Taxation (2,376) (883) (1,328) (1,855) (822) Profit after taxation 7,811 6,258 9,214 6,942 5,363 Non-controlling interest - - - - - Profit attributable to the group 7,811 6,258 9,214 6,942 5,363 Transfer to reserves 7,811 6,258 9,214 6,942 5,363 Statistical information Gross interest margin % 76 60 54 61 59 % Shareholders’ funds /total assets 21 23 22 24 26 % Loans and overdrafts/total assets 44 33 29 26 24 % Loans and overdrafts/deposits 88 65 100 110 49 % Provision/Loans and overdrafts 5 10 9 13 19 Earnings per share (EPS) - actual 42 k 33 k 49 k 37 k 43 k Earnings per share (EPS) - basic 42 k 33 k 49 k 63 k 44 k Earnings per share (EPS) - adjusted 42 k 33 k 49 k 37 k 29 k Earnings per share (EPS) - diluted 42 k 33 k 49 k 37 k 43 k Average number of employees 1,948 1,722 1,343 1,071 874
  • 159.
    Stanbic IBTC BankPLC Annual Report 2010 156 Other Information 152 Otherinformation Management team Branch network Contact information 157 162 166
  • 160.
    157 Management team 1 4 2 5 3Wole Adeniyi Businesssupport 6 Aishah Ahmad Private client services Barene Beard Marketing Adesola Adegbesan Global markets Abas Alhassan Internal audit Bimbo Ashiru Corporate affairs corporate social investments 1 4 2 5 3 6
  • 161.
    Stanbic IBTC BankPLC Annual Report 2010 Otherinformation 7 10 8 11 9 12Francois Fourie PBB Branch expansion and self service channels Eric Fajemisin Investment management Mathys Buitendag Business banking Fatai Baruwa Payment strategy Sola Mahoney Financial institutions 7 10 8 11 9 12 Mike McMullen Project management office 158 Otherinformation
  • 162.
    159 13 16 14 17 15 18 Patrick Mgbenwelu Project finance Managementteam Andrew Mashanda Transactional products services Akeem Oyewale Stanbic IBTC Stockbroking Limited Yewande Sadiku Investment banking Olumide Oyetan Stanbic IBTC Asset Management Limited Anne Rinu Premises and projects 13 16 14 17 15 18
  • 163.
    Stanbic IBTC BankPLC Annual Report 2010 160 Otherinformation 19 22 20 23 21 24 Segun Sanni Investor services Alubani Sibanda Corporate banking Delein Van Schallkwyk Operations John Smit Personal banking Babayo Saidu Agriculture sharia banking 19 22 20 23 21 24 Olufemi Solomon PBB sales service support
  • 164.
    161 25 26 27 Managementteam Hentie Stemmet Vehicle and asset finance Dele Sotubo Stanbic IBTC Stockbroking Ltd 25 26 27 Louis Lehmann Information technology
  • 165.
    Stanbic IBTC BankPLC Annual Report 2010 162 Otherinformation Branch network FCT ABUJA REGION 1. Ahmadu Bello Way branch Plot 1049, Ahmadu Bello Way Area 11, Garki, Abuja 2. Deidei branch Deidei-Gwaga road Deidei Abuja 3. Edo House branch No. 75, Ralph Sodeinde street Central Business District Garki, Abuja 4. Garki, Area 7 branch Plot 593, Area 7, Ringim close Abuja 5. Garki Model Market branch Plot CBN 2 Ladoke Akintola bvld Garki 11, Abuja 6. Kubwa branch Plot No. CM71/72 Gado Nasko road Kubwa, Abuja 7. Maitama branch Plot 2777, Cadastral Zone A6 Maitama District, Abuja 8. Mararaba branch Shop 1A Kwad Shopping Complex Mararaba Gurku, Abuja LAGOS ISLAND REGION 1. Adetokunbo Ademola branch No. 76, Adetokunbo Ademola street, Victoria Island, Lagos 2. Afribank Street branch Churchgate Towers, Plot 30, Afribank street Victoria Island, Lagos 3. Ajah branch Mega Wave Plaza, 4A Addo roundabout, Off Badore road, Ajah, Lagos 4. Awolowo Road branch No. 85, Awolowo road, Ikoyi Lagos 5. Federal Palace Hotel branch Ahmadu Bello way Victoria Island, Lagos 6. Head office branch IBTC Place, Walter Carrington Crescent, Victoria Island, Lagos 7. Idejo branch Plot 1712, Idejo street Victoria Island, Lagos 8. Idumagbo branch No. 16, Idumagbo Avenue Lagos 9. Ikota branch Shop 167-194, Block 1, Ikota Shopping Complex Ajah, Lagos 10. Karimu Kotun branch Plot 1321B, Karimu Kotun street, Victoria Island, Lagos 11. Lekki-Ajah Expressway branch Km 18, Lekki-Epe Expressway, Agungi, Lekki, Lagos 12. Lekki Phase 1 branch The Palms Shopping Complex, Lekki, Lagos 13. Martins Street branch No. 19, Martins Street Lagos 14. Muri-Okunola branch Plot 226A, Muri Okunola street, Victoria Island, Lagos 15. Offin branch No. 25, Offin road, Apongbon Lagos 16. Oke Arin branch 120, Alakoro Street, Oke Arin, Lagos Island, Lagos LAGOS MAINLAND REGION-1 1. Alausa branch WAPCO Building, Alausa Ikeja, Lagos 2. Agege branch 173, Old Abeokuta motor road, Agege, Lagos 3. Allen Avenue branch No. 80, Allen Avenue Ikeja, Lagos 4. Awolowo Model Market branch Shop M1/M48 Awolowo Ultra Modern market, Mushin, Lago 5. Daleko branch Bank road, Daleko market, off Isolo road Mushin, Lagos 6. Egbeda branch 38, Shasha road Egbeda, Lagos 7. Ikorodu branch No. 108, Lagos road Ikorodu, Lagos 8. Ketu branch 463, Ikorodu road Ketu, Lagos 9. Murtala Mohammed International Airport branch Arrival hall, MMIA Ikeja, Lagos 10. Oba Akran branch No. 20, Oba Akran Avenue Ikeja, Lagos 11. Ogba branch No. 32, Ijaiye road Ogba, Lagos 12. Ojuwoye branch No. 214, Agege motor road, Ojuwoye, Mushin, Lagos 13. Oko-Oba branch Abattoire Market, New Oko Oba Agege, Lagos 14. Opebi branch No. 43, Opebi road Ikeja, Lagos 15. Oshodi branch 6/8 Brown street, Oshodi market Lagos 16. Palms Avenue branch 103, Ladipo street Mushin, Lagos 17. Toyin street branch No. 36A, Toyin street Ikeja, Lagos
  • 166.
    163 Branch network LAGOS MAINLANDREGION-2 1. Ajegunle branch No. 11, Orodu street Ajegunle, Lagos 2. Akoka branch No. 100, St. Finbarr’s road Akoka, Lagos state 3. Alaba branch H48/H49, Alaba international market Ojo, Lagos 4. Balogun Business Association branch Executive plaza, No.12, BBA market, Trade fair complex Badagry, Lagos 5. Ejigbo branch Isolo ikotun road Ejigbo, Lagos 6. Festac branch Gacoun shopping plaza, 23 road, off 2nd avenue Festac town, Lagos 7. Herbert Macaulay branch No. 220, Herbert Macaulay way Yaba, Lagos 8. Igando branch No. 51, Lasu-Iba road Igando, Lagos 9. Gbaja market branch No. 12, Gbaja market Surulere, Lagos 10. Lawanson branch 35, Lawanson road Lawanson, Lagos 11. Nigeria Ports Authority branch Account block, NPA Wharf road, Apapa, Lagos 12. Oyingbo branch 7, Coates street, Ebute metta, Oyingbo, Lagos 13. Surulere branch No. 39, Adeniran ogunsanya street Surulere, Lagos 14. Tejuosho branch No. 77, Ojuelegba road Yaba, Lagos 15. Tin can branch Suite 7 27, container complex Lagos 16. Trade fair branch International trade fair complex, ASPAMDA plaza Alaba, Lagos 17. Warehouse road branch No. 10/12, Warehouse road Apapa, Lagos 18. Yinka folawiyo branch No. 38, warehouse road, Folawiyo plaza Apapa, Lagos NORTH EAST REGION 1. Bauchi branch No. 16, Yandoka road Bauchi state 2. Damaturu branch Plot 591A, Njiwaji layout Damaturu, Yobe state 3. Gombe branch No. 1, Biu road Gombe state 4. Maiduguri branch No. 38, Baga road Maiduguri, Borno State 5. Yola branch No. 1, Muhammad Mustapha way, Jimeta, Yola, Adamawa State NORTH CENTRAL REGION 1. Gboko branch Along Captain Downs street Gboko, Benue State 2. Illorin branch 11, Unity road (Amosun House), Illorin, Kwara state 3. Jos branch No.34, Ahmadu Bello way Jos, Plateau state 4. Kontagora branch Lagos-Kaduna road Kontagora Niger State 5. Lokoja branch IBB Way, Opposite new Specialist Hospital Lokoja, Kogi State 6. Makurdi branch No.12, Ali Akilu road Makurdi, Benue state 7. Minna branch Paiko road, Minna Niger State 8. Suleja branch Minna road, Opposite Forec A Division, Suleja Niger State
  • 167.
    Stanbic IBTC BankPLC Annual Report 2010 164 Otherinformation NORTH WEST REGION 1. Bello road branch No. 13, Bello road, Kano Kano state 2. Birnin-Kebbi branch No. 68, Ahmadu Bello Way Birnin-Kebbi, Kebbi state 3. Dutse branch Plot 14/15, Sanni Abacha Way Dutse, Jigawa state 4. Gusua branch No. 10 Sanni Abacha road Gusua, Zamfara state 5. Hotoro market branch No. 4 Maiduguri road, Kano Kano state 6. Jalingo branch 22, Hammaruwa Way, Jalingo Taraba State 7. Kachia road branch No. 7A, Kachia road, Kaduna south Kaduna state 8. Kaduna branch No. 14, Ahmadu Bello Way, Kaduna, Kaduna state 9. Kaduna Central Market branch No. 001 Bayajida road, Central Market, Kaduna North, Kaduna state 10. Kasuwa Barci branch AH6 Kasuwa Barci, Tundun Wada Kaduna, Kaduna state 11. Katsina branch No. 175, Kurfi House, IBB Way Katsina, Katsina state 12. KSC Bank road branch No. 4 Bank Road, Kano, Kano state 13. Lafia branch Plot 1 Jos road, Lafia Nasarawa state 14. PPMC/NNPC branch Kaduna Refining and Petrochemical complex Sabon Tasha road, Kaduna South Kaduna state 15. Sabon Gari branch No. 4A, Galadinma road, Sabon Gari, Kano, Kano state 16. Sabon Tasha branch No. 32, Kachia road, Sabon Tasha Kaduna, Kaduna state 17. Samaru branch 2 Sokoto road, Samaru Zaria, Kaduna state 18. Shauchi branch 1, Rimi Quarters, Umma Bayero road Kano, Kano state 19. Sokoto branch No. 8, Maiduguri road Sokoto, Sokoto state 20. Zaria branch No. 9, Kaduna road Zaria, Kaduna state 21. Zaria City branch No. 90 Anguwan, Mallam Sule Kasuwa Zaria, Kaduns State SOUTH-EAST REGION 1. Aba Main branch No. 7, Aba-Owerri road Abia state 2. Aba Market branch No. 7, Duru Street, off Cemetry road Aba, Abia state 3. Ariaria Market branch 189 Faulks road, Ariaria market, Aba, Abia state 4. Awka branch No. 49, Zik avenue Awka, Anambra state 5. Enugu branch No. 252, Ogui Road Enugu, Enugu state 6. Head-bridge branch No. 56, Port Harcourt road, Onitsha, Anambra state 7. Onitsha branch No. 13, Bright street Onitsha, Anambra state 8. Owerri branch No. 8, Wetheral road Owerri, Imo state
  • 168.
    165 Branch network SOUTH-SOUTH REGION 1. Asaba branch No. 206, Nnebisi street Asaba, Delta state 2. Benin branch No. 71, Akpakpava street Benin, Edo state 3. Calabar branch No. 71, Ndidem Isong road Calabar, Cross River state 4. Eleme Petrochemical branch EPCL Complex Port Harcourt, Rivers state 5. Ikom branch 28, Calabar road Ikom, Cross River state 6. Olu Obasanjo branch No. 133A, Olu Obasanjo road Port Harcourt, Rivers state 7. Olu Obasanjo road branch No. 58, Olu Obasanjo Road Port Harcourt, Rivers state 8. Port Harcourt Airport branch International Airport, Port Harcourt Rivers state 9. Sapele road branch No. 131A Sapele road Benin, Edo state 10. Trans Amadi branch No. 7, Trans Amadi road, Port Harcourt, Rivers state 11. Uyo Branch No. 5B, Nwaniba road Uyo, Akwa Ibom state 12. New Benin branch 136, Upper Mission road, New Benin market Benin, Edo state 13. Warri branch 84, Warri-Sapele road Warri, Delta state 14. WATT Market branch CITA House Complex, 54 Bedwell street Calabar, Cross River state 15. Yenagoa branch No. 623, Mbiama-Yenagoa road Yenagoa, Bayelsa state 16. Mokola branch No. 18B, Oyo road, Mokola, Ibadan Oyo state 17. New Gbagi Market branch Bashmur Ayimur Plaza Old Ife road, Gbagi, Ibadan, Oyo state 18. Orita Challenge branch No 127 Orita challenge Ibadan, Oyo state 19. Oshogbo branch No. 201, Gbogan/Ibadan road Oshogbo, Osun state 20. Oyo Town branch Oyo- Ogbomosho road, beside Oyo East Local Government Secretariat Oyo Town, Oyo state 21. Ring road branch 18, Moshood Abiola Way, Ring road, Ibadan Oyo state 22. Sagamu branch 167, Akarigbo street Sagamu, Ogun state 23. Saki branch Sango-Ajegunle road (beside Saki West Local Government secretariat) Saki, Oyo state 24. Sango-Otta branch No. 101, Idi-iroko/Otta road Sango –Otta, Ogun state 25. Sapon branch House 42a, Isale Igbehin Sapon Abeokuta Ogun state SOUTH WEST REGION 1. Abeokuta branch No. 2A, Lantoro road, Isale-Ake, Abeokuta, Ogun state 2. Ado –Ekiti branch Ado/Iyin express (old secretariat) rd Ado- Ekiti, Ekiti state 3. Agbara branch Agbara Estate Shopping Mall Agbara, Ogun state 4. Agodi Gate branch Inaolaji Business Complex Agodi Gate, Ibadan Oyo state 5. Akure branch Great Nigerian Insurance House Owo/Ado Ekiti road Akure, Ondo State 6. Aleshinloye branch Shop 37-39, Nigerian Army Post Service Housing Scheme, Phase 2 Eleyele road, Ibadan Oyo state 7. Apata branch Abeokuta-Ibadan road Apata, Ibadan Oyo state 8. Bodija market branch Trans Wonderland, Opposite Bodija market Secretariat road, Bodija Ibadan, Oyo state 9. Gbagi branch No. 15, Jimoh Odutola street Ogunpa/Dugbe Ibadan, Oyo state 10. Ibadan Main branch UCH/Secretariat road Total Garden, Ibadan Oyo state 11. Ife branch No. 5 Obalofun Lagere road Lagere junction, Ile–Ife Osun state 12. Ijebu-Ode branch 58 Ibadan road, Ijebu-Ode, Ogun state 13. Ilesha branch A198 Oshogbo road, Ishokun, Ilesha Osun state 14. Iwo road branch 32 Iwo road, (beside Tantalizers) Ibadan, Oyo state 15. Iyana Church branch Ibitola Plaza, Iyana Church Ibadan, Oyo state
  • 169.
    Stanbic IBTC BankPLC Annual Report 2010 166 Contact information Chief financial officer Ronald Pfende Tel: +234 1 4488900 e-mail : ronald.pfende@stanbic.com Company secretary Angela Omo-Dare Tel: +234 1 4488900 e-mail: angela.omo-dare@stanbic.com Head, investor relations Oluwatosin Odutayo Tel: +234 1 4488900 e-mail: oluwatosin.odutayo@stanbic.com 25 Subsidiaries Stanbic IBTC Asset Management Ltd. Stanbic IBTC Ventures Ltd. Stanbic IBTC Pension Managers Ltd. Stanbic Nominees (Nigeria) Ltd. R.B. Resources Ltd. (deregistered on 26 April 2010) Stanbic IBTC Stockbrokers Ltd. Stanbic IBTC Trustees Ltd. Overseas correspondent banks Standard Bank of South Africa Standard Bank London Standard Chartered Bank Citibank HSBC ANZ Deutsche Bank SEB UBA NY Registered address head office Stanbic IBTC Bank PLC I.B.T.C. Place Walter Carrington Crescent P. O. Box 71707 Victoria Island Lagos, Nigeria Telephone: +234 (1) 2712400 Swift: SBICNGLX Facsmile: +234 (1) 2626541/2 E-Mail: info@stanbic.com Web: www.stanbicibtcbank.com e-mail: investor.relations@stanbic.com Otherinformation
  • 170.
  • 171.
    Stanbic IBTC BankPLC Annual Report 2010 168 Otherinformation Notes
  • 172.
    www.stanbicibtcbank.com Produced by CreativeInterpartners, London Email: ci@creativeinterpartners.co.uk Photography by Jonathan Kennedy