Downloaded 51 times


![Corporate review Governance and strategy Financial statements Information
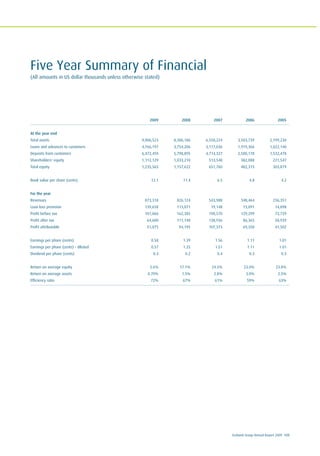
124 Ecobank Group Annual Report 2009
Notes to Consolidated Financial Statements (continued)
(All amounts in US dollar thousands unless otherwise stated)
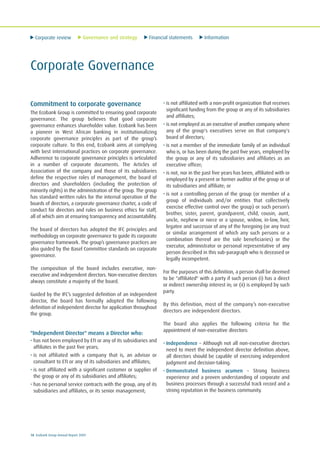
42. Related party transactions (continued)
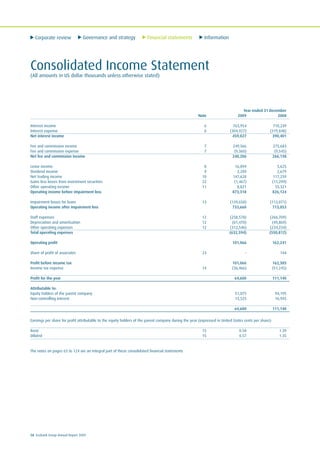
Year ended 31 December
Directors’ remuneration 2009 2008
Total remuneration of the directors 2,533 4,181
A listing of the members of directors of the Board of Directors is shown on [pages 10 to 14] of the Annual Report.
Key management compensation
Salaries and other short term benefits 1,008 2,981
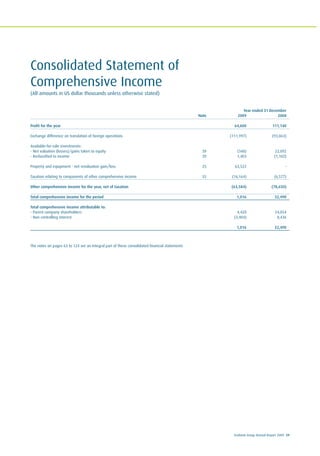
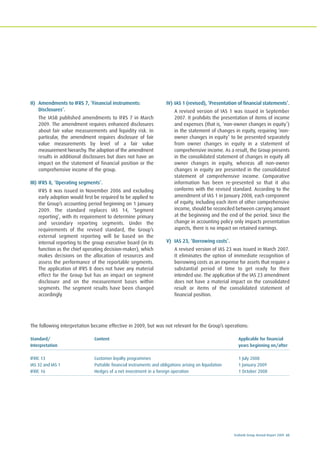
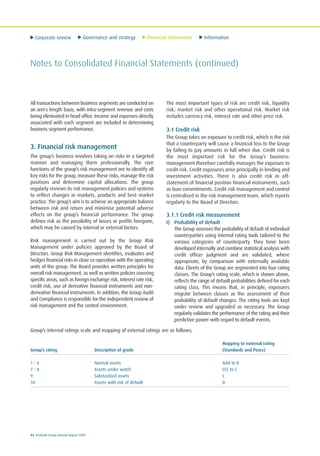
43. Major business acquisitions
In January 2009, the Group completed the acquistion of 90% of the share capital of Banque Agricole, Commecial de Burkina (BACB). The acquired bank
contributed operating income and profit before tax of US$11.1m and US$2.1m respectively to the group for the period ending 31 December 2009.
The details of the fair value of the assets and liabilities acquired and goodwill arising are as follows:
BACB
Fair value on Acquiree's previous
date of Acquisition carrying value
01 January 2009 31 December 2009
Cash and cash equivalent 21,533 21,533
Loans and advances to customers 12,193 12,193
Investment securities 135,005 135,005
Property, plant and equipment 21,019 21,019
Other assets 6,325 6,325
Deposit from banks (23,833) (23,833)
Deposit from customers (132,223) (132,223)
Other borrowed funds (15,984) (15,984)
Other liabilities (5,386) (5,386)
Net assets value 18,649 18,649
Less minority interest (1,865)
Net assets acquired 16,784
Cost of acquisition (discharged by cash) 17,353
Net assets acquired 16,784
Goodwill (Note 24) 569
Cost of acquisition (discharged by cash) 17,353
Cash and cash equivalents in subsidiaries acquired 21,533
Net cash flow 4,180
The goodwill is attributable to the high profitability of the acquired business and the significant synergies expected to arise.
44. Events after the balance sheet date
A new subsidiary, Ecobank Tanzania commenced operations in January 2010. Ecobank Tanzania is a wholly owned subsidiary of the company.
In January 2010, the board of directors approved implementation of a new structure for the group. This new structure which is based on business is to replace
the existing geography based structure.](https://image.slidesharecdn.com/hdklwhilqie4kb5jxgyz-140629214241-phpapp01/85/Ecobank-annual-report-2009-124-320.jpg)


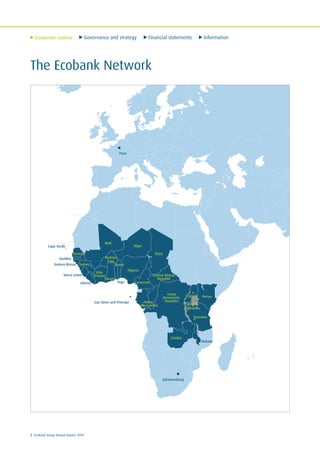
The document is Ecobank Group's 2009 Annual Report. It summarizes that in 2009, Ecobank expanded its operations to 29 countries in Africa and opened an office in Paris, France. While total assets grew 8% to $9 billion and revenues increased 6% to $873 million, profit before tax declined 38% to $101 million due to losses from new subsidiaries and deterioration in the Nigerian banking sector. The Chairman addresses the challenges of 2009 and outlines changes to improve performance, such as a strategic review that implemented a more efficient operating structure.


