Downloaded 59 times


![Access Bank Plc
Annual Report and Accounts 2010
32
identified, measured, monitored and controlled in order to
minimise adverse outcomes.
The division is complemented by the financial control and
regulatory/reputation risk group in the management of strategic
and reputational risks respectively.
The Chief Risk Officer coordinates the process of monitoring and
reporting risks across the Bank. Internal audit has the responsibility
of auditing the risk management and control function to ensure
that all units charged with risk management perform their roles
effectively on a continuous basis. Audit also tests the adequacy of
internal control and makes appropriate recommendations where
there are weaknesses.
Strategy and business planning
Risk management is embedded in our business strategy and
planning cycle. Testament to this is the inclusion of risk management
as one of our strategic priorities. By setting the business and risk
strategy, we are able to determine appropriate capital allocation and
target setting for the Bank and each of our businesses.
All business units are required to consider the risk implications of
their annual plans. These plans include analysis of the impact of
objectives on risk exposure. Throughout the year, we monitored
business performance regularly focusing both on financial
performance and risk exposure. The aim is to continue the
process of integrating risk management into the planning and
management process and to facilitate informed decisions.
Through ongoing review, the links between risk appetite, risk
management and strategic planning are embedded in the business
so that key decisions are made in the context of the risk appetite
for each business unit.
Risk appetite
Risk appetite is an articulation and allocation of the risk capacity
or quantum of risk Access Bank is willing to accept in pursuit of
its strategy, duly set and monitored by the Executive Committee
and the Board, and integrated into our strategy, business, risk and
capital plans. Risk appetite reflects the Bank’s capacity to sustain
potential losses arising from a range of potential outcomes under
different stress scenarios.
The Bank defines its risk appetite in terms of both volatility of
earnings and the maintenance of minimum regulatory capital
requirements under stress scenarios. Our risk appetite can be
expressed in terms of how much variability of return the Bank is
prepared to accept in order to achieve a desired level of result. It is
determined by considering the relationship between risk and return.
We measure and express risk appetite qualitatively and in terms of
quantitative risk metrics. The quantitative metrics include earnings
at risk (or earnings volatility) and, related to this, the chance of
regulatory insolvency, chance of experiencing a loss and economic
capital adequacy. These comprise our group-level risk appetite
metrics. In addition, a large variety of risk limits, triggers, ratios,
mandates, targets and guidelines are in place for all the financial
risks (eg credit, market and asset and liability management risks).
The Bank’s risk profile is assessed through a ‘bottom-up’ analytical
approach covering all major businesses, countries and products.
The risk appetite is approved by the Board and forms the basis for
establishing the risk parameters within which the businesses must
operate, including policies, concentration limits and business mix.
In 2010, we sought to enhance the consolidation, focus and
reporting of the key financial risk appetite metrics, and the cascade
from group level down to business unit and monoline level.
Accordingly, we established an enhanced suite of base case
[through-the-cycle (TTC)] risk appetite metrics and incorporated
these within the 2011–2016 business plans. Stressed (extreme
event) risk appetite metrics, linked to our stress- and scenario-
testing programme, will be finalised in 2011. Access Bank has
cultivated and embedded a prudent and conservative risk appetite,
focused on the basics and core activities of banking.
Risk management objectives
The broad risk management objectives of the Bank are:
• To identify and manage existing and new risks in a planned
and coordinated manner with minimum disruption and cost;
• To protect against unforeseen losses and ensure stability of
earnings;
• To maximise earnings potential and opportunities;
• To maximise share price and stakeholder protection;
• To enhance credit ratings and depositor, analyst, investor and
regulator perception; and
• To develop a risk culture that encourages all staff to identify
risks and associated opportunities and to respond to them
with cost effective actions.
Scope of risks
The scope of risks that are directly managed by the Bank are as
follows:
• Credit risk
• Operational risk
• Market and liquidity risk
• Legal and compliance risk
• Strategic risk
• Reputational risk
• Capital risk.
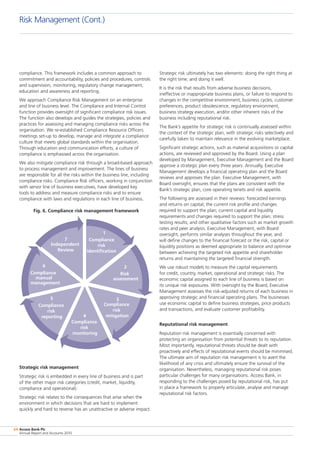
These risks and the framework for their management are detailed
in the enterprise risk management framework.
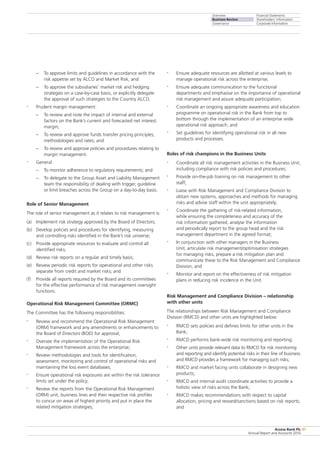
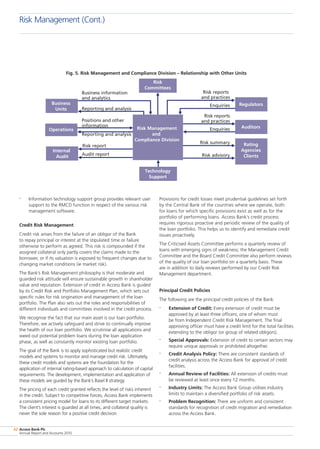
Responsibilities and functions
The responsibilities of the Risk Management and Compliance
division, the Financial Control and Strategy Group, Regulatory/
Reputation Risk Group with respect to risk management, are
highlighted opposite. The responsibilities of the Regulatory/
Reputational Risk Group are not included:
Risk Management (Cont.)](https://image.slidesharecdn.com/vcbm09siqnyw3cbuimhb-140629214233-phpapp02/85/Access-bank-annual-report-2010-34-320.jpg)
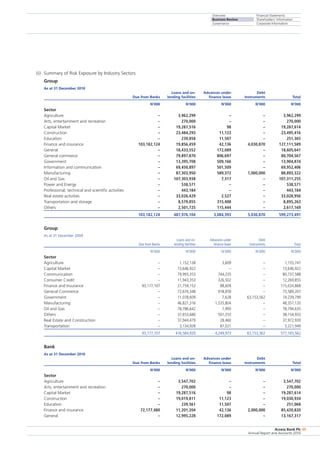
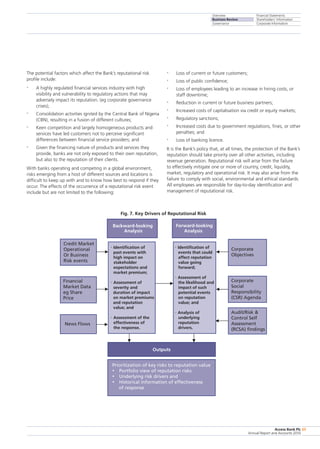


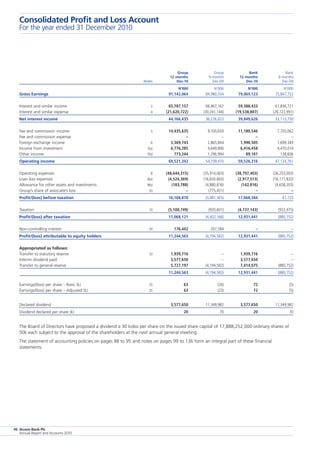
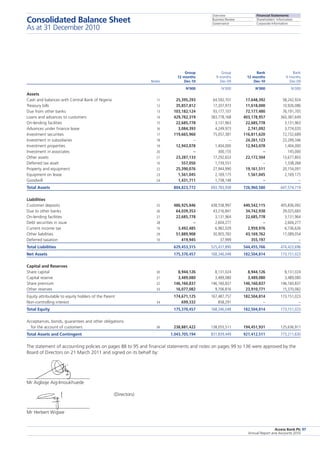


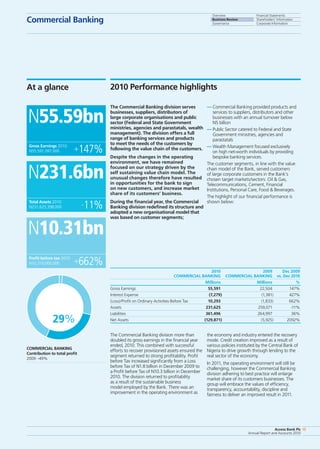
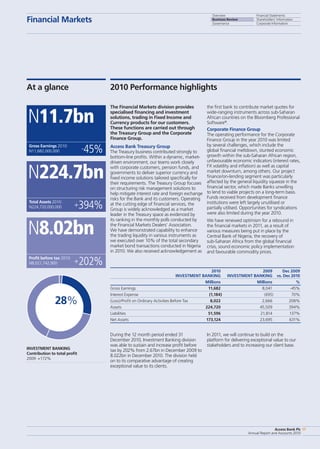
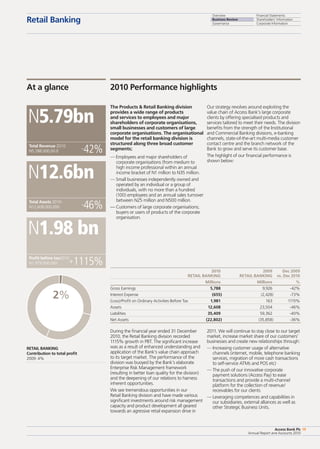
- Access Bank Plc is a leading Nigerian bank with operations across Nigeria and 8 other African countries, as well as the UK. - In 2010, the bank recorded a 564% increase in profit before tax to N16.1 billion, up from N3.48 billion in 2009, driven by strong performance from its Nigerian operations. - The bank has five major business segments: institutional banking, commercial banking, investment banking, retail banking, and transaction services. It serves over 2 million customers through 148 branches across its markets.


