Download as PDF, PPTX


![7
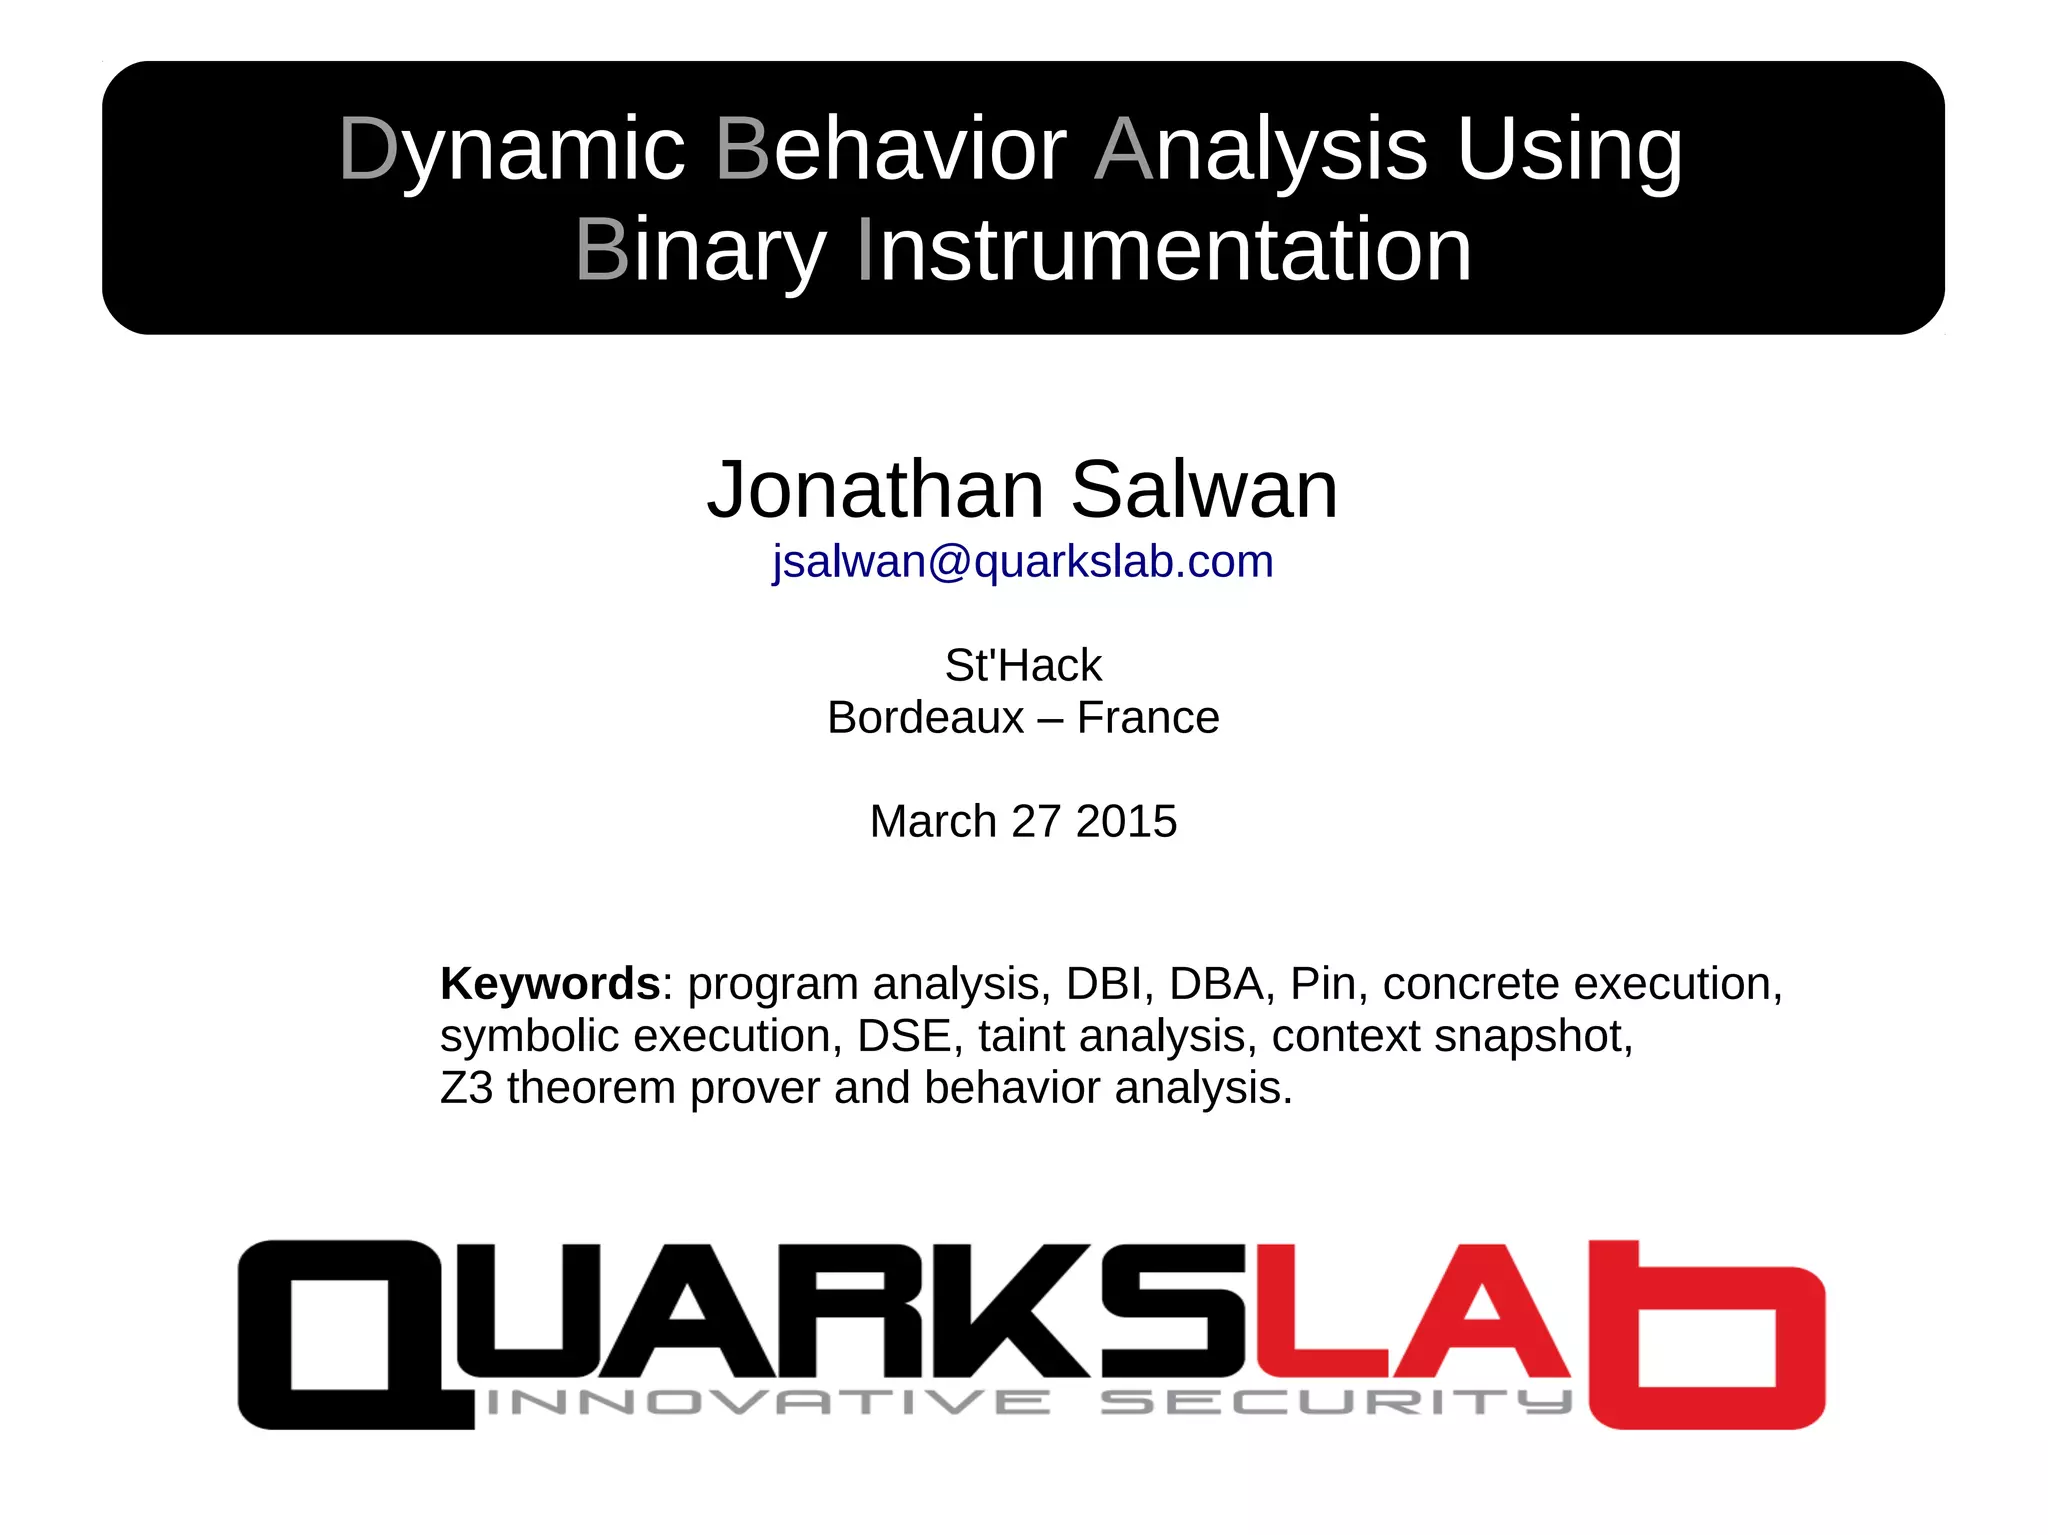
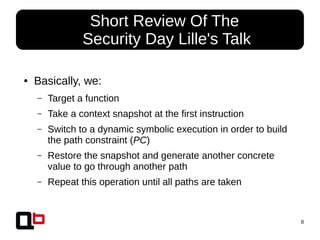
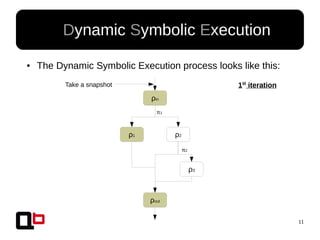
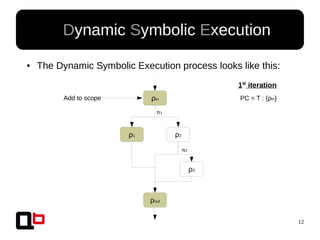
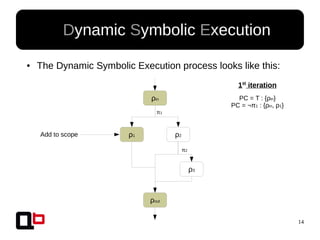
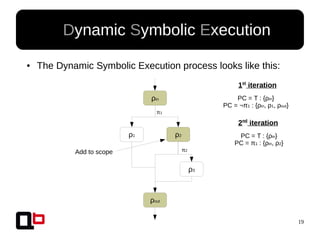
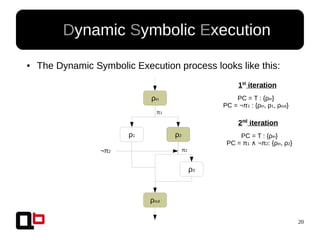
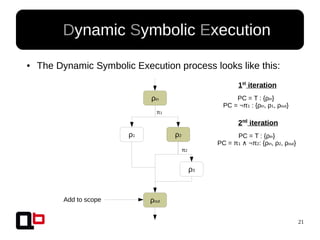
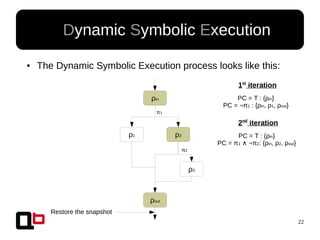
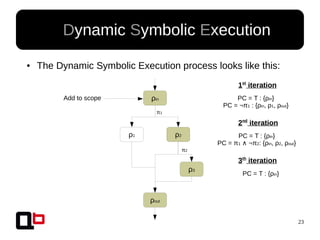
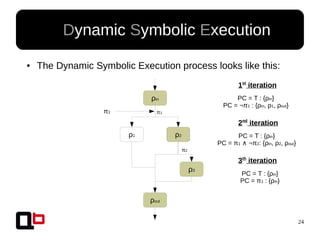
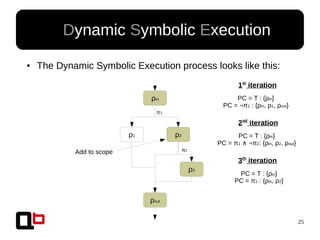
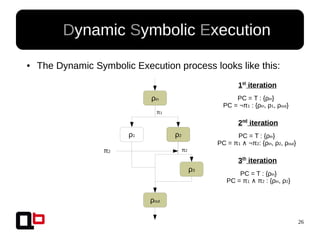
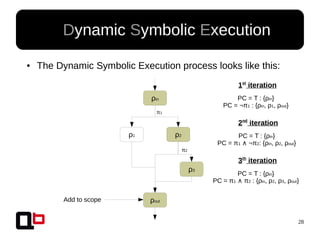
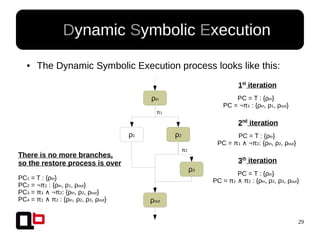
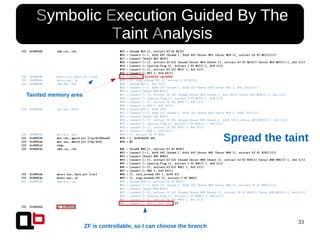
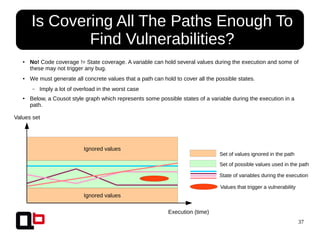
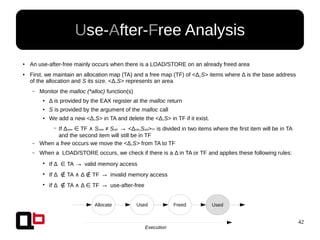
● In the last talk [0], we saw how it was possible to
cover a function in memory using a dynamic
symbolic execution approach
– We generate and inject concrete values in
memory in order to go through all paths
● Short Review Of The
Security Day Lille's Talk
[0] http://shell-storm.org/talks/SecurityDay2015_dynamic_symbolic_execution_Jonathan_Salwan.pdf](https://image.slidesharecdn.com/sthack2015-dynamic-behavior-analysis-using-binary-instrumentation-jonathan-salwan-150330060900-conversion-gate01/85/Sthack-2015-Jonathan-JonathanSalwan-Salwan-Dynamic-Behavior-Analysis-Using-Binary-Instrumentation-7-320.jpg)


![47
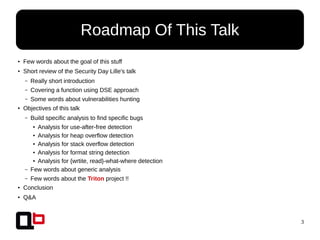
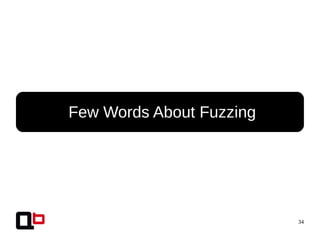
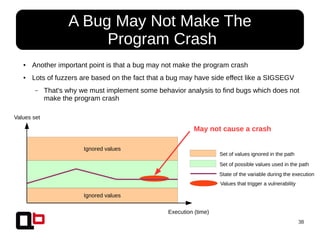
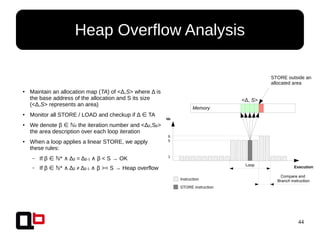
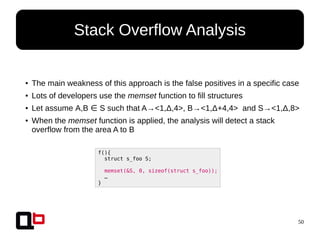
● We must:
– Isolate all stack frames
● Routine may be given by Pin or monitor all call/ret
● Then, the area is given by the prologue
– Find how many variables are in the stack frame
● We use the A-Locs (Abstract Locations) methods from the Value-Set-Analysis
paper [0]
– Assign an area <ID,Δ,S> for each variable where ID ∈ is the unique stackℕ
frame id, Δ the base address of the variable and S the size of the variable
● Like heap overflow analysis, check if there is a change of area <ID,Δ,S> during a
linear STORE
Stack Overflow Analysis
[0] Analyzing Memory Accesses in x86 Executables by Gogul Balakrishnan and Thomas Reps
http://citeseerx.ist.psu.edu/viewdoc/download?doi=10.1.1.129.1920&rep=rep1&type=pdf
Each stack frame must
have a unique ID](https://image.slidesharecdn.com/sthack2015-dynamic-behavior-analysis-using-binary-instrumentation-jonathan-salwan-150330060900-conversion-gate01/85/Sthack-2015-Jonathan-JonathanSalwan-Salwan-Dynamic-Behavior-Analysis-Using-Binary-Instrumentation-47-320.jpg)
![48
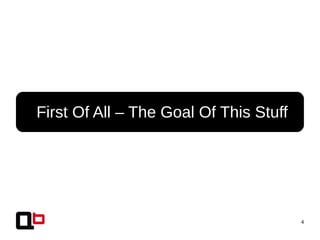
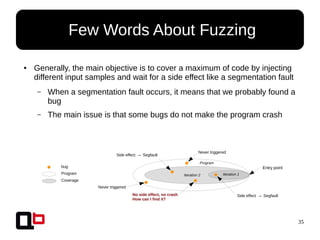
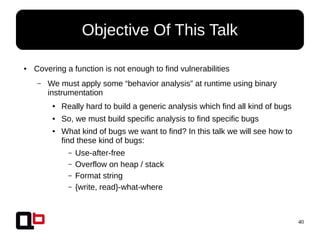
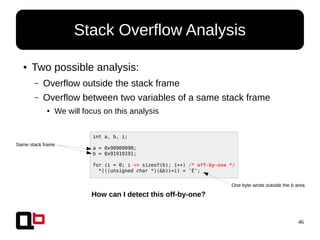
Stack Overflow Analysis
01. 4006d4: mov qword ptr [rbp-0x10], 0x0 (dest: 7fffdae70d10) (stack frame ID: 3)
02. 4006dc: mov qword ptr [rbp-0x18], 0x0 (dest: 7fffdae70d08) (stack frame ID: 3)
03. 4006e4: mov dword ptr [rbp-0x4], 0x0 (dest: 7fffdae70d1c) (stack frame ID: 3)
04. 40071f: mov dword ptr [rbp-0x4], 0x0 (dest: 7fffdae70d1c) (stack frame ID: 5)
05. 400742: mov dword ptr [rbp-0x4], 0x0 (dest: 7fffdae70d1c) (stack frame ID: 5)
06. 400640: mov dword ptr [rbp-0x4], 0x0 (dest: 7fffdae70cdc) (stack frame ID: 9)
07. 400669: mov dword ptr [rbp-0x8], 0x90909090 (dest: 7fffdae70cd8) (stack frame ID: 10)
08. 400670: mov dword ptr [rbp-0xc], 0x91919191 (dest: 7fffdae70cd4) (stack frame ID: 10)
09. 400677: mov dword ptr [rbp-0x4], 0x0 (dest: 7fffdae70cdc) (stack frame ID: 10)
10.
11. id stack frame: 3 Num var: 3
12. id stack frame: 5 Num var: 1
13. id stack frame: 9 Num var: 1
14. id stack frame: 10 Num var: 3
1 var
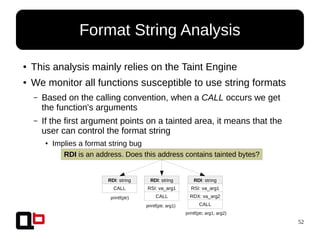
● If there is two assignments on a same <ID,Δ> → Interpret this as one variable area
(take a look at line .04 and .05)
● However, if there is two assignments on <ID,Δ> and <ID,Δ+n> → Interpret this as two
variables areas and we must refine the first area](https://image.slidesharecdn.com/sthack2015-dynamic-behavior-analysis-using-binary-instrumentation-jonathan-salwan-150330060900-conversion-gate01/85/Sthack-2015-Jonathan-JonathanSalwan-Salwan-Dynamic-Behavior-Analysis-Using-Binary-Instrumentation-48-320.jpg)

![54
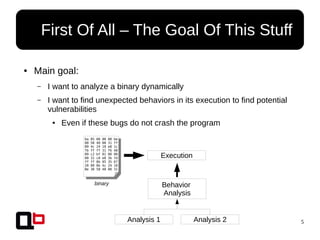
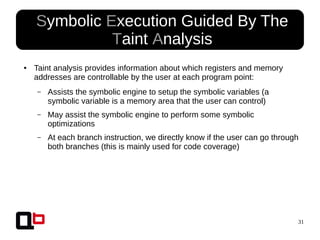
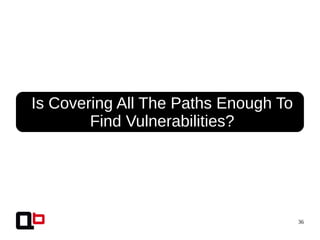
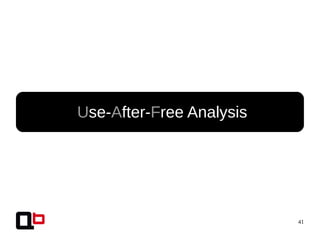
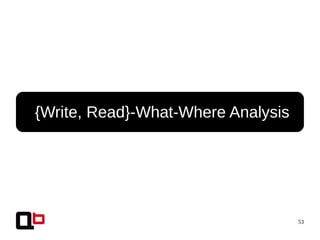
● This analysis mainly relies on the Taint Engine
● We must monitor all STORE/LOAD instruction and check if the destination/source is tainted
● LOAD:
– If reg is tainted → read-where bug
● STORE:
– If reg is tainted → write-where bug
– If both operands are tainted (reg, reg) → write-what-where bug
{Write, Read}-What-Where Analysis
Memory
LOAD STORE
mov r, [ ] Mov [ ], r/imm
Tainted?
regreg
Unsafe
Safe
Yes
No](https://image.slidesharecdn.com/sthack2015-dynamic-behavior-analysis-using-binary-instrumentation-jonathan-salwan-150330060900-conversion-gate01/85/Sthack-2015-Jonathan-JonathanSalwan-Salwan-Dynamic-Behavior-Analysis-Using-Binary-Instrumentation-54-320.jpg)


![62
●
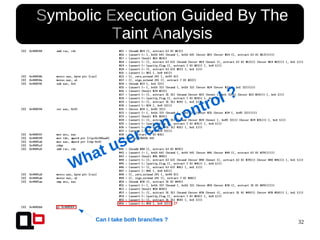
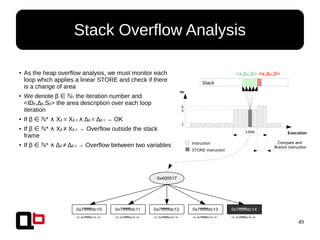
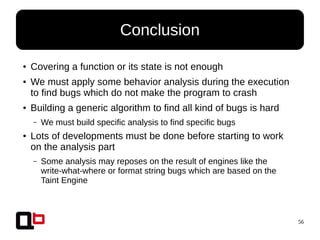
How did you detect the loops?
● The main problem was for the stack and the heap overflow analysis
● Detect loops at runtime is a kind of challenge
– Lots of papers apply a first pass of static analysis to build CFG and
locates the loops
● Actually, what we did is a kind of “hack” and we did not found the
good way yet...
● At runtime, we maintains a map of <Δ:n> where Δ is the address of
the current instruction and n *∈ ℕ the number of hits
●
Generally a loop ends by a branch instruction and contains more
than 1 hits (n)
●
We apply some heuristics based on these “tricks”
●
One of the problem with this, is that we can't detect a loop of 1
iteration. However, should we consider this as a loop?
●
Even if we don't apply runtime analysis, all results of the trace can
be stored in a database and further processed
Q&A - Problems Encountered
Addr Nb Inst
4004e4 1 push rbp
4004e5 1 mov rbp, rsp
4004e8 1 mov dword ptr [rbp-0x14], edi
4004eb 1 mov qword ptr [rbp-0x20], rsi
4004ef 1 mov dword ptr [rbp-0x10], 0x11111111
4004f6 1 mov dword ptr [rbp-0x8], 0x22222222
4004fd 1 mov dword ptr [rbp-0xc], 0x33333333
400504 1 mov dword ptr [rbp-0x4], 0x0
40050b 1 jmp 0x40051e
40050d 5 mov eax, dword ptr [rbp-0x4]
400510 5 lea rdx, ptr [rbp-0x10]
400514 5 add rax, rdx
400517 5 mov byte ptr [rax], 0x2e
40051a 5 add dword ptr [rbp-0x4], 0x1
40051e 6 cmp dword ptr [rbp-0x4], 0x4
400522 6 jbe 0x40050d
400524 1 mov eax, 0x0
400529 1 pop rbp
40052a 1 ret
Probably a loop](https://image.slidesharecdn.com/sthack2015-dynamic-behavior-analysis-using-binary-instrumentation-jonathan-salwan-150330060900-conversion-gate01/85/Sthack-2015-Jonathan-JonathanSalwan-Salwan-Dynamic-Behavior-Analysis-Using-Binary-Instrumentation-62-320.jpg)

The document discusses dynamic behavior analysis using binary instrumentation with a focus on identifying vulnerabilities through various analyses such as use-after-free, heap and stack overflow, and format string vulnerabilities. It emphasizes the need for specific analysis tailored to detect particular types of bugs rather than relying solely on code coverage. The approach integrates dynamic symbolic execution and taint analysis to enhance vulnerability detection in program execution.


![[Question Paper] Embedded System (Revised Course) [June / 2014]](https://cdn.slidesharecdn.com/ss_thumbnails/es-qp-revised-course-june-2014-170802133643-thumbnail.jpg?width=640&height=640&fit=bounds)


![[Question Paper] Embedded System (Revised Course) [June / 2016]](https://cdn.slidesharecdn.com/ss_thumbnails/es-qp-revised-course-june-2016-170802133647-thumbnail.jpg?width=640&height=640&fit=bounds)


![[2011 CodeEngn Conference 05] Deok9 - DBI(Dynamic Binary Instrumentation)를 이용...](https://cdn.slidesharecdn.com/ss_thumbnails/20115thcodeengndeok9dbidynamicbinaryinstrumentation-130526001848-phpapp02-thumbnail.jpg?width=640&height=640&fit=bounds)