Downloaded 12 times
![4Martin Děcký, Advanced Operating Systems, February 24th
2017 Instrumentation, tracing
Interactive DebuggingInteractive Debugging
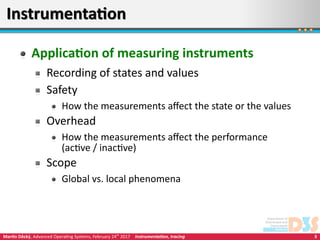
Mechanisms
Breakpoints
Software breakpoints (BREAK, INT3)
Hardware breakpoints
DR0 to DR7 debug registers on x86 (4 linear addresses, trigger conditions [read, write, execute,
I/O, area size], status)
Single-stepping
Trap flag in FLAGS, interrupt vector 1 on x86
Watchpoints
Hardware memory access breakpoints (can be emulated via the paging
mechanism)
WatchLo, WatchHi on MIPS (1 physical address, trigger [read, write])](https://image.slidesharecdn.com/01instrumentation-170224132709/85/Code-Instrumentation-Dynamic-Tracing-4-320.jpg)


![13Martin Děcký, Advanced Operating Systems, February 24th
2017 Instrumentation, tracing
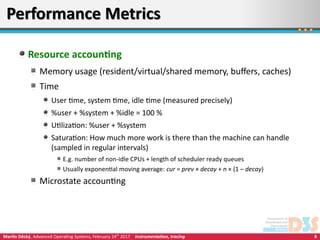
DTrace sampleDTrace sample
#! /usr/sbin/dtrace -s
syscall:::entry {
@count[probefunc] = count();
self->ts = timestamp;
self->tag = 1;
}
syscall:::return /self->tag == 1/ {
self->ts_diff = timestamp - self->ts;
@total[probefunc] = sum(self->ts_diff);
@avg[probefunc] = avg(self->ts_diff);
}
END {
printa("%a @%d @%d @%dn", @count, @total, @avg);
}](https://image.slidesharecdn.com/01instrumentation-170224132709/85/Code-Instrumentation-Dynamic-Tracing-13-320.jpg)

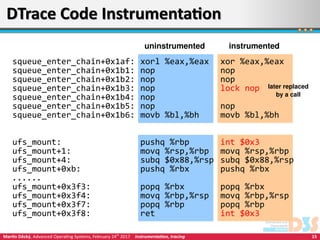


![18Martin Děcký, Advanced Operating Systems, February 24th
2017 Instrumentation, tracing
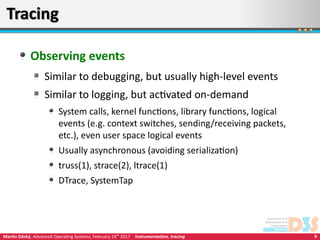
Core DumpCore Dump
[1]](https://image.slidesharecdn.com/01instrumentation-170224132709/85/Code-Instrumentation-Dynamic-Tracing-18-320.jpg)


![22Martin Děcký, Advanced Operating Systems, February 24th
2017 Instrumentation, tracing
ReferencesReferences
[1] Konstantin Lanzet, https://commons.wikimedia.org/wiki/File:KL_Kernspeicher_Makro_1.jpg](https://image.slidesharecdn.com/01instrumentation-170224132709/85/Code-Instrumentation-Dynamic-Tracing-22-320.jpg)

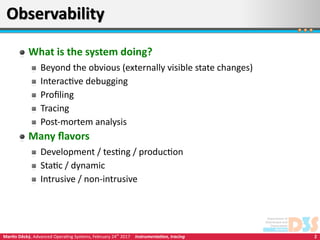
This document discusses various techniques for instrumenting and monitoring computer systems, including interactive debugging, profiling, tracing, and post-mortem analysis. It describes approaches like inserting breakpoints, collecting stack traces, and analyzing core dumps. Dynamic tracing tools allow instrumenting running systems with minimal overhead through techniques like DTrace and SystemTap, which use probes to monitor events like system calls and kernel functions.


![[2011 CodeEngn Conference 05] Deok9 - DBI(Dynamic Binary Instrumentation)를 이용...](https://cdn.slidesharecdn.com/ss_thumbnails/20115thcodeengndeok9dbidynamicbinaryinstrumentation-130526001848-phpapp02-thumbnail.jpg?width=640&height=640&fit=bounds)