Downloaded 14 times
![San Francisco Pedestrian Strategy18 San Francisco Municipal Transportation Agency 19
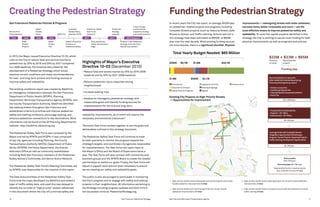
This Pedestrian Strategy provides a path towards making
San Francisco the most walkable city in North America.
The City is committed to advancing this strategy quickly.
As San Francisco continues to grow, our policies will also
encourage dense mixed-use development with excellent
public transit to reduce the need to drive and encourage
walking, bicycling and public transit use.
Below are some early action steps, either under way or
beginning in 2013 to advance the Pedestrian Strategy.
Physical Street Improvements
Identify key priority segments to be improved each year
(approximately 5 miles):
• Develop walk audit of the key walking streets by district
• Convene key stakeholder groups to identify priority areas
in each district
• Walk corridors and complete safety and comfort
assessment
• With the City Controller's Office, prioritize treatments
for high-priority streets as well as identify treatments
citywide for inclusion in the city Capital Plan
Education Outreach
Promote the benefits of walking:
• Make San Francisco the first city in the nation to launch
Walk to Work Day on April 12, 2013
• Develop multi-media campaign to encourage walking
and pedestrian priority
• Positively reinforce good behavior for people driving,
bicycling and walking
• Complete Sunday Streets evaluation and target key
walking streets as part of 2013 routes
Next Steps
Enforcement
• Target enforcement on key walking safety streets
• Start Monthly Safety Data Reports by SFPD on collisions
and enforcement
Policy and Institutions
• Prioritize key polices for agency adoption and approval
• Identify key walking safety legislation for city and state
approval including automated speed enforcement
• Improve the City’s project delivery process
• Tailor the Better Streets Plan’s Complete Streets
Checklist and adopt among implementing agencies
Performance Monitoring
City website dedicated to Pedestrian Strategy updates:
• Directors’ updates to Mayor and Task Force quarterly
• Multi-agency collision data collection, analysis,
and reporting
Notes
1. San Francisco County Transportation Authority
(2010). San Francisco County Transportation Authority
SFCHAMP Model [Software]2. SFMTA. New York City's
Pedestrian Safety Study and San Francisco Data, Oct
2010.
3. http://www.nlm.nih.gov/medlineplus/news/
fullstory_131058.html
4. Community Health Status Assessment: City and
County of San Francisco, July 2012. Accessed via: http://
www.sfdph.org/dph/files/hc/HCAgen/HCAgen2012/
Oct%2016/San%20Francisco%20CHSA_Final.pdf
5. http://www.smartgrowthamerica.org/documents/cs/
factsheets/cs-revitalize.pdf
6 Florida, Richard. The Joys of Urban Tech, Wall Street
Journal. August 31, 2012. Accessed via: http://online.
wsj.com/article/SB100008723963904449149045776194
41778073340.html
7. Dicker, Rochelle MD. Evaluation of Pedestrian
Injury and it's Associated Hospital Costs in San
Francisco,UCSF Department of Surgery. Accessed via:
http://sfic.surgery.ucsf.edu/full-research-descriptions/
cost-of-pedestrian-injury.aspx
8. ibid
Photo Credits
Cover: Jeremy Brooks;
Rentum rersped entionseque voloris volum sit, que
doluptas ut ullorep udipidem. Edit fugiam labo.
Fersperum ellatiscimi, utem fuga. Us perum volecere
pre, cullace rrovide rspit, sa volupti te re sam eos
magnationet omnientiur? Con porum inis as nosae es
de et, solore solore ima dollatem explit, quid et untias
sitis aut dolorrum volent voluptas et id mosandae.
Otatem quatium vendes aut quas simoditas doles ratqui
delit, si te renectusape et facerum que omnimaio quid
modipsanis rae num quatiis perae aut odi corecus
dolliqui aut accum ute perum voluptur arum voluptiae.
Era debitas alitatem. Pellacea quatini volor sam volupta
eum incto tempor modi sum repudite si rem si volorep
elibus, similic ientem ea dolorro vitaquis quia conserio
dolorem posam, quoditi consequis accabo. Num inus.
Reperep udissunt fugitas eum acculparibus di ut aut
perundi genisqui occatur aut apelitatur sum
Acknowledgements
Executive Leadership
Mayor Edwin M. Lee
Gillian Gillett
Mayor’s Office, Director of Transportation Policy
Edward D. Reiskin
Director of Transportation, San Francisco Municipal
Transportation Agency
Barbara A. Garcia
Director, Department of Public Health
John Rahaim
Director, Planning Department
Jose Luis Moscovich
Executive Director, San Francisco County
Transportation Agency
Pedestrian Safety Task Force
Timothy Papandreou
San Francisco Municipal Transportation Agency,
Deputy Director of Sustainable Streets Division,
Co-Chair
Rajiv Bhatia, MD, MPH
SF Department of Public Health,
Director of Environmental Health, Co-Chair
Steering Committee
San Francisco Municipal Transportation Agency
Frank Markowitz
Mari Hunter
Luis Montoya
Bridget Smith
San Francisco Department of Public Health
Megan Wier
Ana Validzic
San Francisco Planning Department
Adam Varat
Lily Langlois
San Francisco County Transportation Authority
Tilly Chang
Seon Joo Kim
Jesse Koehler
San Francisco Police Department
Capt. Al Casciato
Capt. Denis O’Leary
Walk San Francisco
Elizabeth Stampe
Other Task Force Organizations
San Francisco Department of Public Works
Peg Divine
Ken Spielman
Cristina Olea
San Francisco United School District
Nik Kaestner
Pedestrian Safety Advisory Committee
Robin Brasso
Jay Lee
John Alex Lowell
Senior Action Network/California Walks
Bob Planthold
Mayor’s Office on Disability
Joanna Fraguli
San Francisco Department of the Environment
Krute Singa
San Francisco District Attorney’s Office
Rebecca Prozan
San Francisco City Administrator’s
Office/Capital Planning
Brian Strong
San Francisco Fire Department
Andy Zanoff
San Francisco Public Utilities Commission
Rachel Kraai
San Francisco Recreation and Parks Department
Sarah Ballard
The Task Force gratefully acknowledges report
editing website assistance from:
Anne Fritzler, SFMTA
Kathleen Phu, SFMTA
Lindsey Realmuto, SFDPH
Dani Simons, Simons Consulting
Isaac Gertman, Paperwhite Studio
Open Plans](https://image.slidesharecdn.com/1-29-13pedestrianstrategy-160602024304/85/slide-10-320.jpg)


The document outlines a pedestrian strategy for San Francisco that aims to make the city the most walkable in North America. It establishes goals of reducing pedestrian injuries and increasing walking for short trips. Key strategies include upgrading 44 miles of streets to improve pedestrian safety, giving extra crossing time at 800 intersections, redesigning streets around schools and senior areas, creating new plazas and parklets, reopening closed crosswalks, and installing a network of green streets for walking. The strategy provides a comprehensive set of actions to make city streets safer and more comfortable for pedestrians.


![[2호] 독일 학교시설 복합화 및 개방 정책 사례와 시사점_내지(0422).pdf](https://cdn.slidesharecdn.com/ss_thumbnails/20422-240422102902-b0d8b1cb-thumbnail.jpg?width=640&height=640&fit=bounds)


