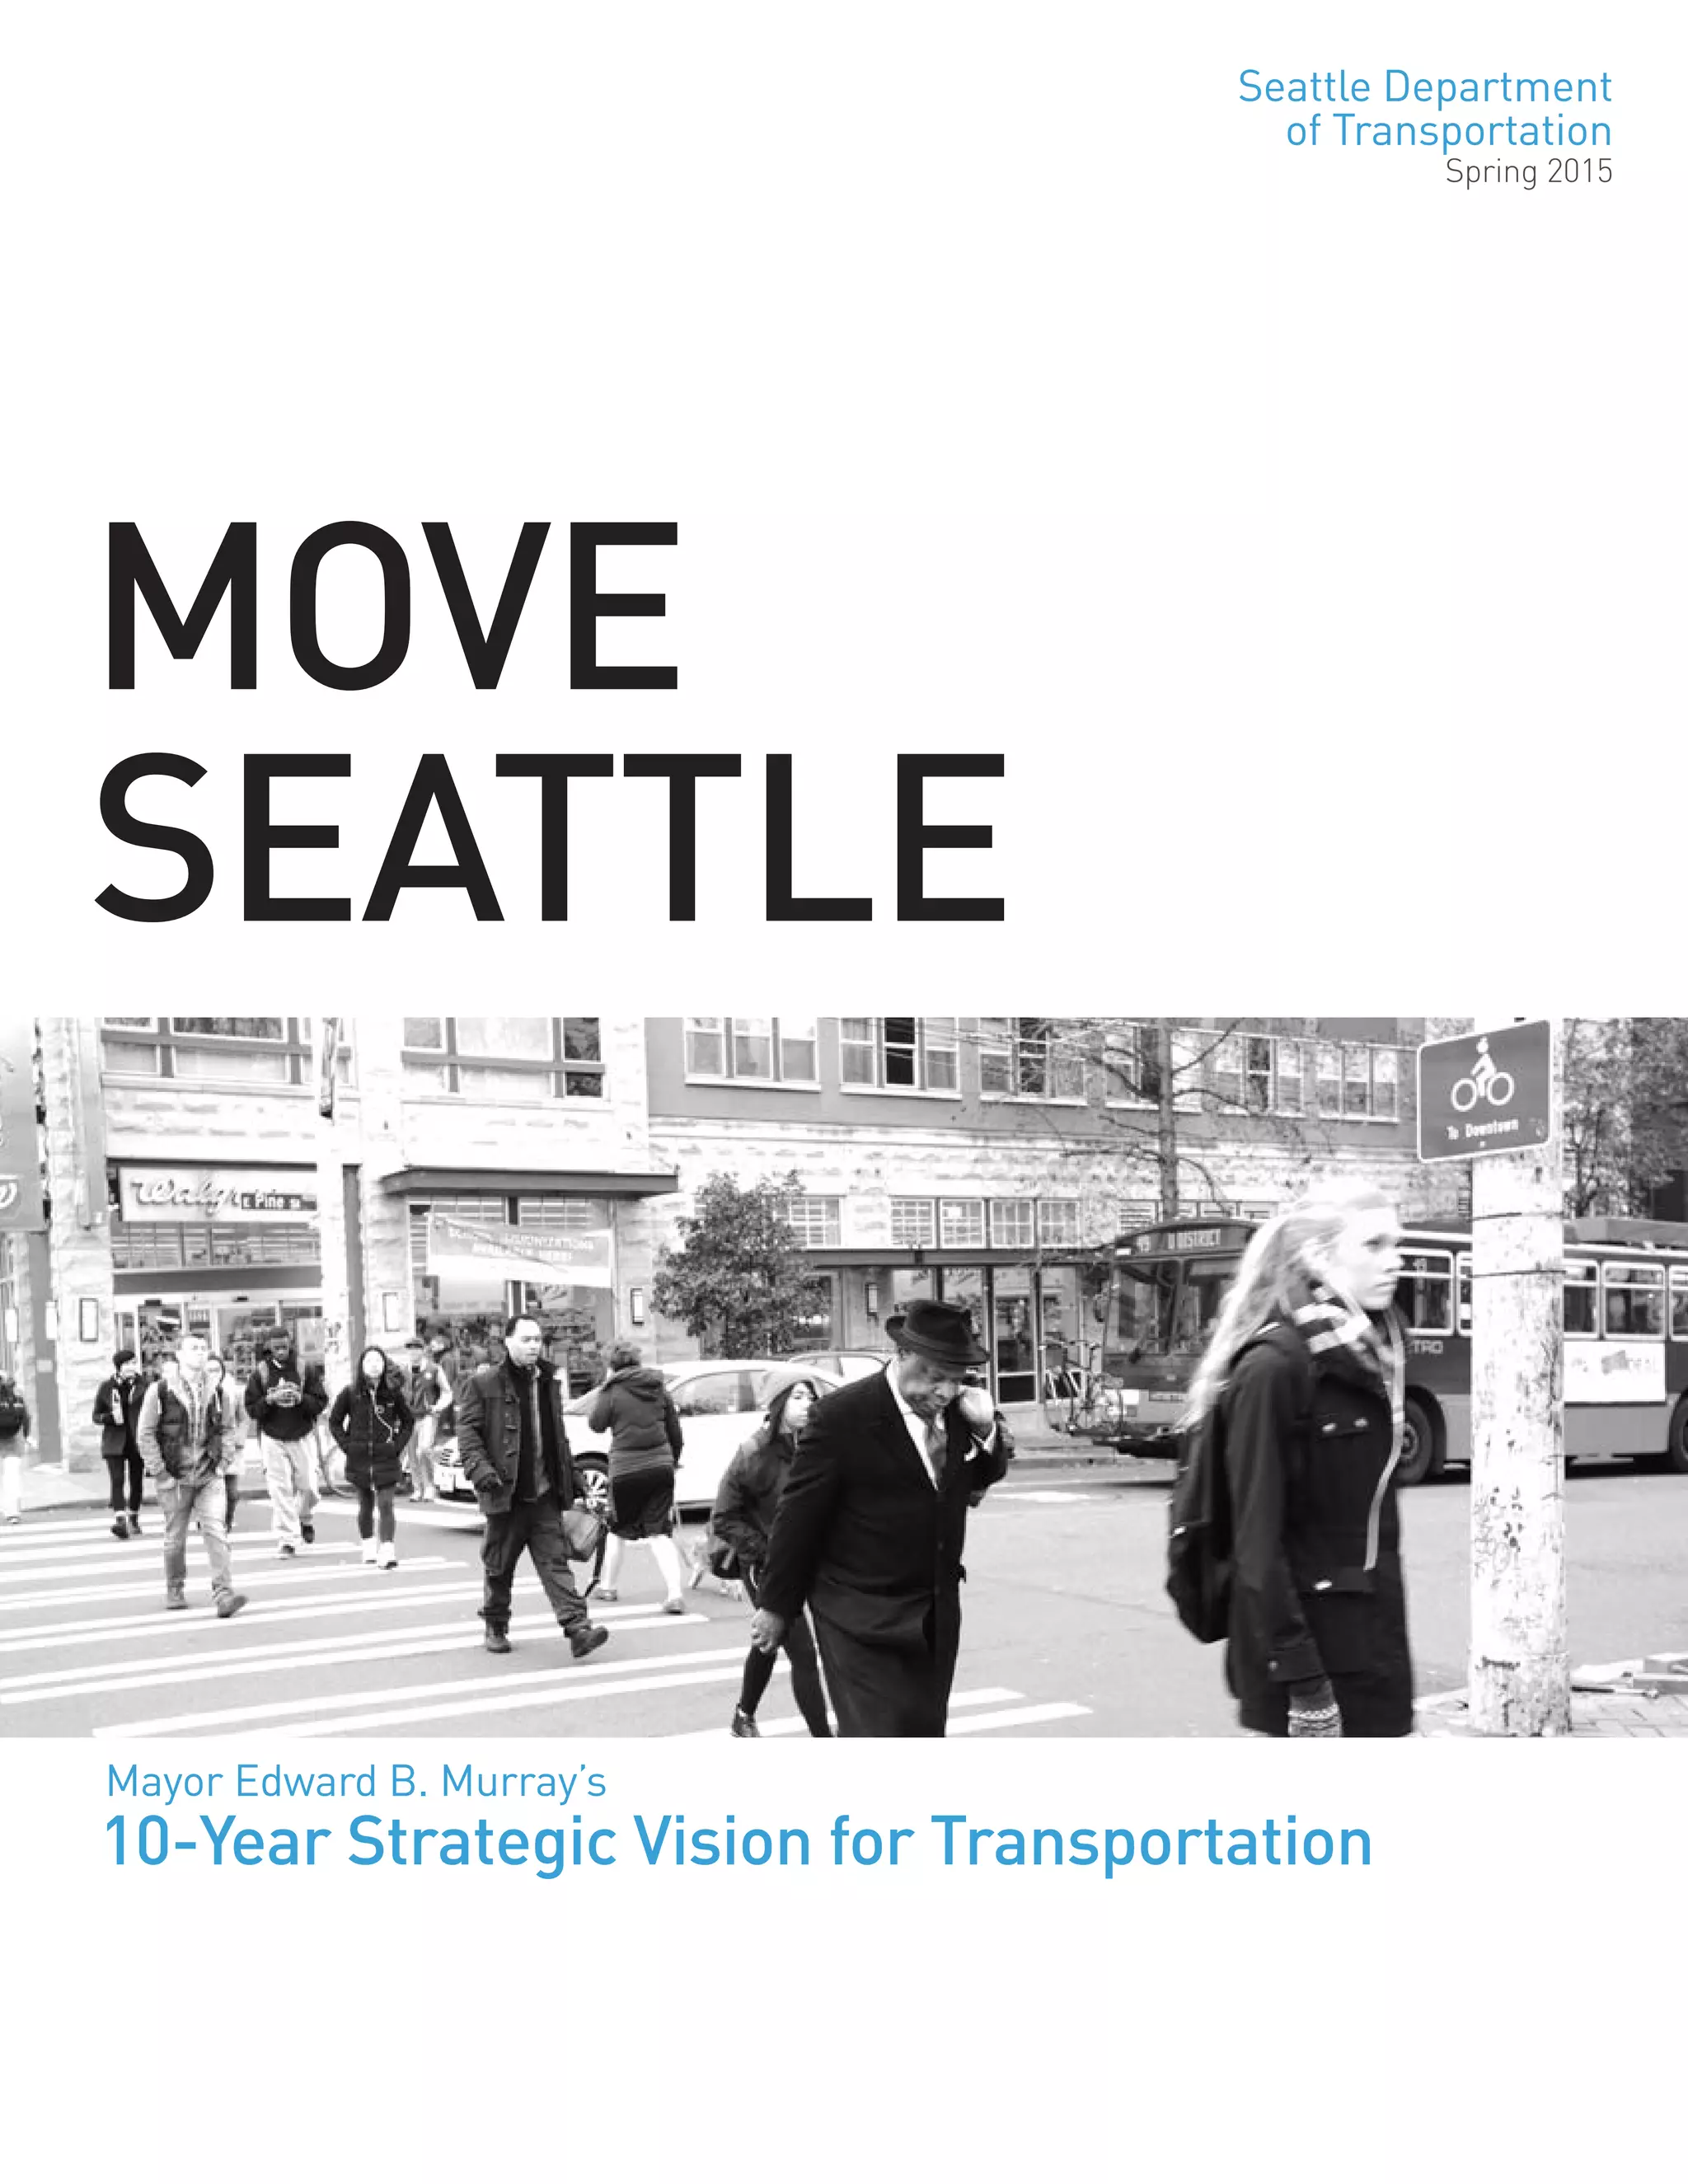
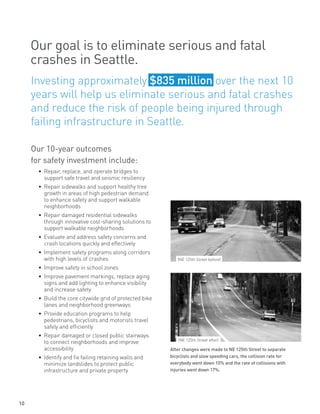
1) The document lays out Mayor Murray's 10-year strategic vision for transportation in Seattle. It identifies safety as a core value and goal to eliminate serious and fatal crashes in the city.
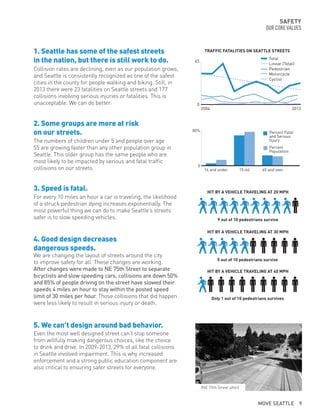
2) Specific safety outcomes and investments over 10 years are identified, including repairing infrastructure, improving safety in school zones, and building protected bike lanes.
3) A Vision Zero program is outlined that includes lowering speed limits, corridor safety projects, and education programs to promote safer travel. The goal is to reduce injuries and eliminate traffic fatalities.