Download to read offline


![[Srijan Wednesday Webinars] Why Adopt Analytics Driven Testing](https://image.slidesharecdn.com/srijanwednesdaywebinarsanalyticsdriventesting2-170615131224/75/Srijan-Wednesday-Webinars-Why-Adopt-Analytics-Driven-Testing-33-2048.jpg)

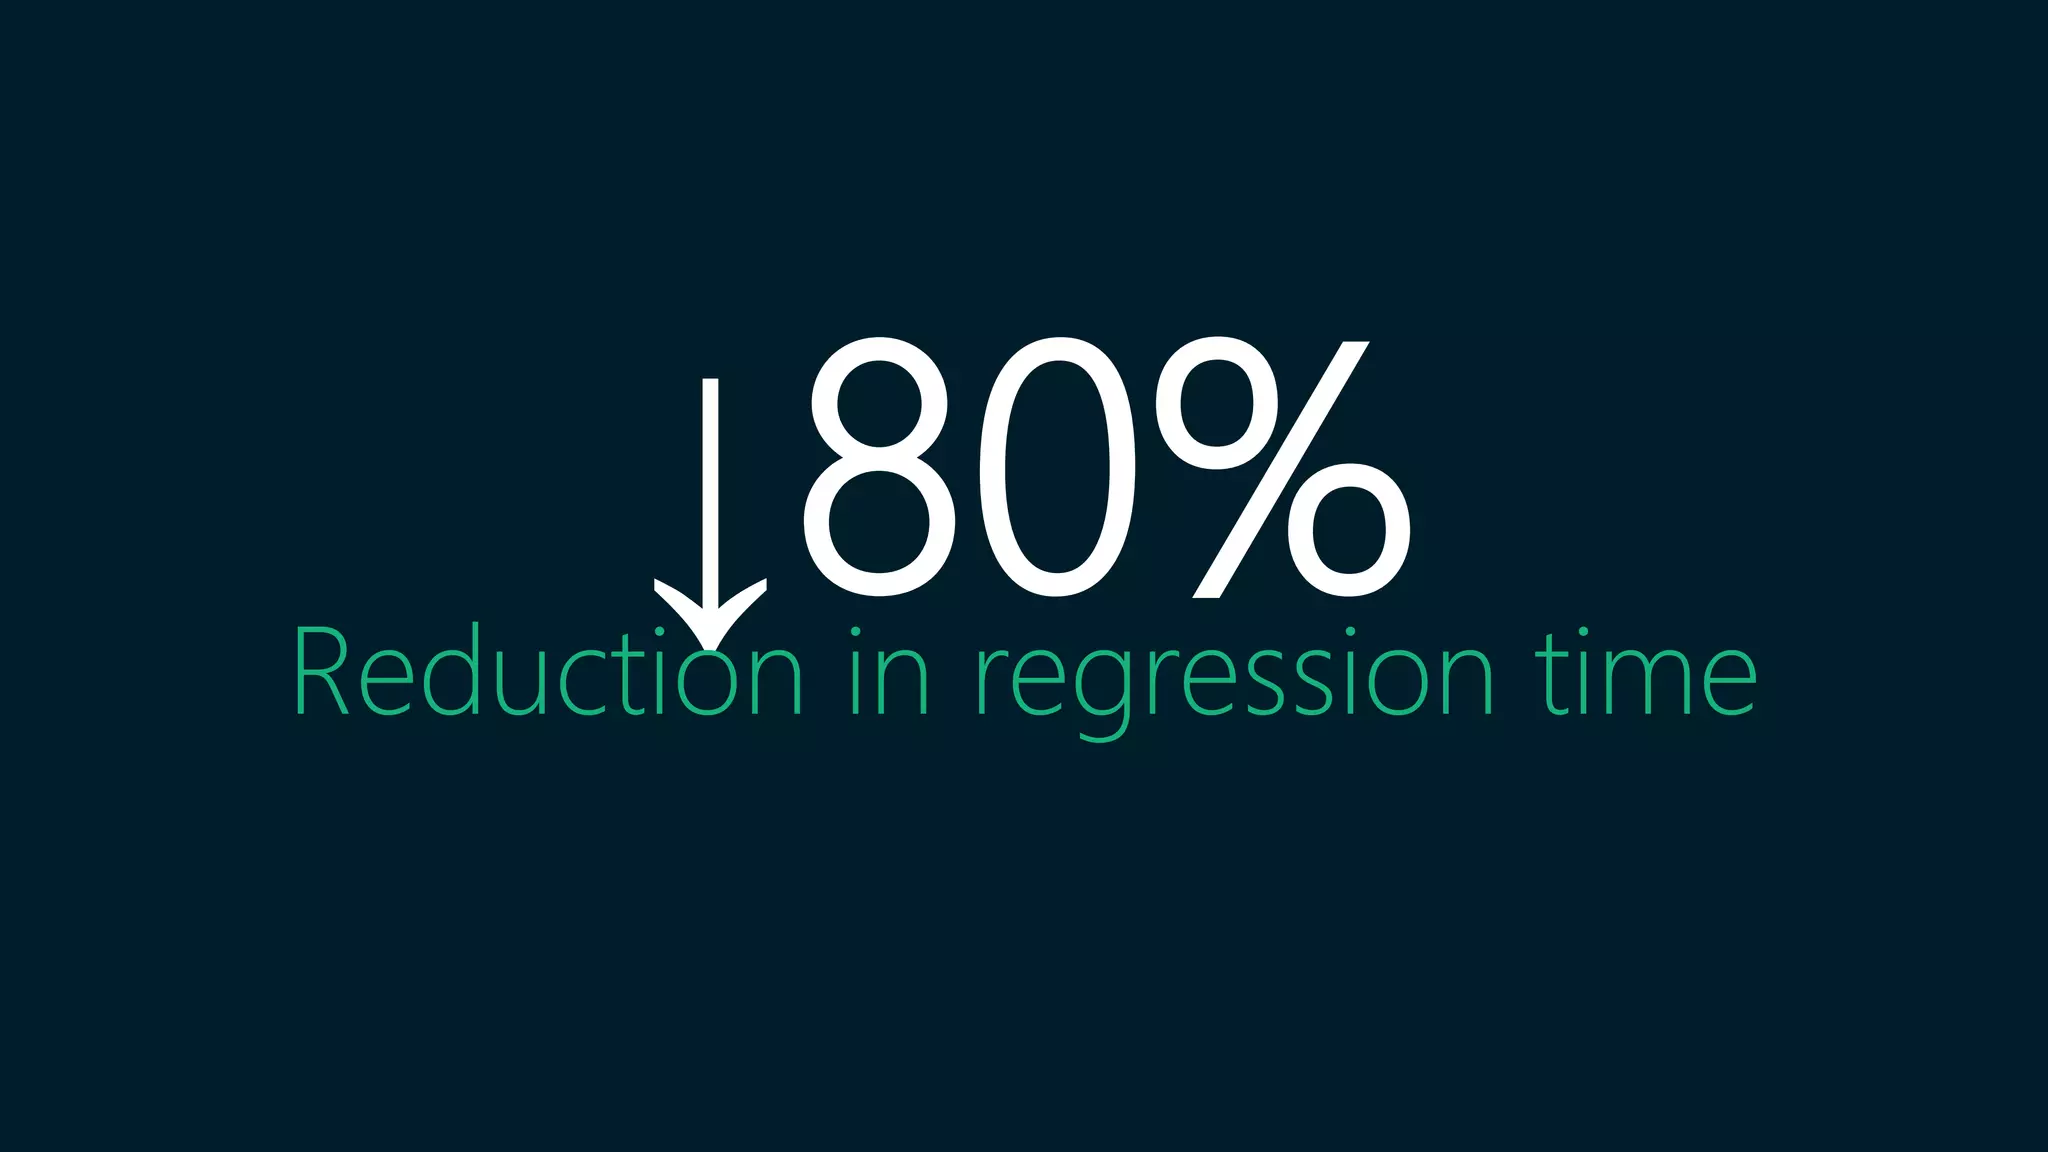
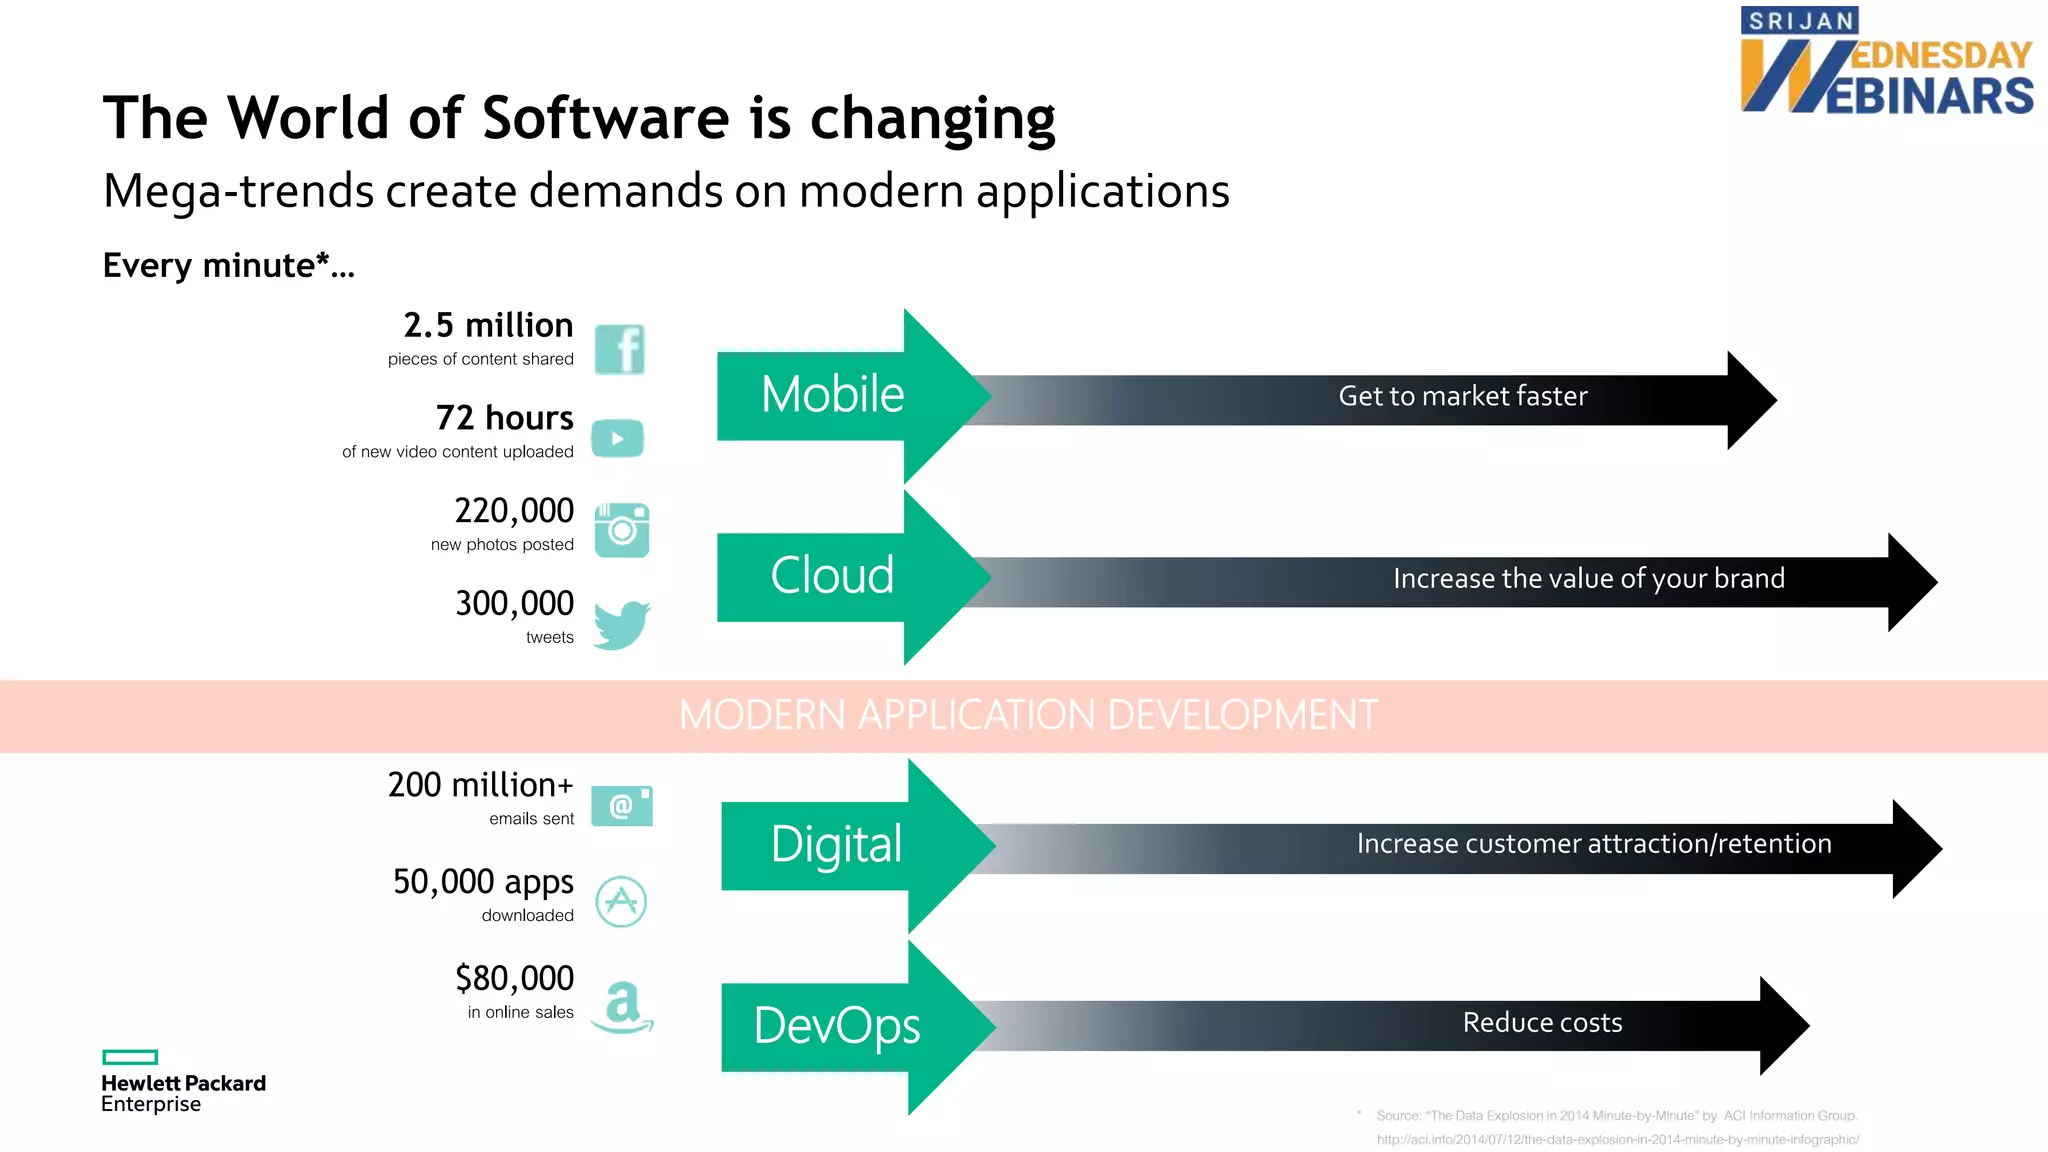
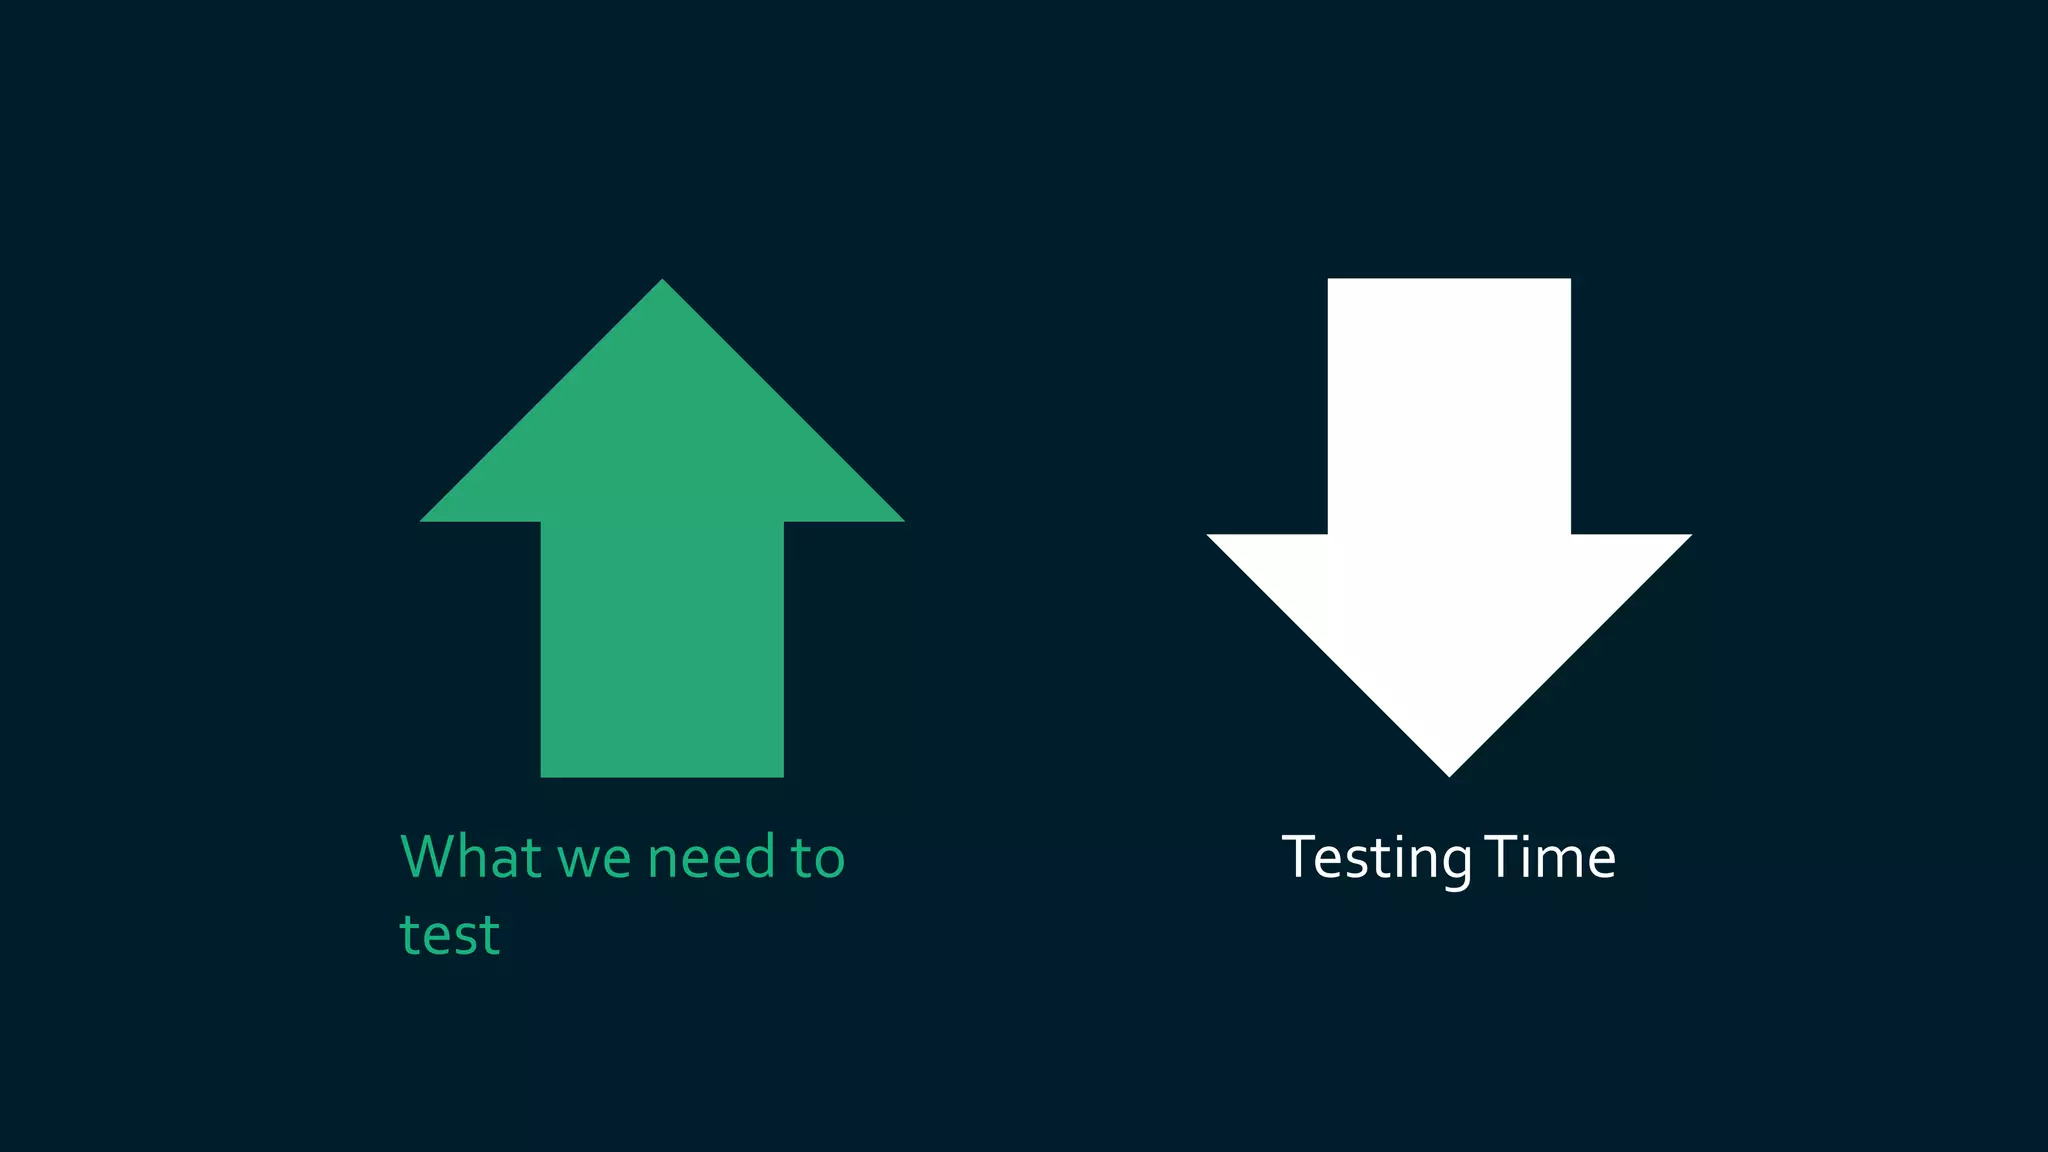
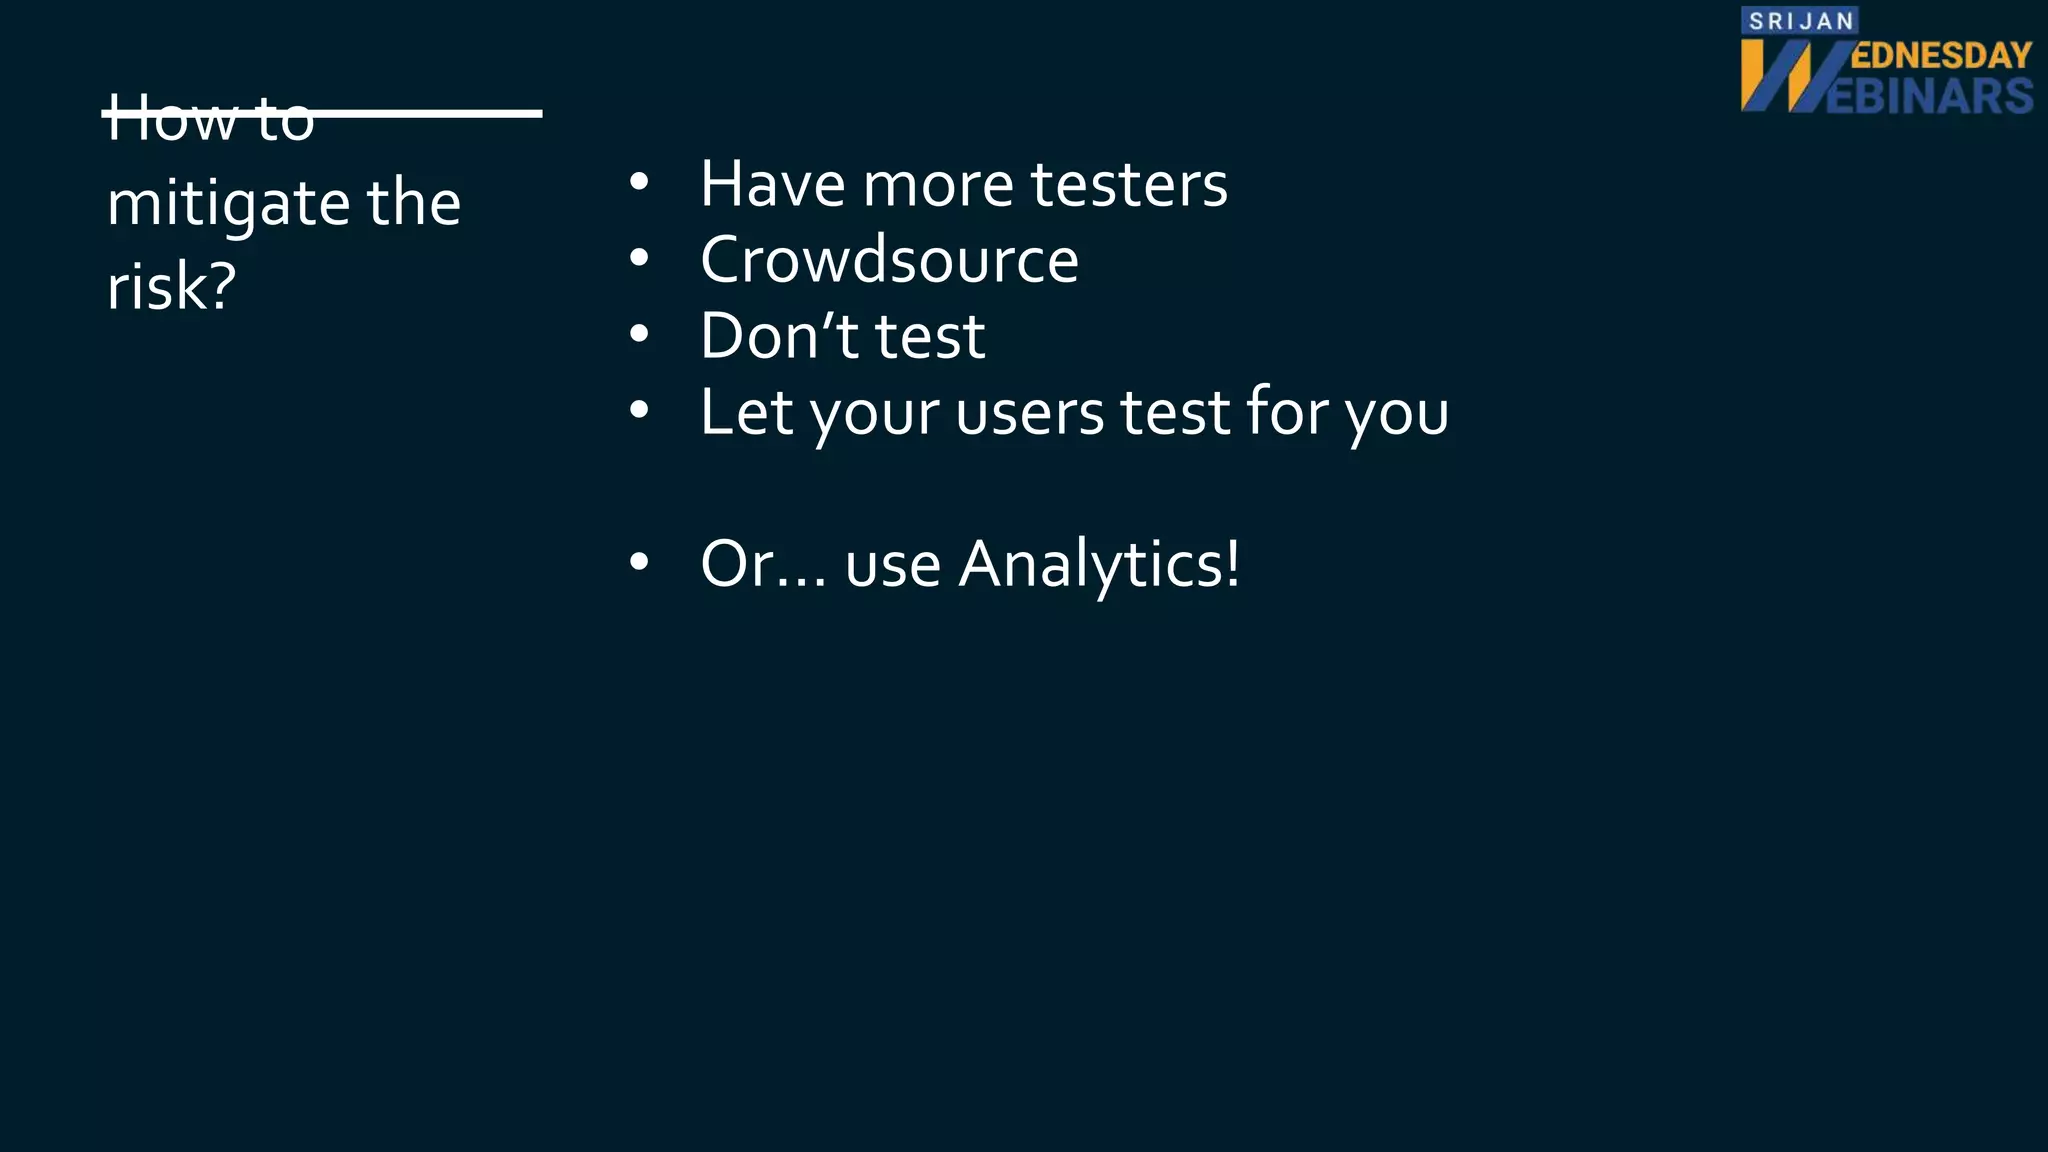
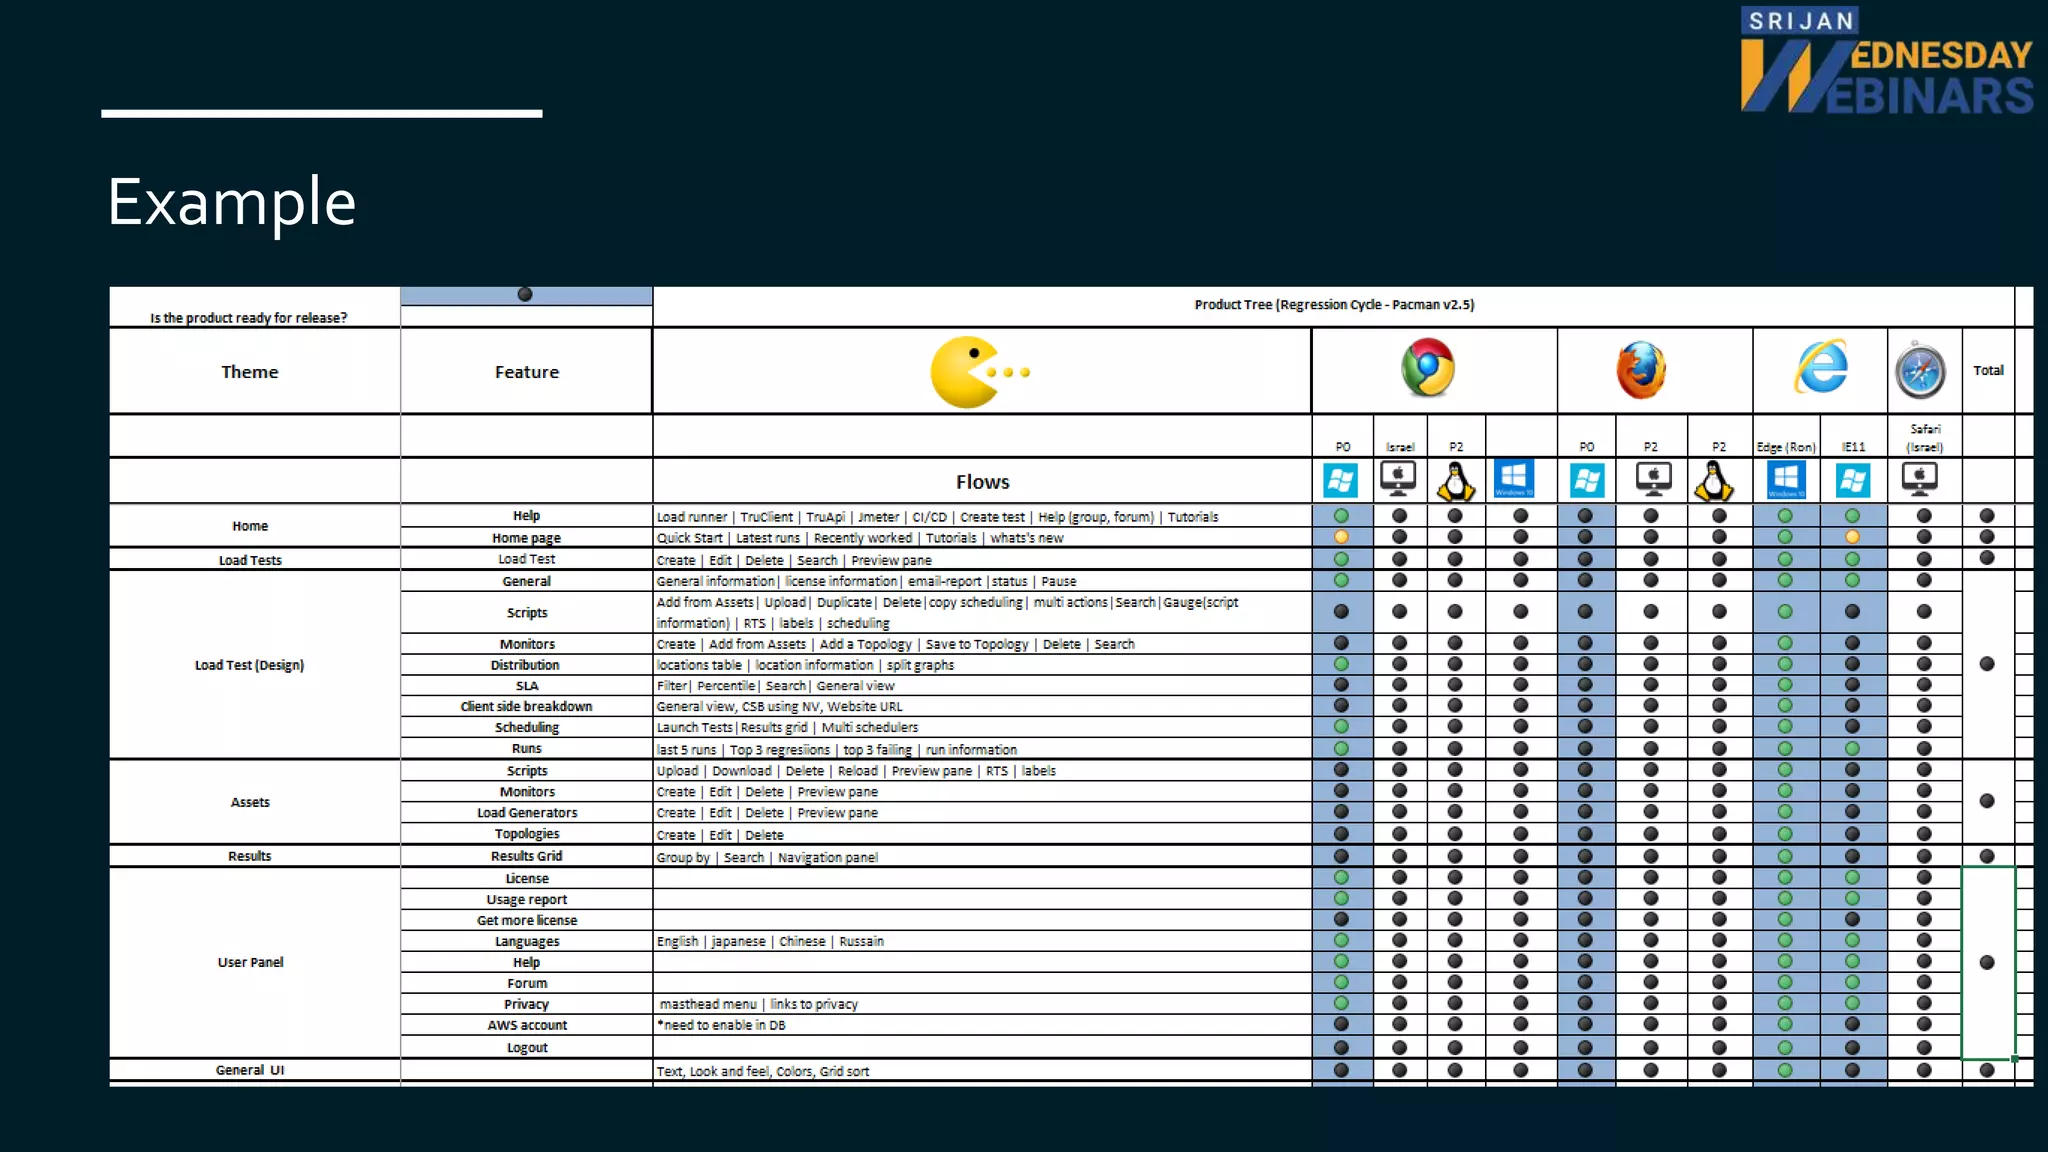
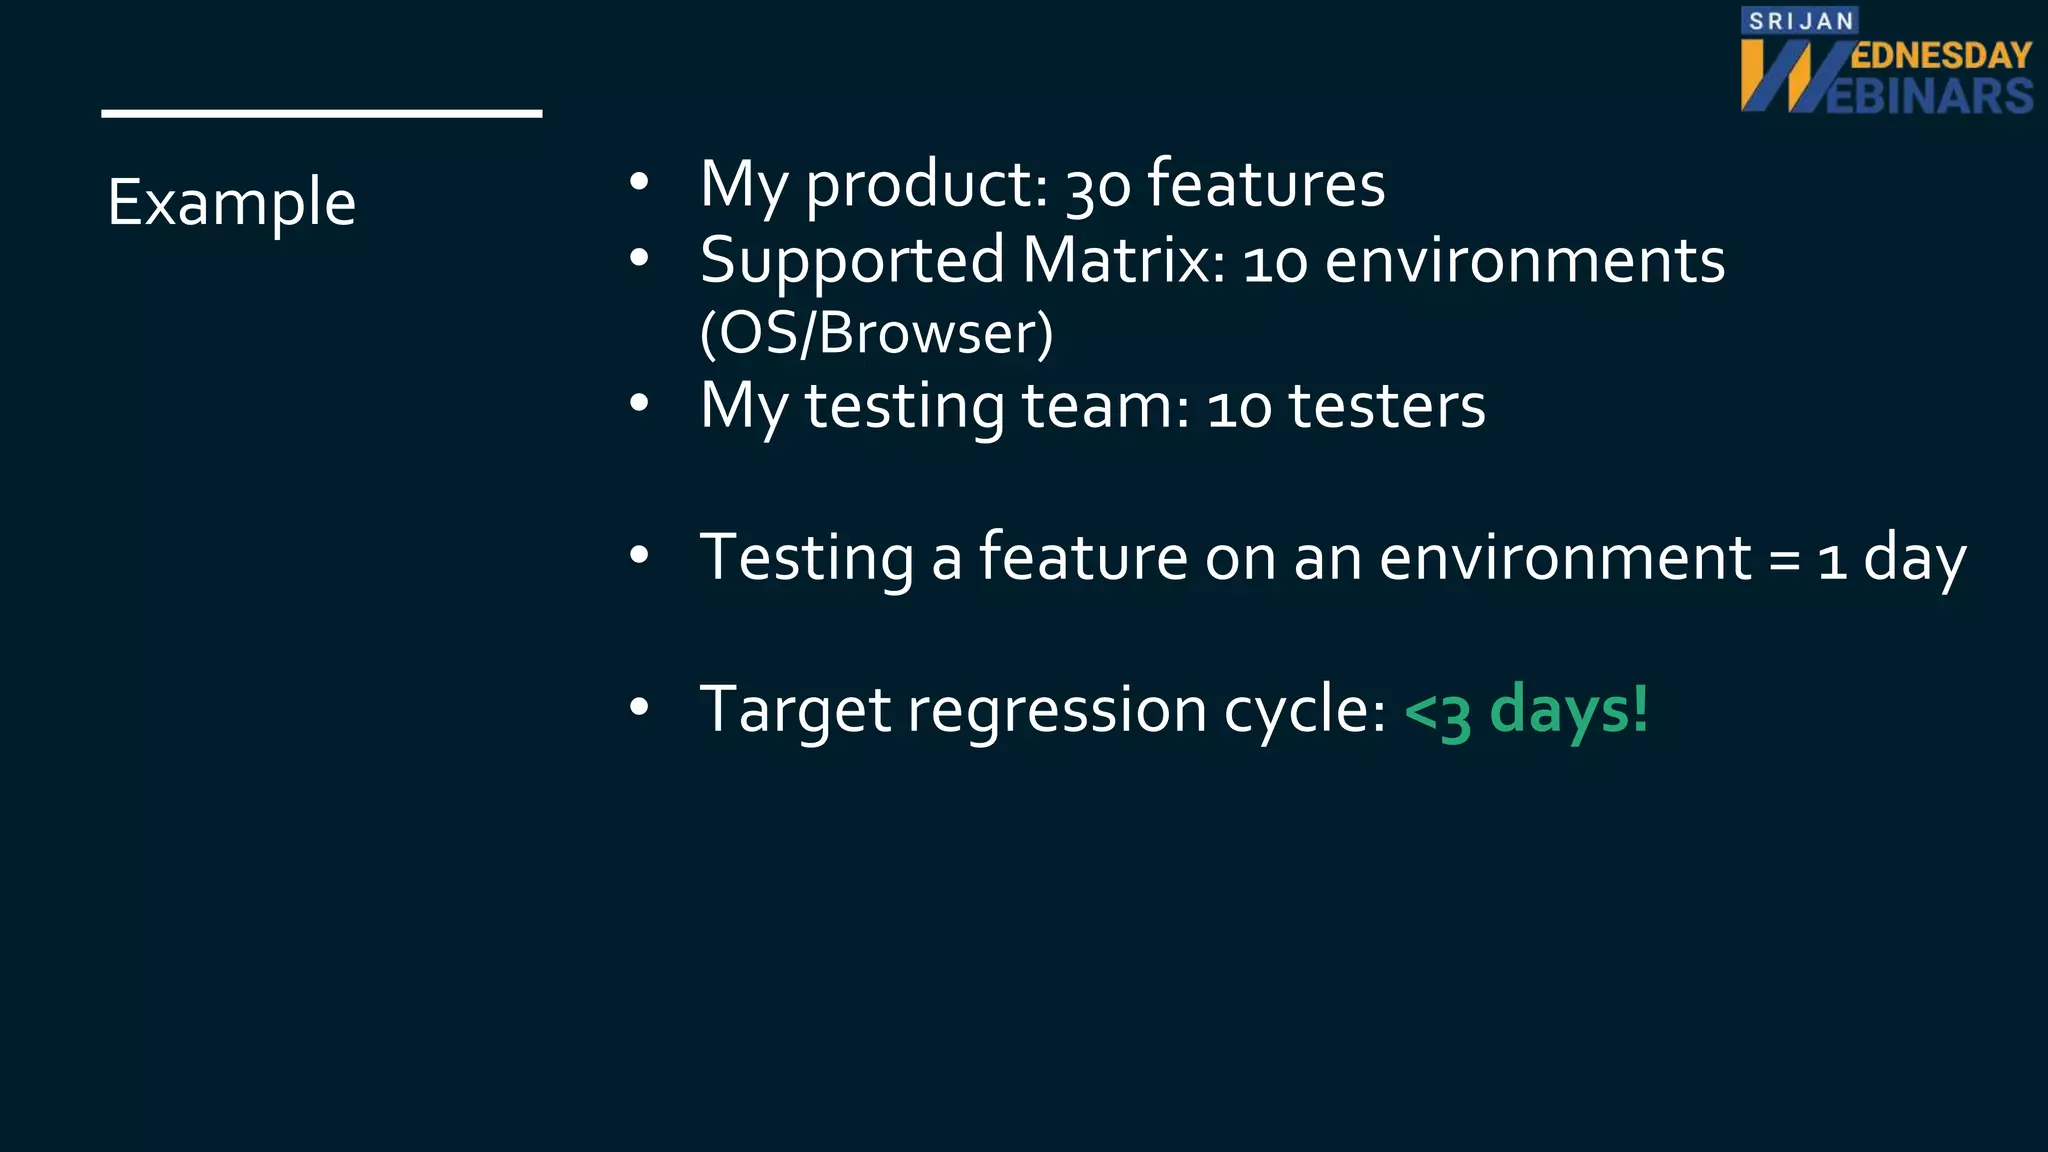
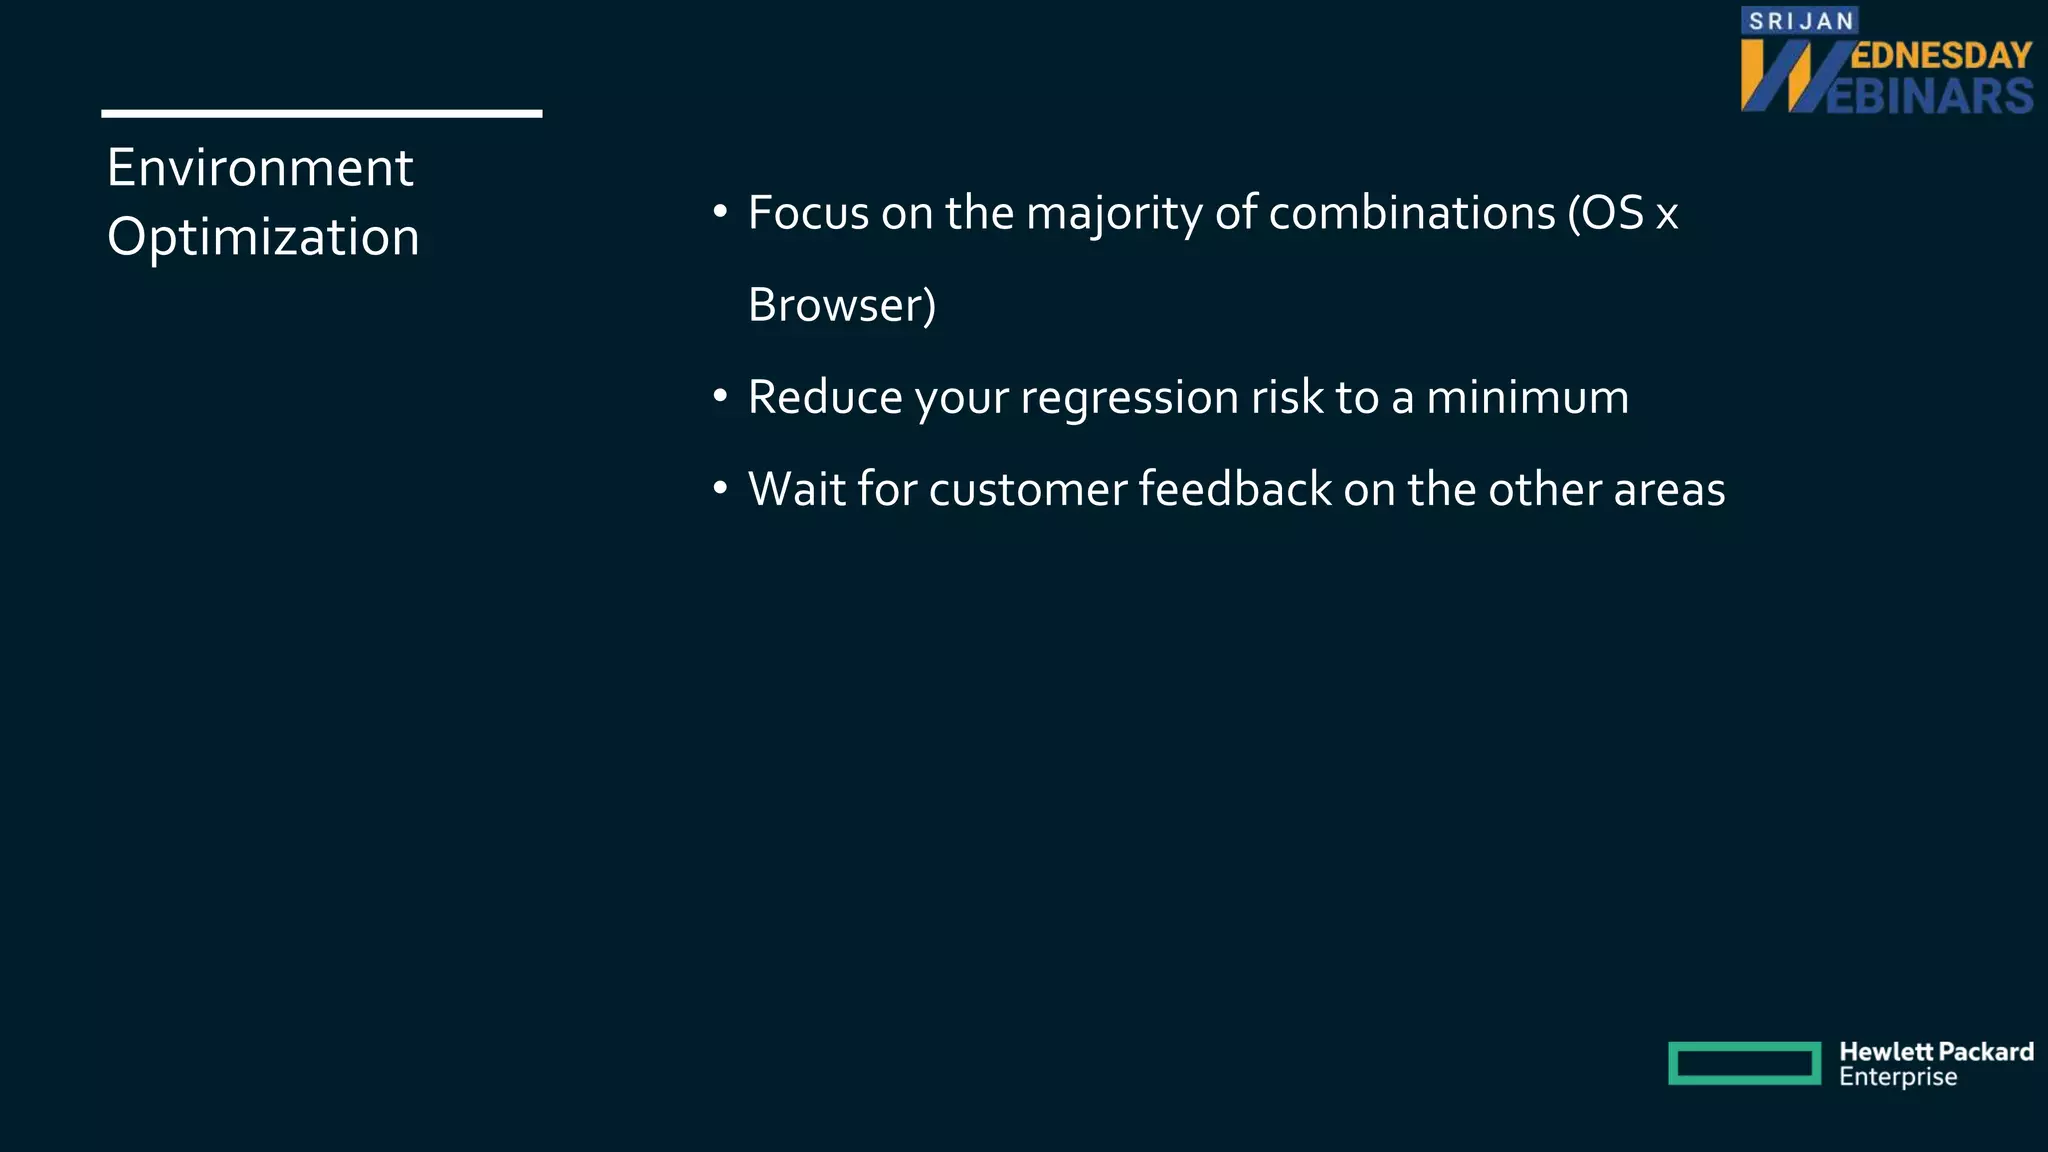
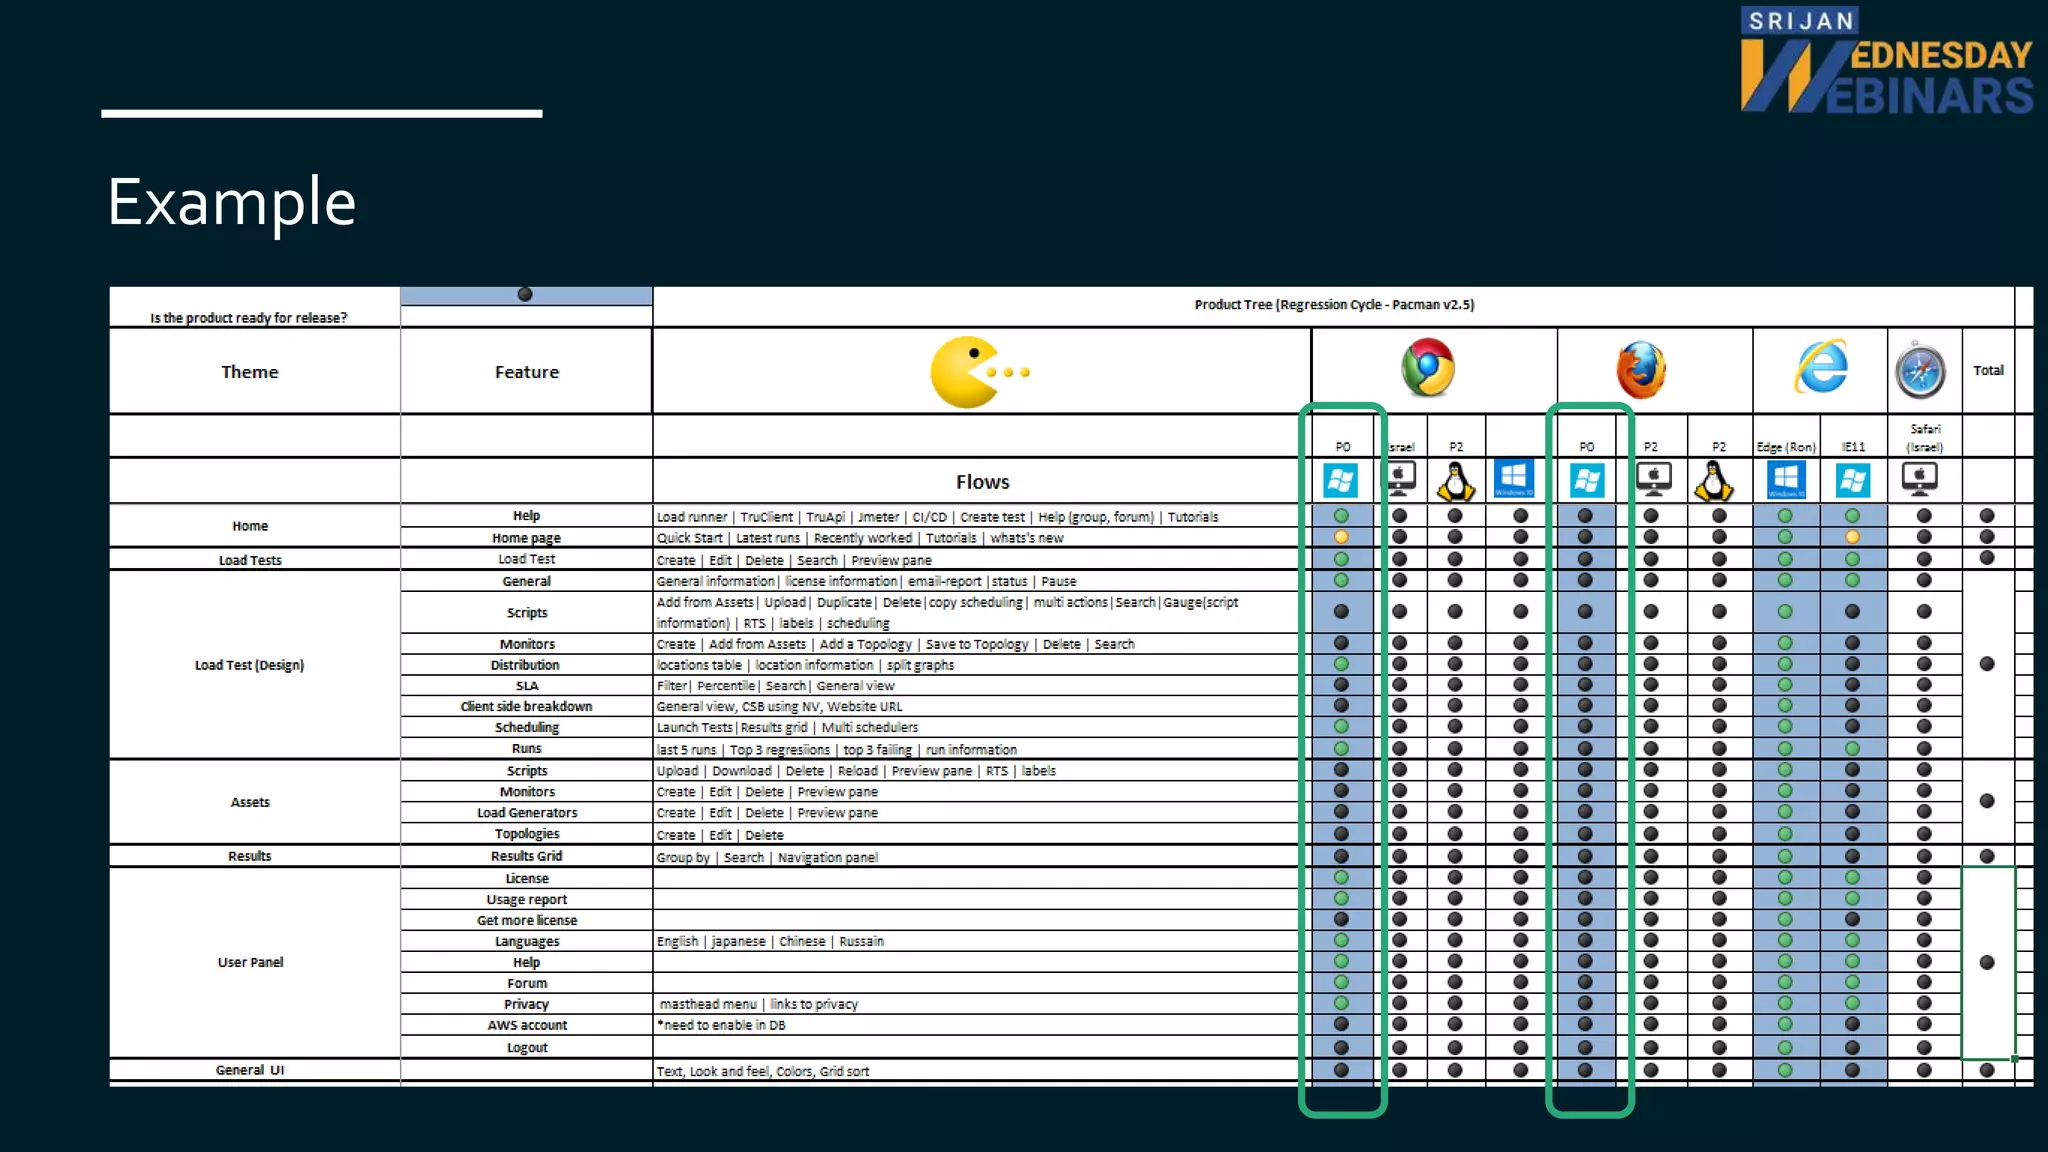
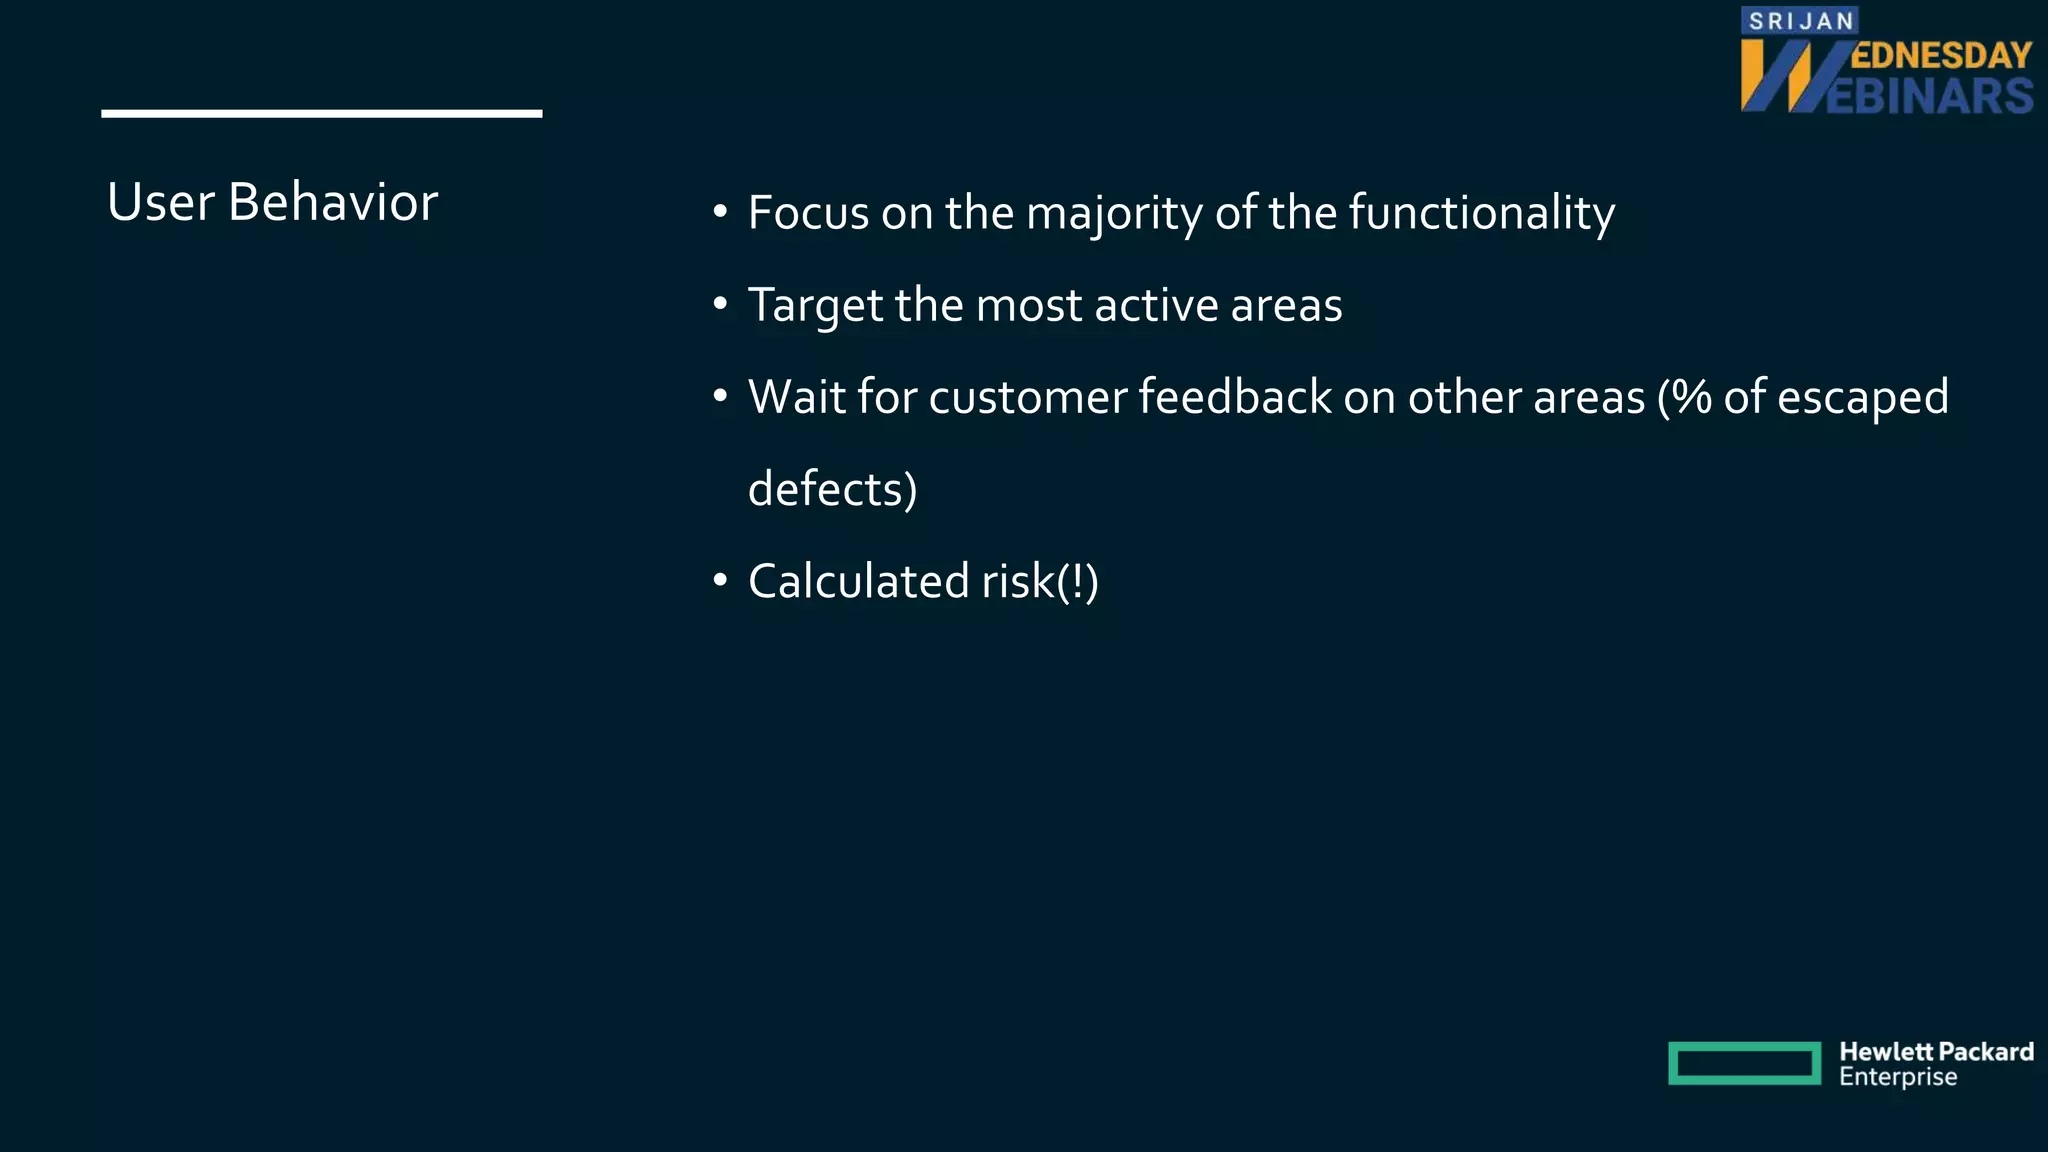
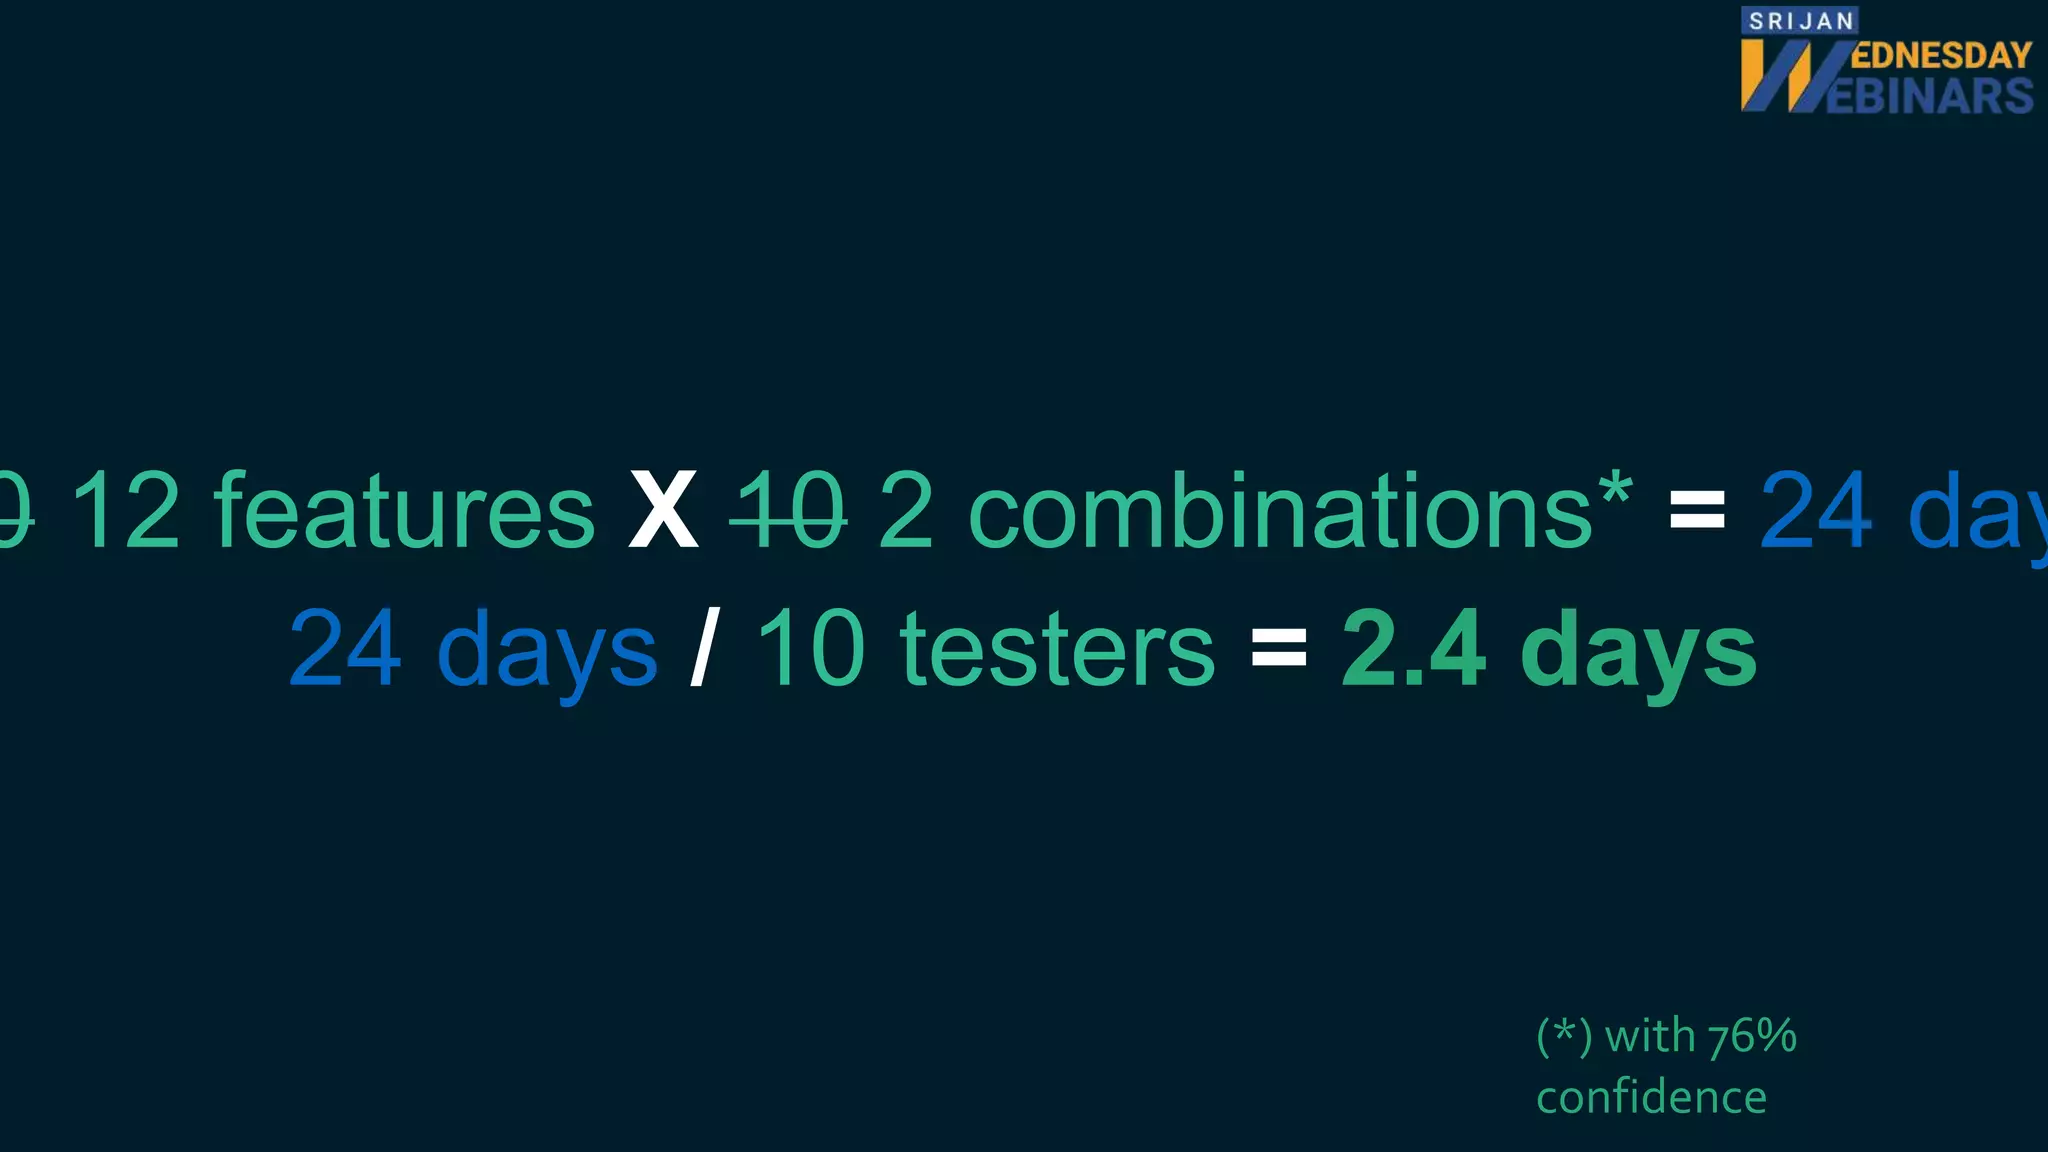
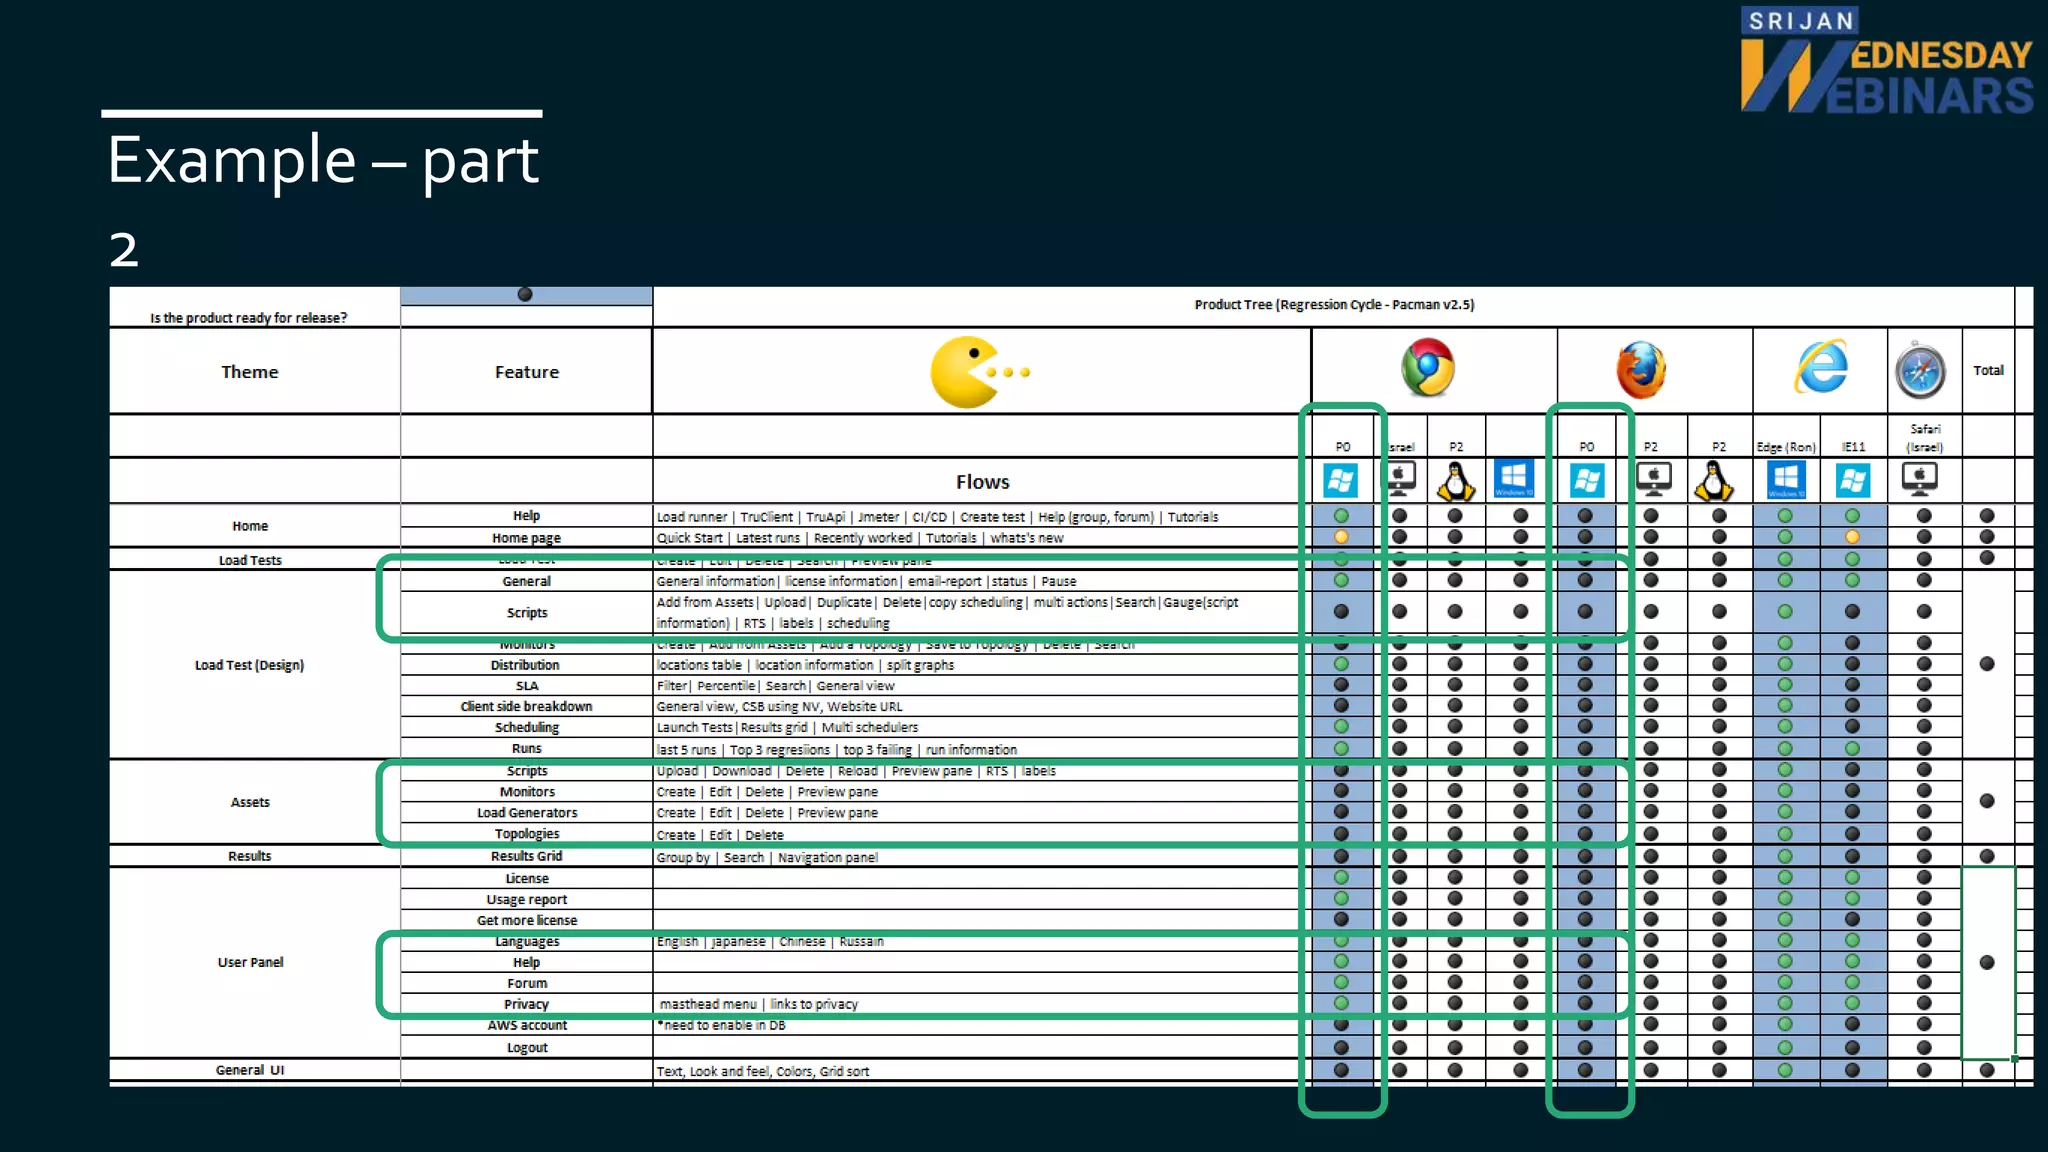
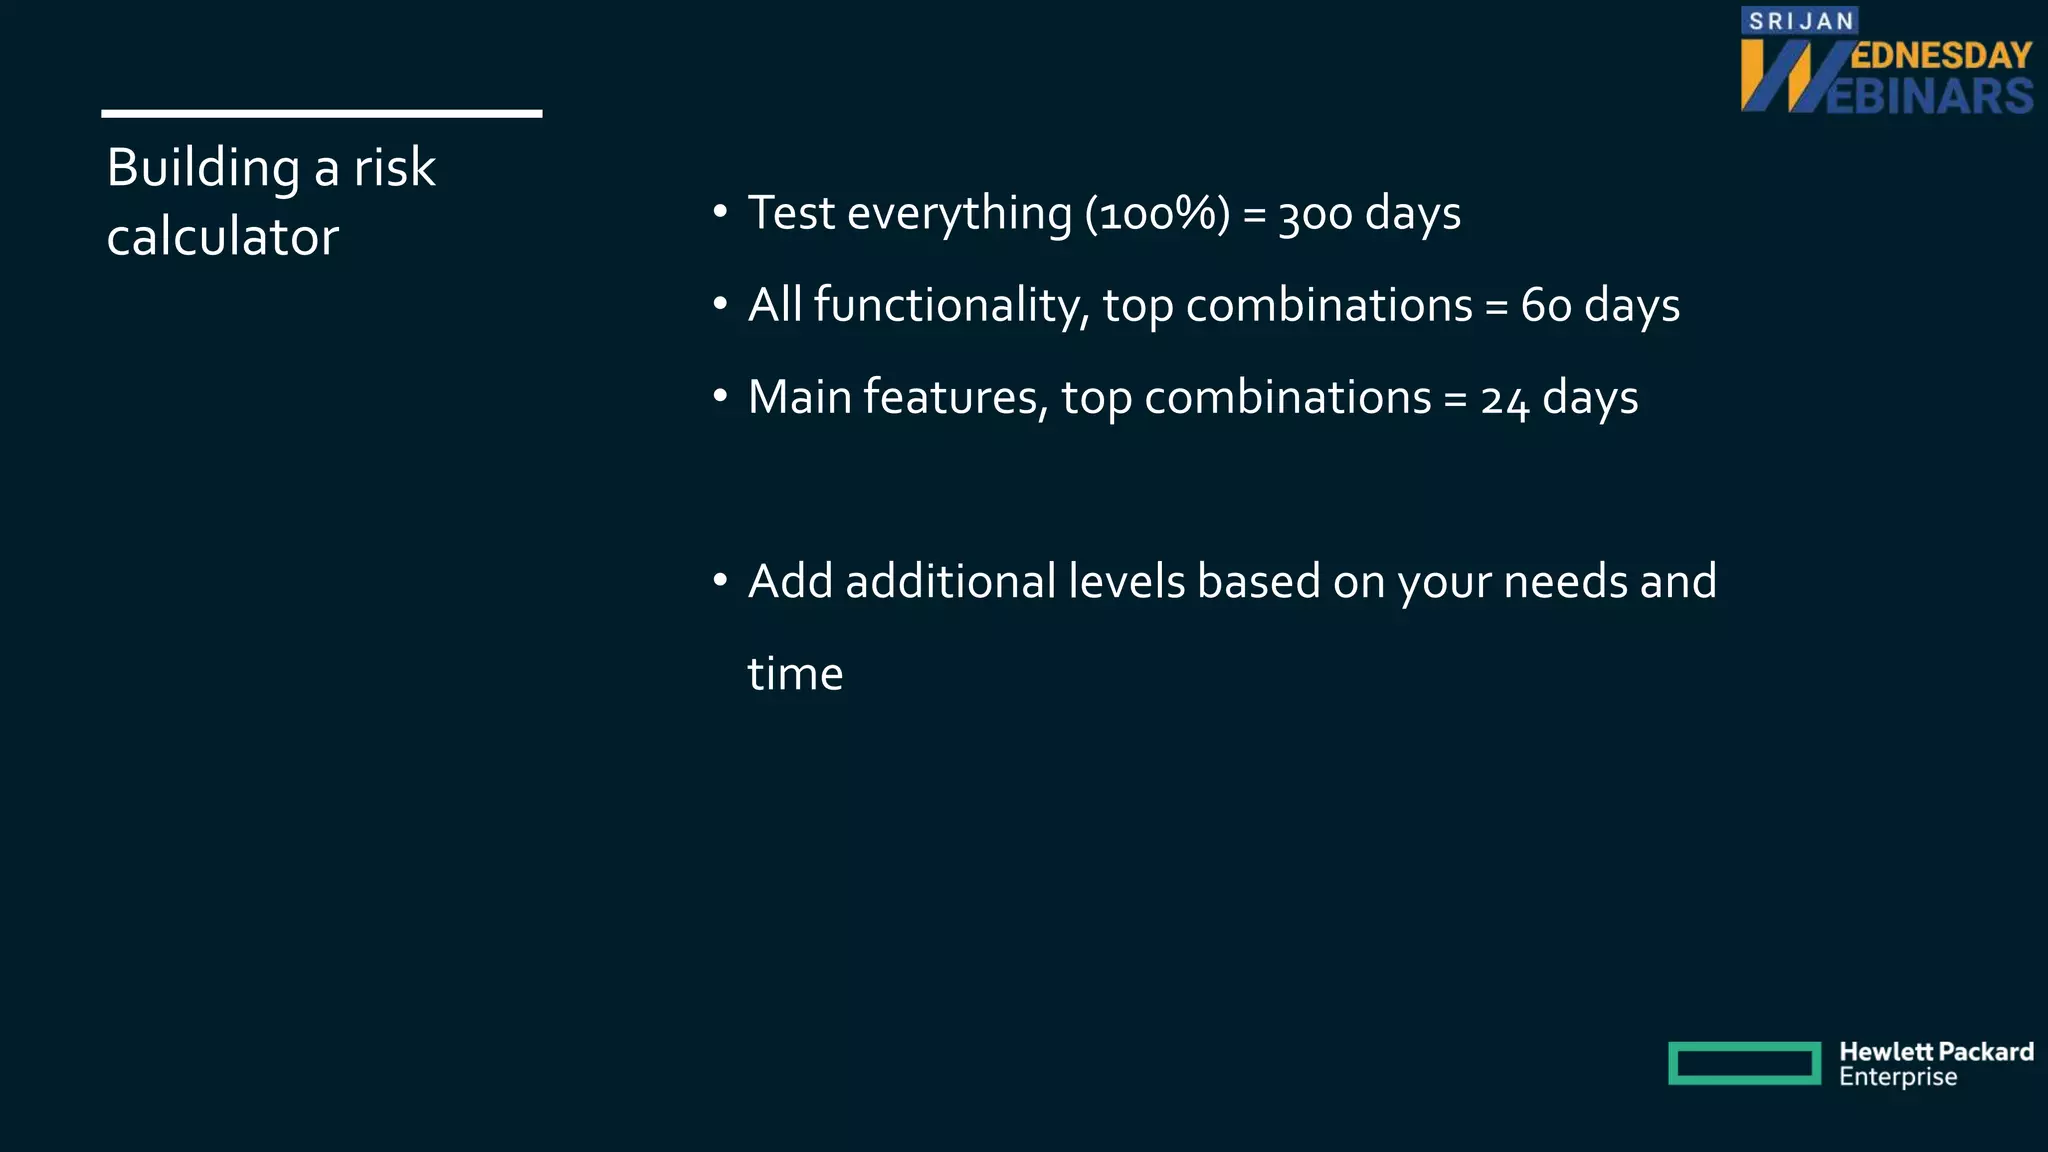
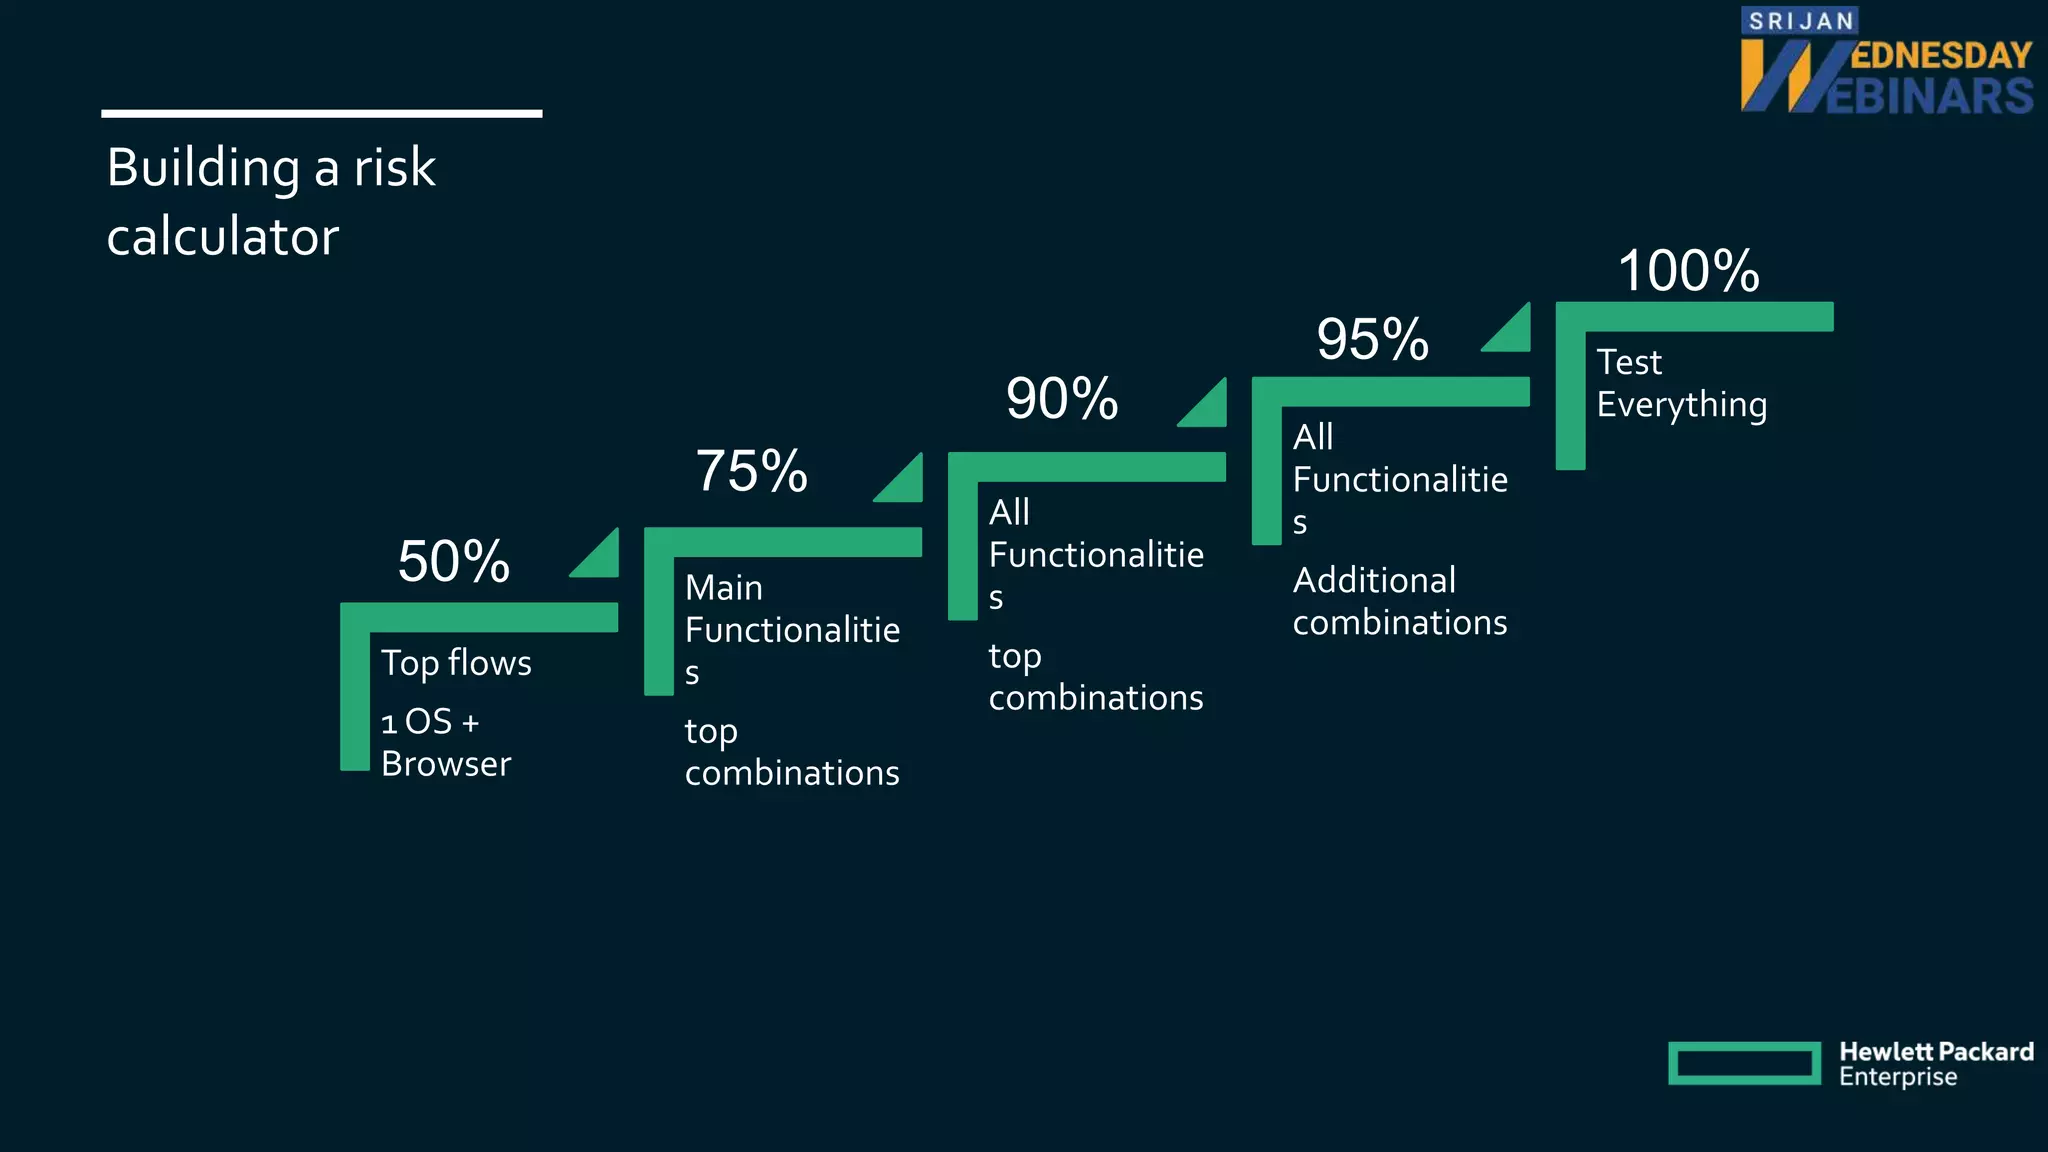
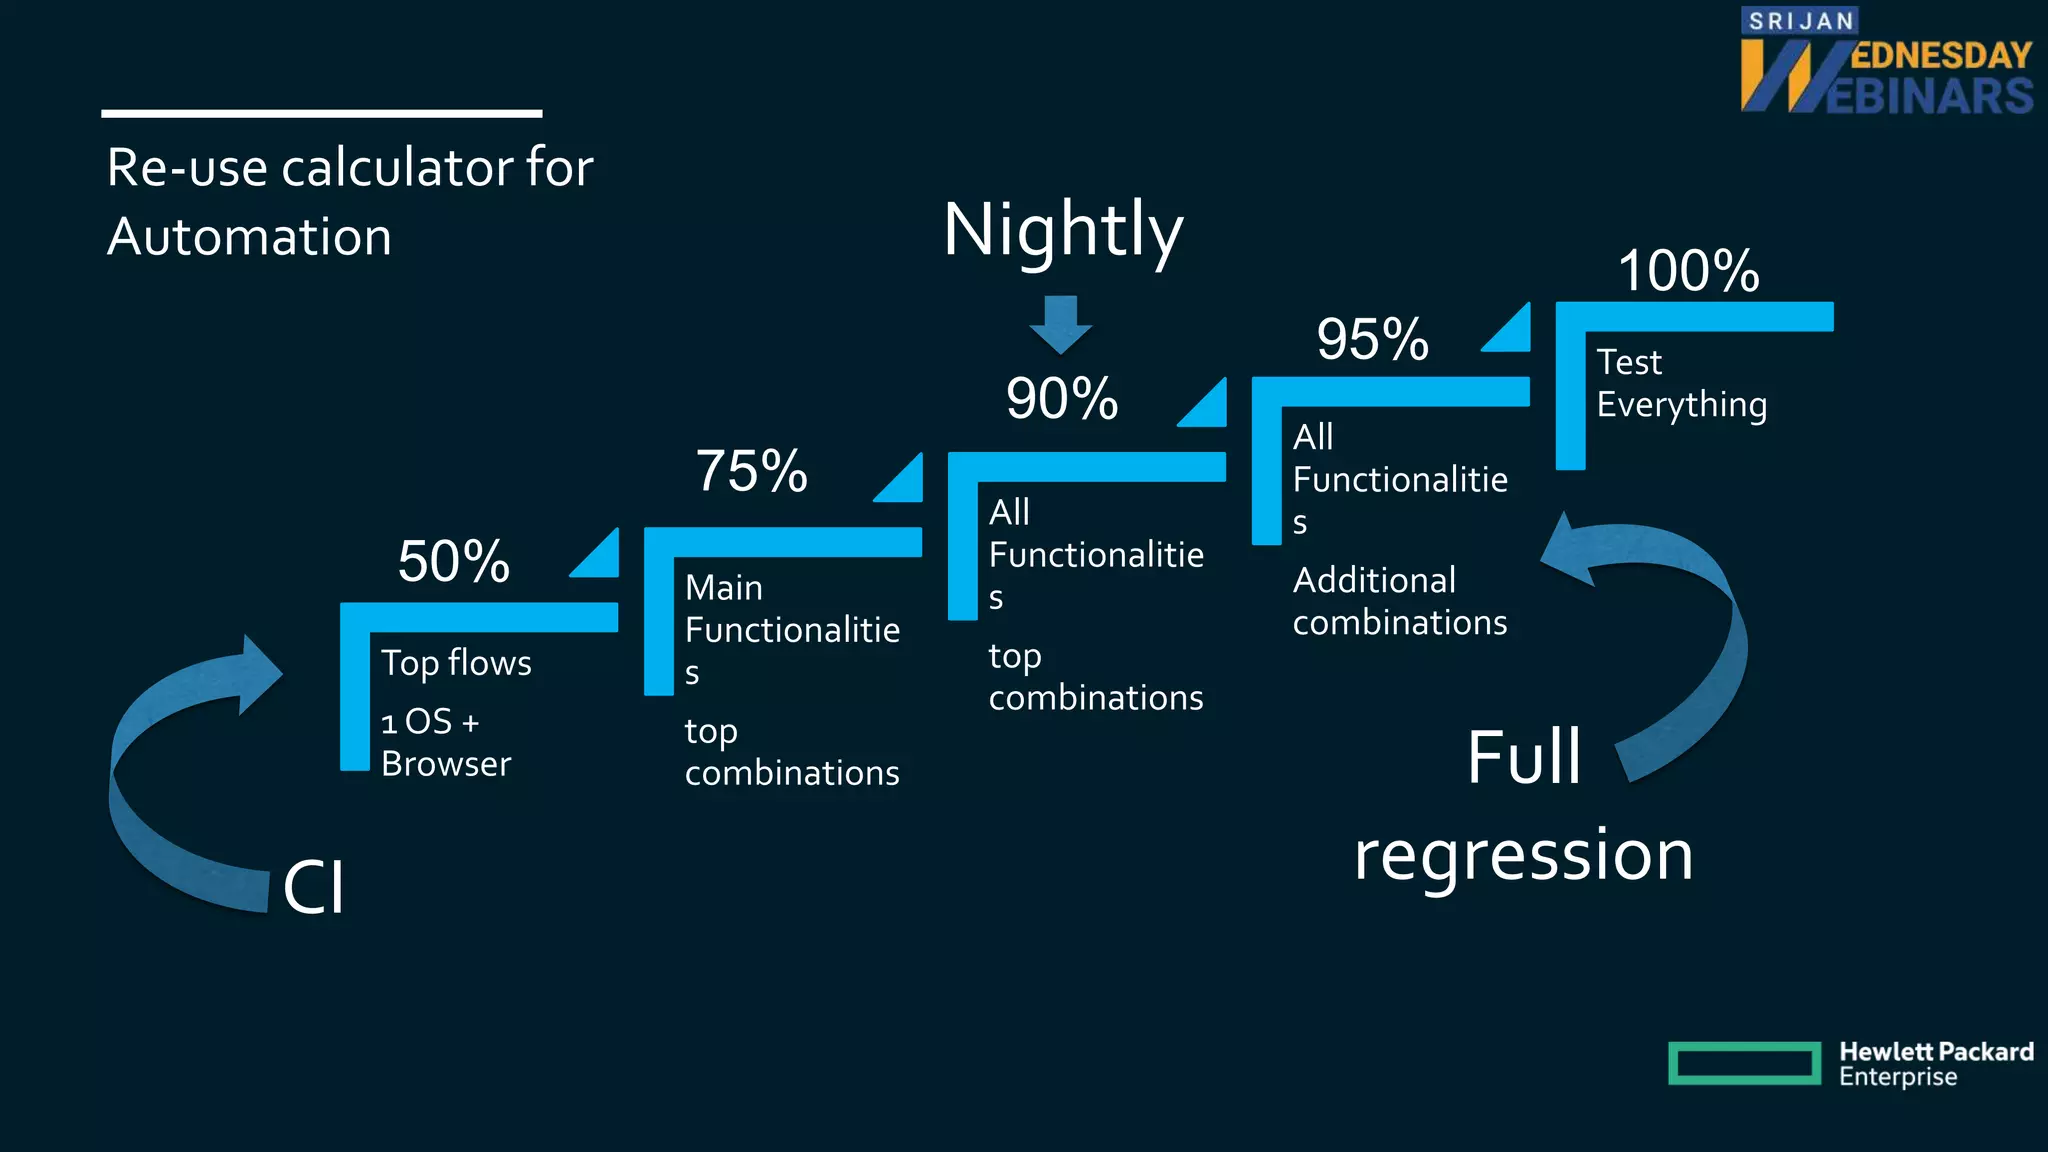
Analytics-driven testing uses data on user behavior and software usage to prioritize testing efforts on the most critical areas. This allows testing teams to significantly reduce regression testing time by focusing on the most popular features and environments rather than exhaustively testing all possible combinations. Analytics can provide insights into actual usage patterns to determine the optimal risk-based testing strategy and achieve high test coverage within constrained timelines.


![[TestWarez 2017] Od testowania do monitoringu jakości – wyzwania Continuous ...](https://cdn.slidesharecdn.com/ss_thumbnails/blaszakmichalprezentacjatestwarez2017engfinal-180125202316-thumbnail.jpg?width=640&height=640&fit=bounds)


![[Srijan Wednesday Webinar] How to Run Stateless and Stateful Services on K8S ...](https://cdn.slidesharecdn.com/ss_thumbnails/webinarbyadheip-190829125159-thumbnail.jpg?width=640&height=640&fit=bounds)
![[Srijan Wednesday Webinars] How to Set Up a Node.js Microservices Architectur...](https://cdn.slidesharecdn.com/ss_thumbnails/webinarbywilson-190221124622-thumbnail.jpg?width=640&height=640&fit=bounds)
![[Srijan Wednesday Webinars] How to Build a Cloud Native Platform for Enterpri...](https://cdn.slidesharecdn.com/ss_thumbnails/srijanwwcloudnativeplatformfordrupal-181213101558-thumbnail.jpg?width=640&height=640&fit=bounds)
![[Srijan Wednesday Webinars] Using Drupal as Data Pipeline for Digital Signage](https://cdn.slidesharecdn.com/ss_thumbnails/2018-srijanwebinardatapipelines-180607133946-thumbnail.jpg?width=640&height=640&fit=bounds)
![[Srijan Wednesday Webinars] New Recipe of Decoupling: Drupal 8, Symfony and S...](https://cdn.slidesharecdn.com/ss_thumbnails/webinarwithjyotisingh1-180426112348-thumbnail.jpg?width=640&height=640&fit=bounds)
![[Srijan Wednesday Webinars] Let’s Take the Best Route - Exploring Drupal 8 Ro...](https://cdn.slidesharecdn.com/ss_thumbnails/webinarbysurbhi-180405093703-thumbnail.jpg?width=640&height=640&fit=bounds)
![[Srijan Wednesday Webinars] Is Your Business Ready for GDPR](https://cdn.slidesharecdn.com/ss_thumbnails/webinartemplateformatt-180125105251-thumbnail.jpg?width=640&height=640&fit=bounds)
![[Srijan Wednesday Webinars] Artificial Intelligence & the Future of Business](https://cdn.slidesharecdn.com/ss_thumbnails/disrupt4-171207140409-thumbnail.jpg?width=640&height=640&fit=bounds)
![[Srijan Wednesday Webinars] How to Design a Chatbot that Works](https://cdn.slidesharecdn.com/ss_thumbnails/webinarbyjess-171012044154-thumbnail.jpg?width=640&height=640&fit=bounds)
![[Srijan Wednesday Webinars] Simplifying Migration to Drupal 8](https://cdn.slidesharecdn.com/ss_thumbnails/webinarbysugandh-170817143543-thumbnail.jpg?width=640&height=640&fit=bounds)

![[Srijan Wednesday Webinar] Leveraging the OGD Platform and Visualization Engine](https://cdn.slidesharecdn.com/ss_thumbnails/webinar-leveragingtheogdplatformandvisualizationengine-28-6-20171-170630114628-thumbnail.jpg?width=640&height=640&fit=bounds)
![[Srijan Wednesday Webinar] Key ingredients of a Powerful Test Automation System](https://cdn.slidesharecdn.com/ss_thumbnails/webinarbynitin-170406054723-thumbnail.jpg?width=640&height=640&fit=bounds)
![[Srijan Wednesday Webinar] Building BPMN Web Portals with Camunda and Drupal](https://cdn.slidesharecdn.com/ss_thumbnails/srijanwebinarbyishan-170323055342-thumbnail.jpg?width=640&height=640&fit=bounds)
![[Srijan Wednesday Webinar] Decoupled Demystified: The Present & Future of Dr...](https://cdn.slidesharecdn.com/ss_thumbnails/srijanwebinartemplatebypreston-170310083838-thumbnail.jpg?width=640&height=640&fit=bounds)
![[Srijan Wednesday Webinars] Automating Visual Regression using ‘Galen’](https://cdn.slidesharecdn.com/ss_thumbnails/swwbysoumyajitanddeepshikha-170210122854-thumbnail.jpg?width=640&height=640&fit=bounds)
![[Srijan Wednesday Webinars] NASA, Netflix, Tinder: Digital Transformation and...](https://cdn.slidesharecdn.com/ss_thumbnails/node-170126155947-thumbnail.jpg?width=640&height=640&fit=bounds)
![[Srijan Wednesday Webinars] Building a High Performance QA Team](https://cdn.slidesharecdn.com/ss_thumbnails/srijan2016karim-161117105408-thumbnail.jpg?width=640&height=640&fit=bounds)
![[Srijan Wednesday Webinar] Mastering Mobile Test Automation with Appium](https://cdn.slidesharecdn.com/ss_thumbnails/srijan-webinar-161103125140-thumbnail.jpg?width=640&height=640&fit=bounds)
![[Srijan Wednesday Webinars] Transitioning to an Organization-wide Agile Culture](https://cdn.slidesharecdn.com/ss_thumbnails/organizationaltransformationtoagile-161027100144-thumbnail.jpg?width=640&height=640&fit=bounds)


