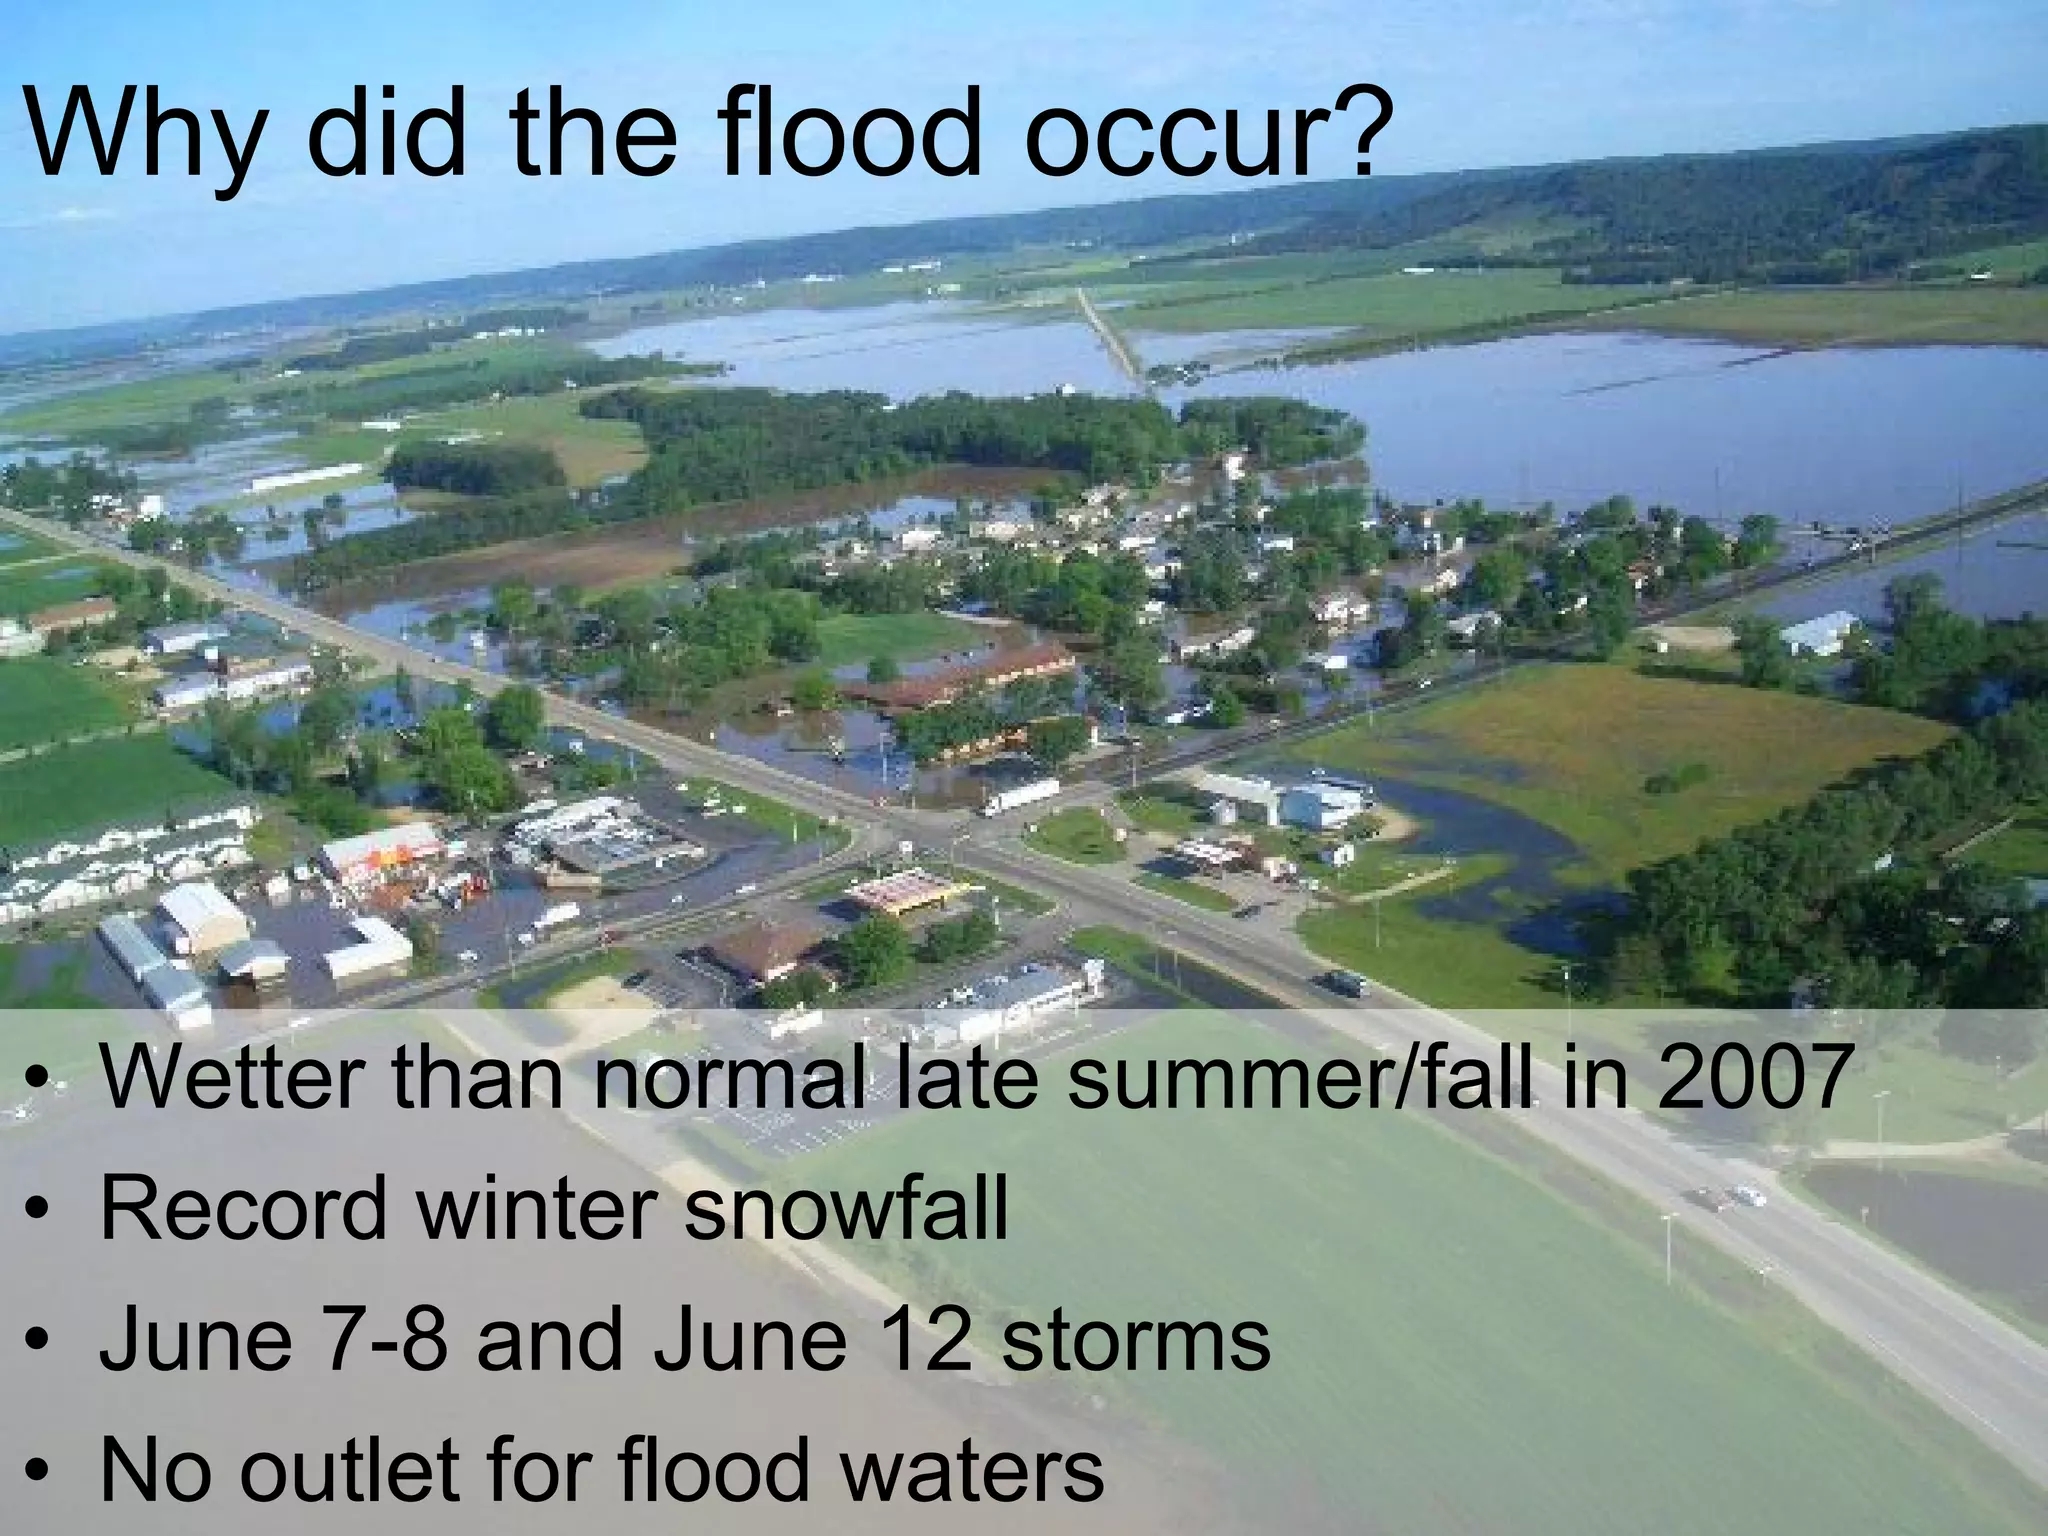
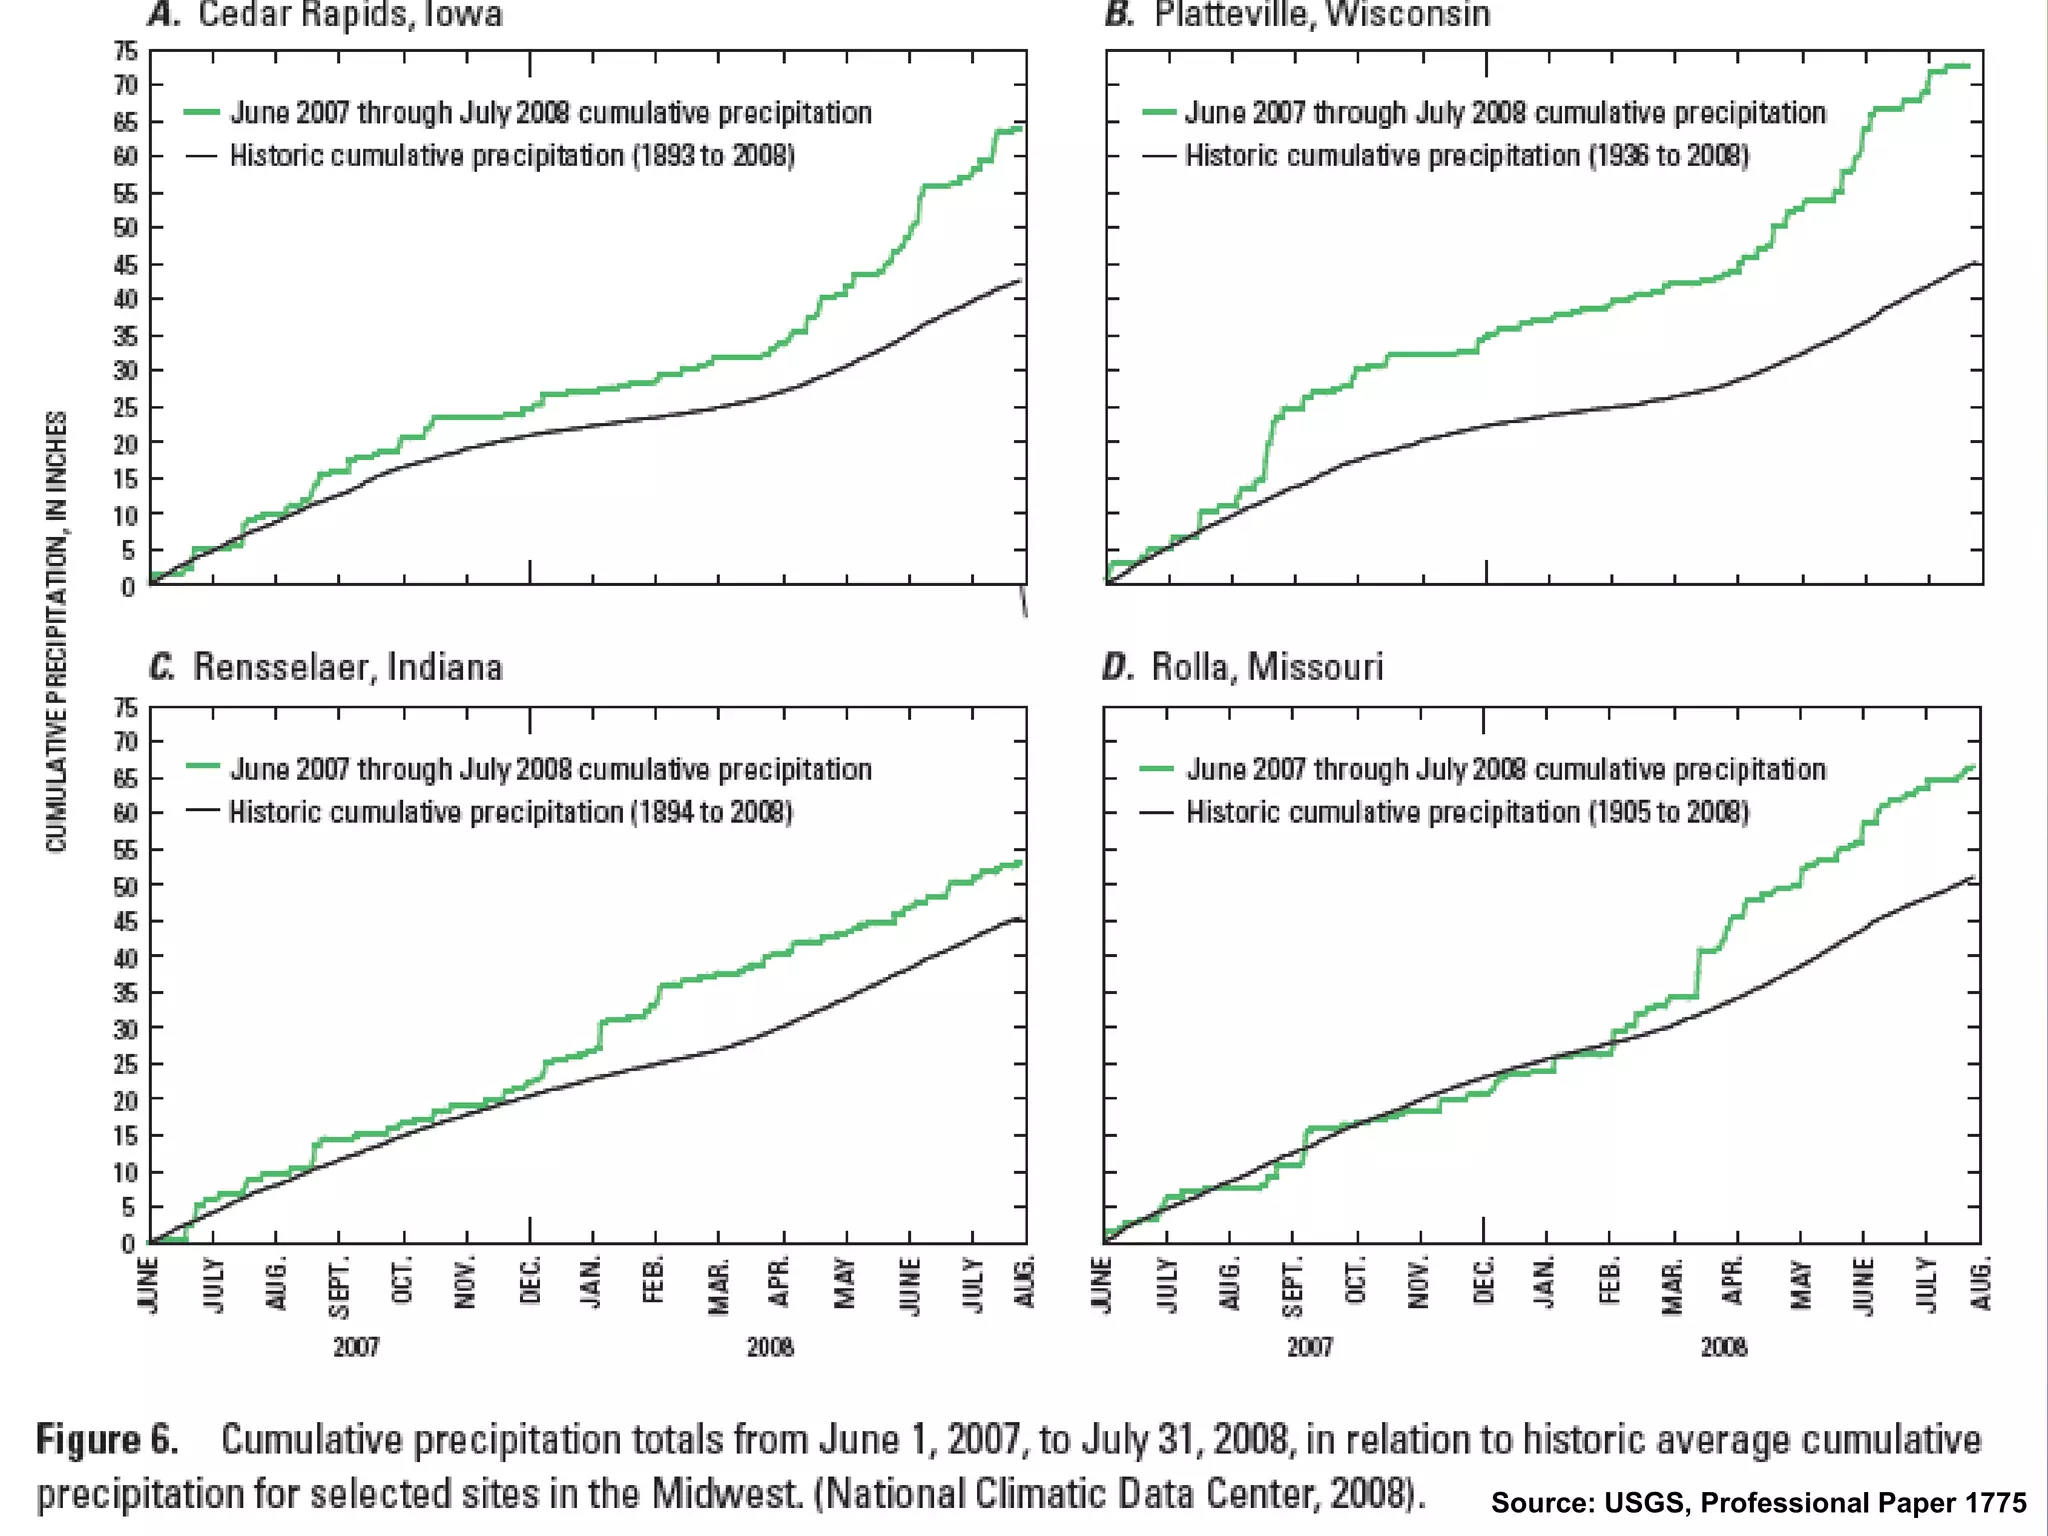
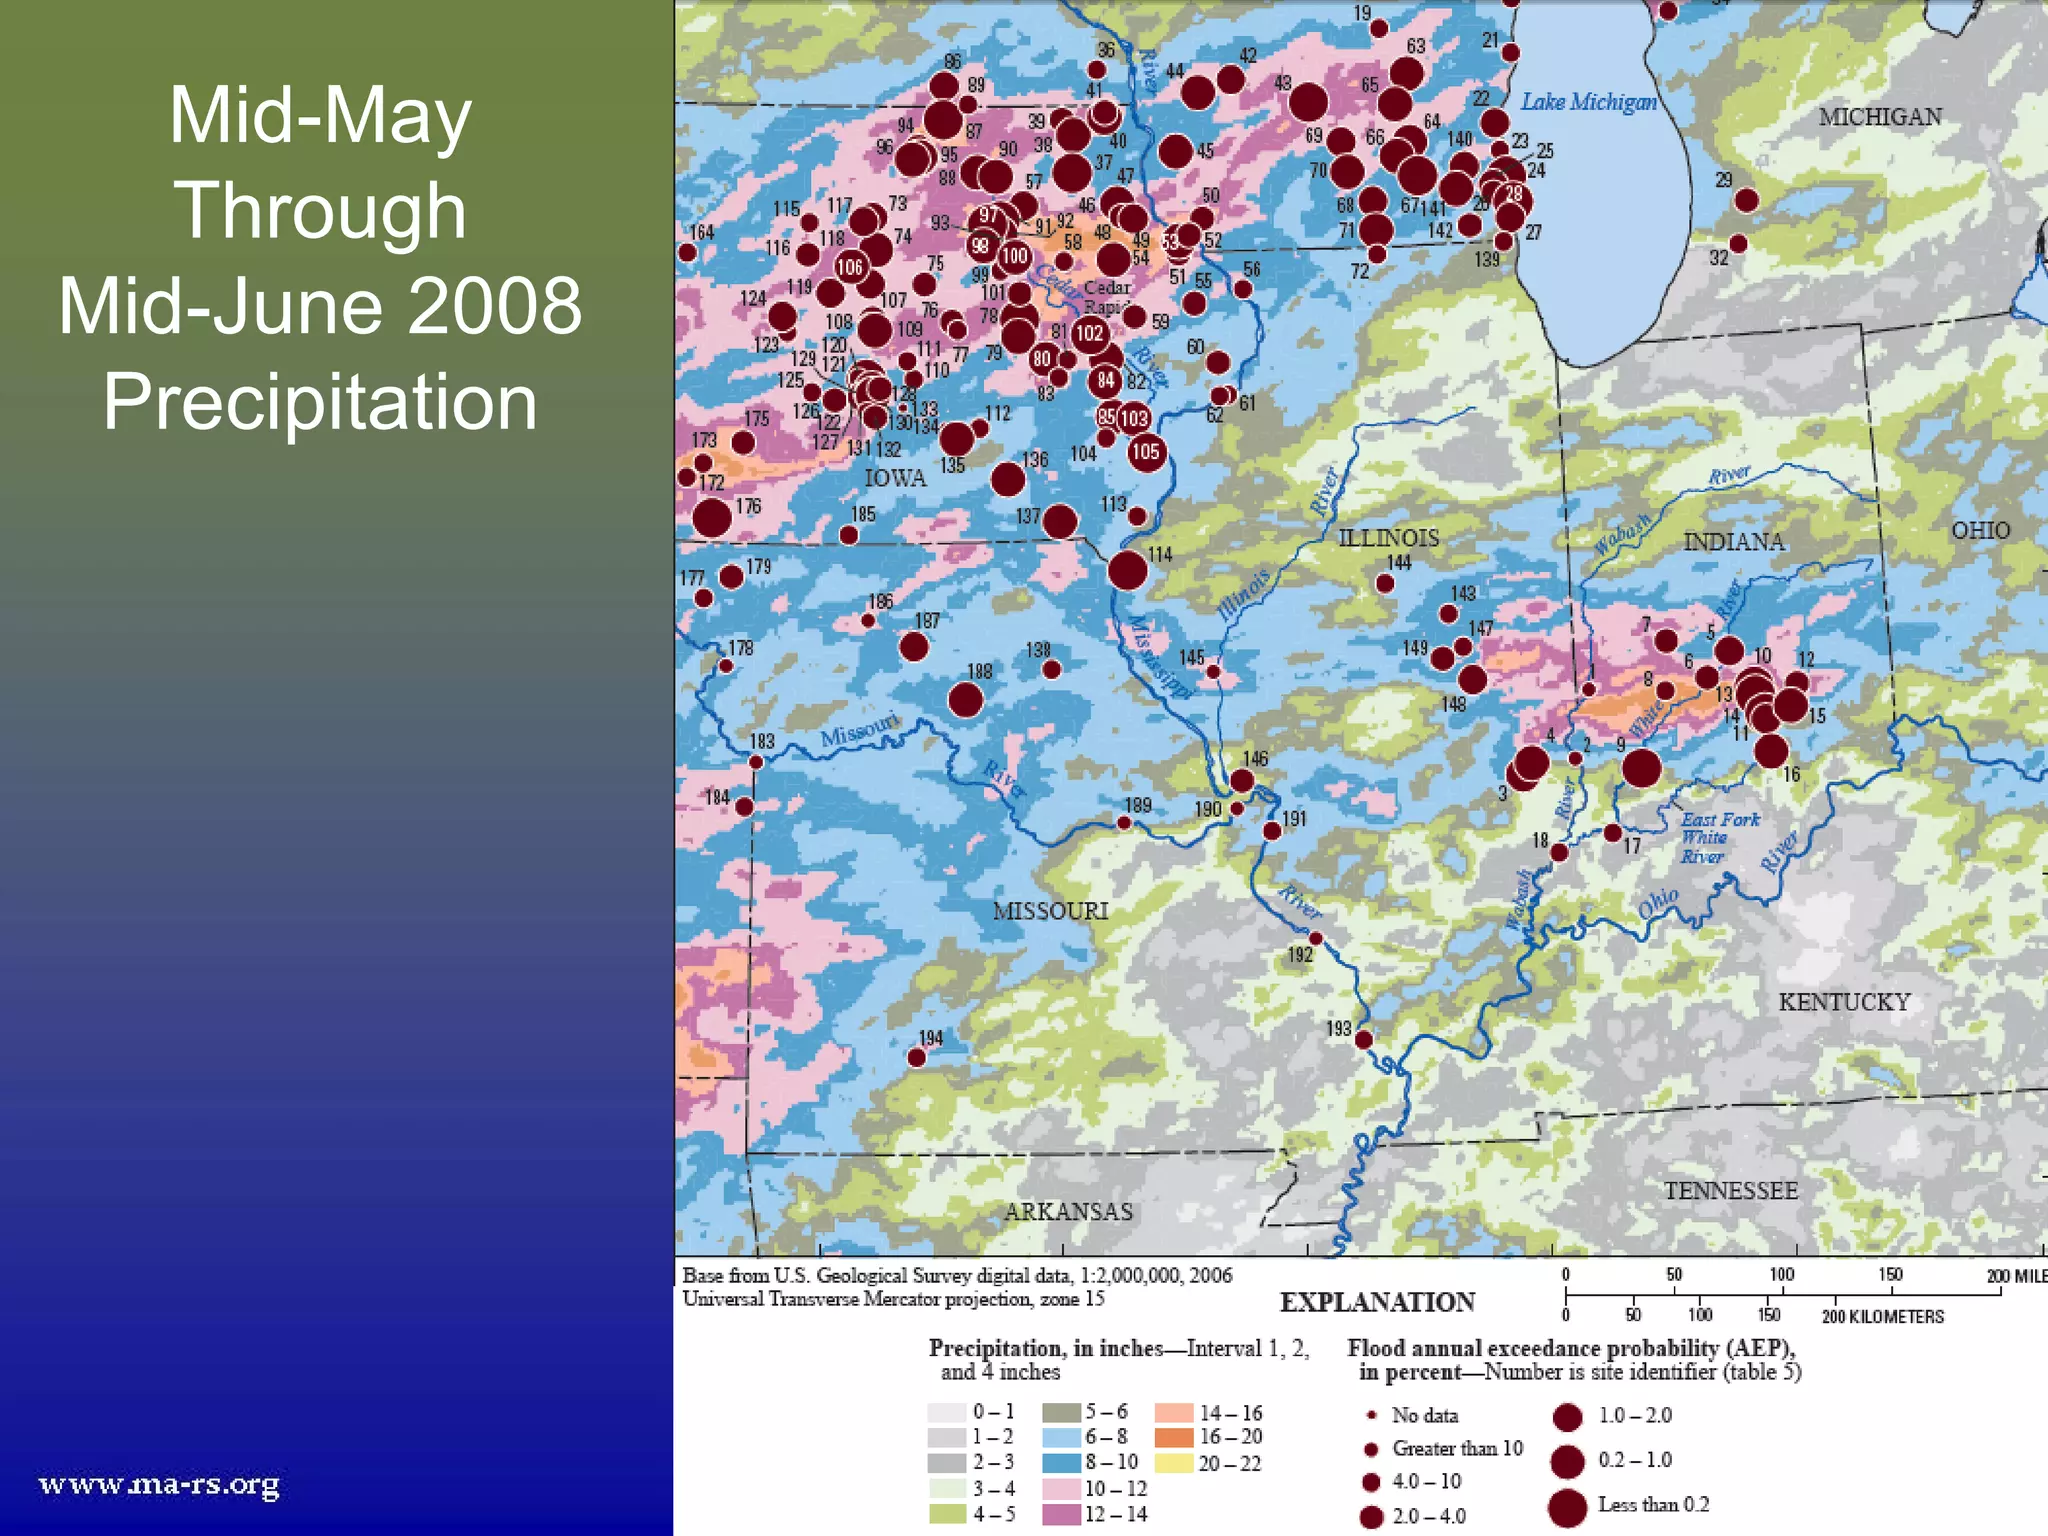
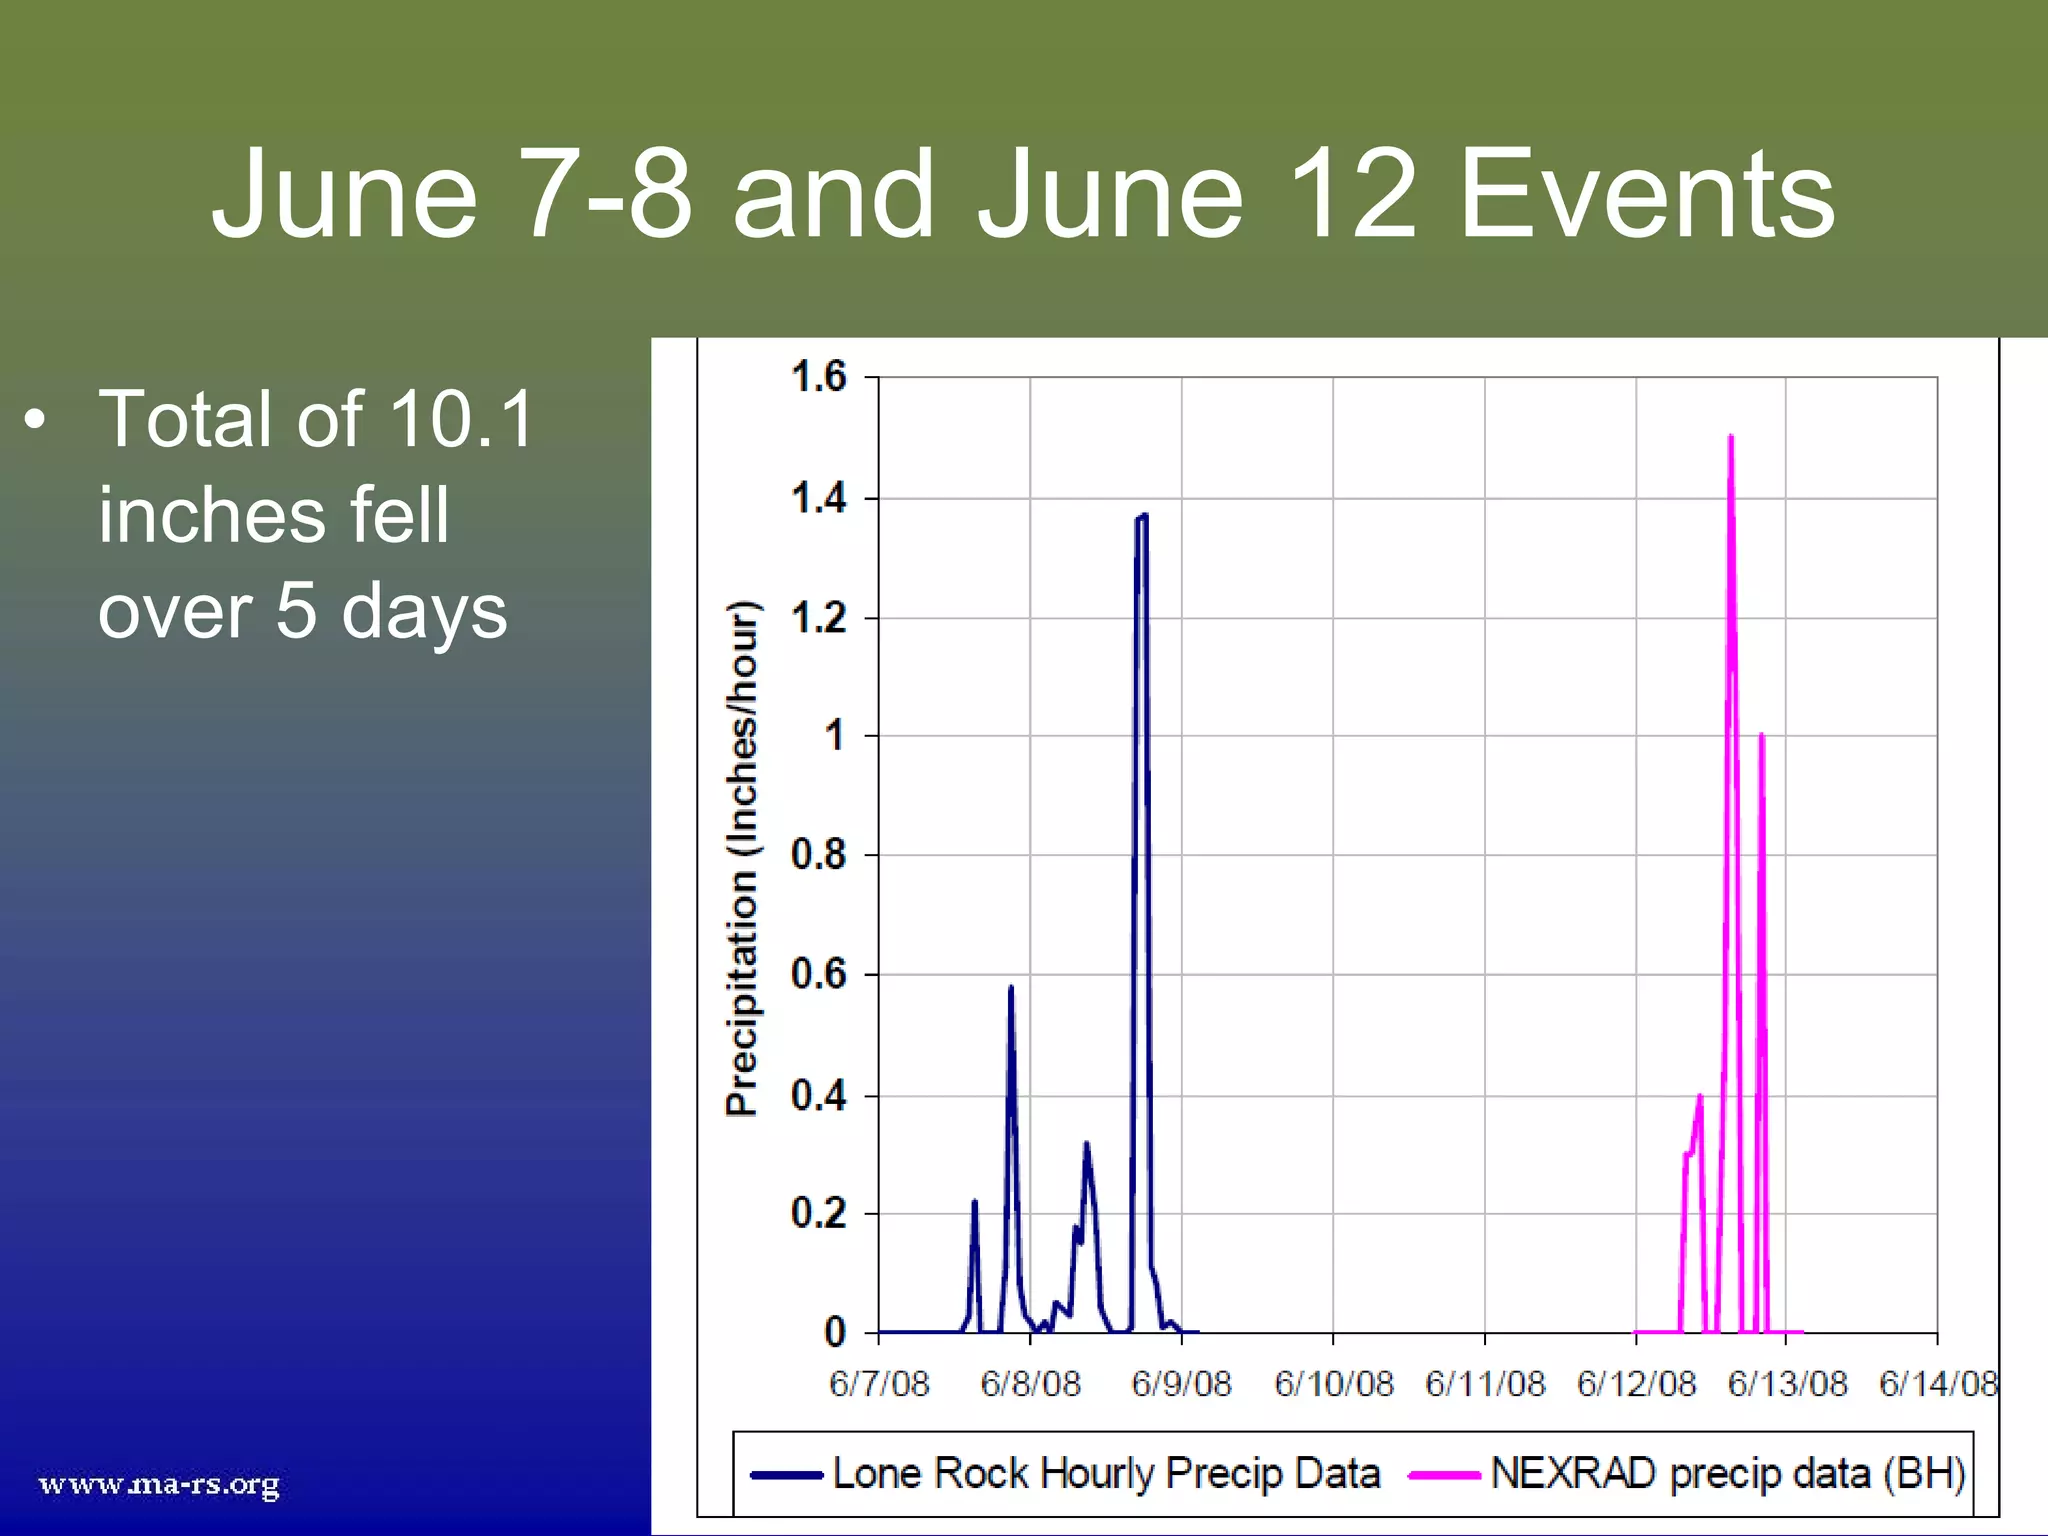
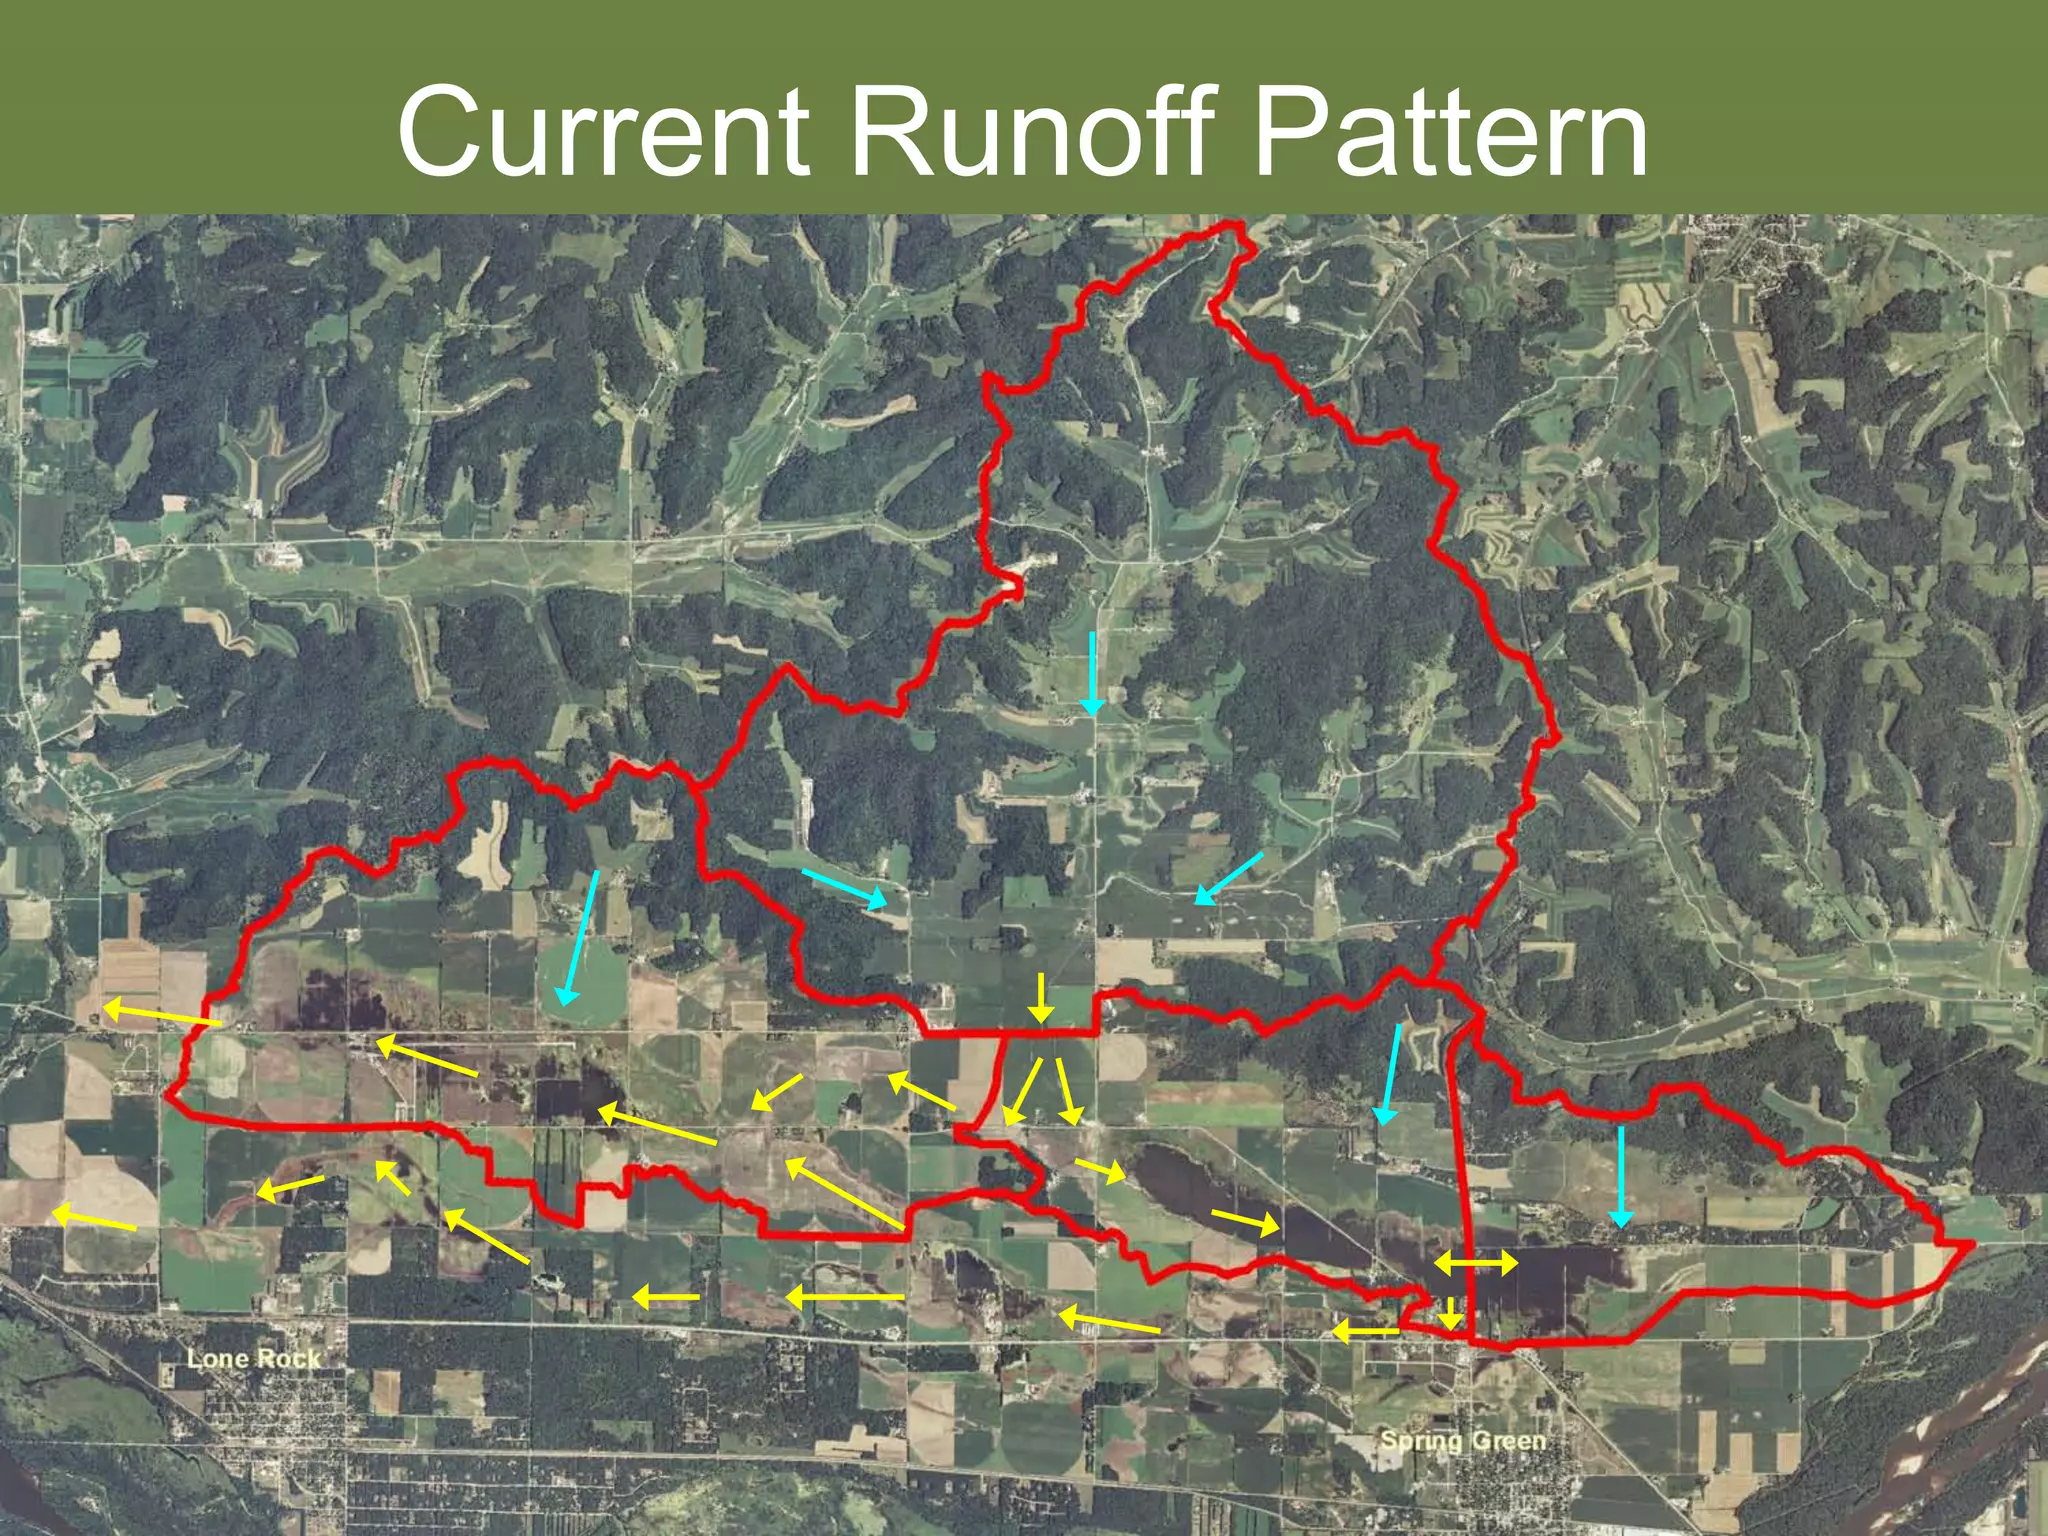
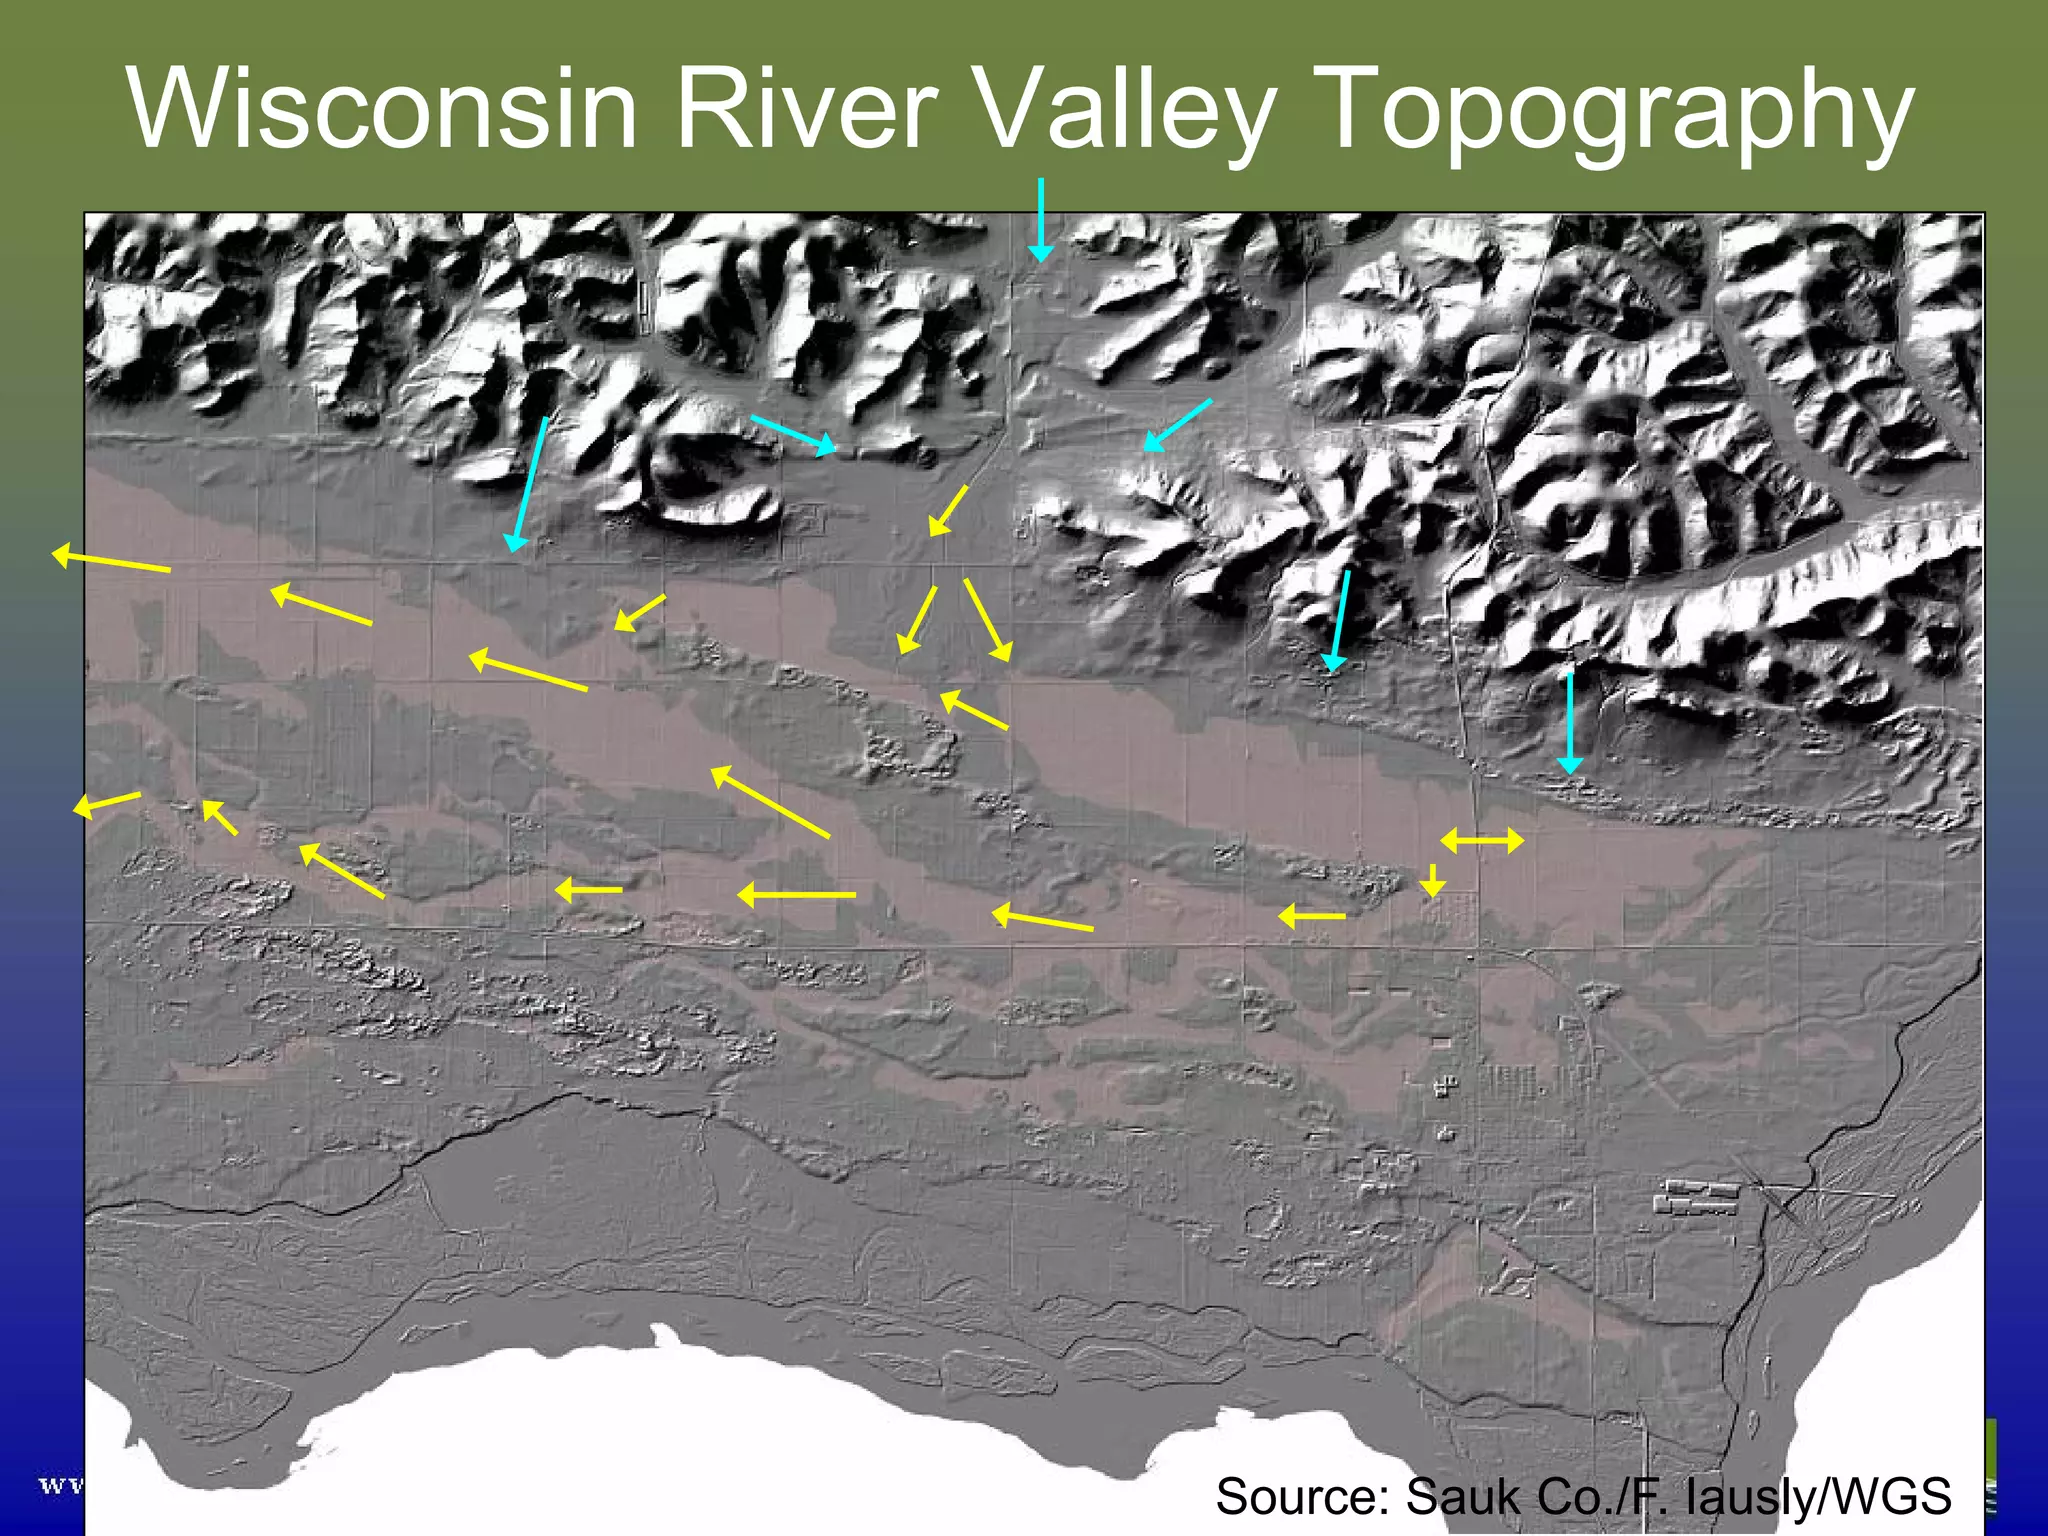
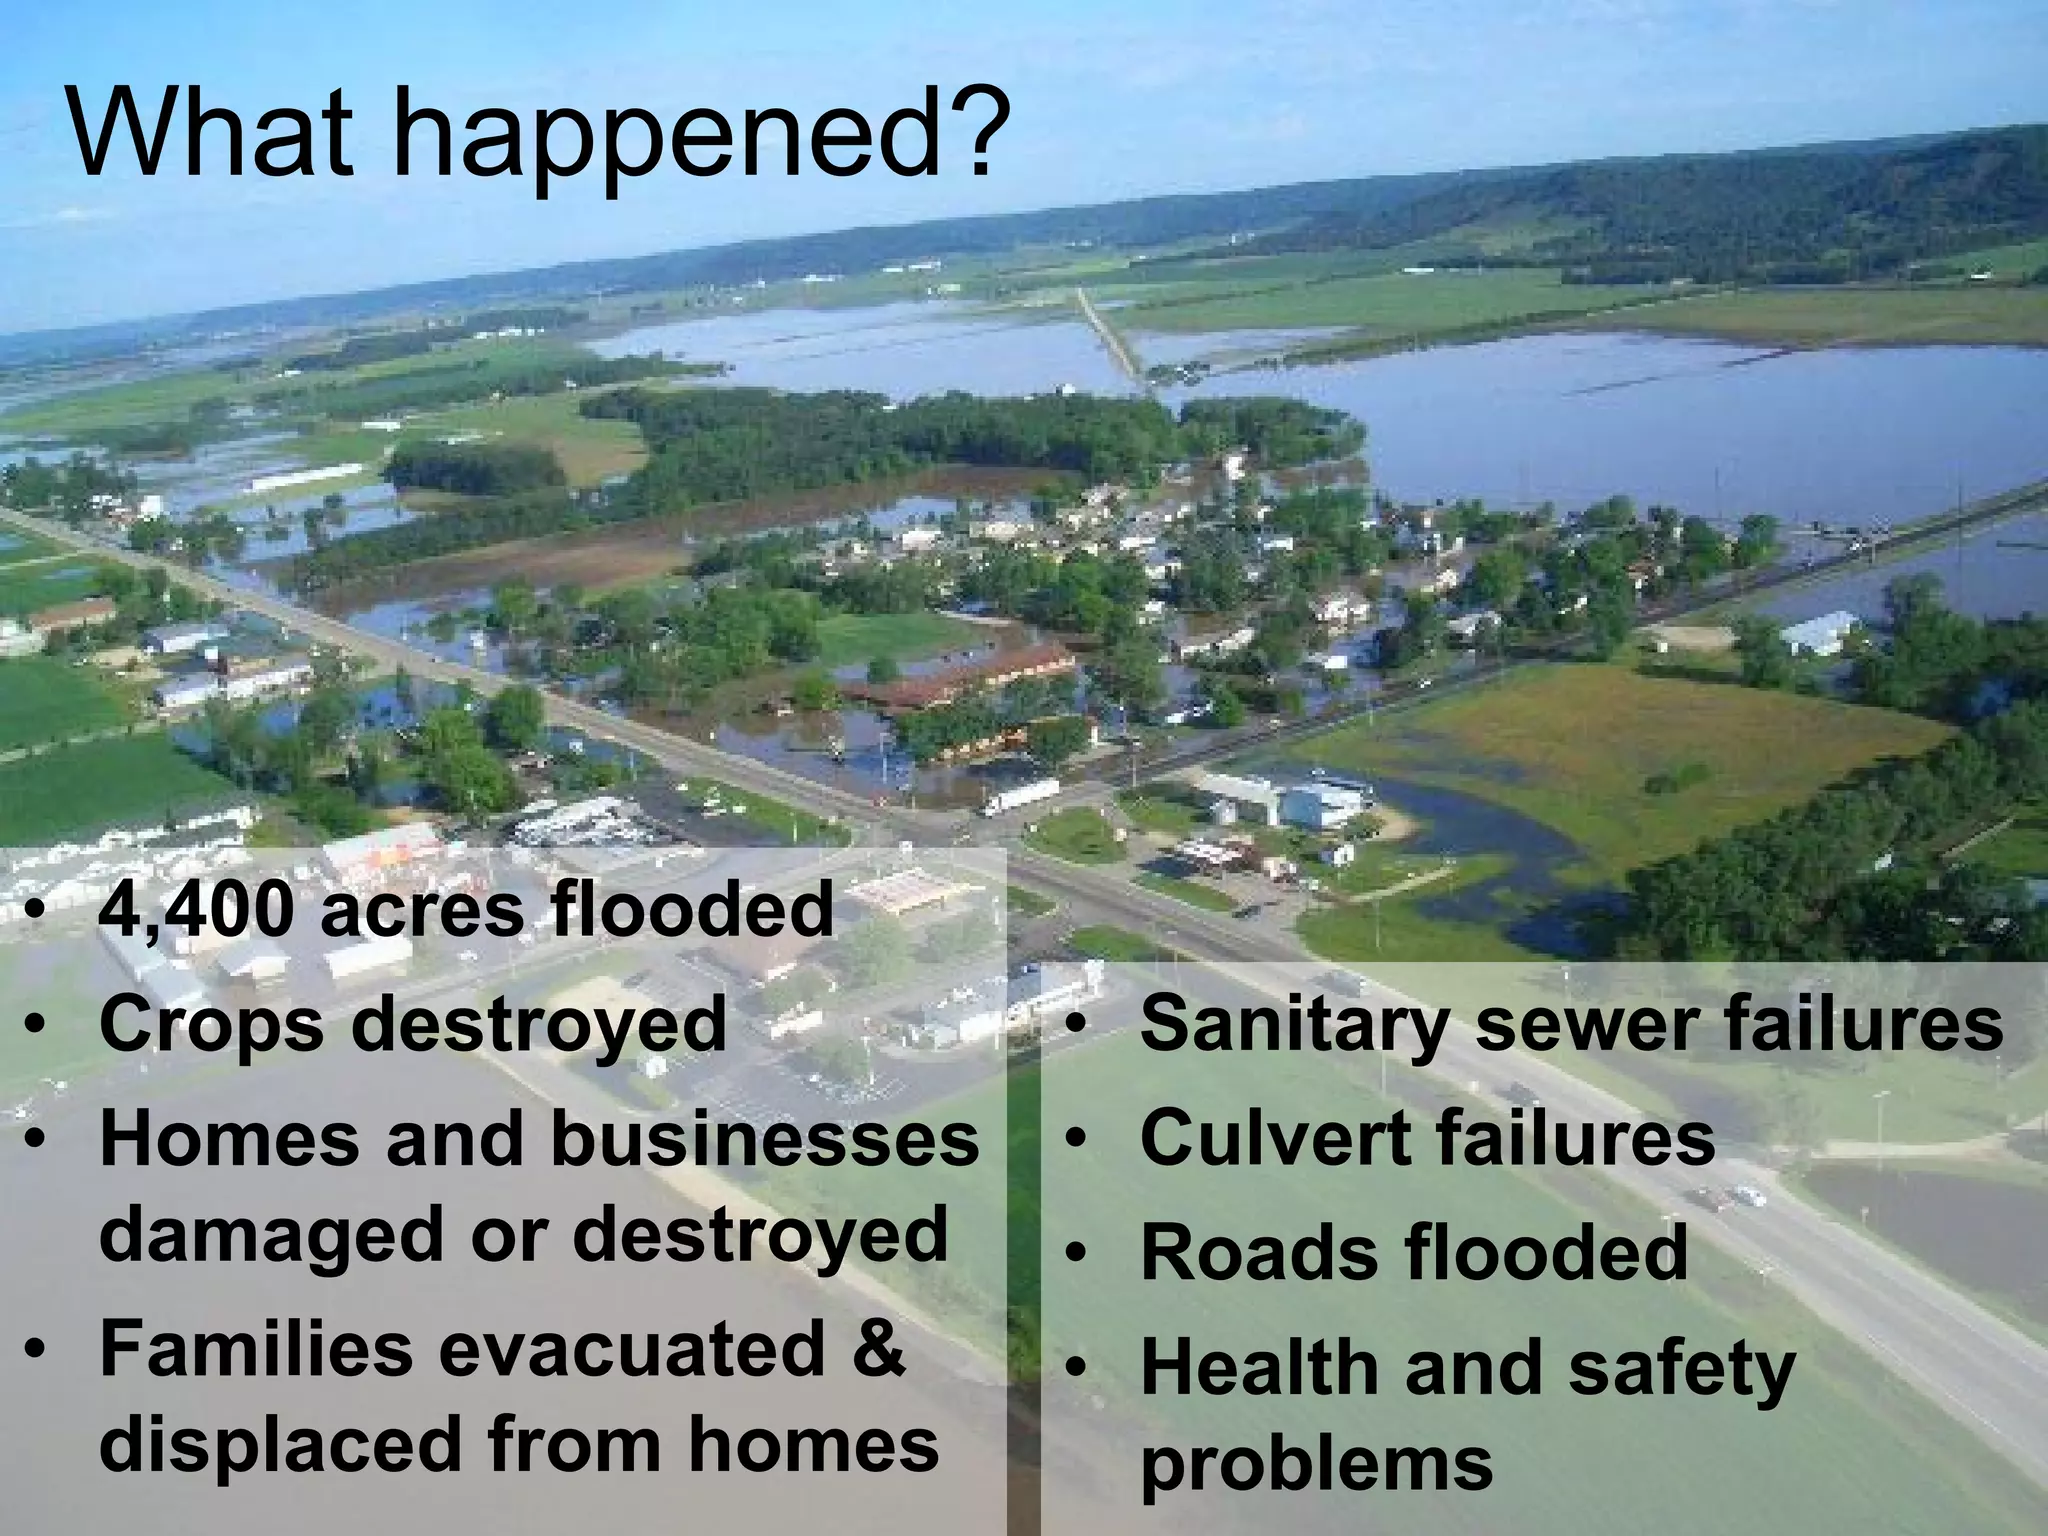
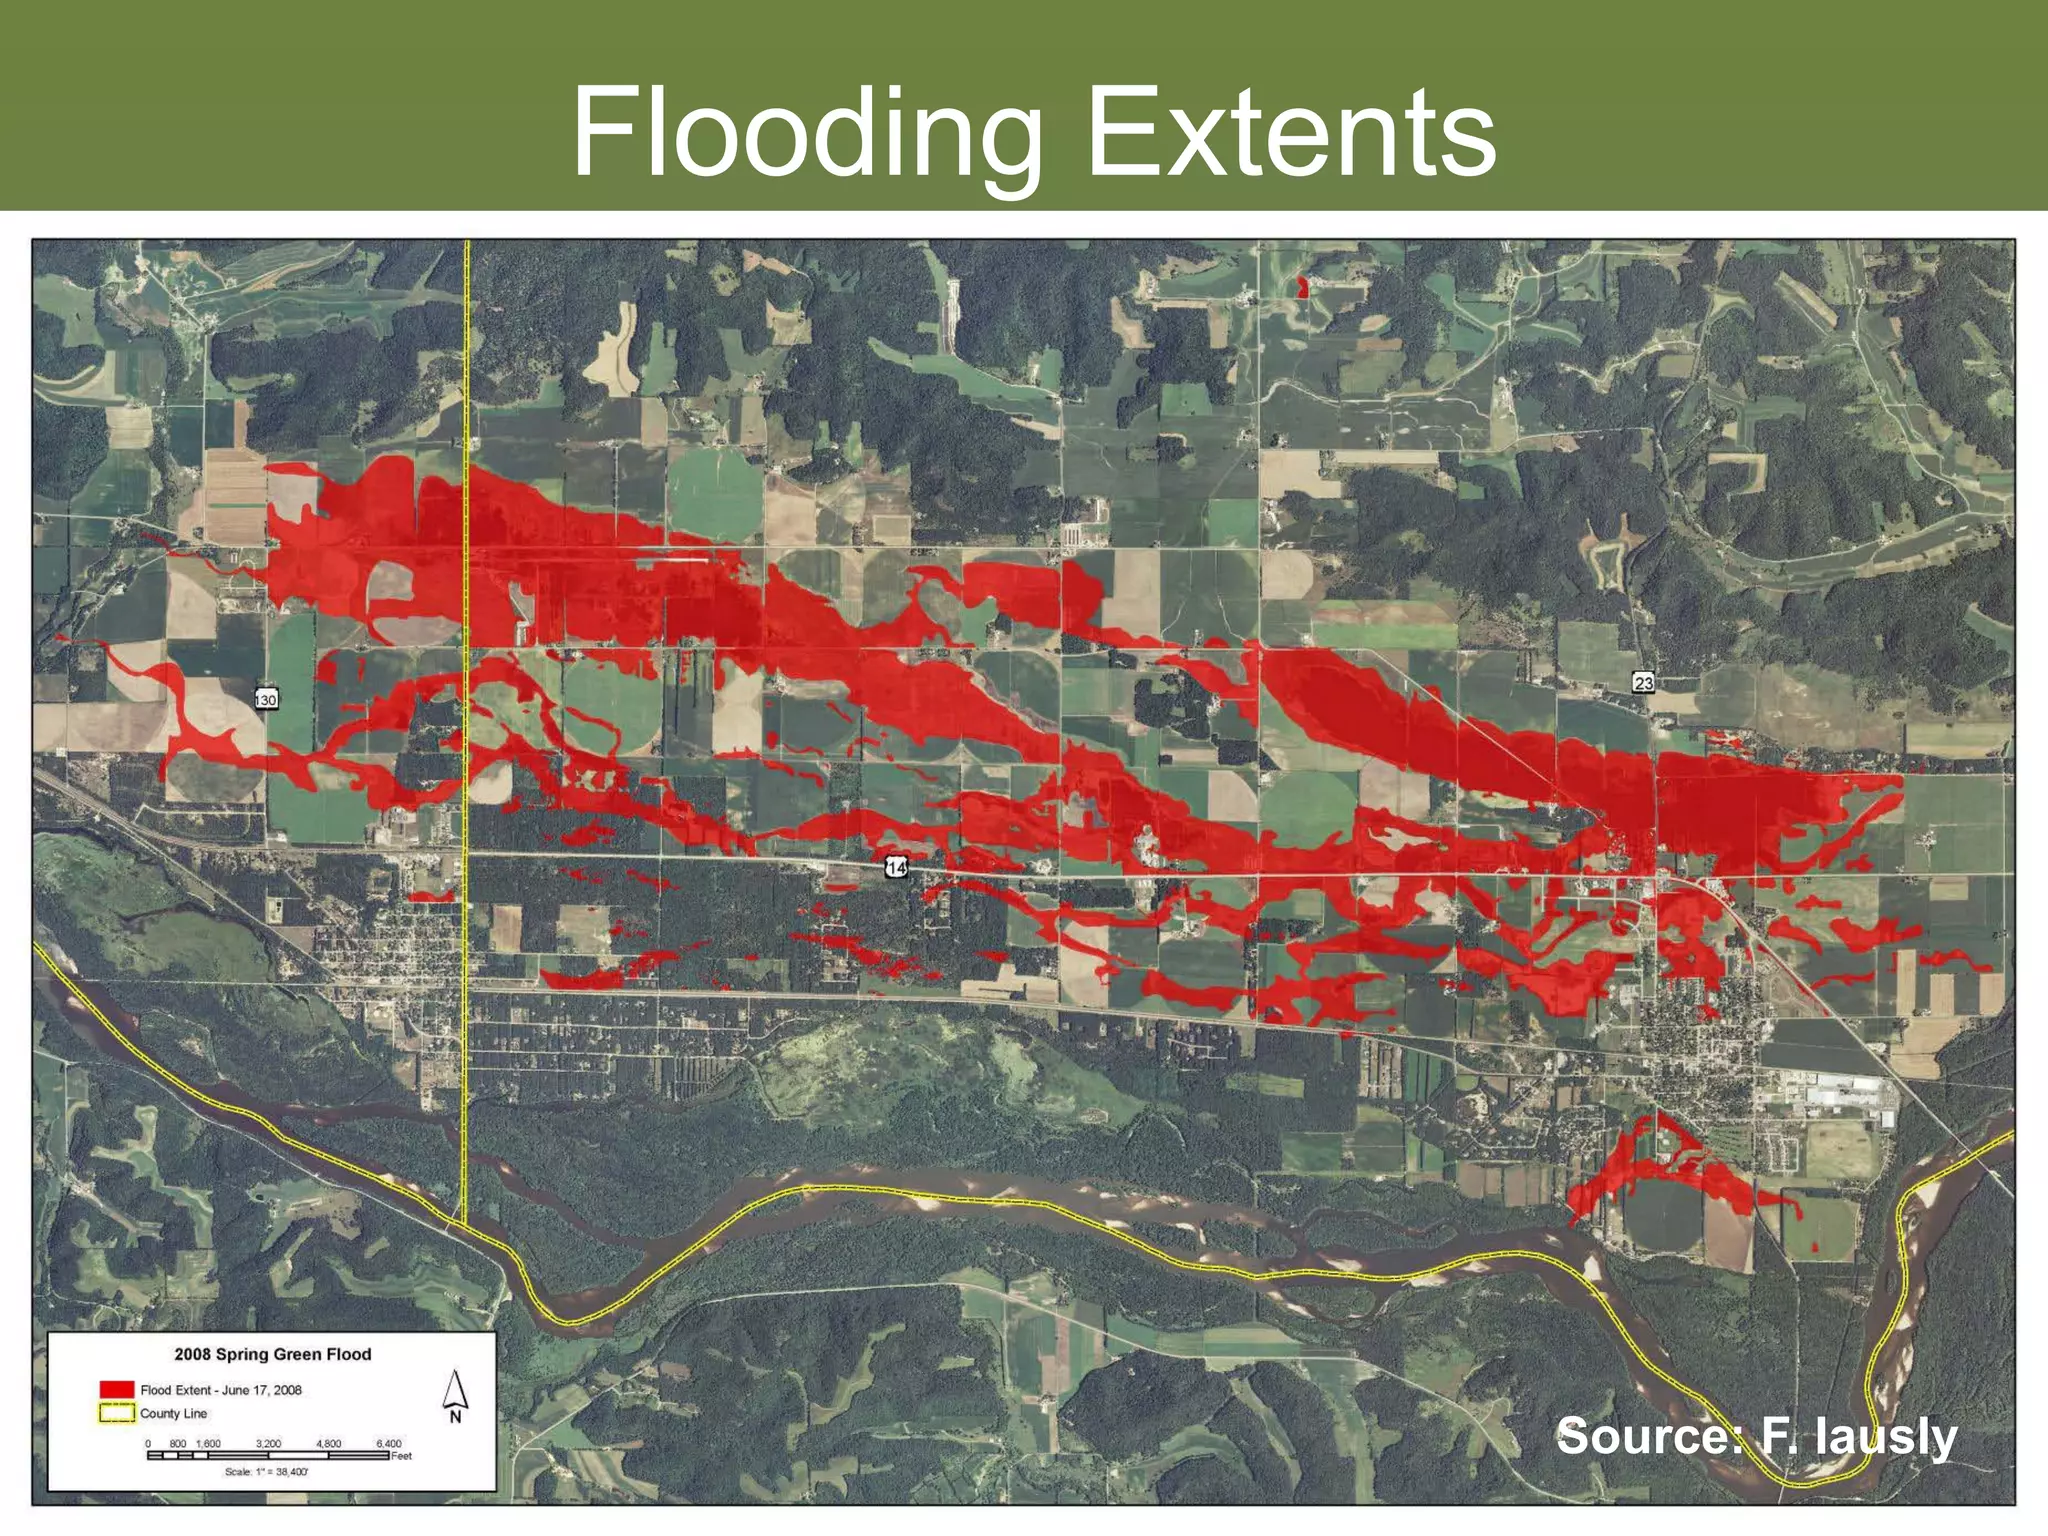
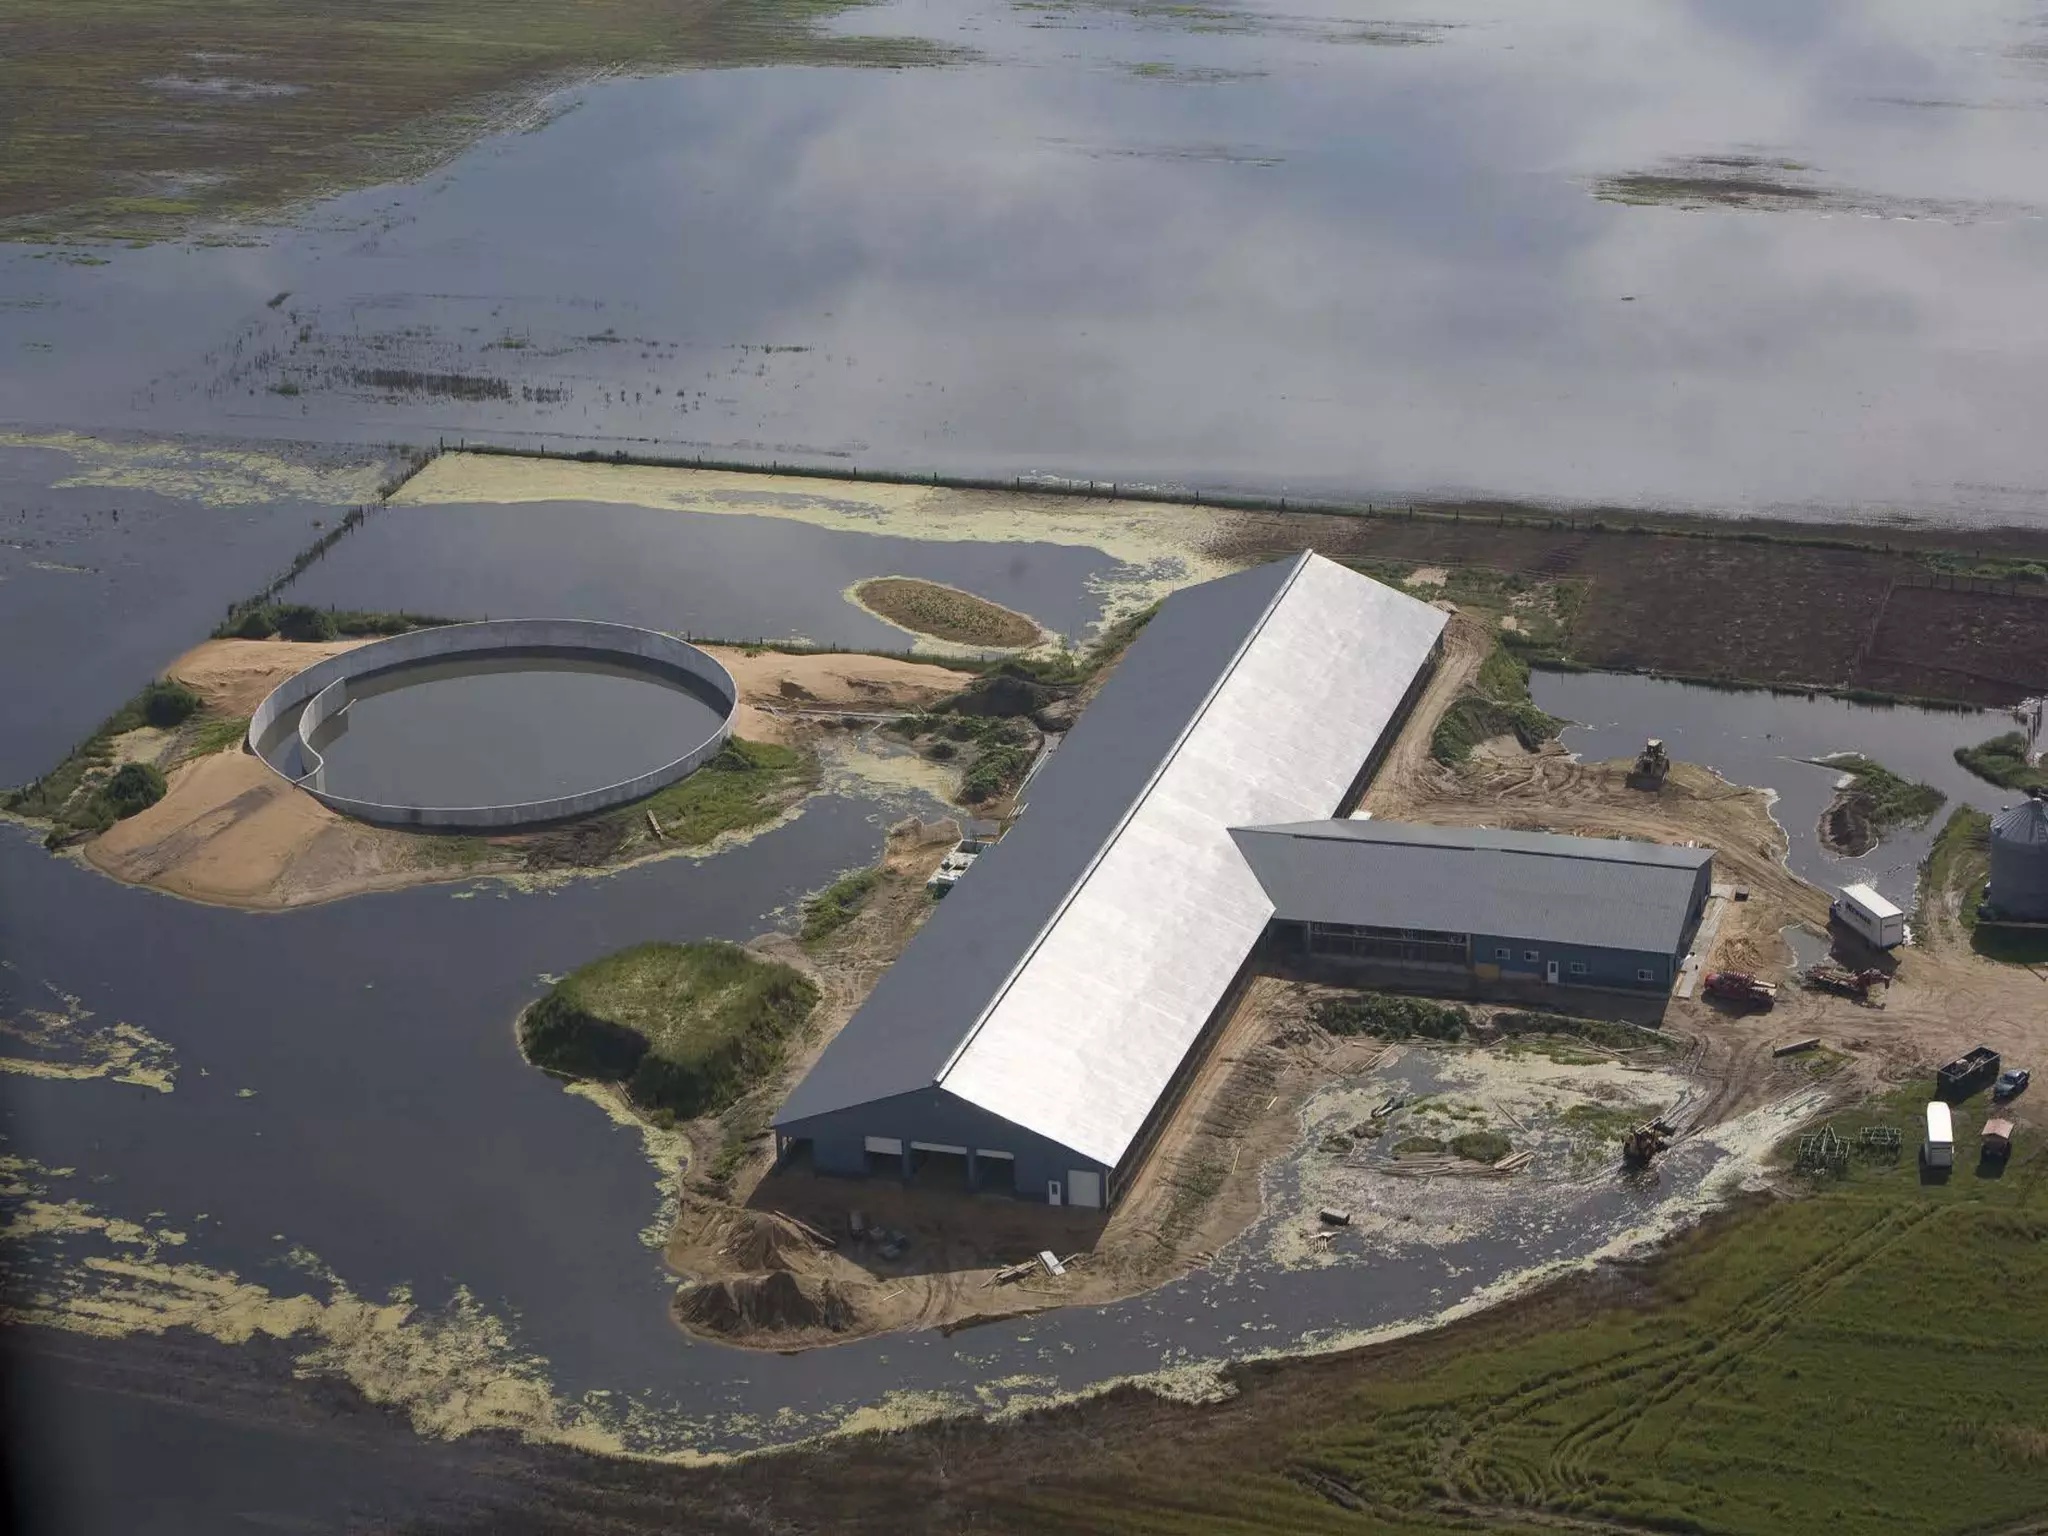
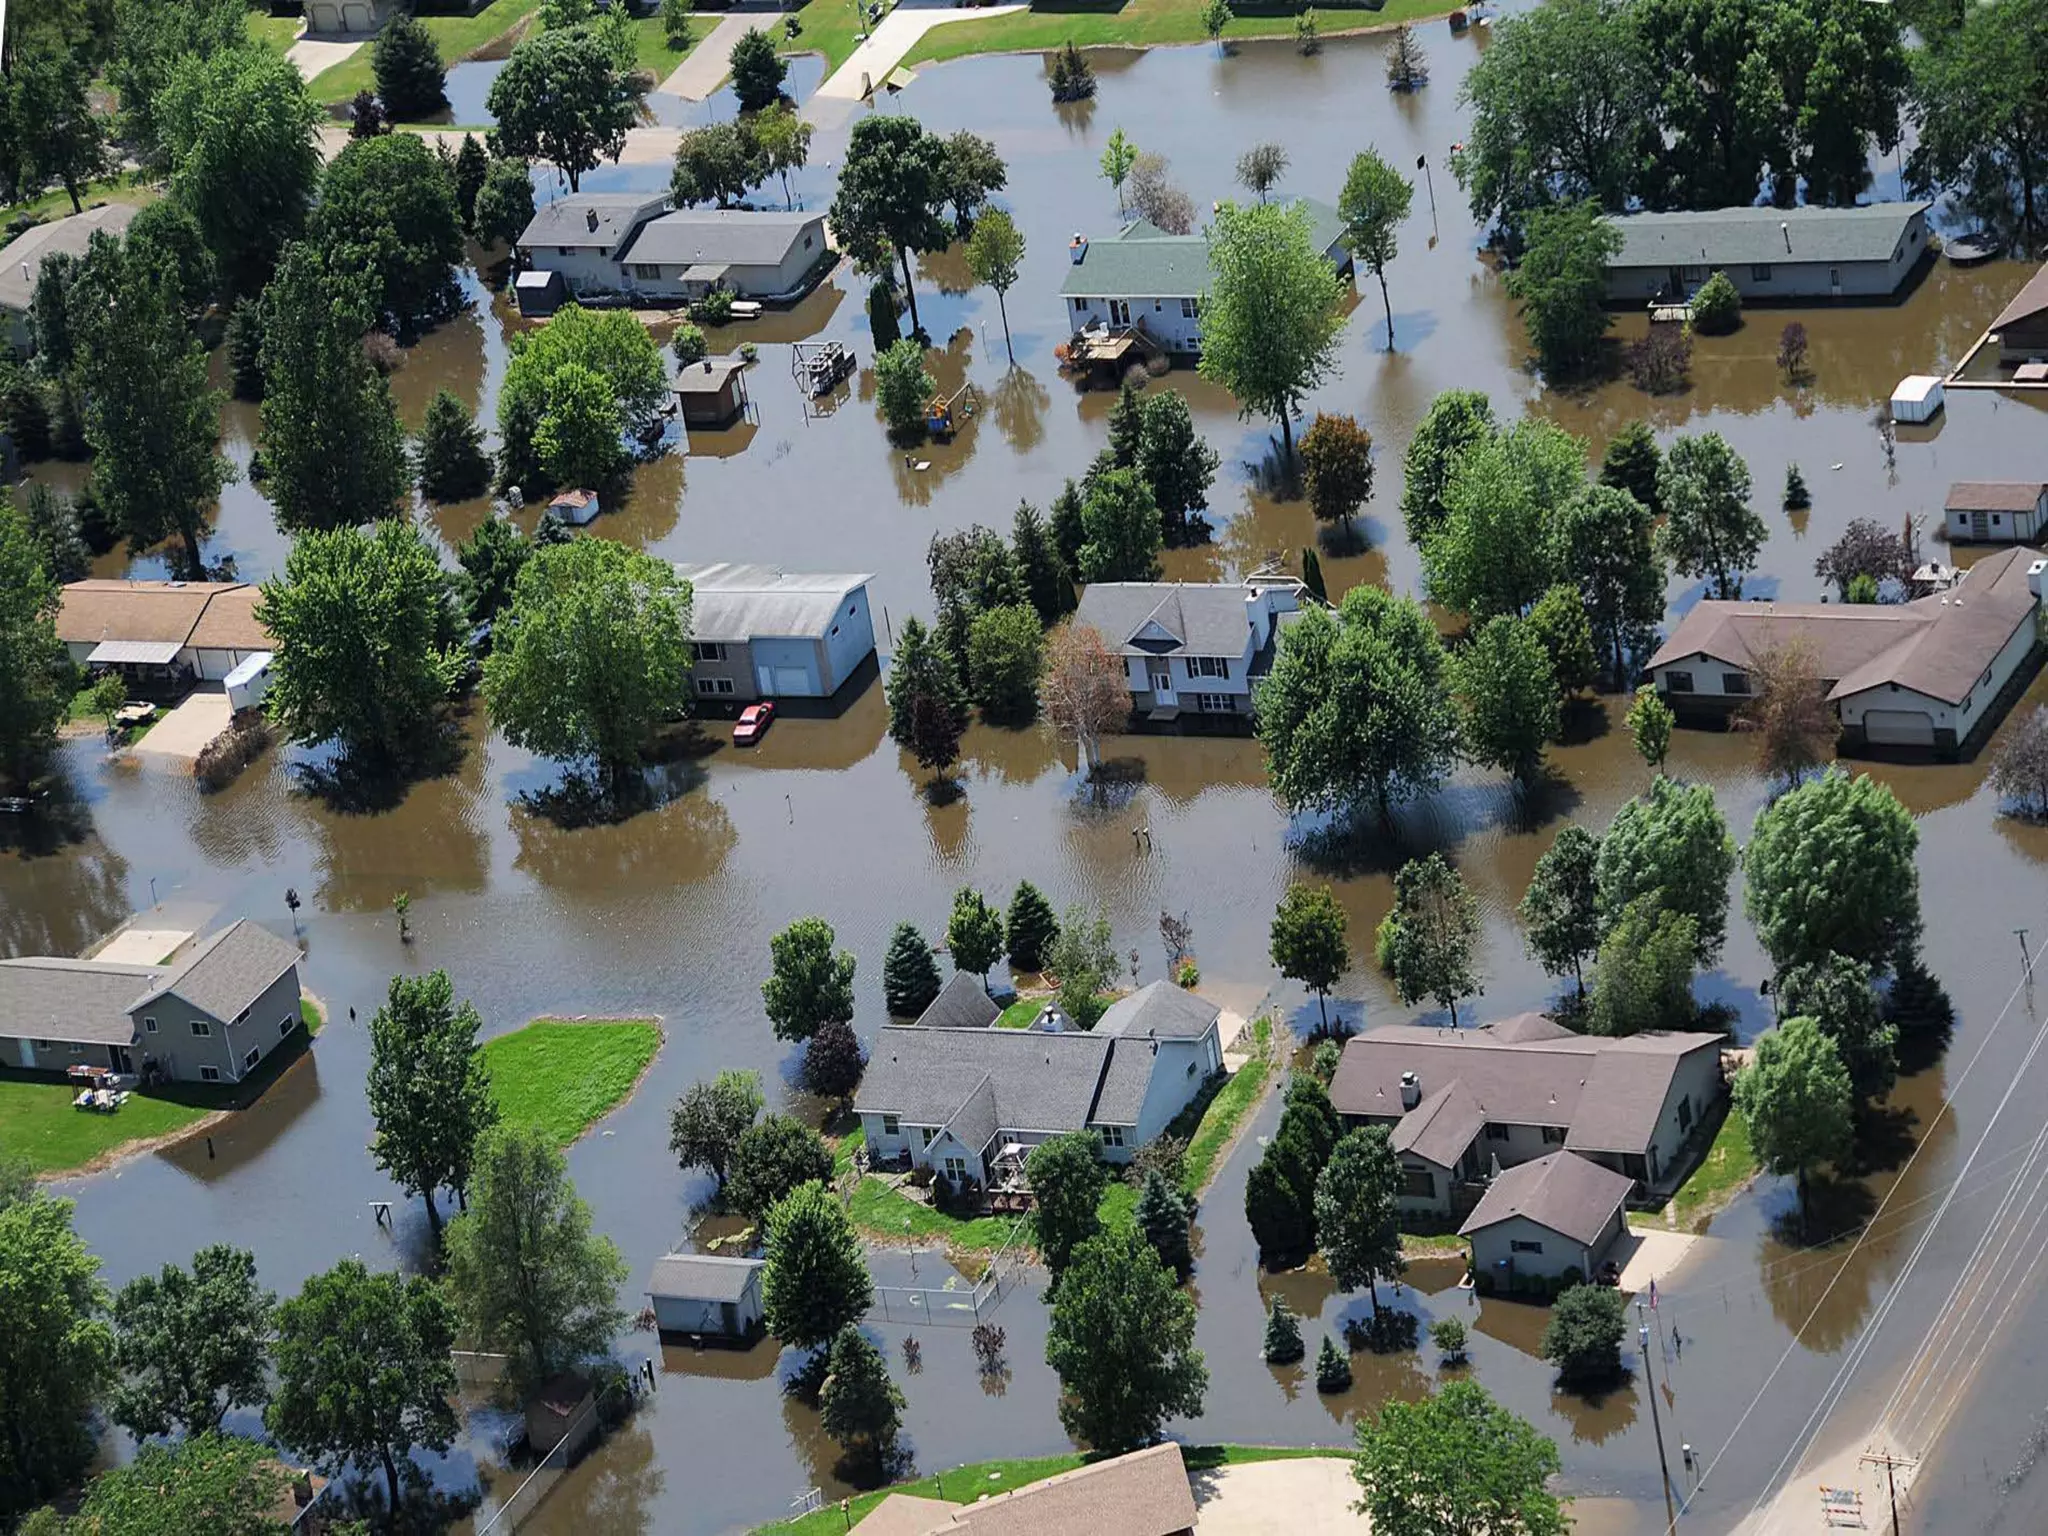
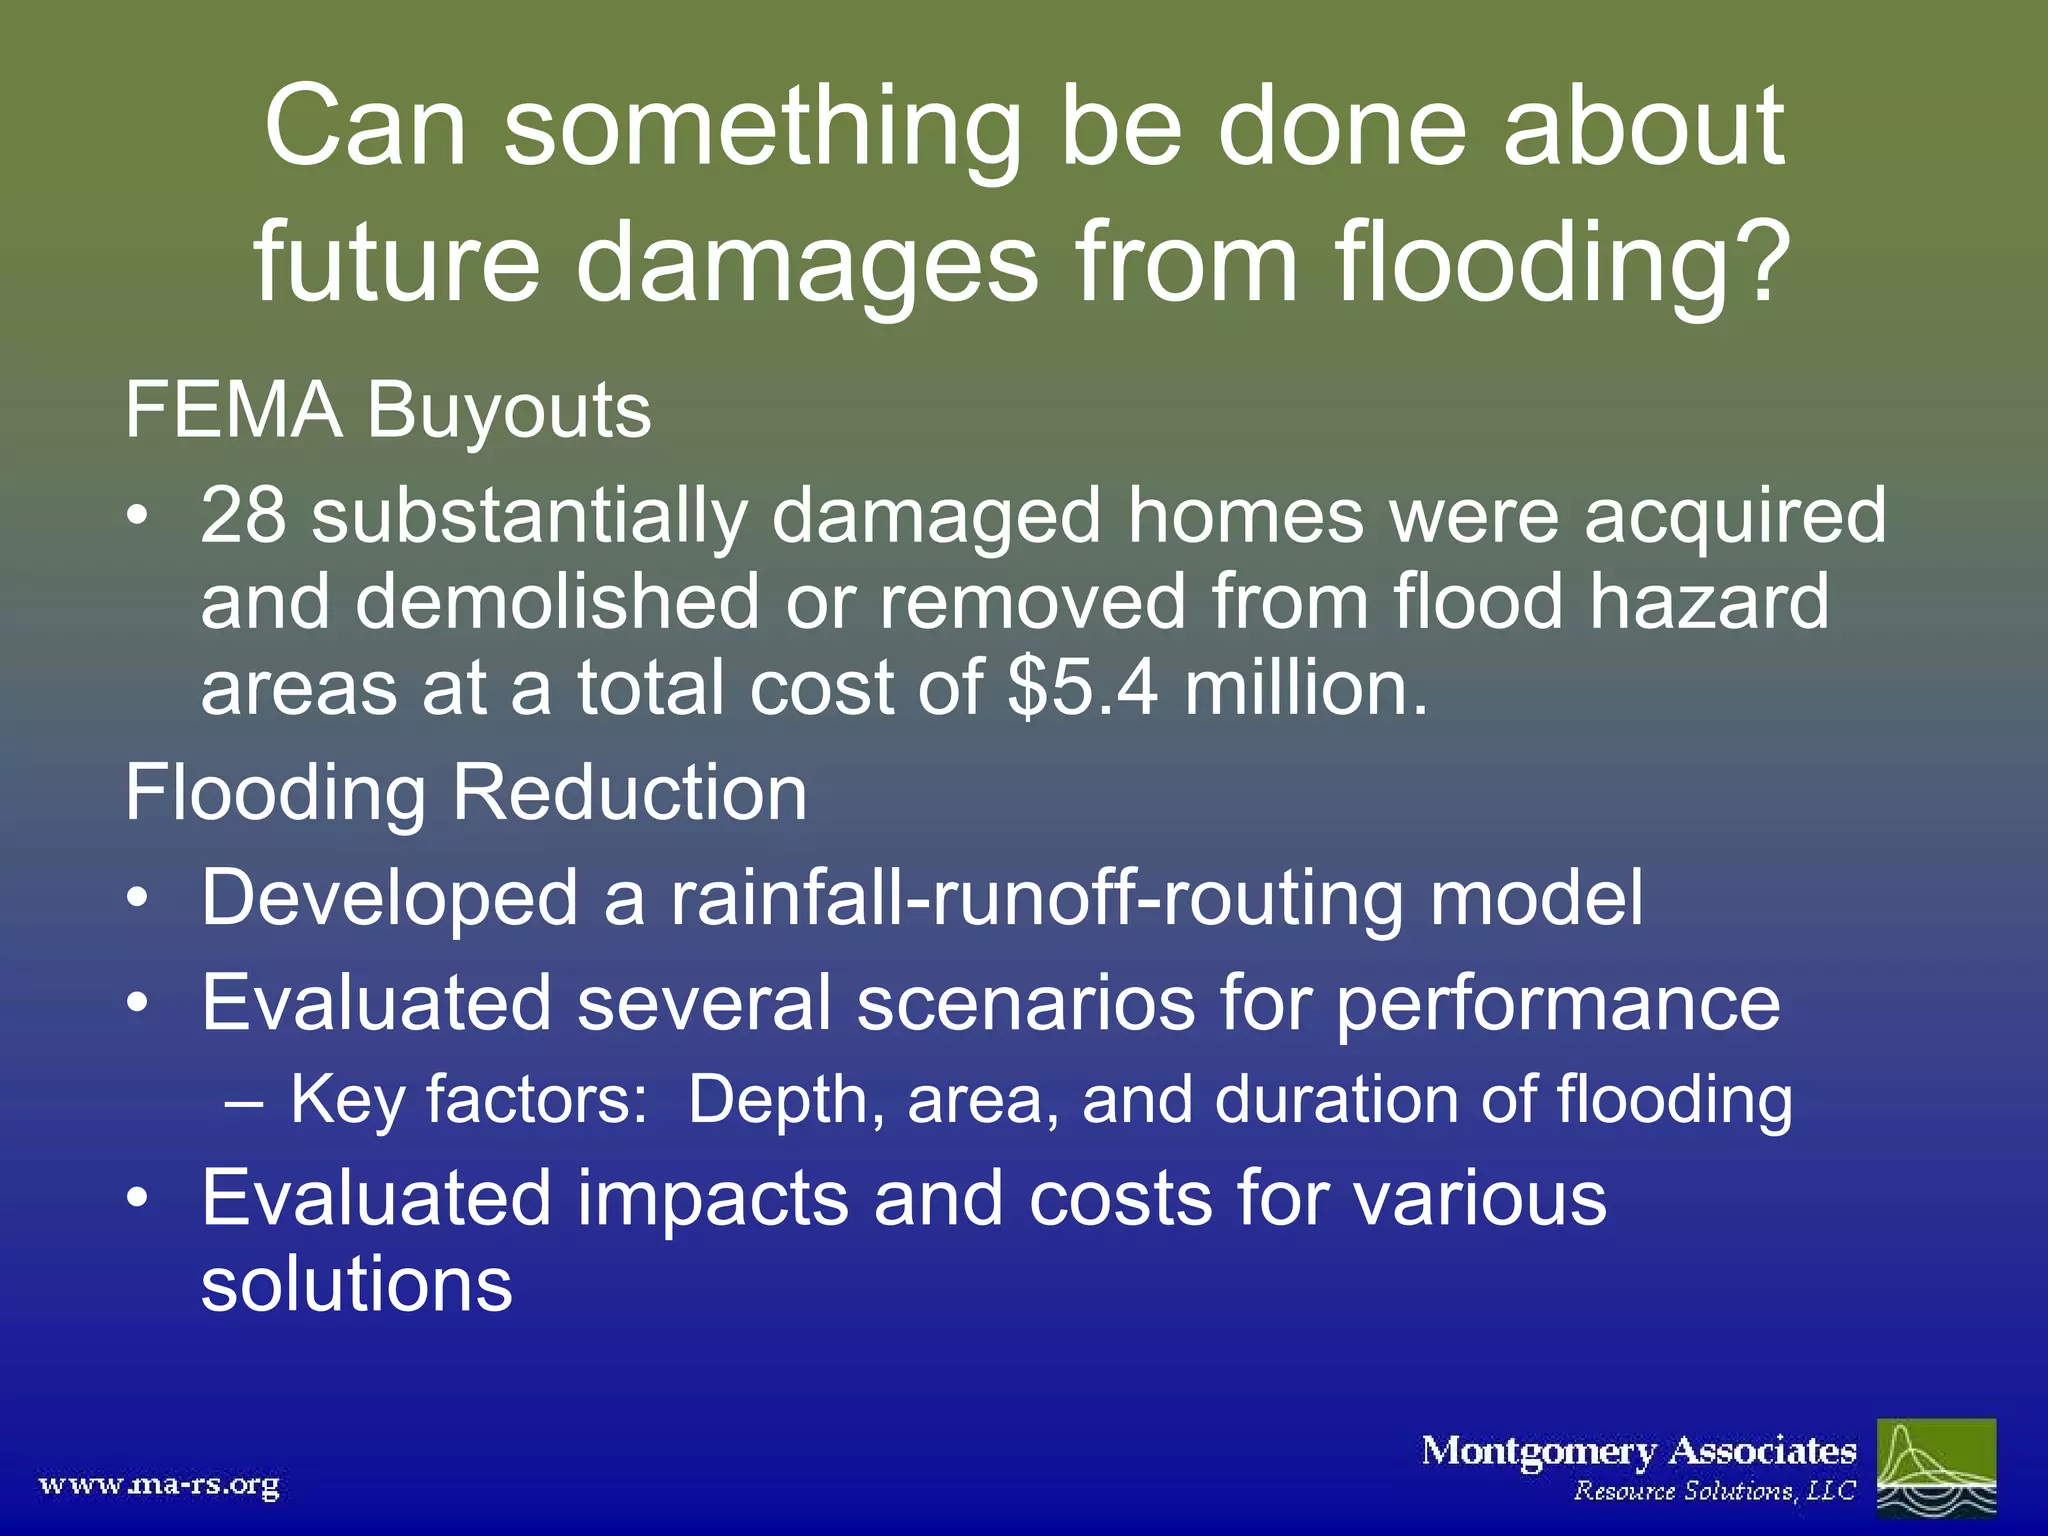
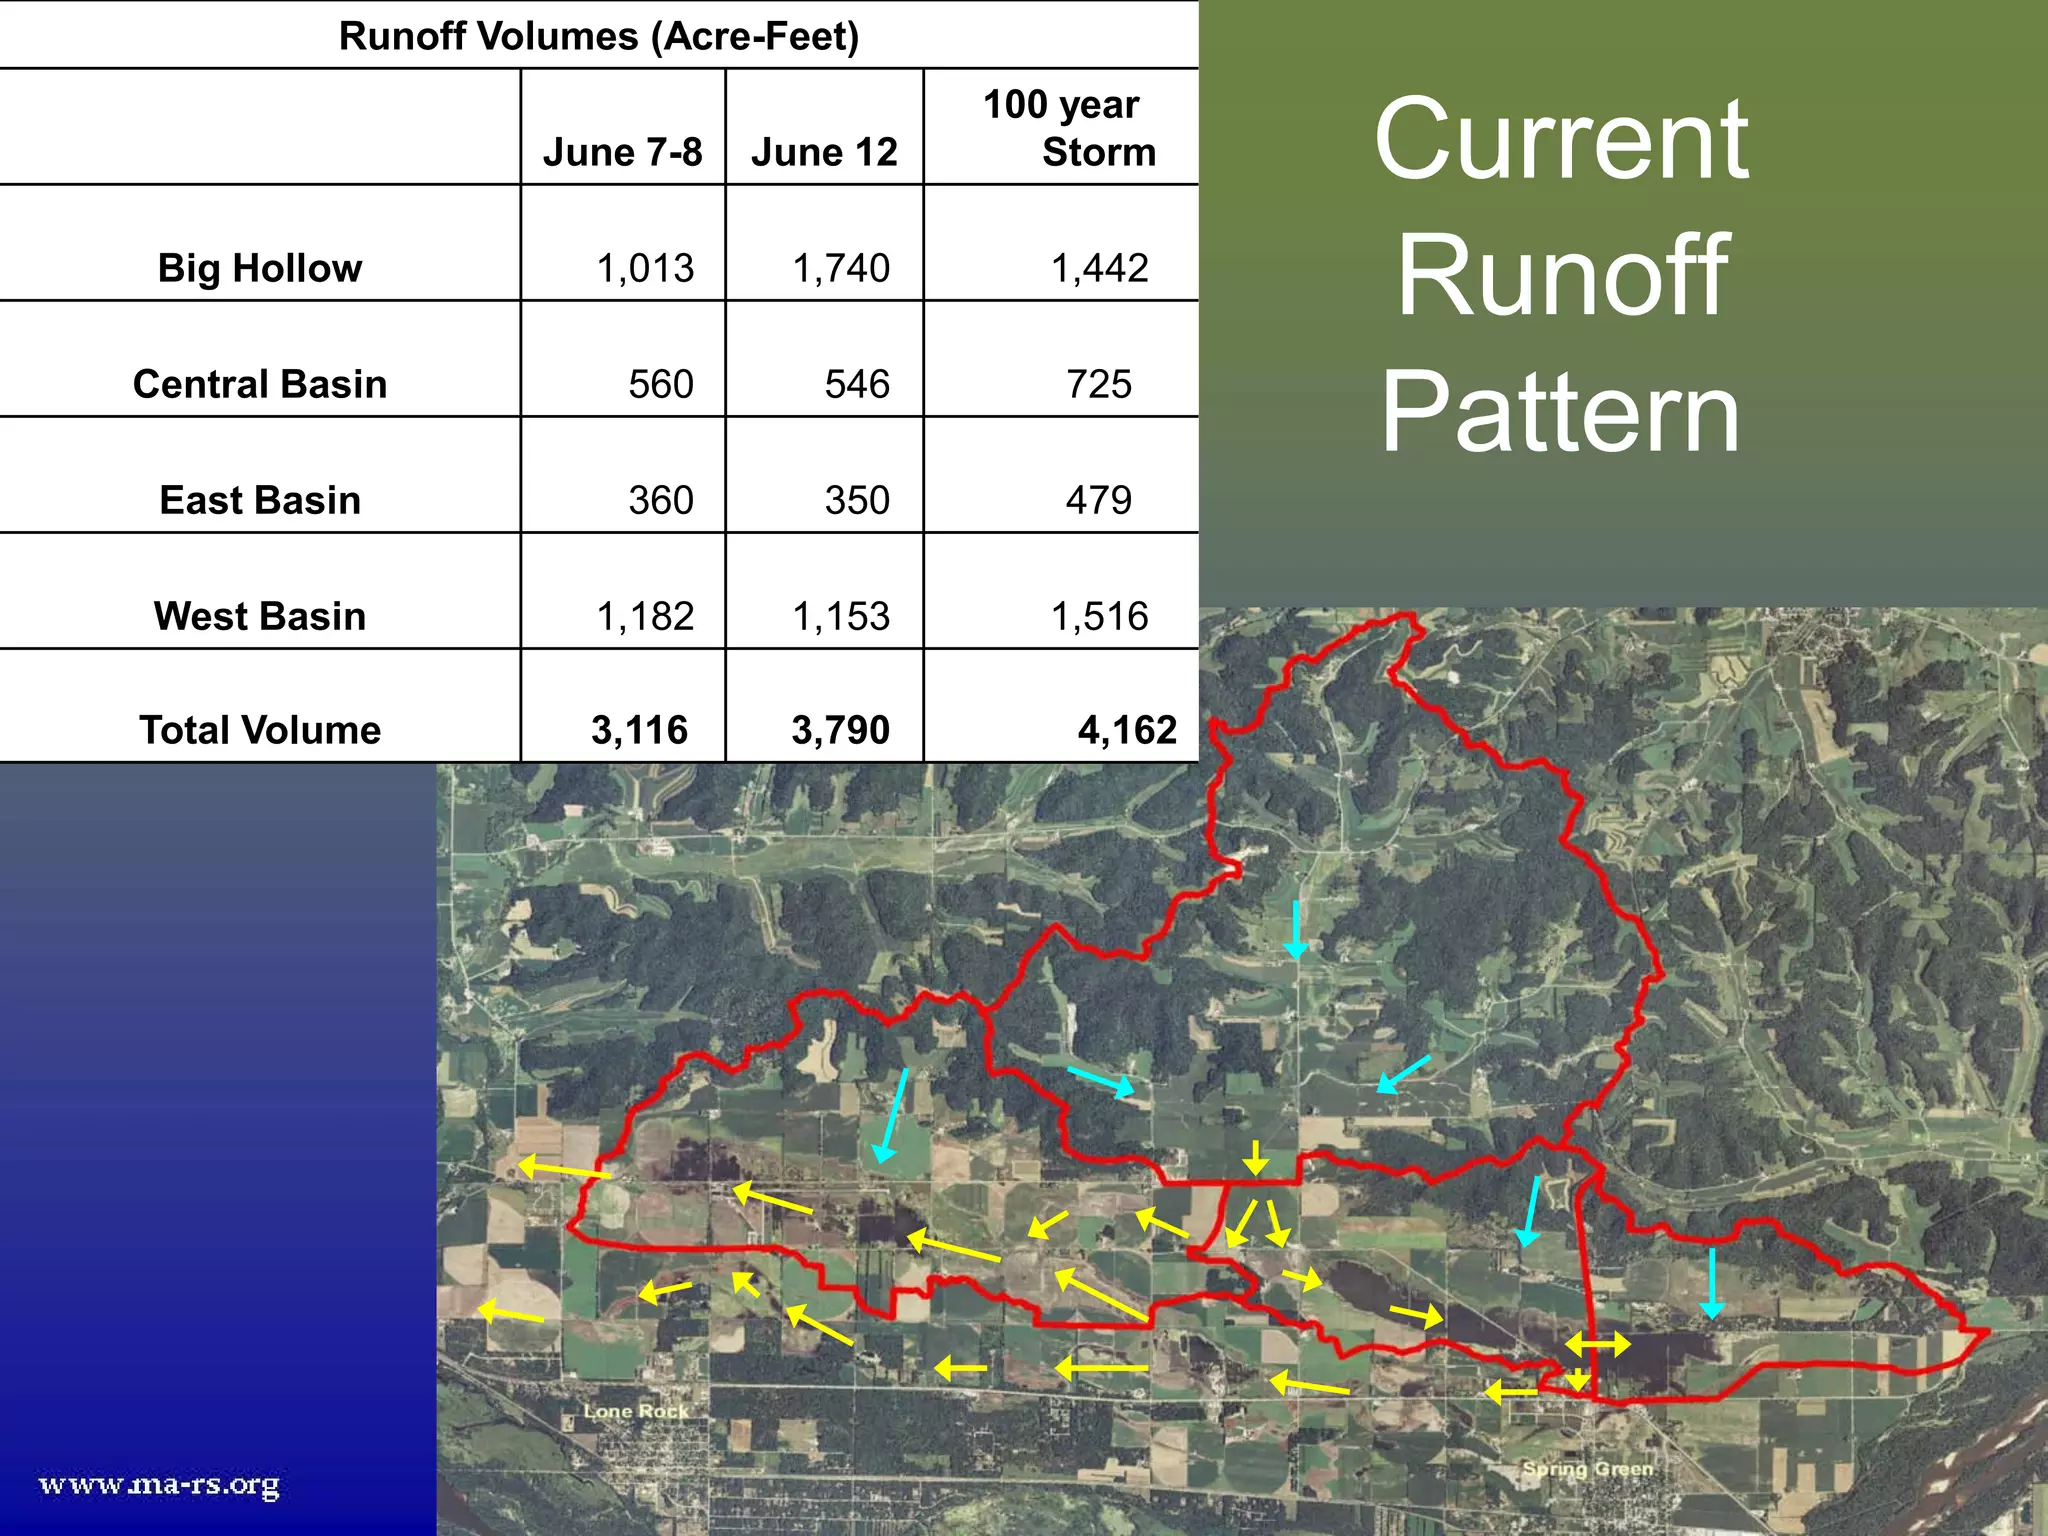
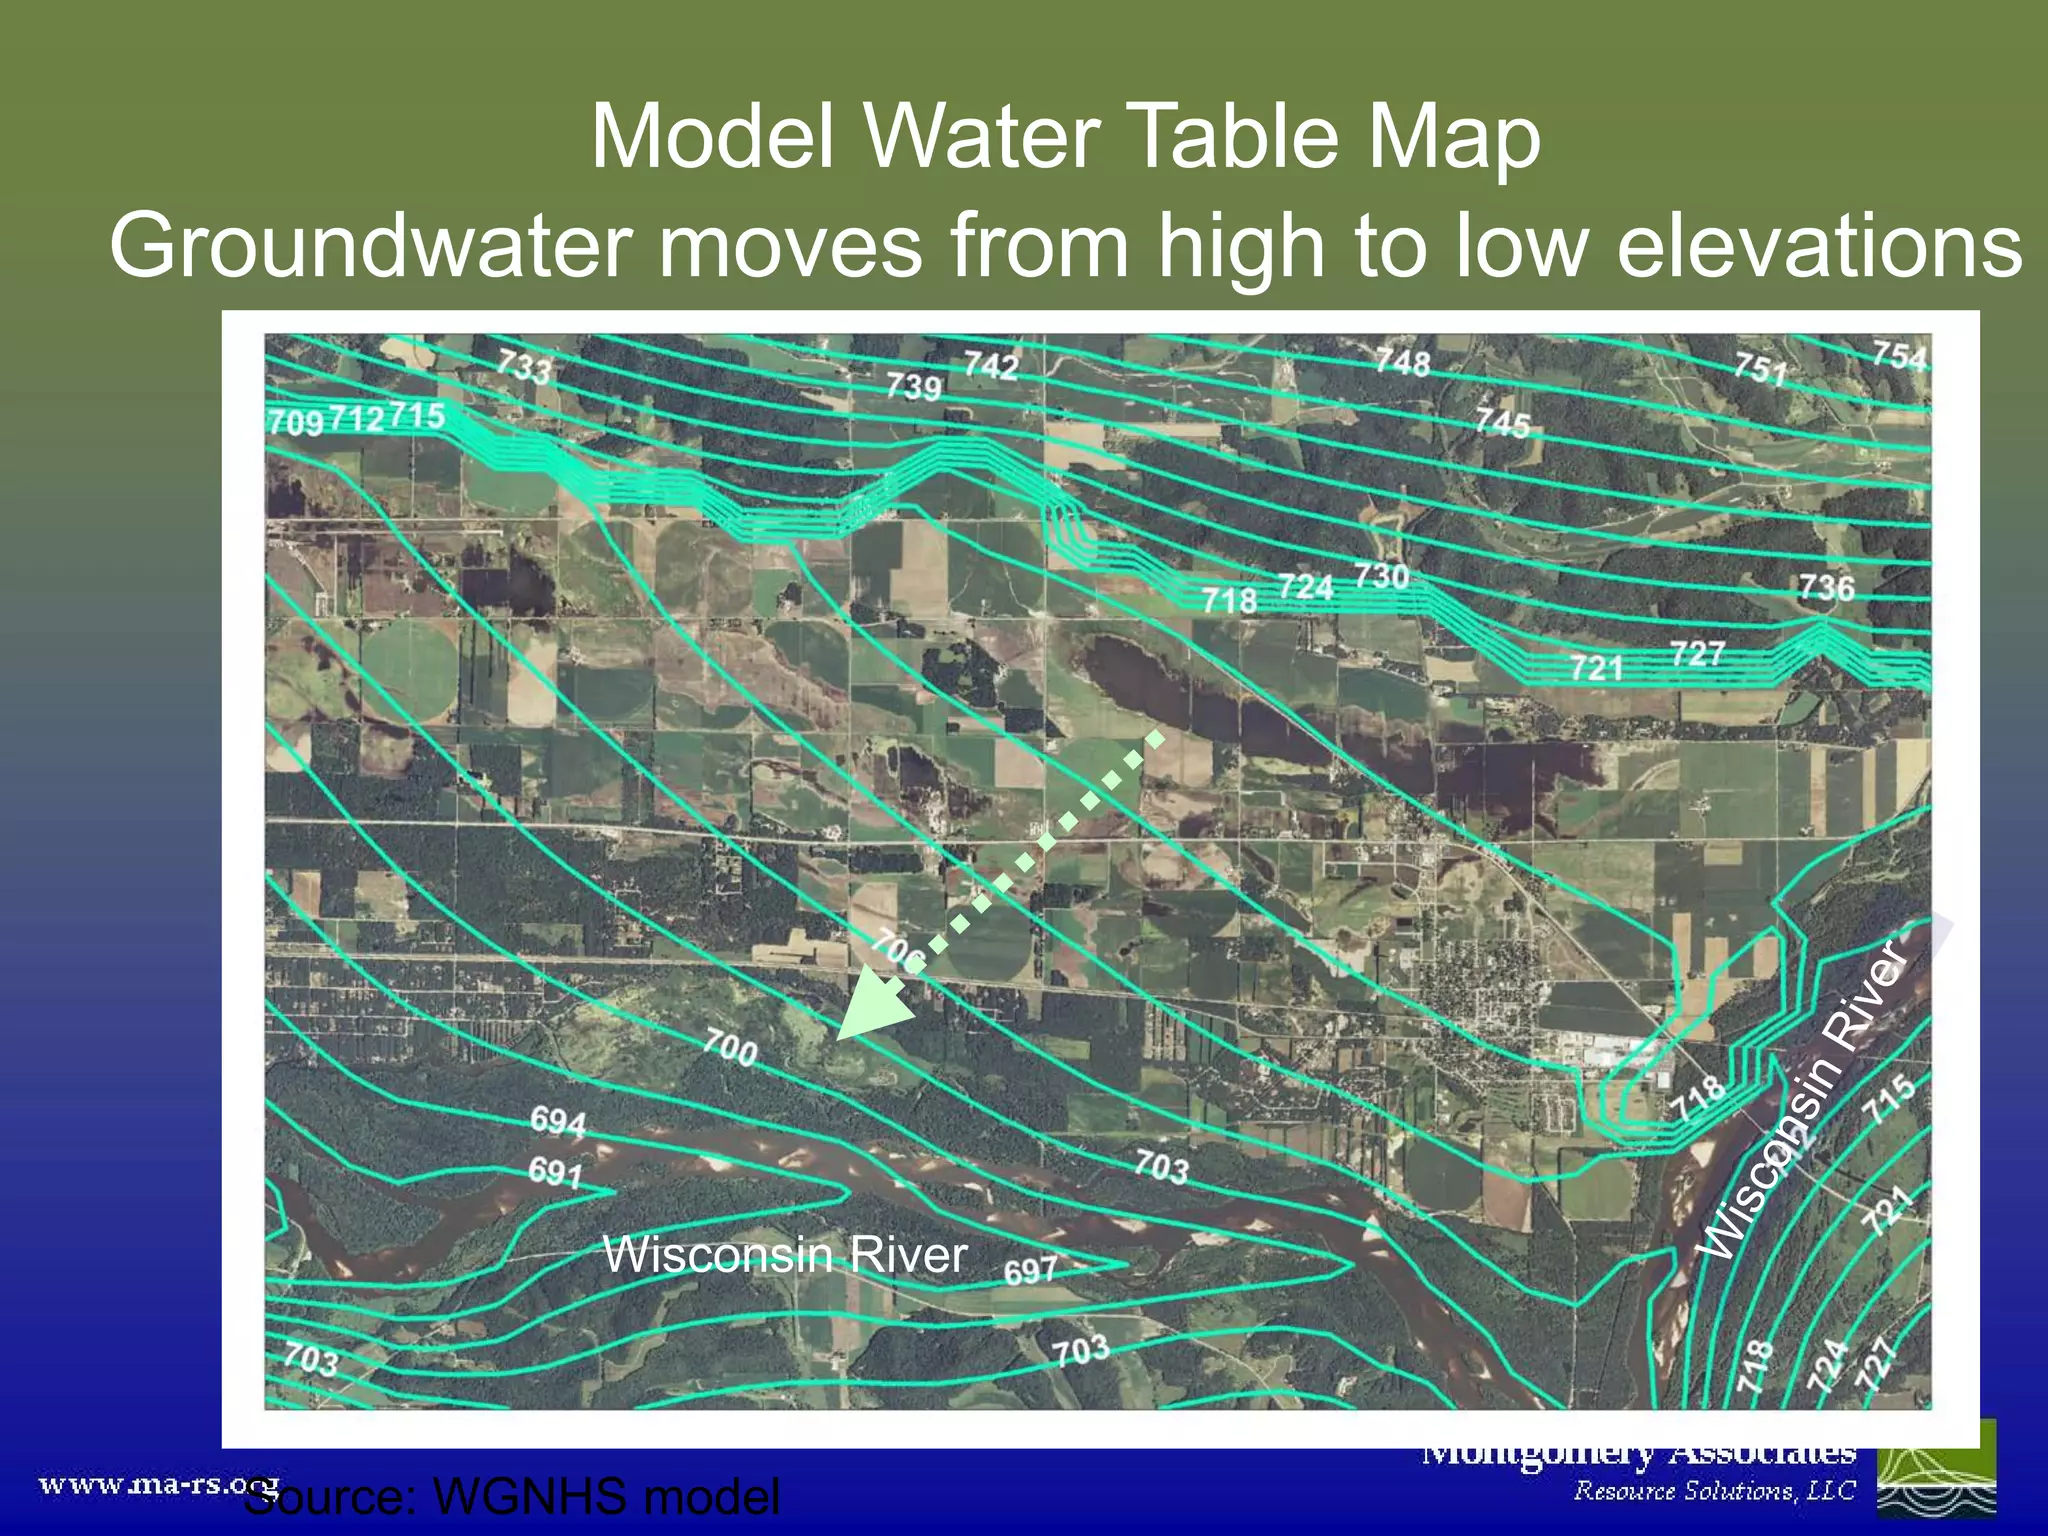
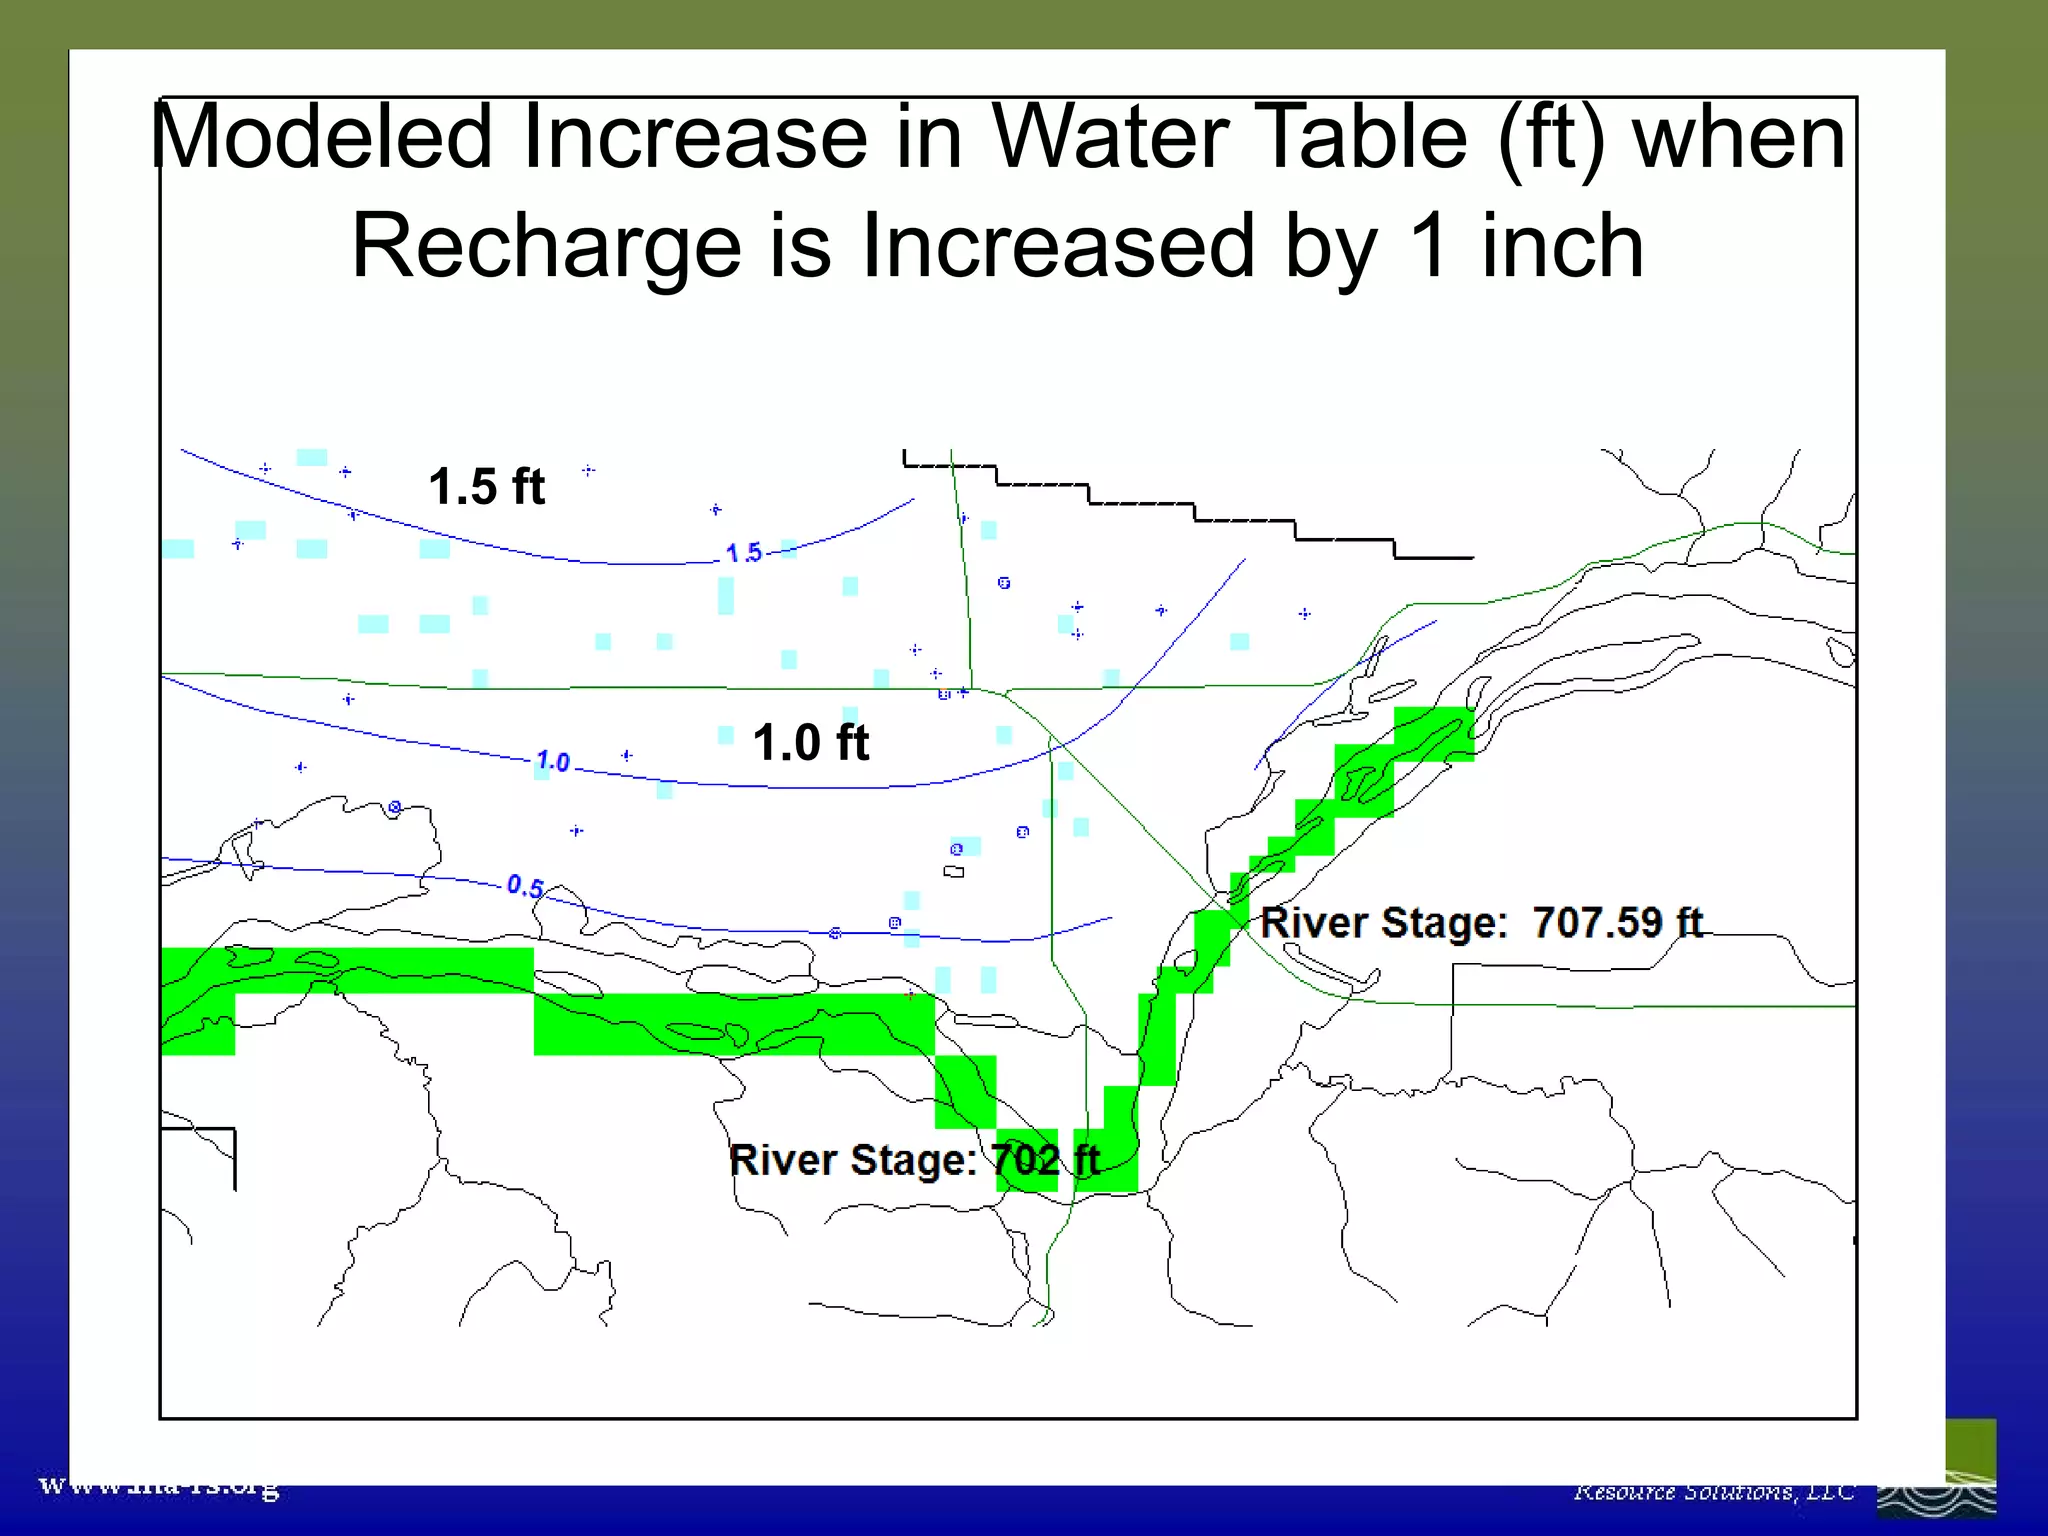
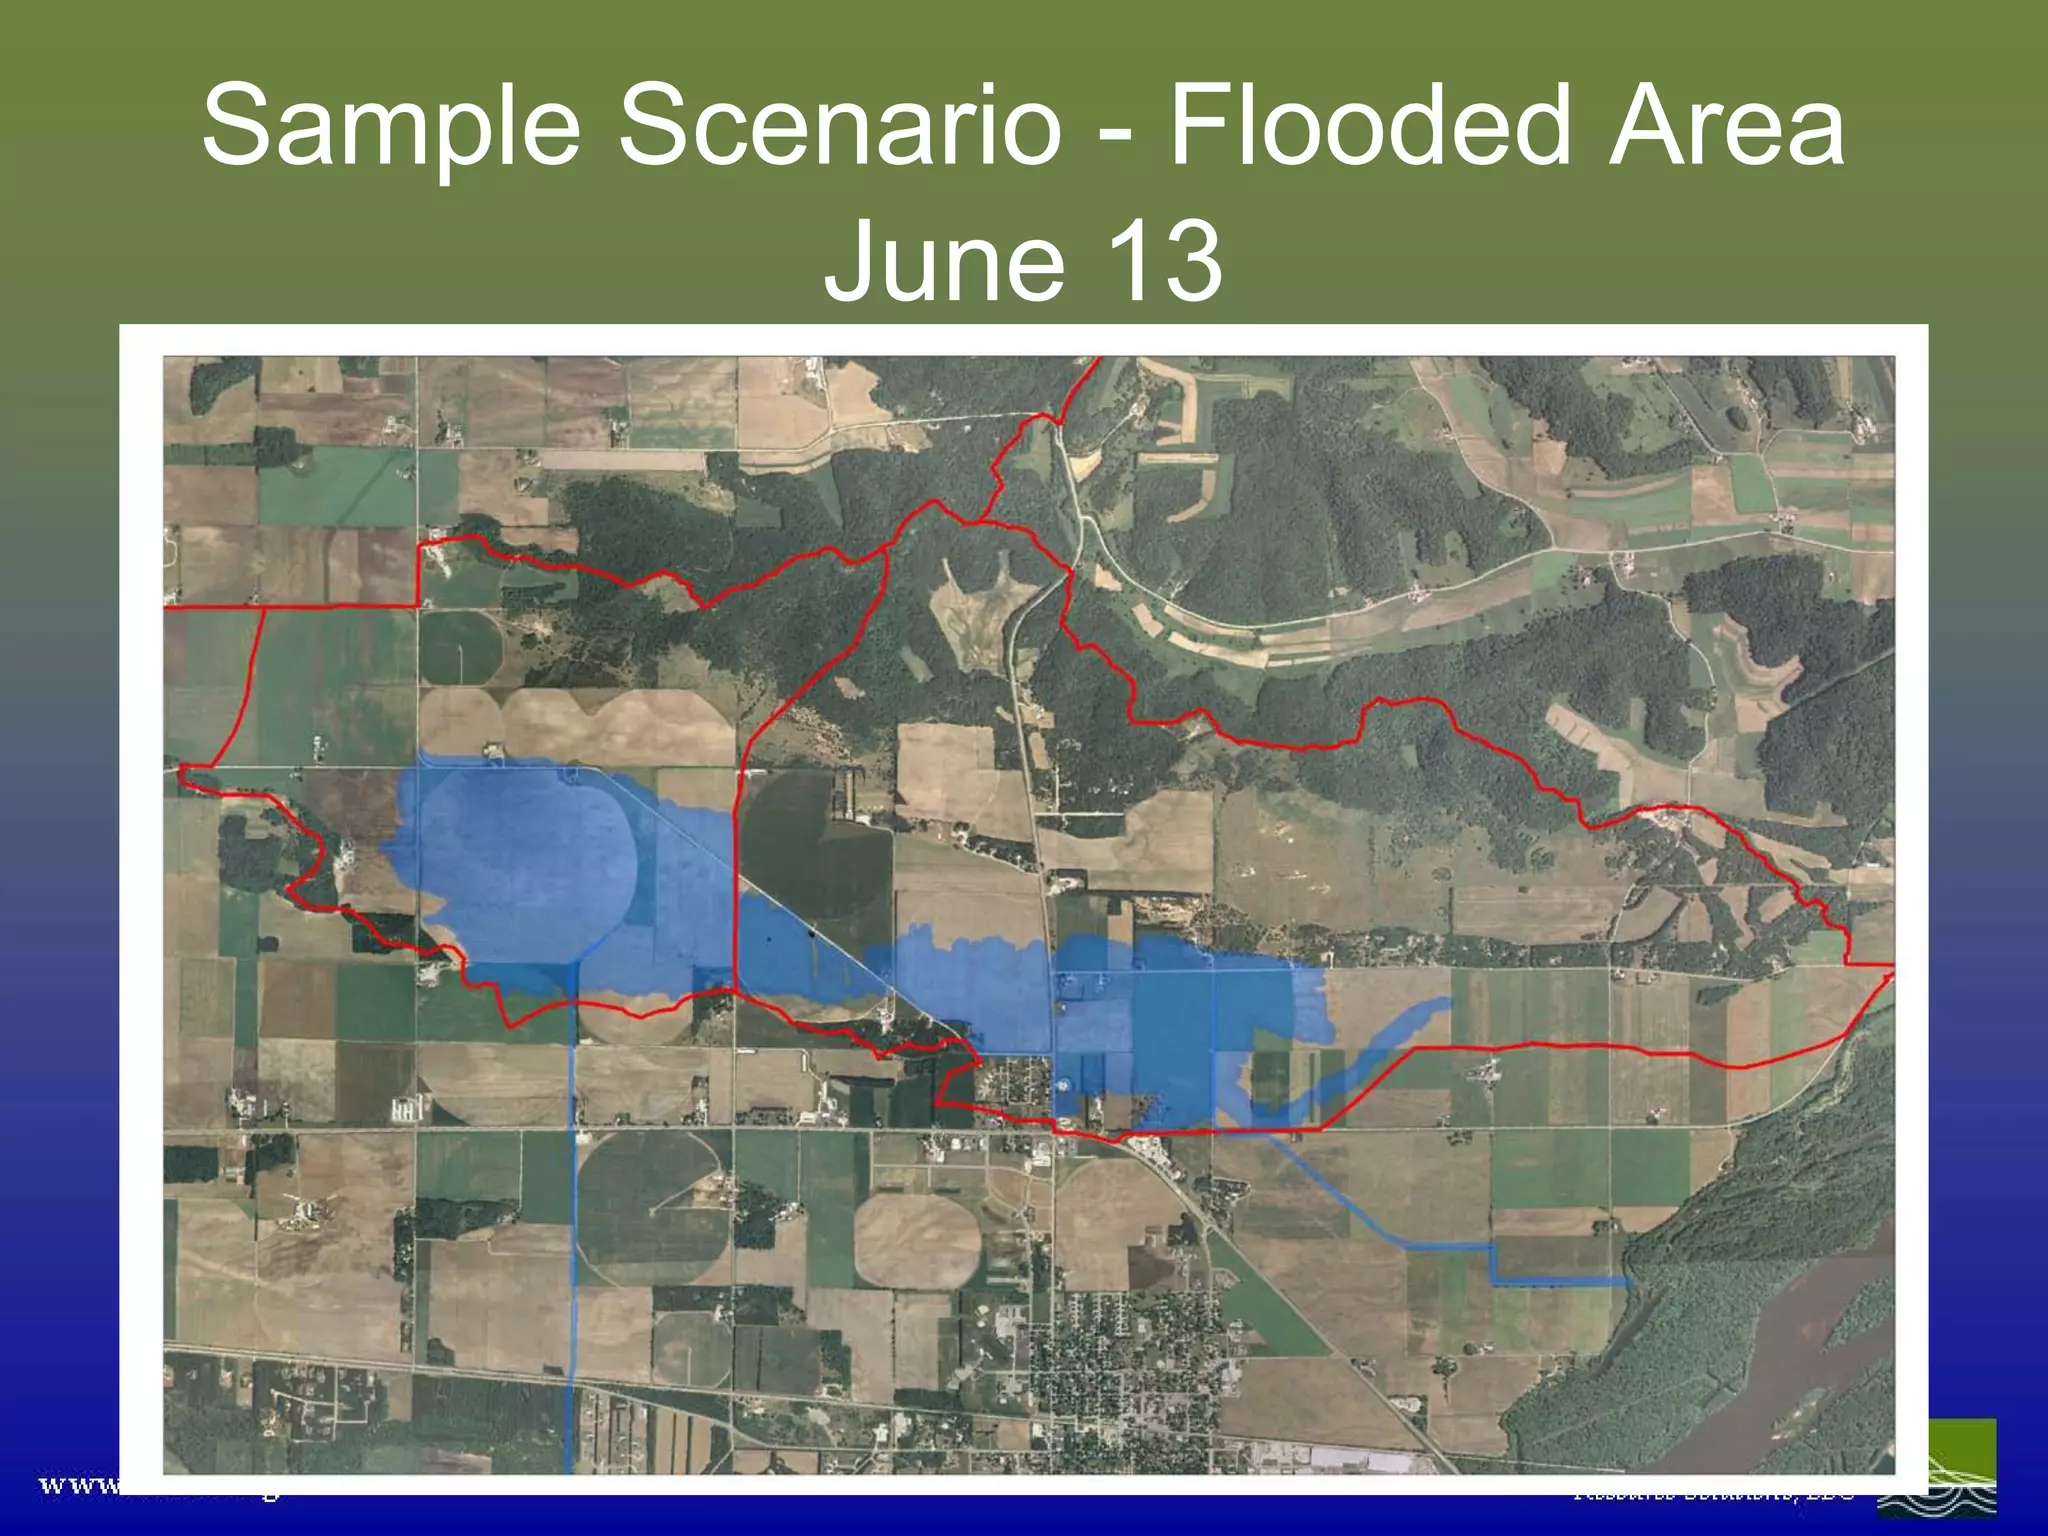
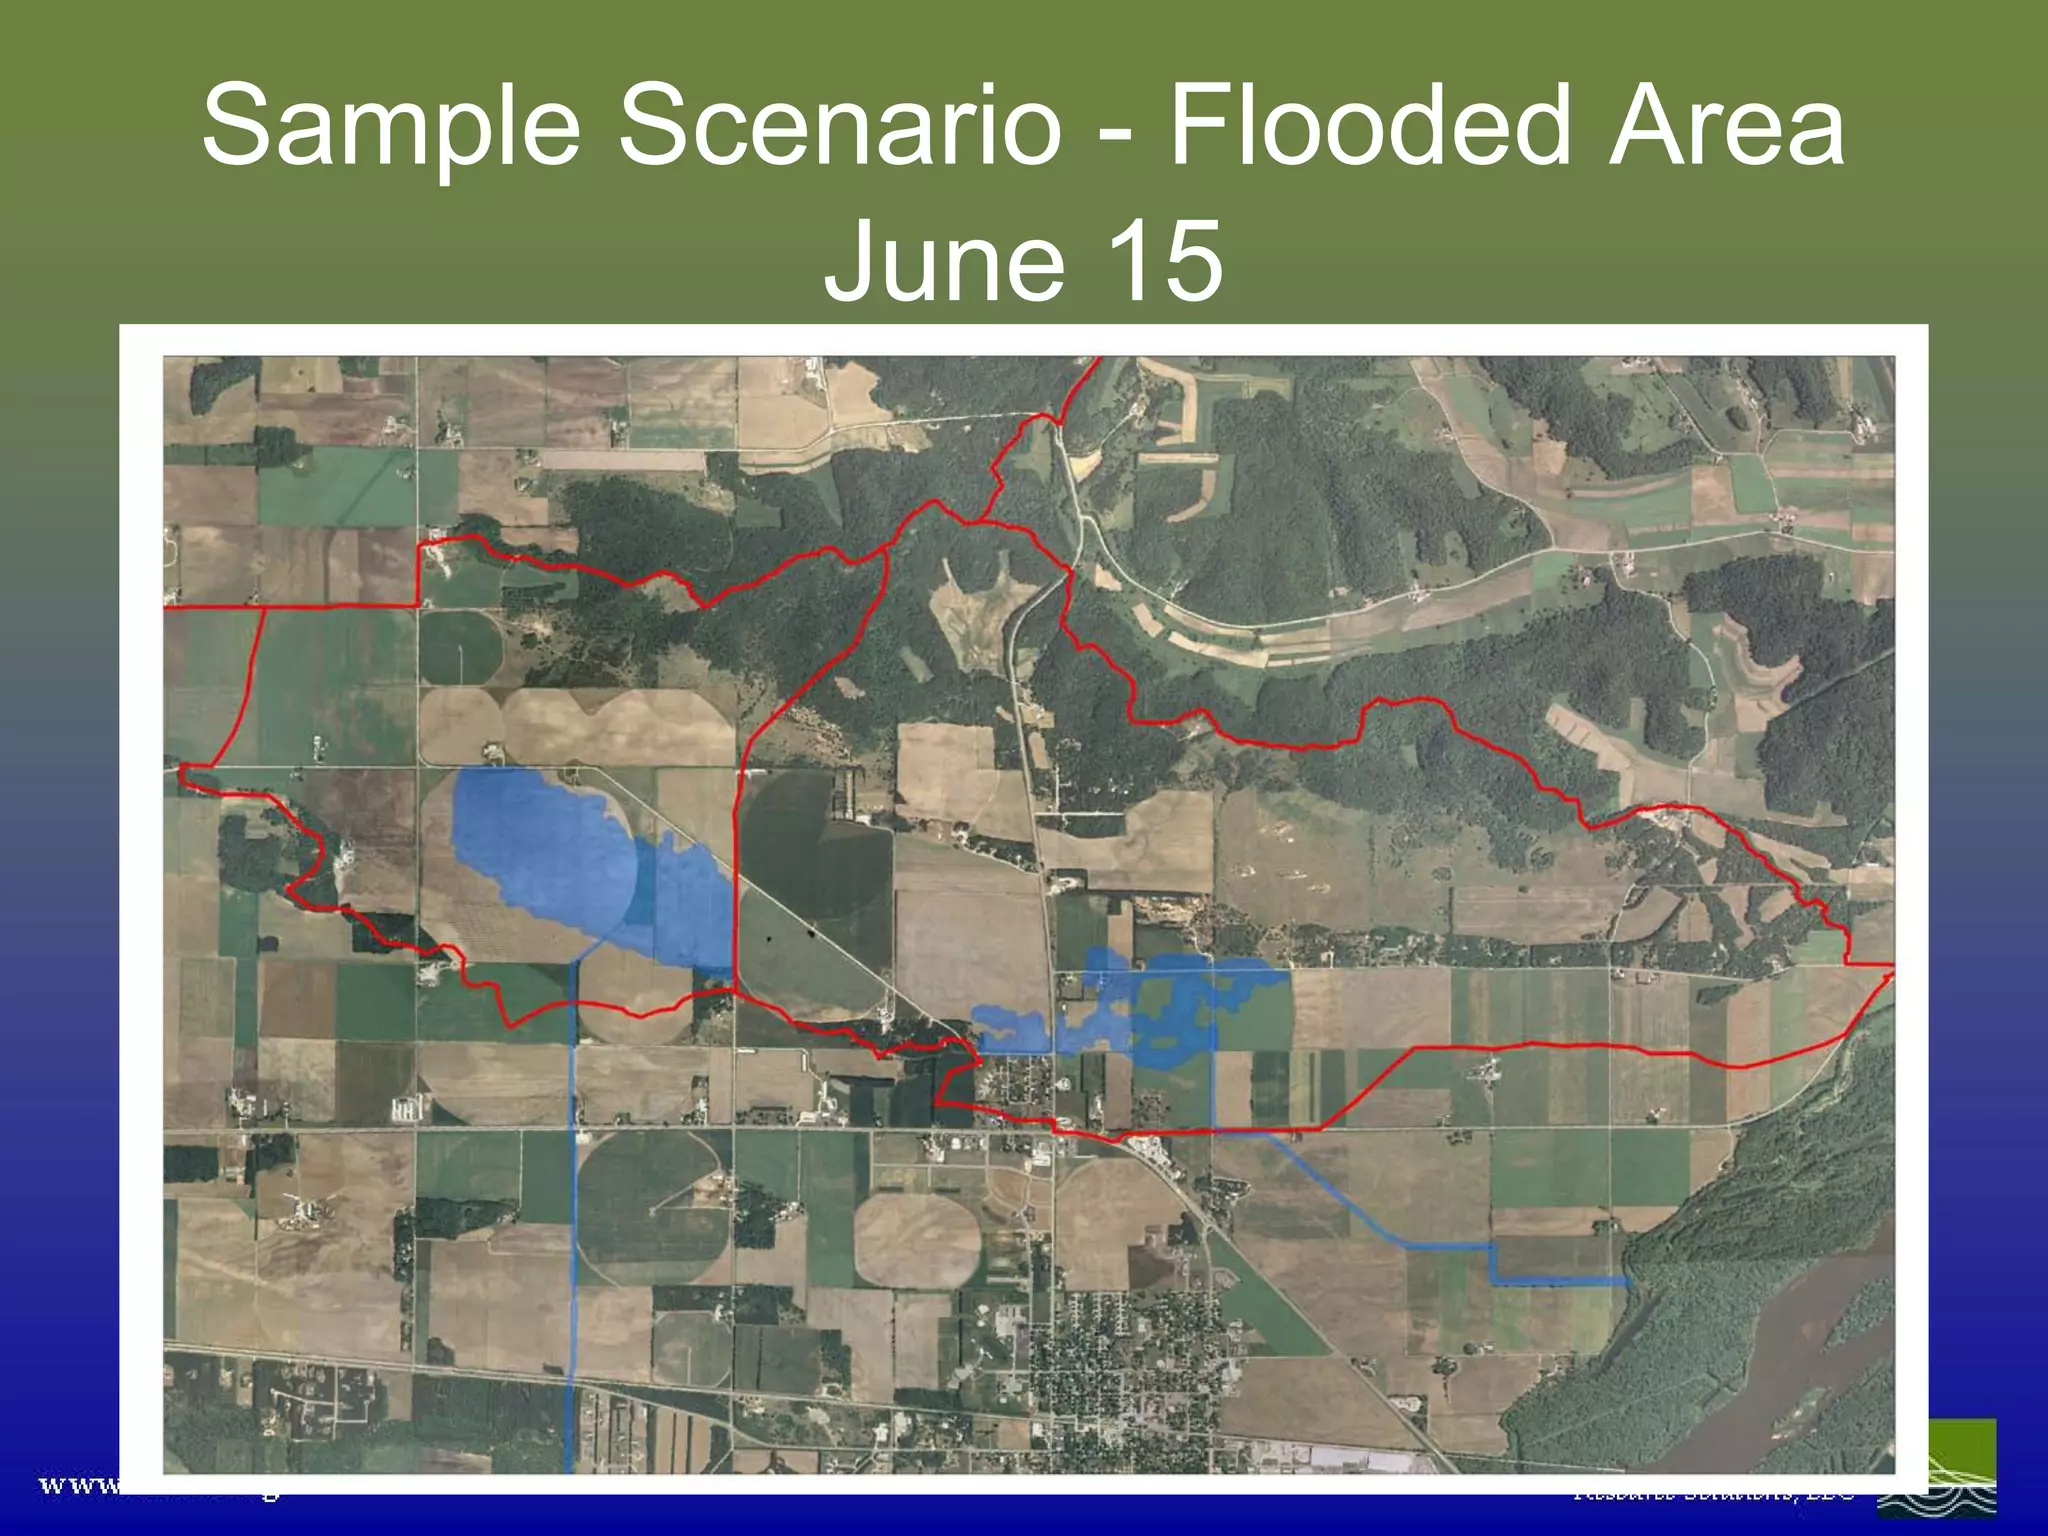
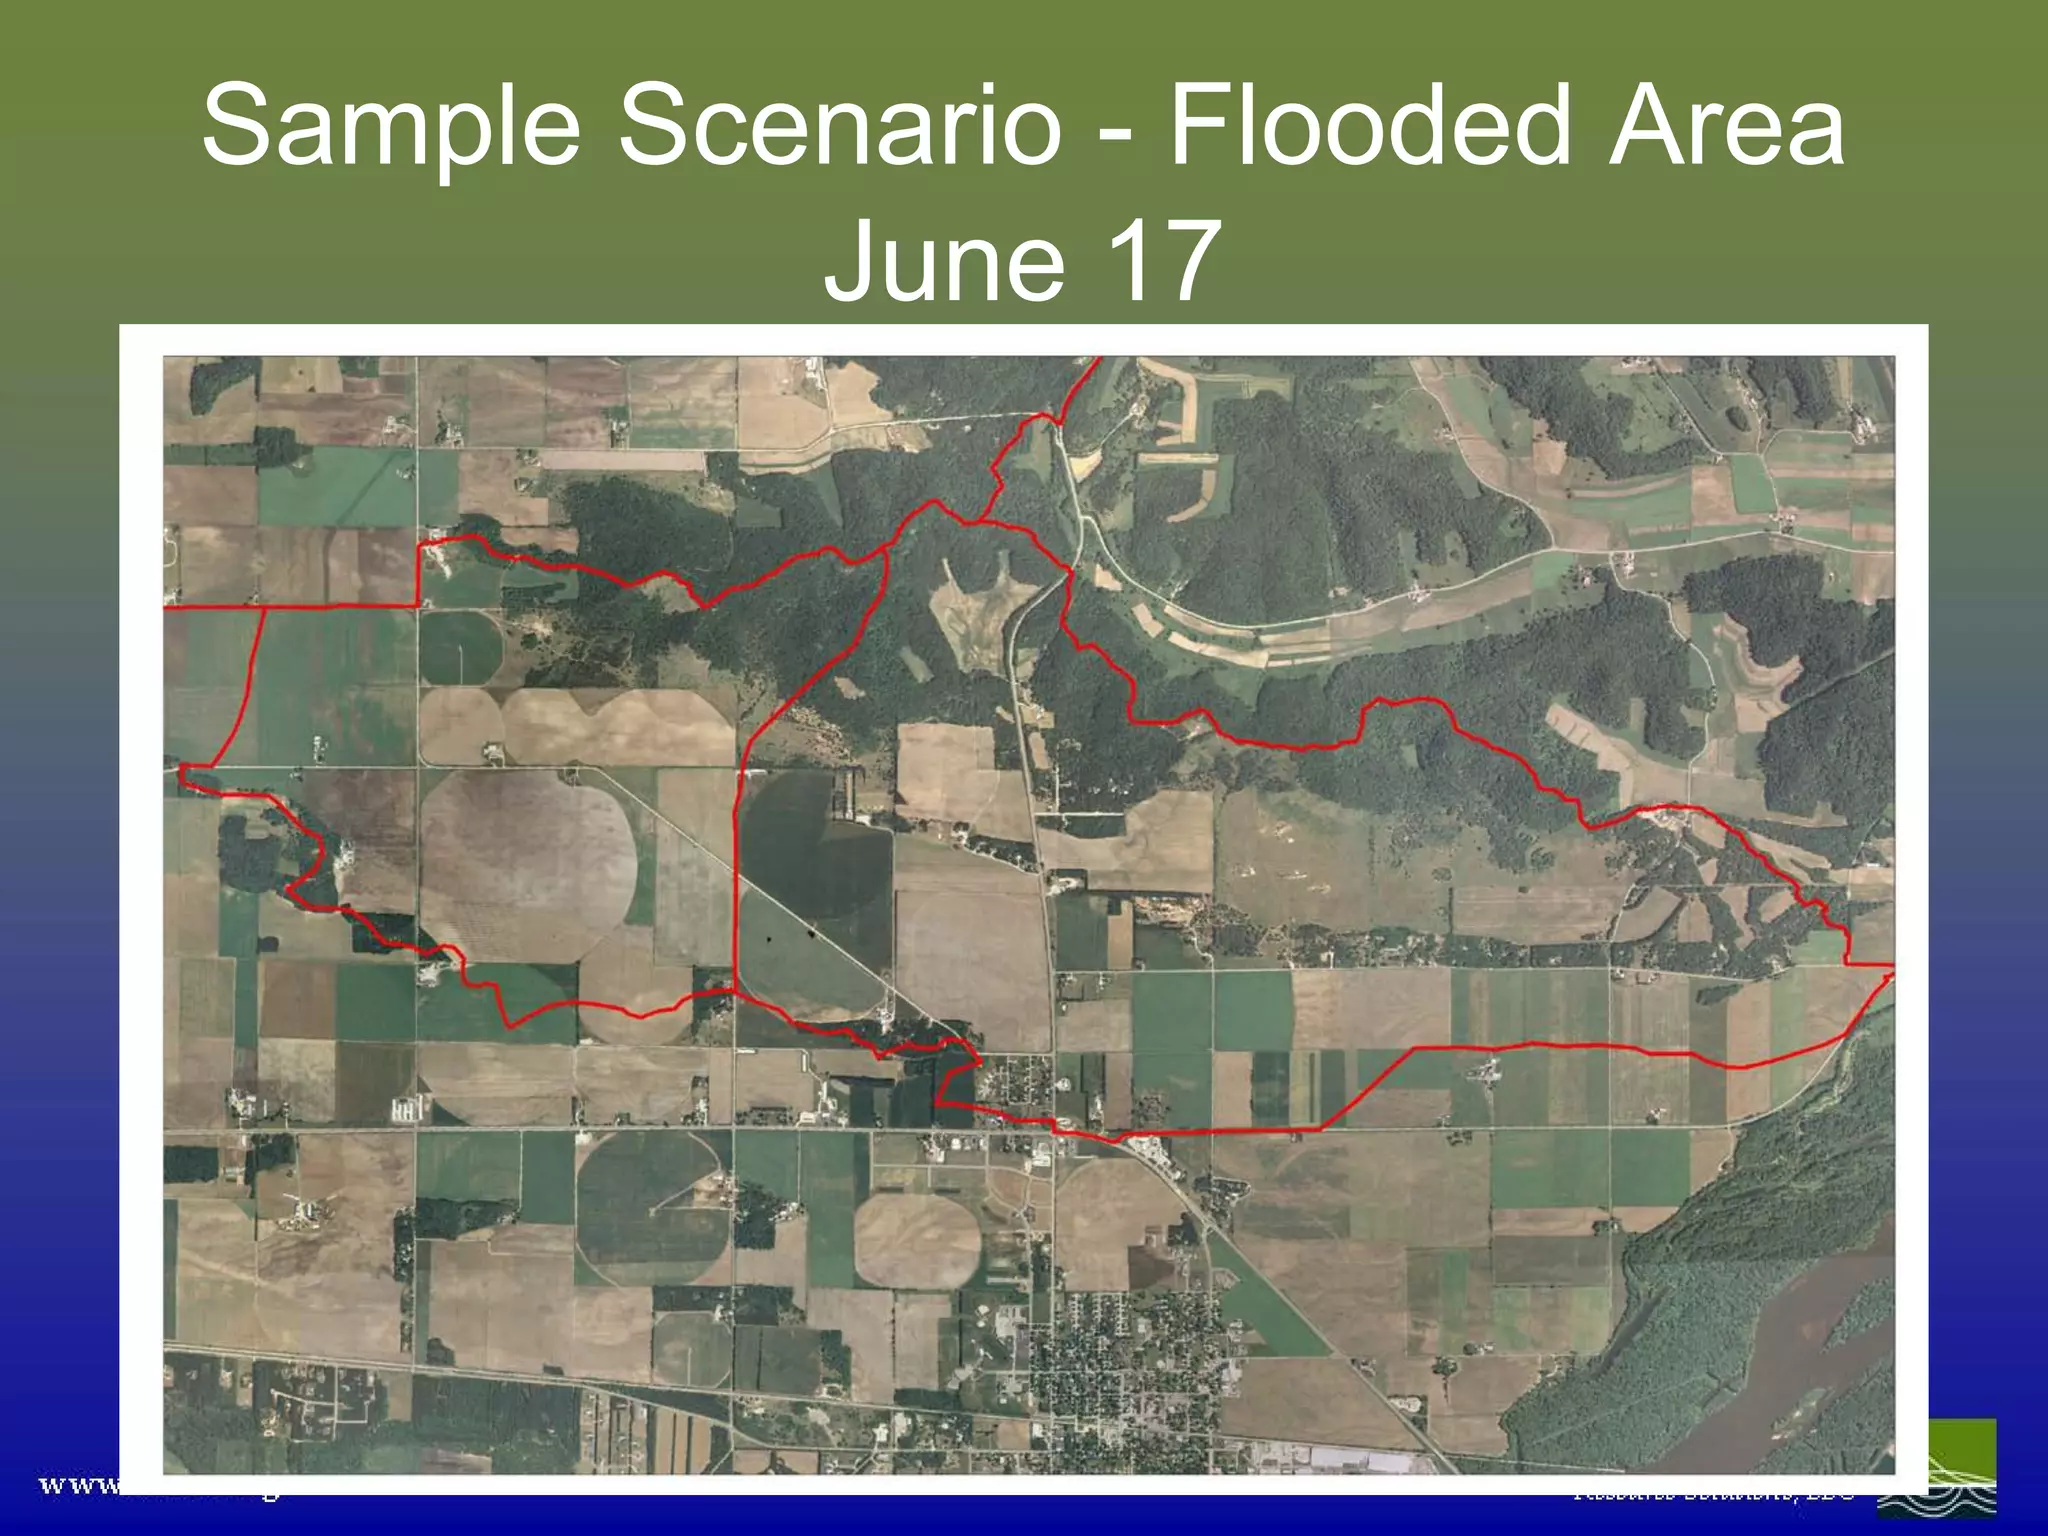
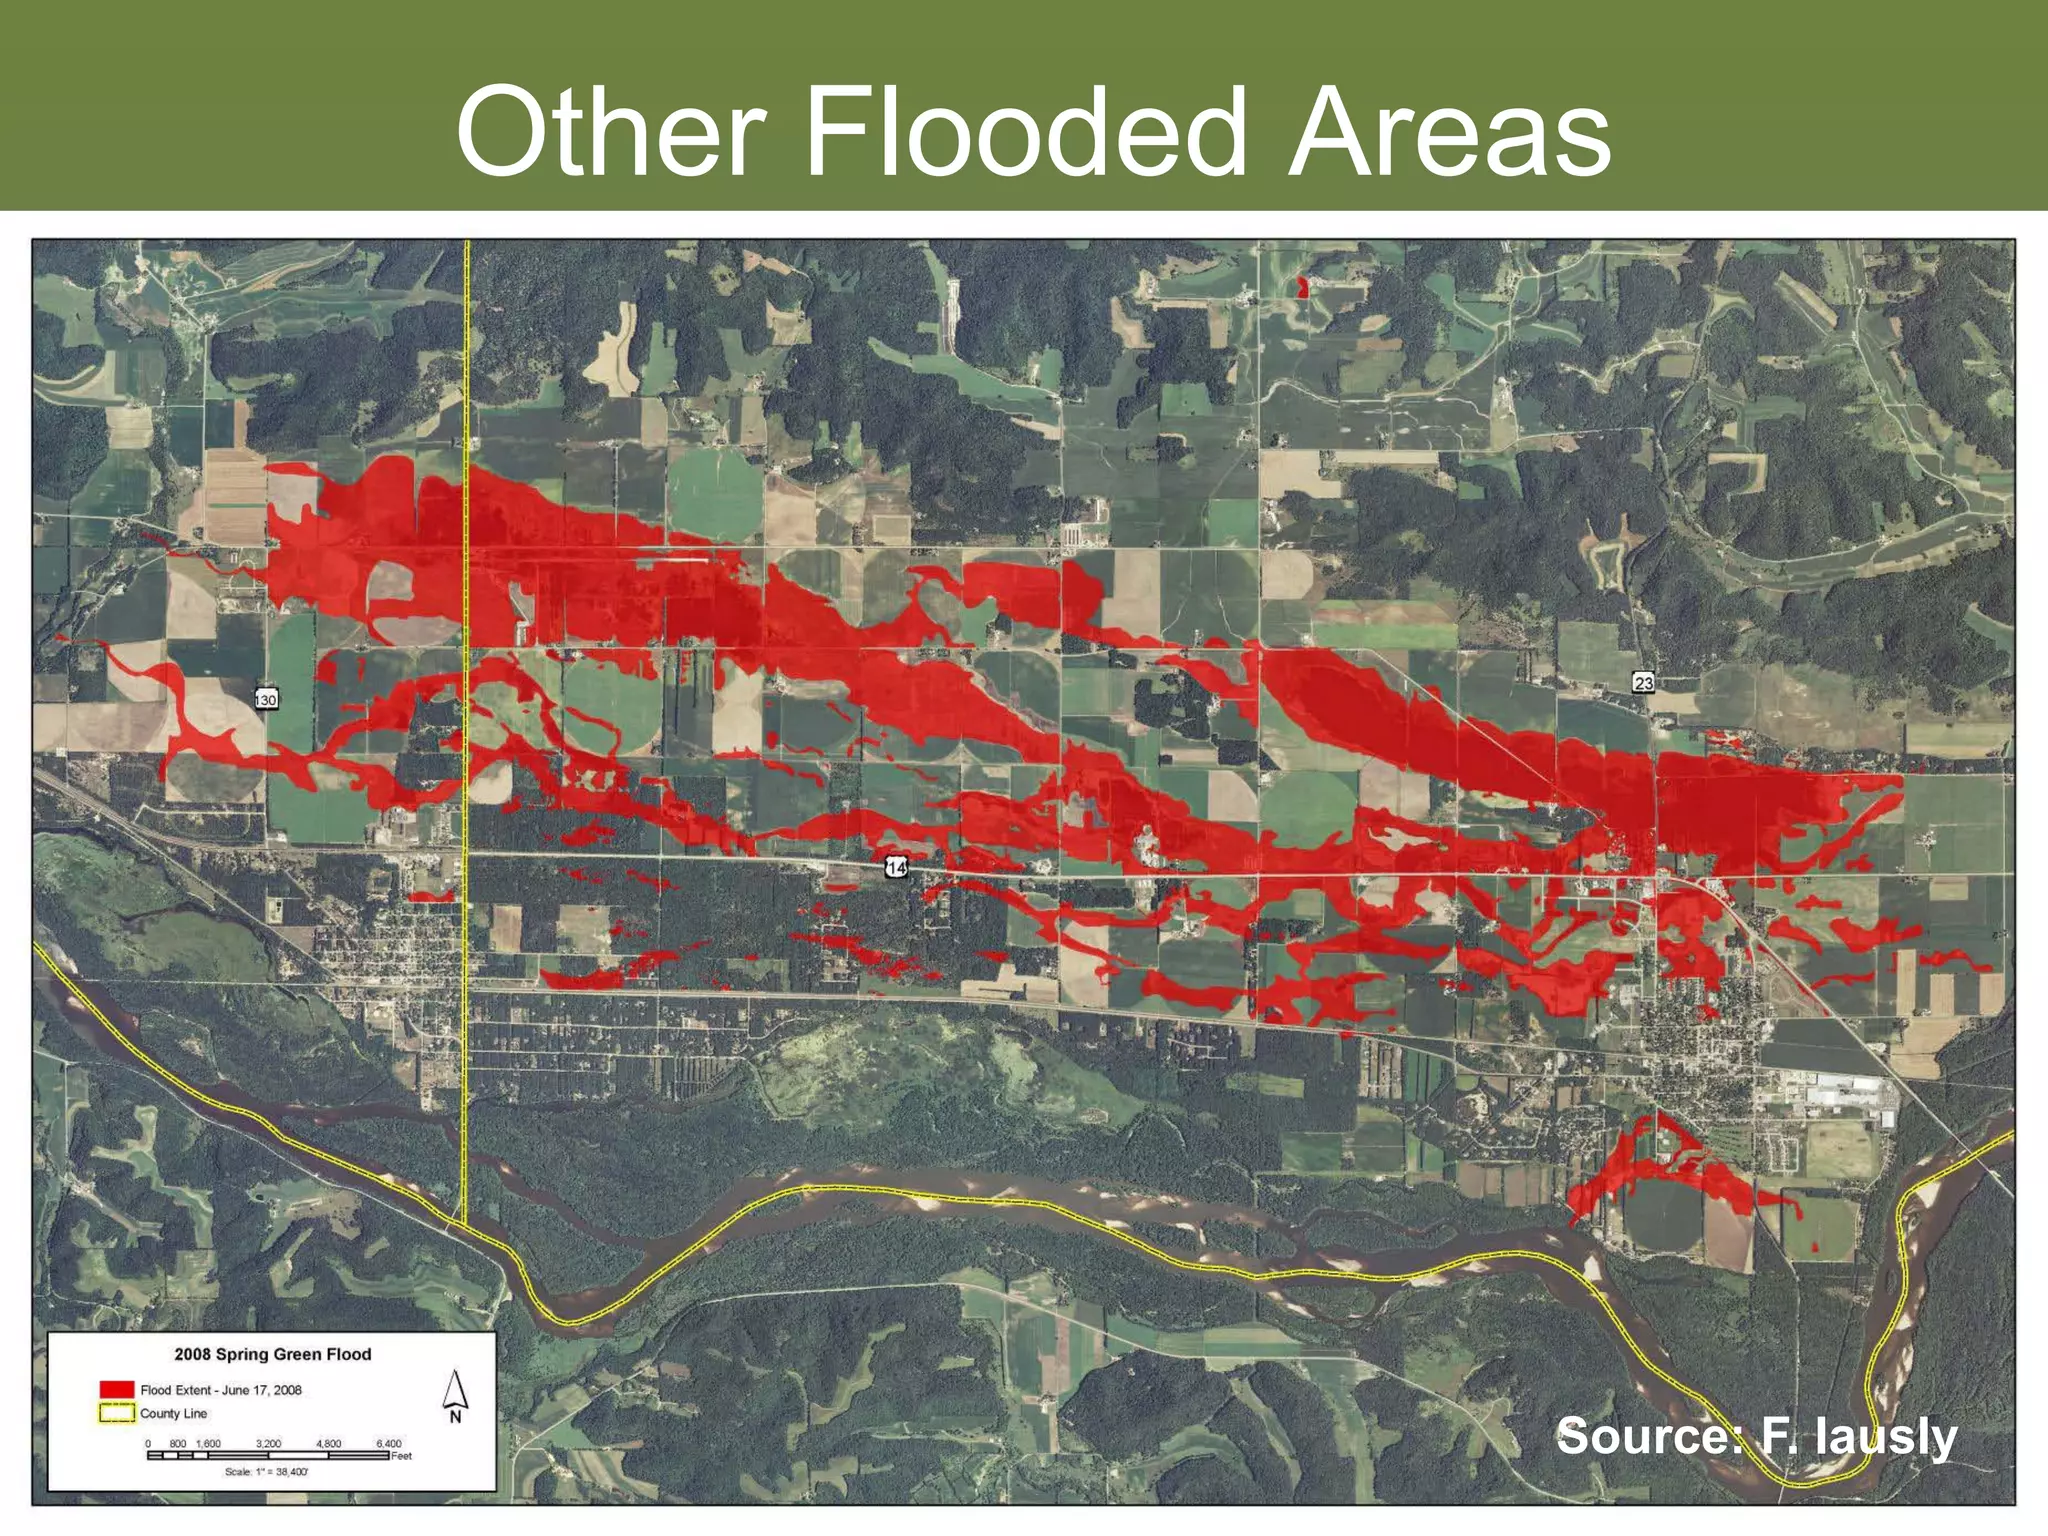
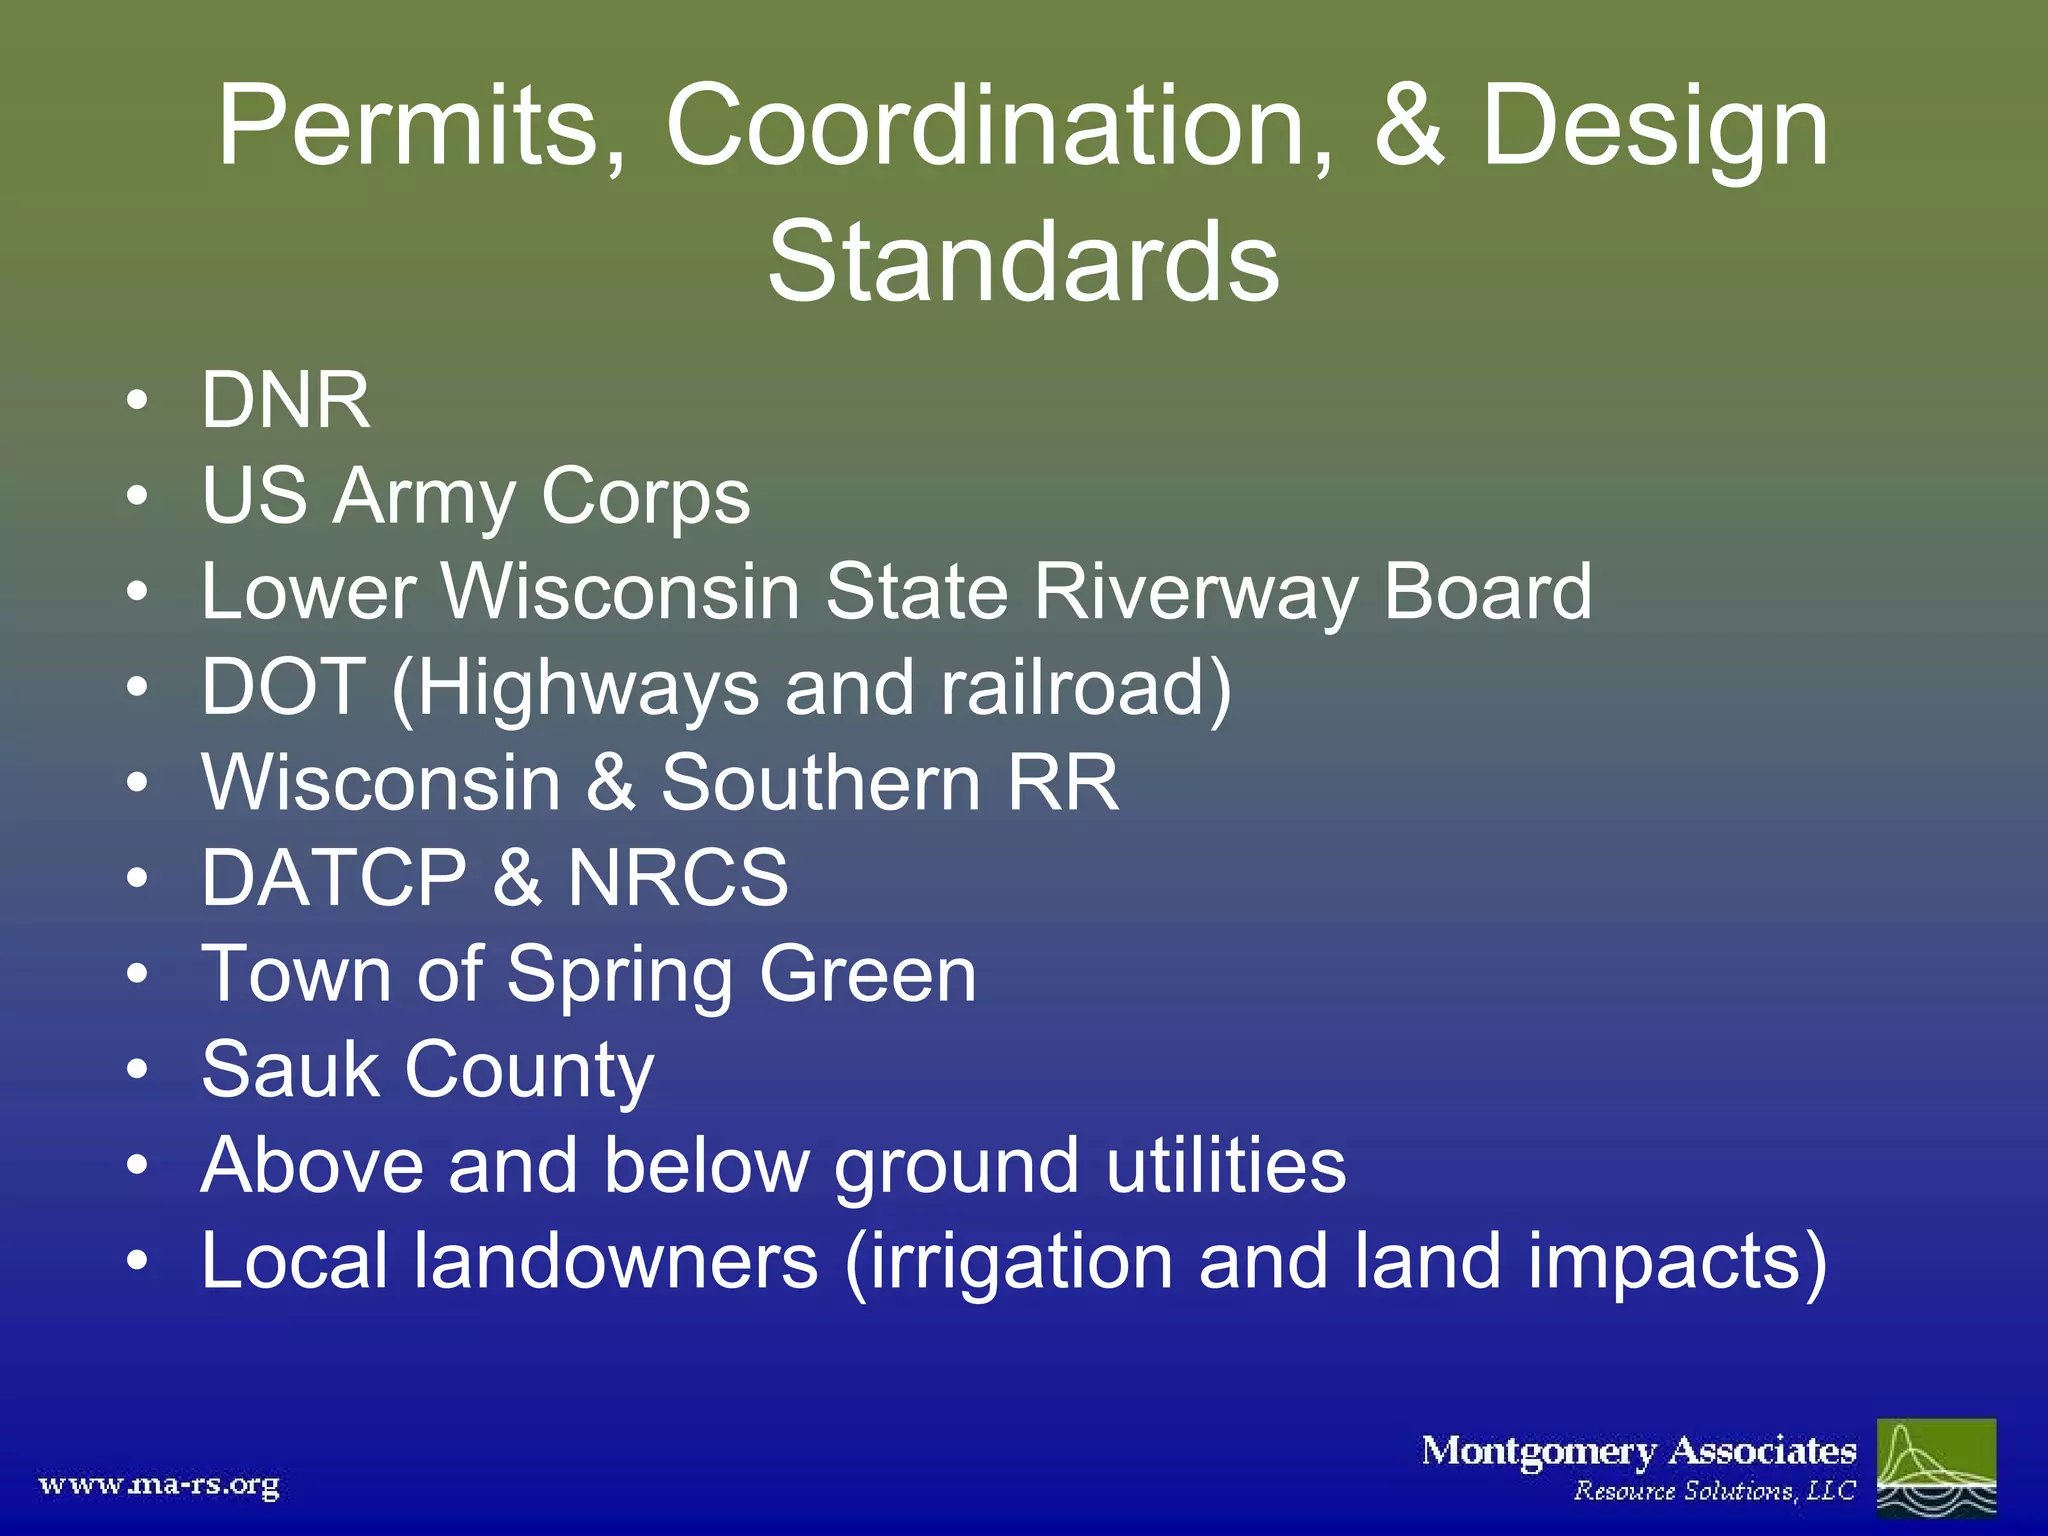
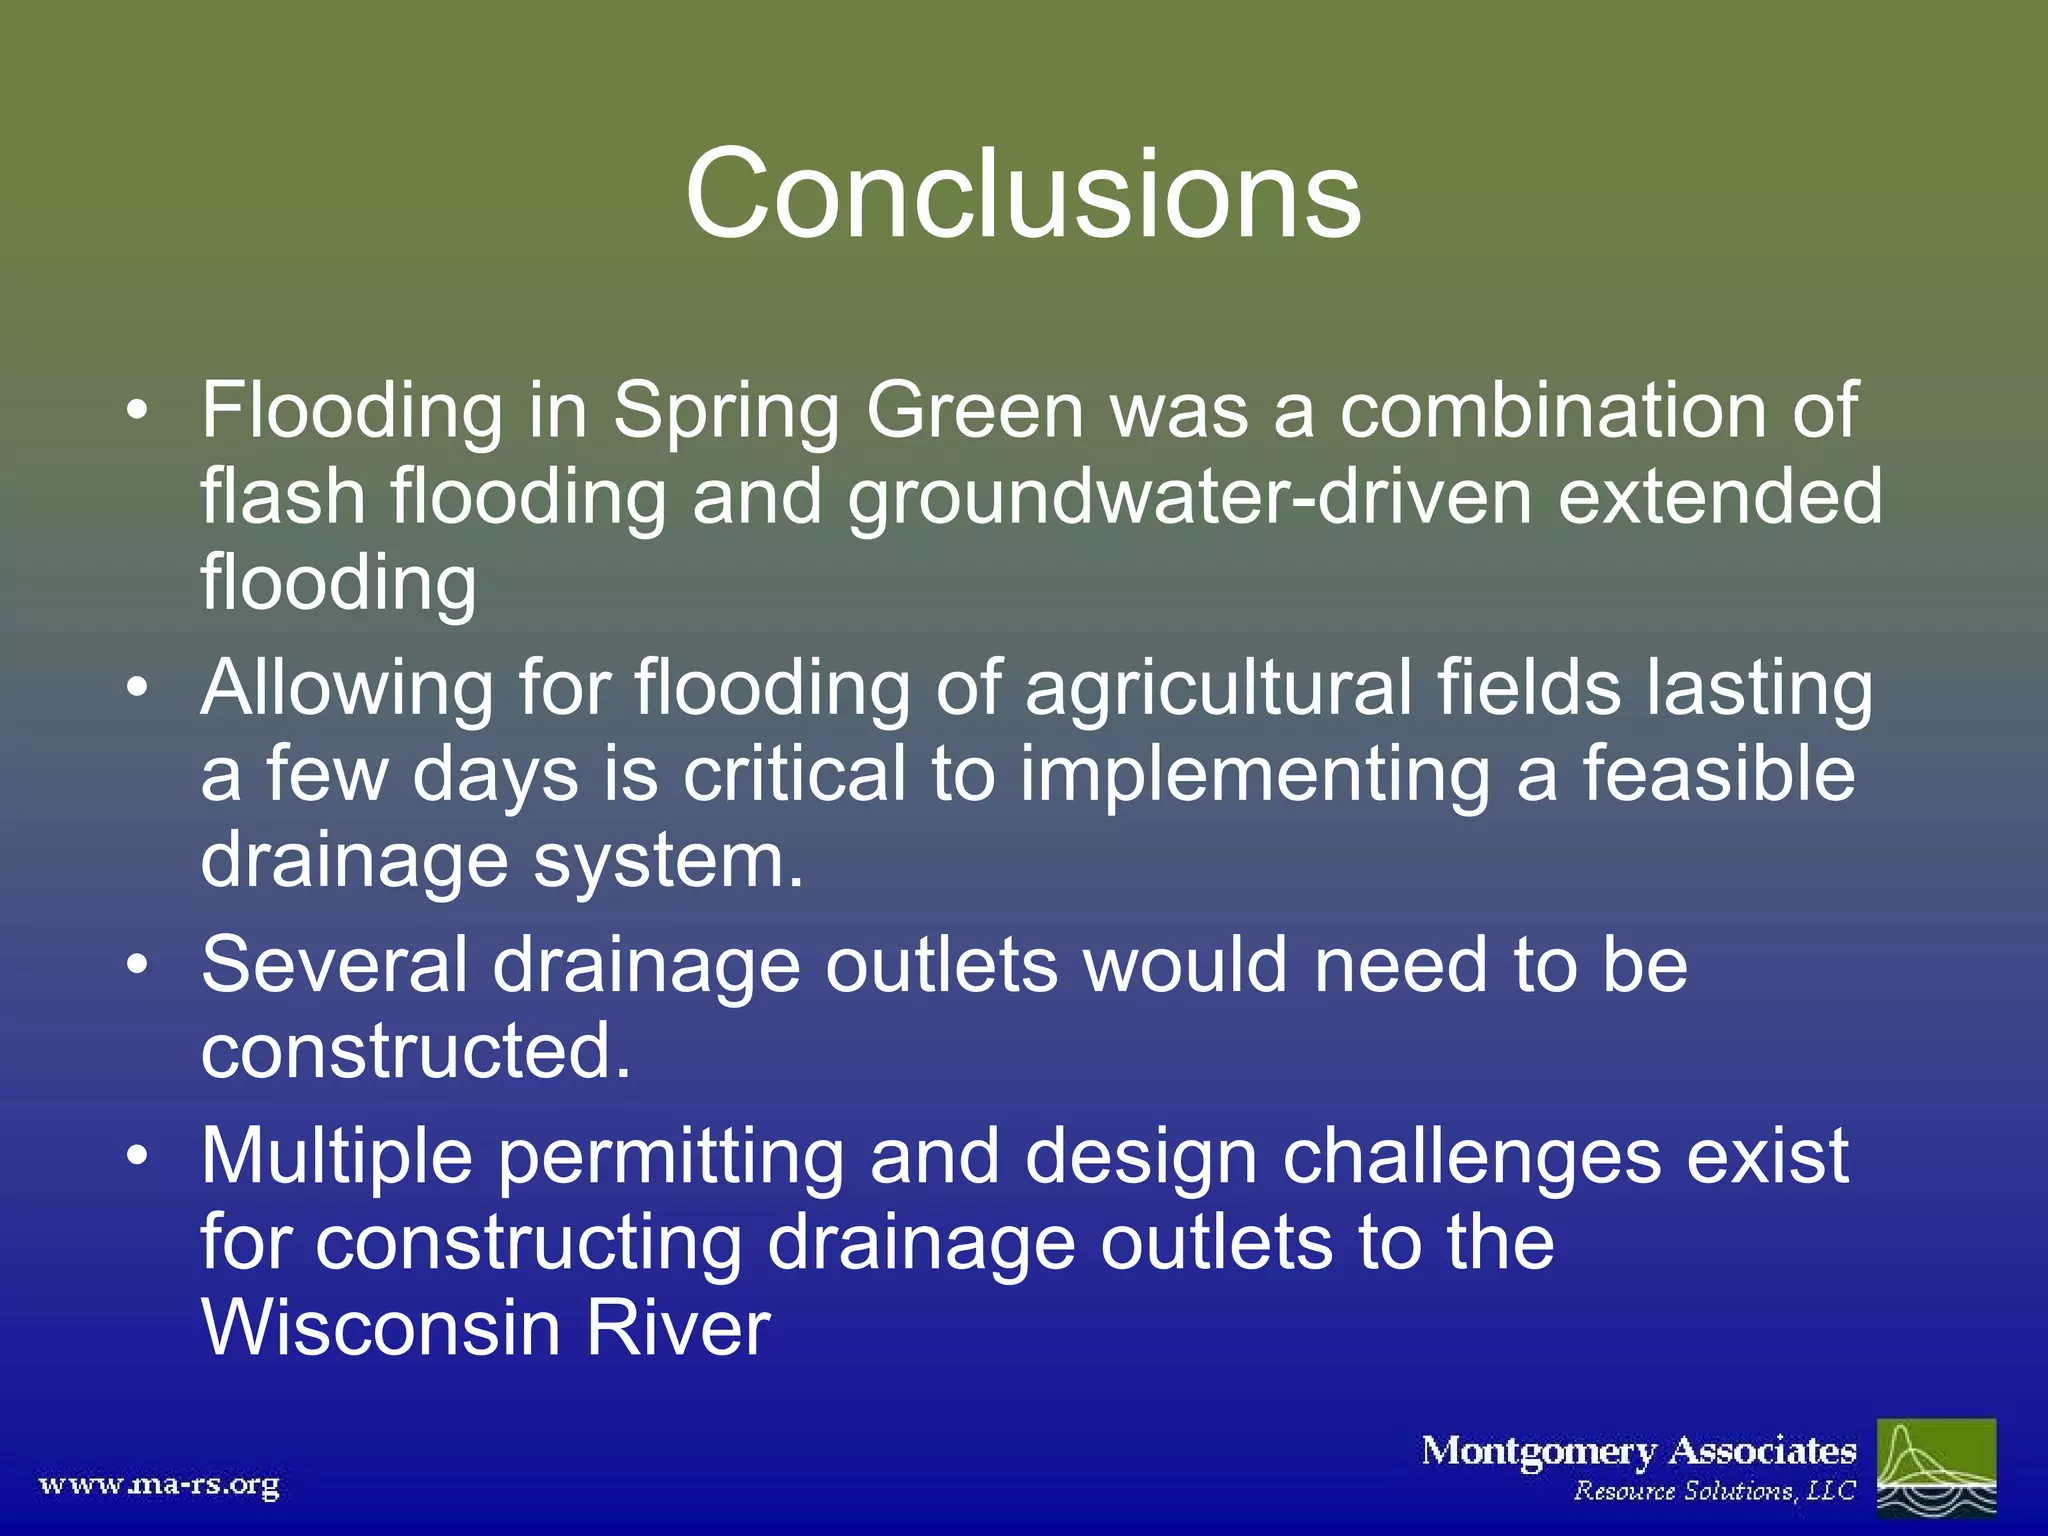
Spring Green 2008 Flooding
 and Flood Control Options
               Jon Lefers, PE
Montgomery Associates: Resource Solutions, LLC

          WAFSCM 2010 Conference
             November 4, 2010
Introduction
• Why did the flood occur?
• What happened?
• Can something be done about future
  damages from flooding?
Acknowledgments
• Jewell Engineering
• Town of Spring Green
• Wisconsin Geologic and Natural History
  Survey
• Fred Iausly
Why did the flood occur?


•   Wetter than normal late summer/fall in 2007
•   Record winter snowfall
•   June 7-8 and June 12 storms
•   No outlet for flood waters
Source: USGS, Professional Paper 1775
Mid-May
   Through
Mid-June 2008
 Precipitation
June 7-8 and June 12 Events
• Total of 10.1
  inches fell
  over 5 days
Current Runoff Pattern
Wisconsin River Valley Topography


                    Source: Sauk Co./F. Iausly/WGS
What happened?


• 4,400 acres flooded
• Crops destroyed        •   Sanitary sewer failures
• Homes and businesses   •   Culvert failures
  damaged or destroyed   •   Roads flooded
• Families evacuated &   •   Health and safety
  displaced from homes       problems
Flooding Extents


                   Source: F. Iausly
Can something be done about
   future damages from flooding?
FEMA Buyouts
• 28 substantially damaged homes were acquired
  and demolished or removed from flood hazard
  areas at a total cost of $5.4 million.
Flooding Reduction
• Developed a rainfall-runoff-routing model
• Evaluated several scenarios for performance
  – Key factors: Depth, area, and duration of flooding
• Evaluated impacts and costs for various
  solutions
Hydrologic Analysis
• Runoff Volumes
  – SCS Curve
    Number
    Methodology
     • Soils runoff
       potential
     • Land use runoff
       potential
  – Antecedent
    moisture conditions
    accounted for
Runoff Volumes (Acre-Feet)
                                         100 year
                    June 7-8   June 12      Storm    Current
 Big Hollow           1,013     1,740       1,442
                                                     Runoff
Central Basin           560       546       725
                                                     Pattern
 East Basin             360       350       479

 West Basin           1,182     1,153       1,516

Total Volume          3,116     3,790        4,162
Model Water Table Map
Groundwater moves from high to low elevations


               Wisconsin River


   Source: WGNHS model
Modeled Increase in Water Table (ft) when
   Recharge is Increased by 1 inch

      1.5 ft


               1.0 ft
Sample Scenario
Central Basin
             6000

                                                                                                                     Before Basin
                                                                                                                     After Basin
             5000


             4000
Flow (cfs)


             3000


             2000


             1000


                0
             6/7/2008 0:00 6/8/2008 0:00 6/9/2008 0:00   6/10/2008   6/11/2008   6/12/2008   6/13/2008   6/14/2008    6/15/2008   6/16/2008
                                                            0:00        0:00        0:00        0:00        0:00         0:00        0:00
Sample Scenario - Flooded Area
          June 13
Sample Scenario - Flooded Area
          June 15
Sample Scenario - Flooded Area
          June 17
Other Flooded Areas


                  Source: F. Iausly
Permits, Coordination, & Design
              Standards
•   DNR
•   US Army Corps
•   Lower Wisconsin State Riverway Board
•   DOT (Highways and railroad)
•   Wisconsin & Southern RR
•   DATCP & NRCS
•   Town of Spring Green
•   Sauk County
•   Above and below ground utilities
•   Local landowners (irrigation and land impacts)
Conclusions
• Flooding in Spring Green was a combination of
  flash flooding and groundwater-driven extended
  flooding
• Allowing for flooding of agricultural fields lasting
  a few days is critical to implementing a feasible
  drainage system.
• Several drainage outlets would need to be
  constructed.
• Multiple permitting and design challenges exist
  for constructing drainage outlets to the
  Wisconsin River

Spring Green 2008 Flooding and Flood Control Options

  • 1.
    Spring Green 2008Flooding and Flood Control Options Jon Lefers, PE Montgomery Associates: Resource Solutions, LLC WAFSCM 2010 Conference November 4, 2010
  • 2.
    Introduction • Why didthe flood occur? • What happened? • Can something be done about future damages from flooding?
  • 3.
    Acknowledgments • Jewell Engineering •Town of Spring Green • Wisconsin Geologic and Natural History Survey • Fred Iausly
  • 4.
    Why did theflood occur? • Wetter than normal late summer/fall in 2007 • Record winter snowfall • June 7-8 and June 12 storms • No outlet for flood waters
  • 5.
  • 6.
    Mid-May Through Mid-June 2008 Precipitation
  • 7.
    June 7-8 andJune 12 Events • Total of 10.1 inches fell over 5 days
  • 8.
  • 9.
    Wisconsin River ValleyTopography Source: Sauk Co./F. Iausly/WGS
  • 10.
    What happened? • 4,400acres flooded • Crops destroyed • Sanitary sewer failures • Homes and businesses • Culvert failures damaged or destroyed • Roads flooded • Families evacuated & • Health and safety displaced from homes problems
  • 11.
    Flooding Extents Source: F. Iausly
  • 15.
    Can something bedone about future damages from flooding? FEMA Buyouts • 28 substantially damaged homes were acquired and demolished or removed from flood hazard areas at a total cost of $5.4 million. Flooding Reduction • Developed a rainfall-runoff-routing model • Evaluated several scenarios for performance – Key factors: Depth, area, and duration of flooding • Evaluated impacts and costs for various solutions
  • 16.
    Hydrologic Analysis • RunoffVolumes – SCS Curve Number Methodology • Soils runoff potential • Land use runoff potential – Antecedent moisture conditions accounted for
  • 17.
    Runoff Volumes (Acre-Feet) 100 year June 7-8 June 12 Storm Current Big Hollow 1,013 1,740 1,442 Runoff Central Basin 560 546 725 Pattern East Basin 360 350 479 West Basin 1,182 1,153 1,516 Total Volume 3,116 3,790 4,162
  • 18.
    Model Water TableMap Groundwater moves from high to low elevations Wisconsin River Source: WGNHS model
  • 19.
    Modeled Increase inWater Table (ft) when Recharge is Increased by 1 inch 1.5 ft 1.0 ft
  • 20.
  • 21.
    Central Basin 6000 Before Basin After Basin 5000 4000 Flow (cfs) 3000 2000 1000 0 6/7/2008 0:00 6/8/2008 0:00 6/9/2008 0:00 6/10/2008 6/11/2008 6/12/2008 6/13/2008 6/14/2008 6/15/2008 6/16/2008 0:00 0:00 0:00 0:00 0:00 0:00 0:00
  • 22.
    Sample Scenario -Flooded Area June 13
  • 23.
    Sample Scenario -Flooded Area June 15
  • 24.
    Sample Scenario -Flooded Area June 17
  • 25.
    Other Flooded Areas Source: F. Iausly
  • 26.
    Permits, Coordination, &Design Standards • DNR • US Army Corps • Lower Wisconsin State Riverway Board • DOT (Highways and railroad) • Wisconsin & Southern RR • DATCP & NRCS • Town of Spring Green • Sauk County • Above and below ground utilities • Local landowners (irrigation and land impacts)
  • 27.
    Conclusions • Flooding inSpring Green was a combination of flash flooding and groundwater-driven extended flooding • Allowing for flooding of agricultural fields lasting a few days is critical to implementing a feasible drainage system. • Several drainage outlets would need to be constructed. • Multiple permitting and design challenges exist for constructing drainage outlets to the Wisconsin River