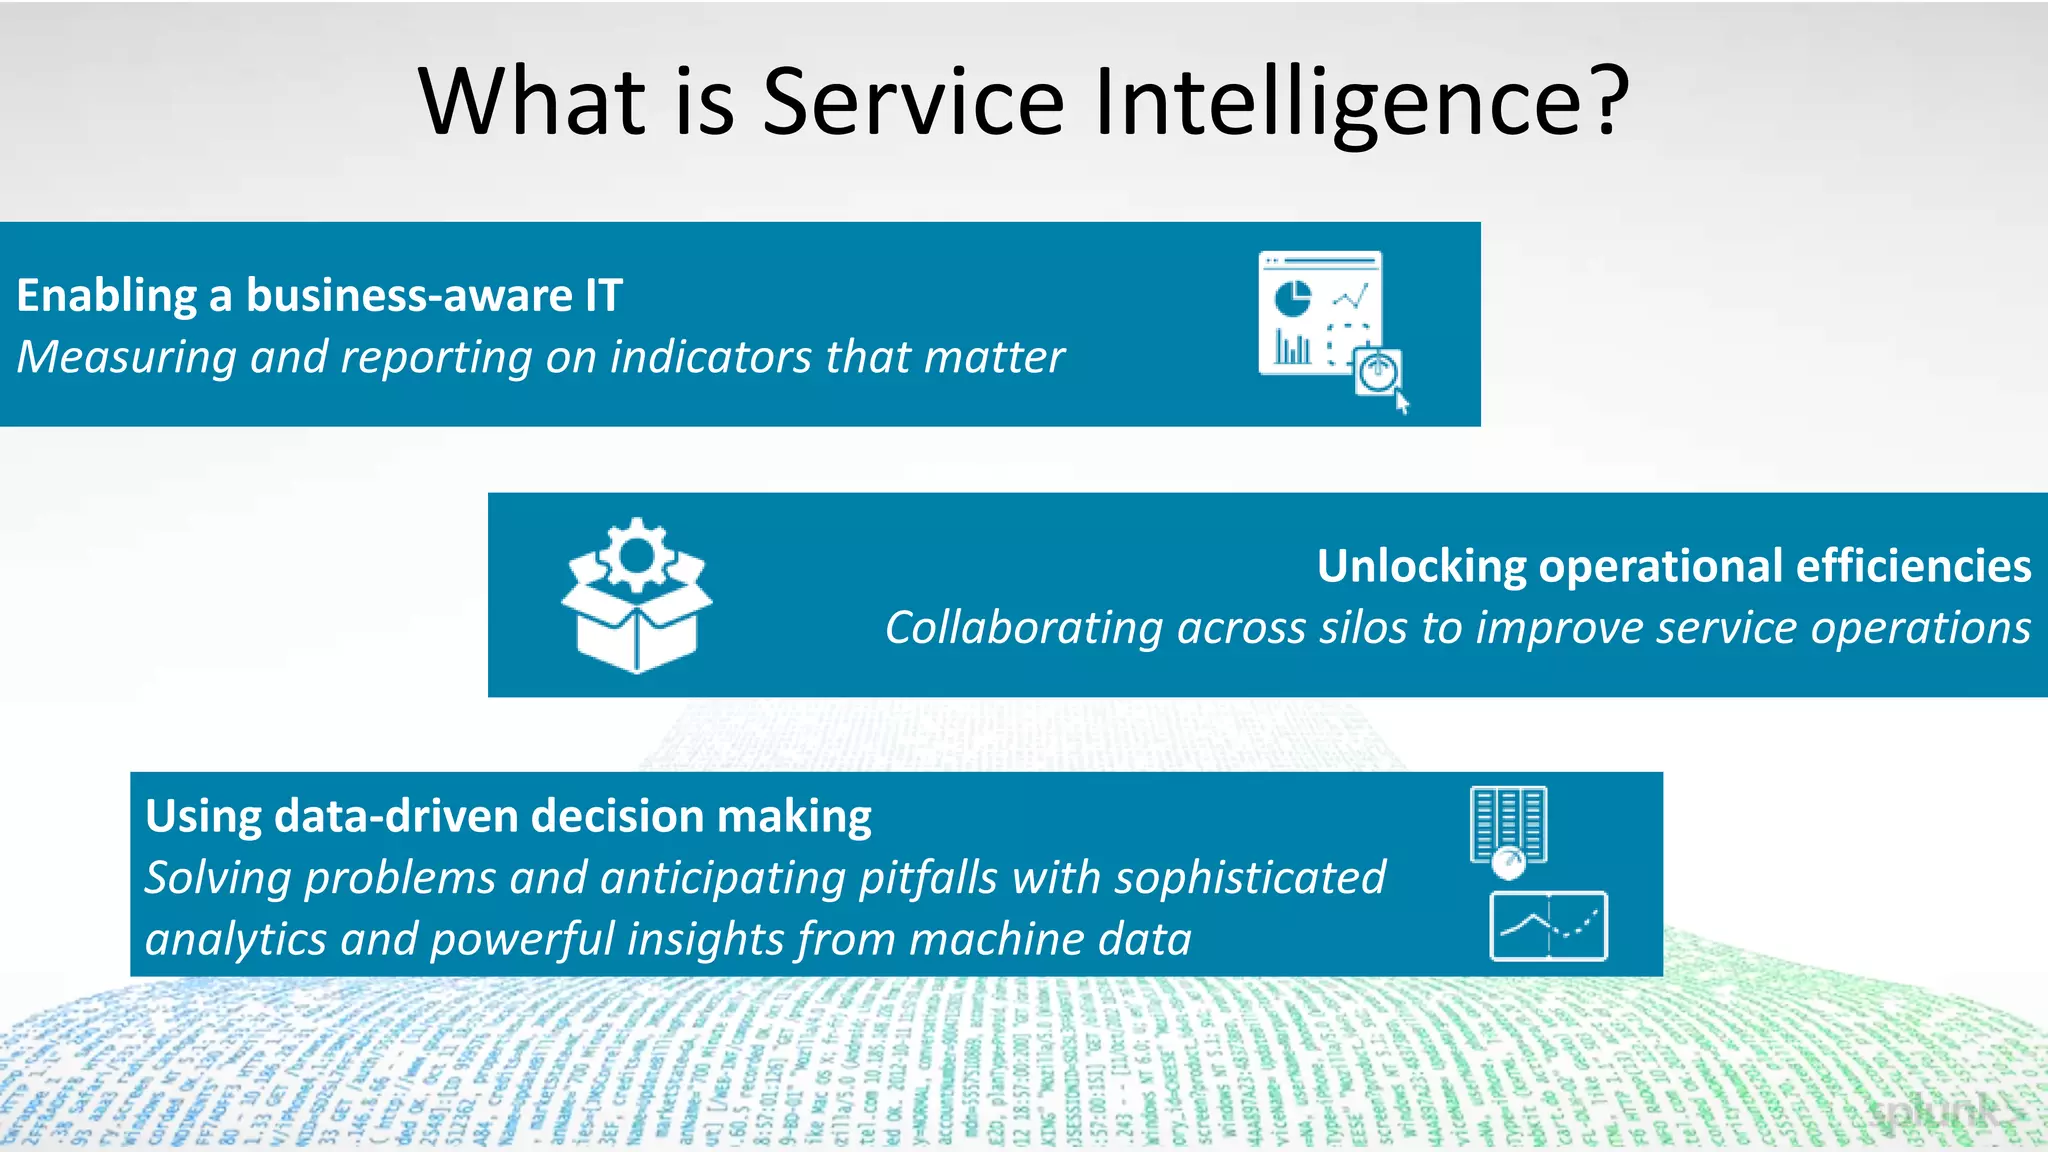
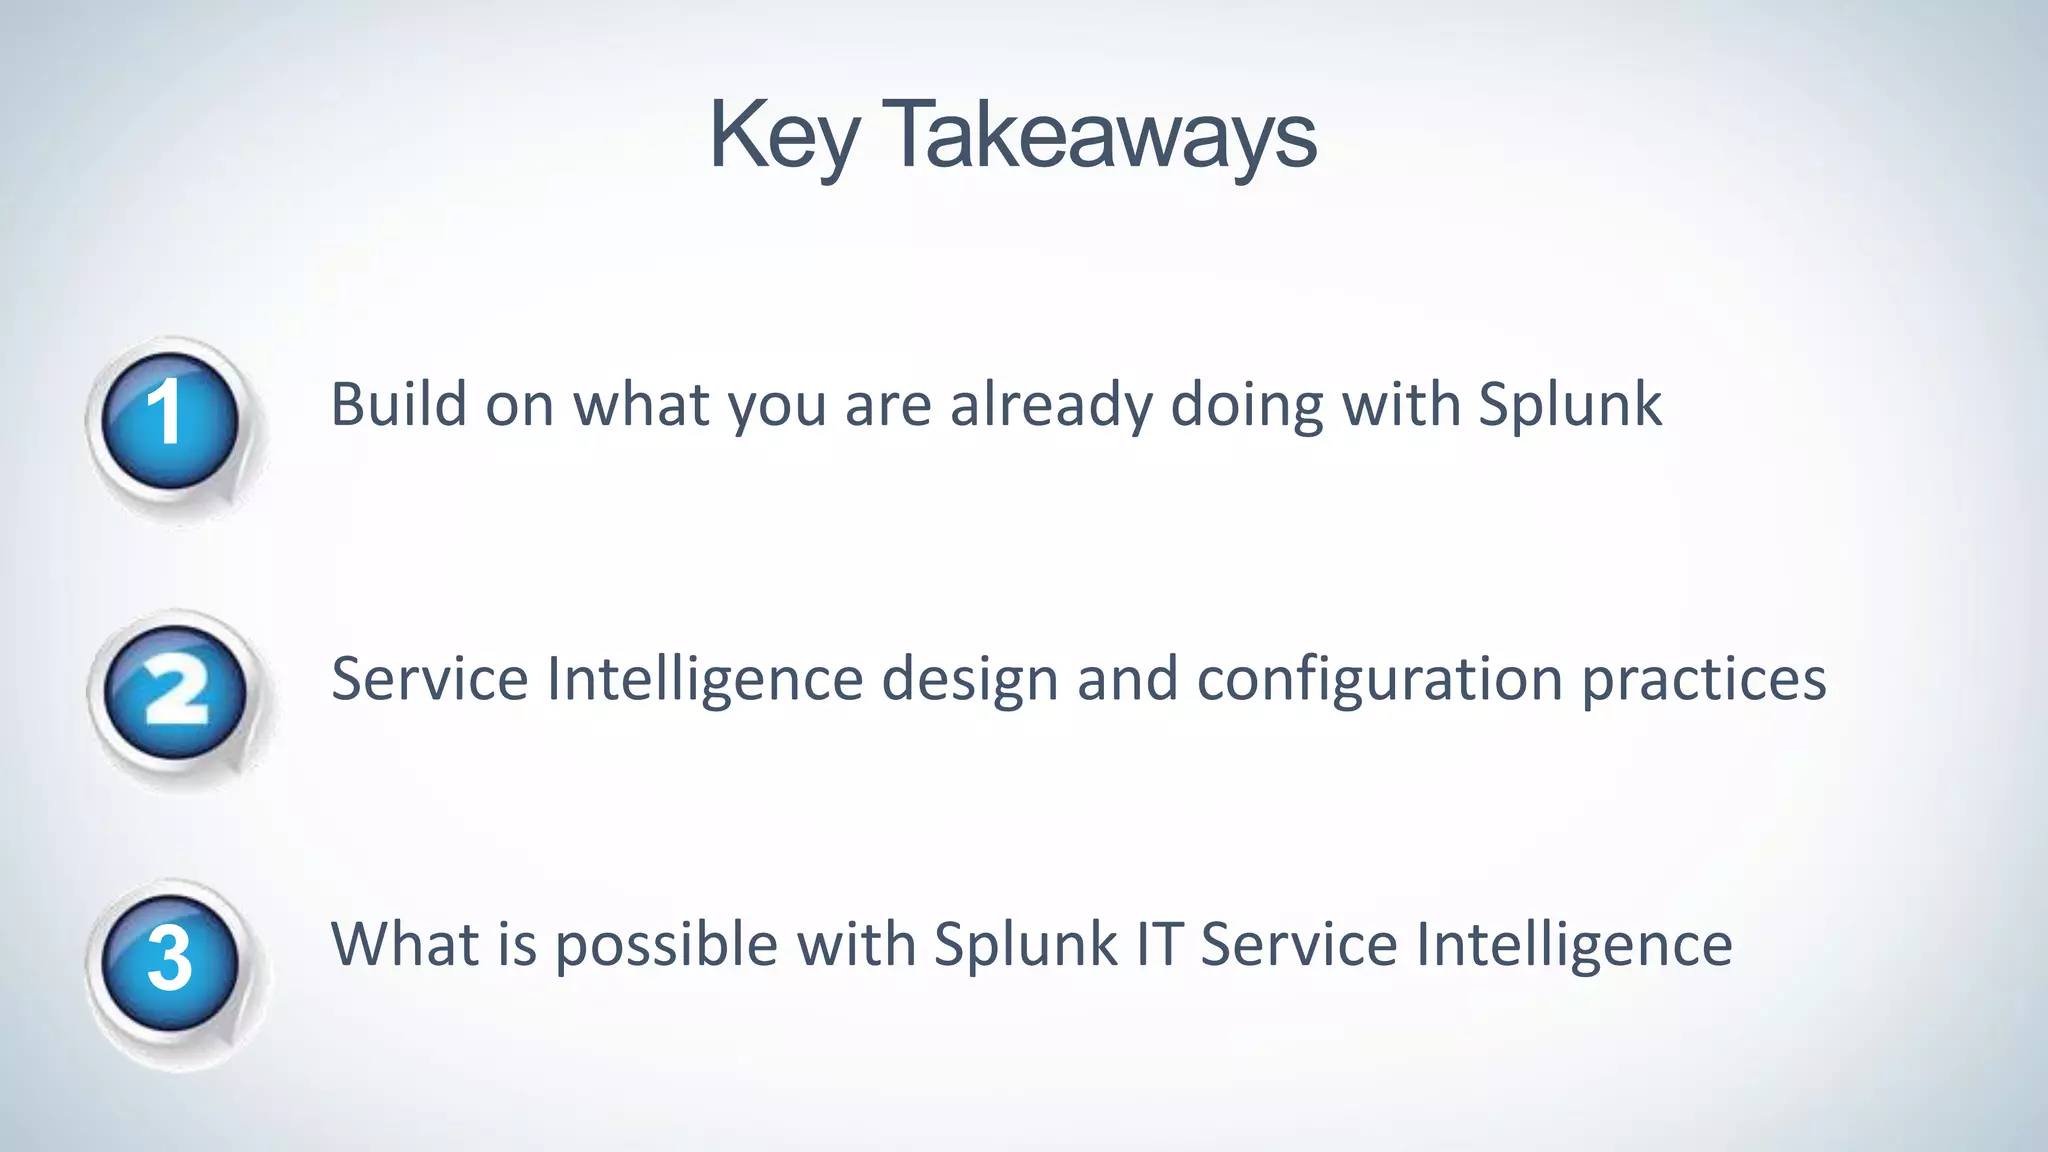
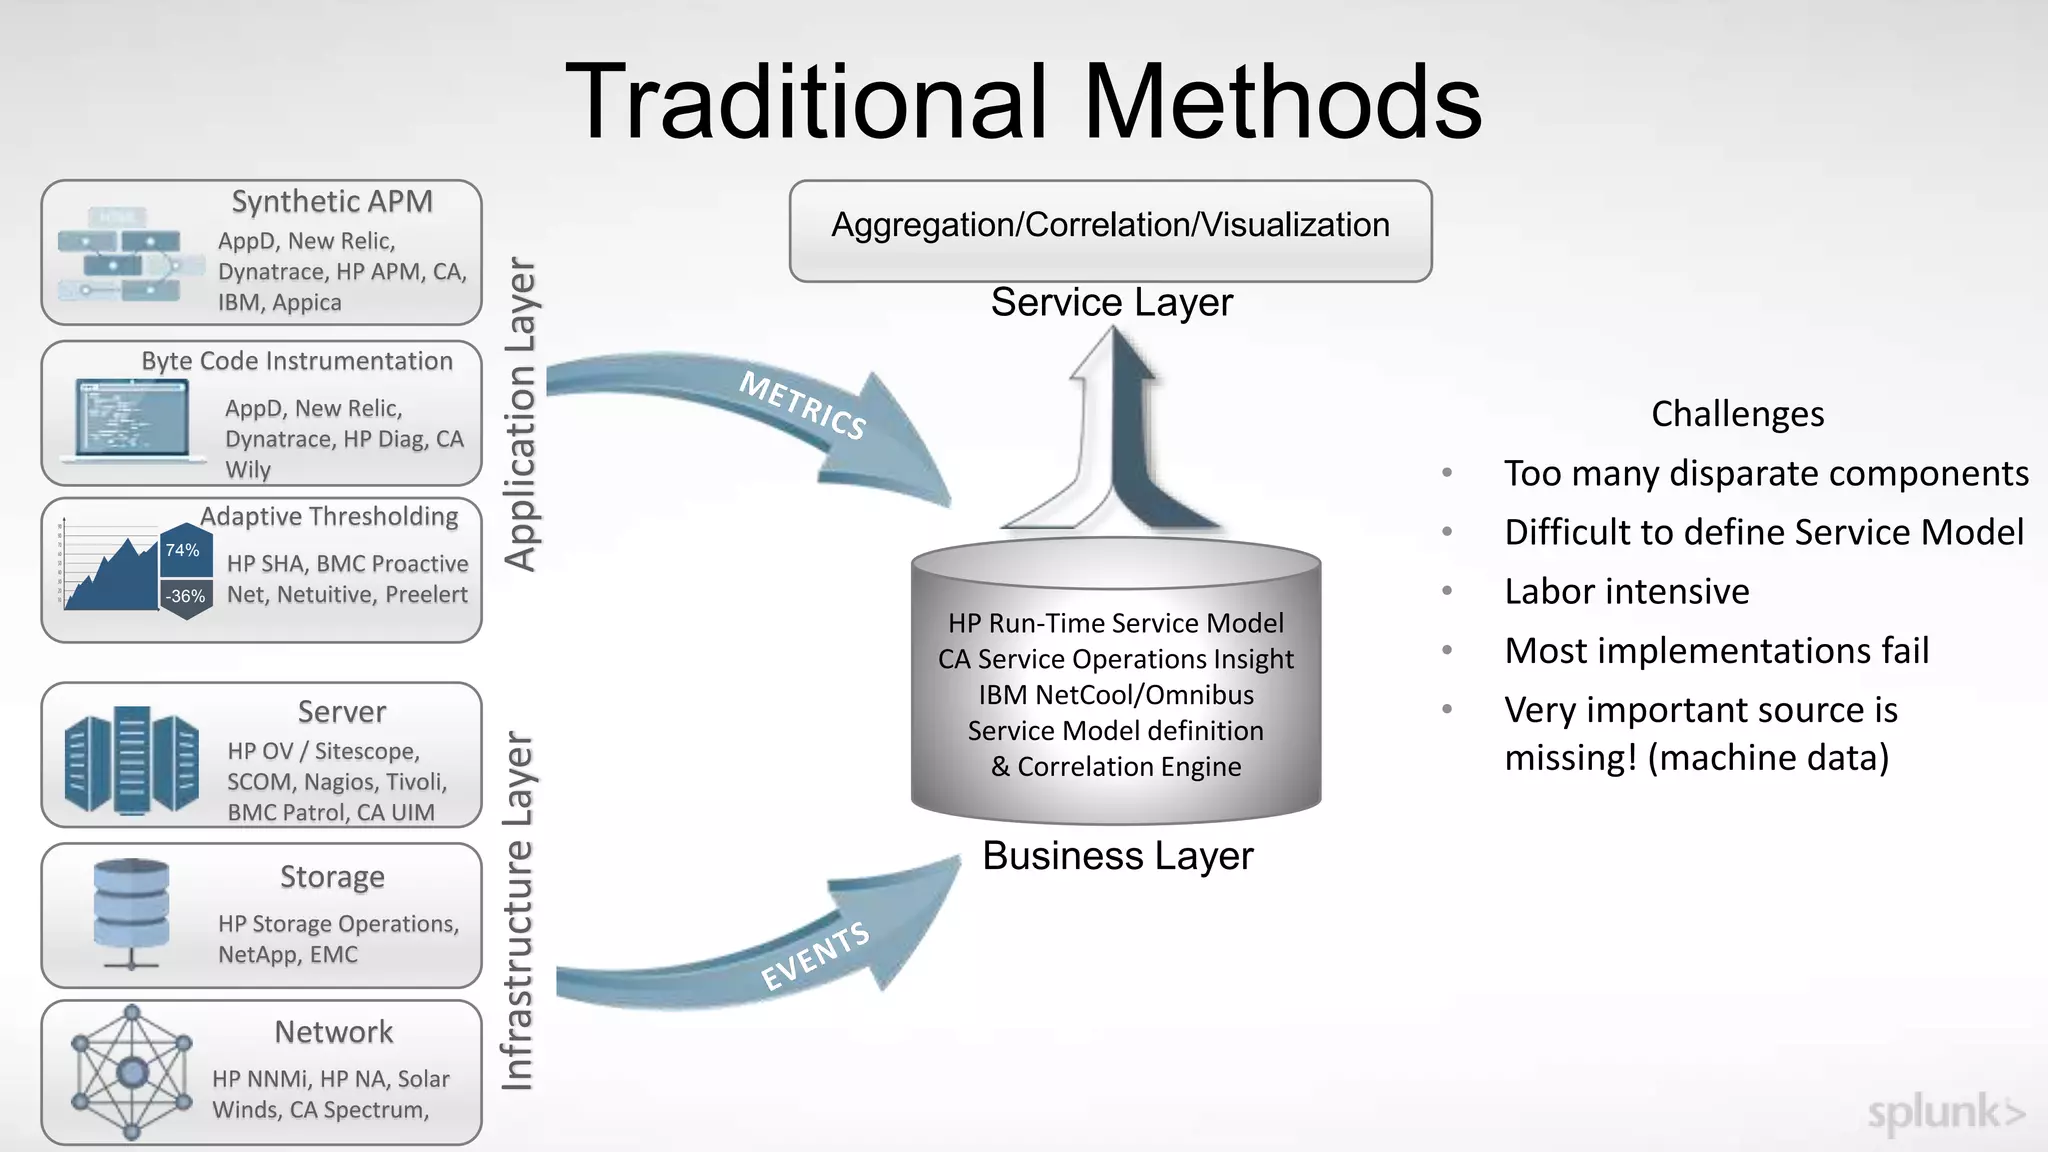
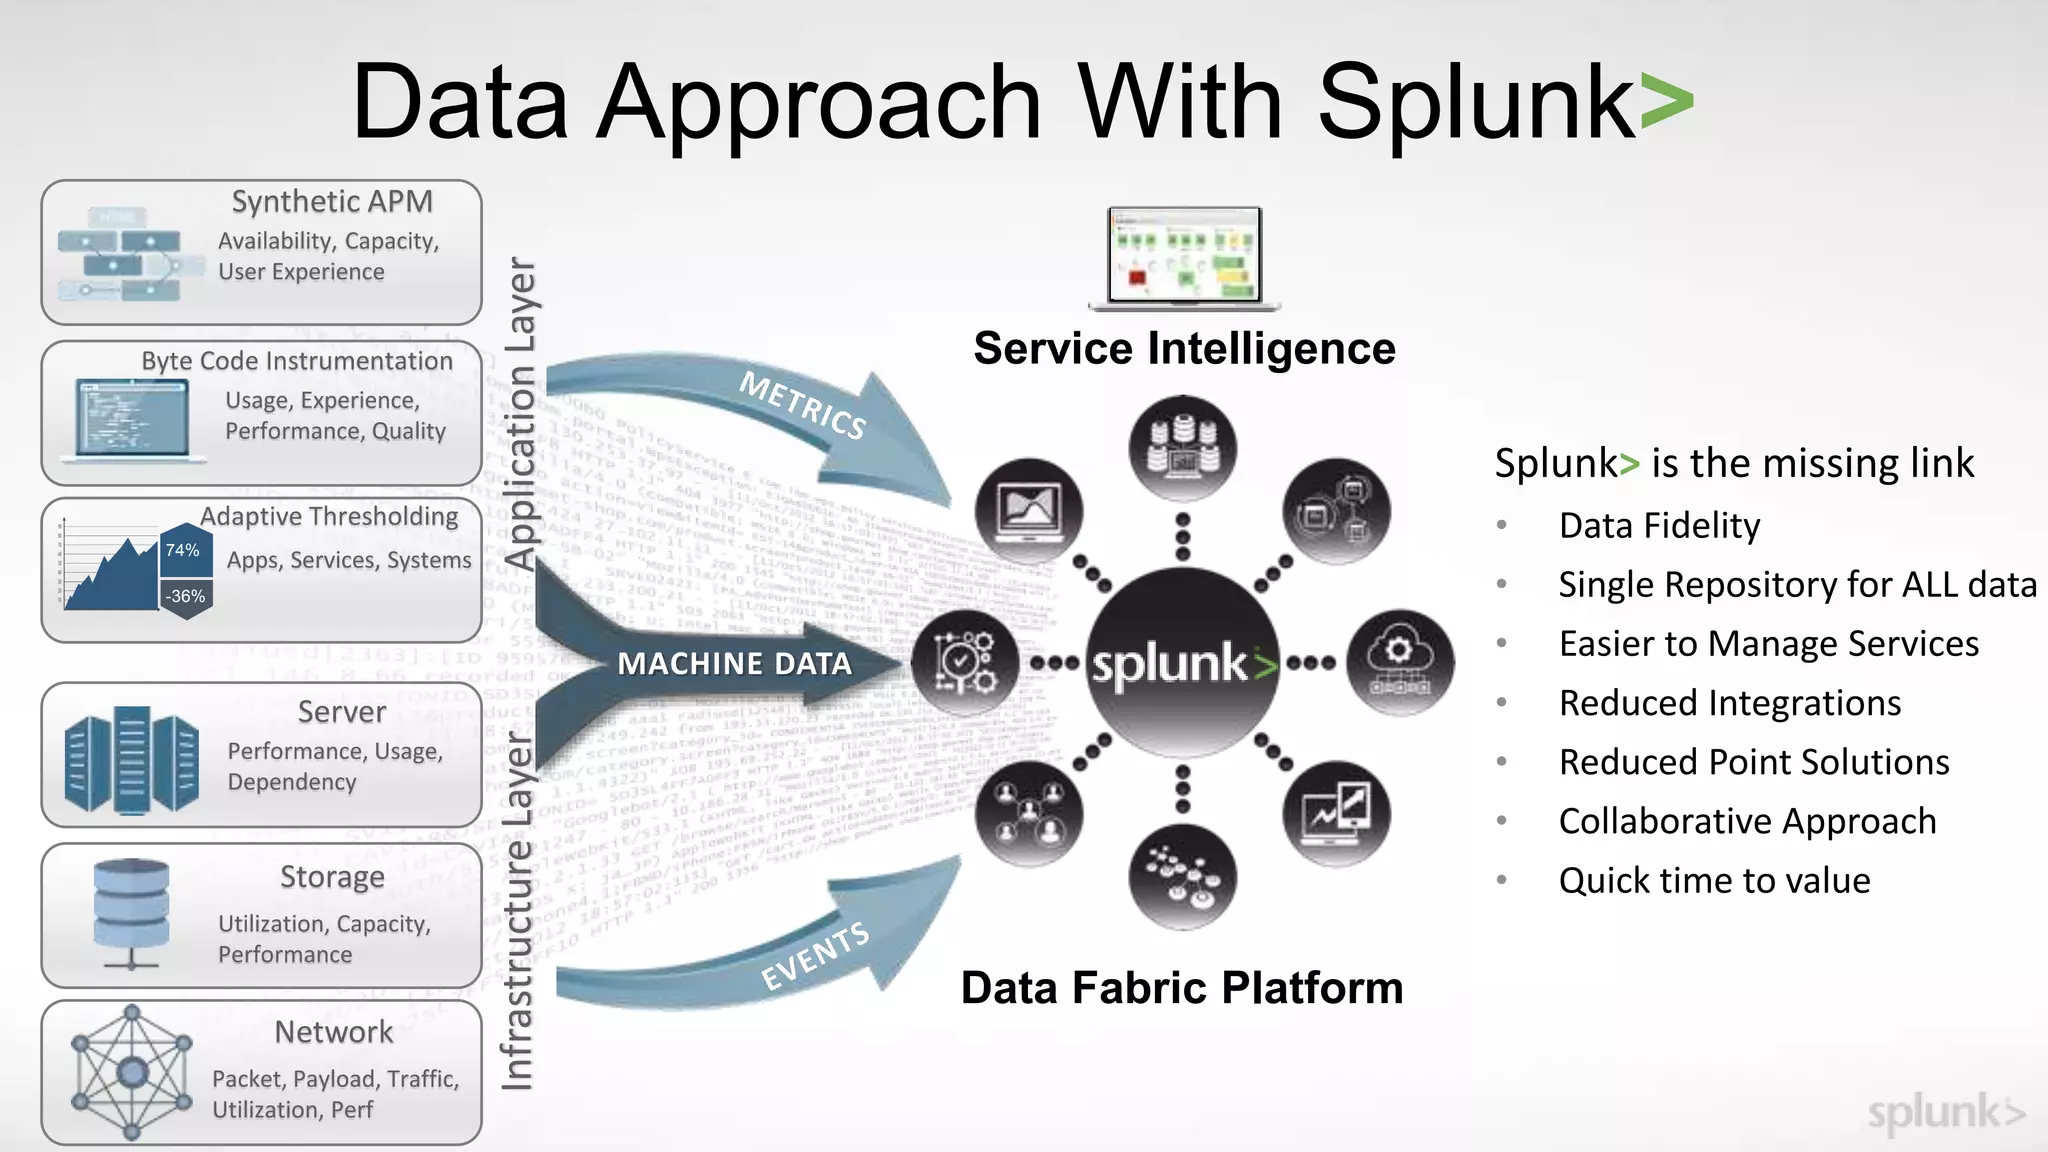
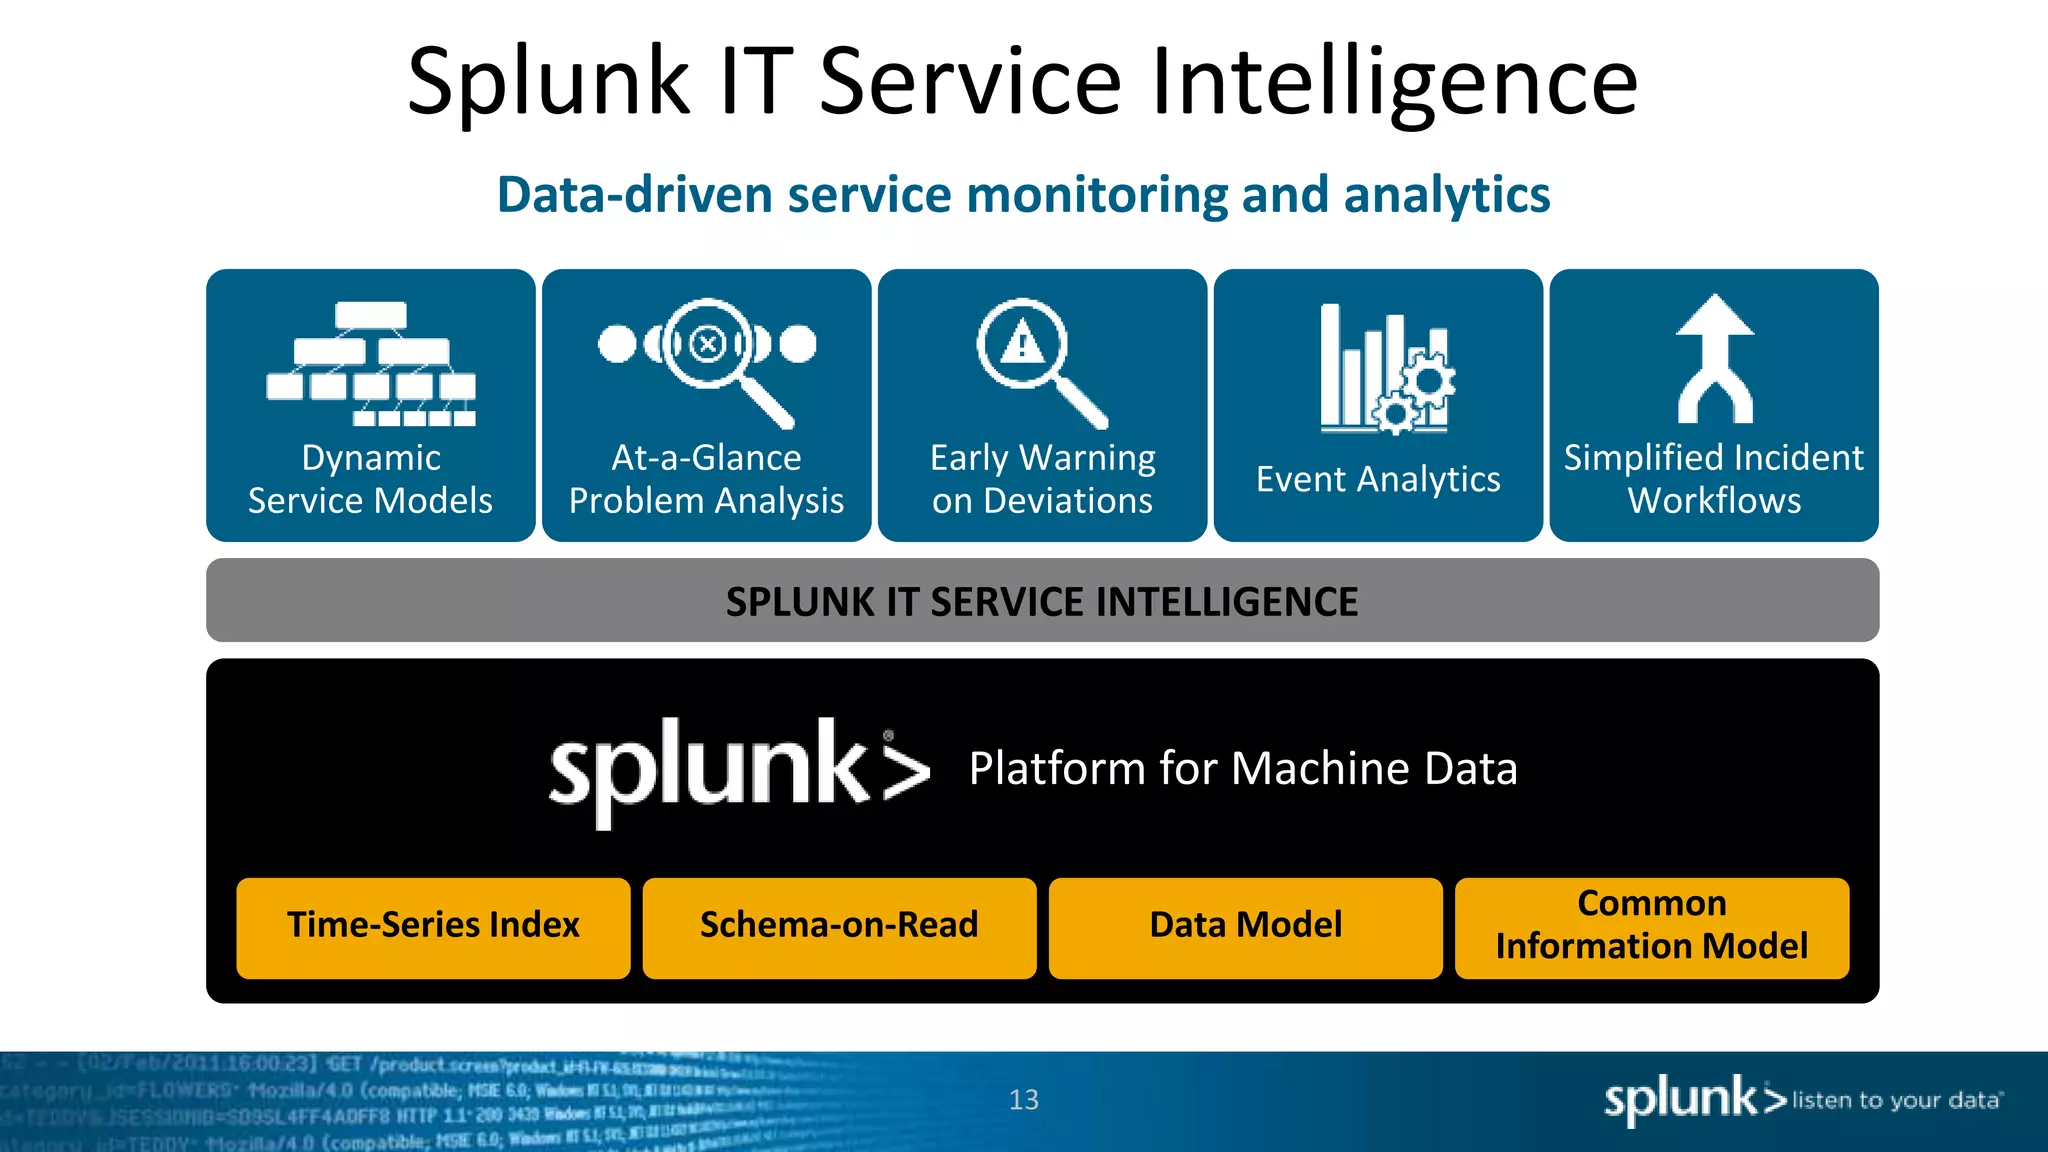
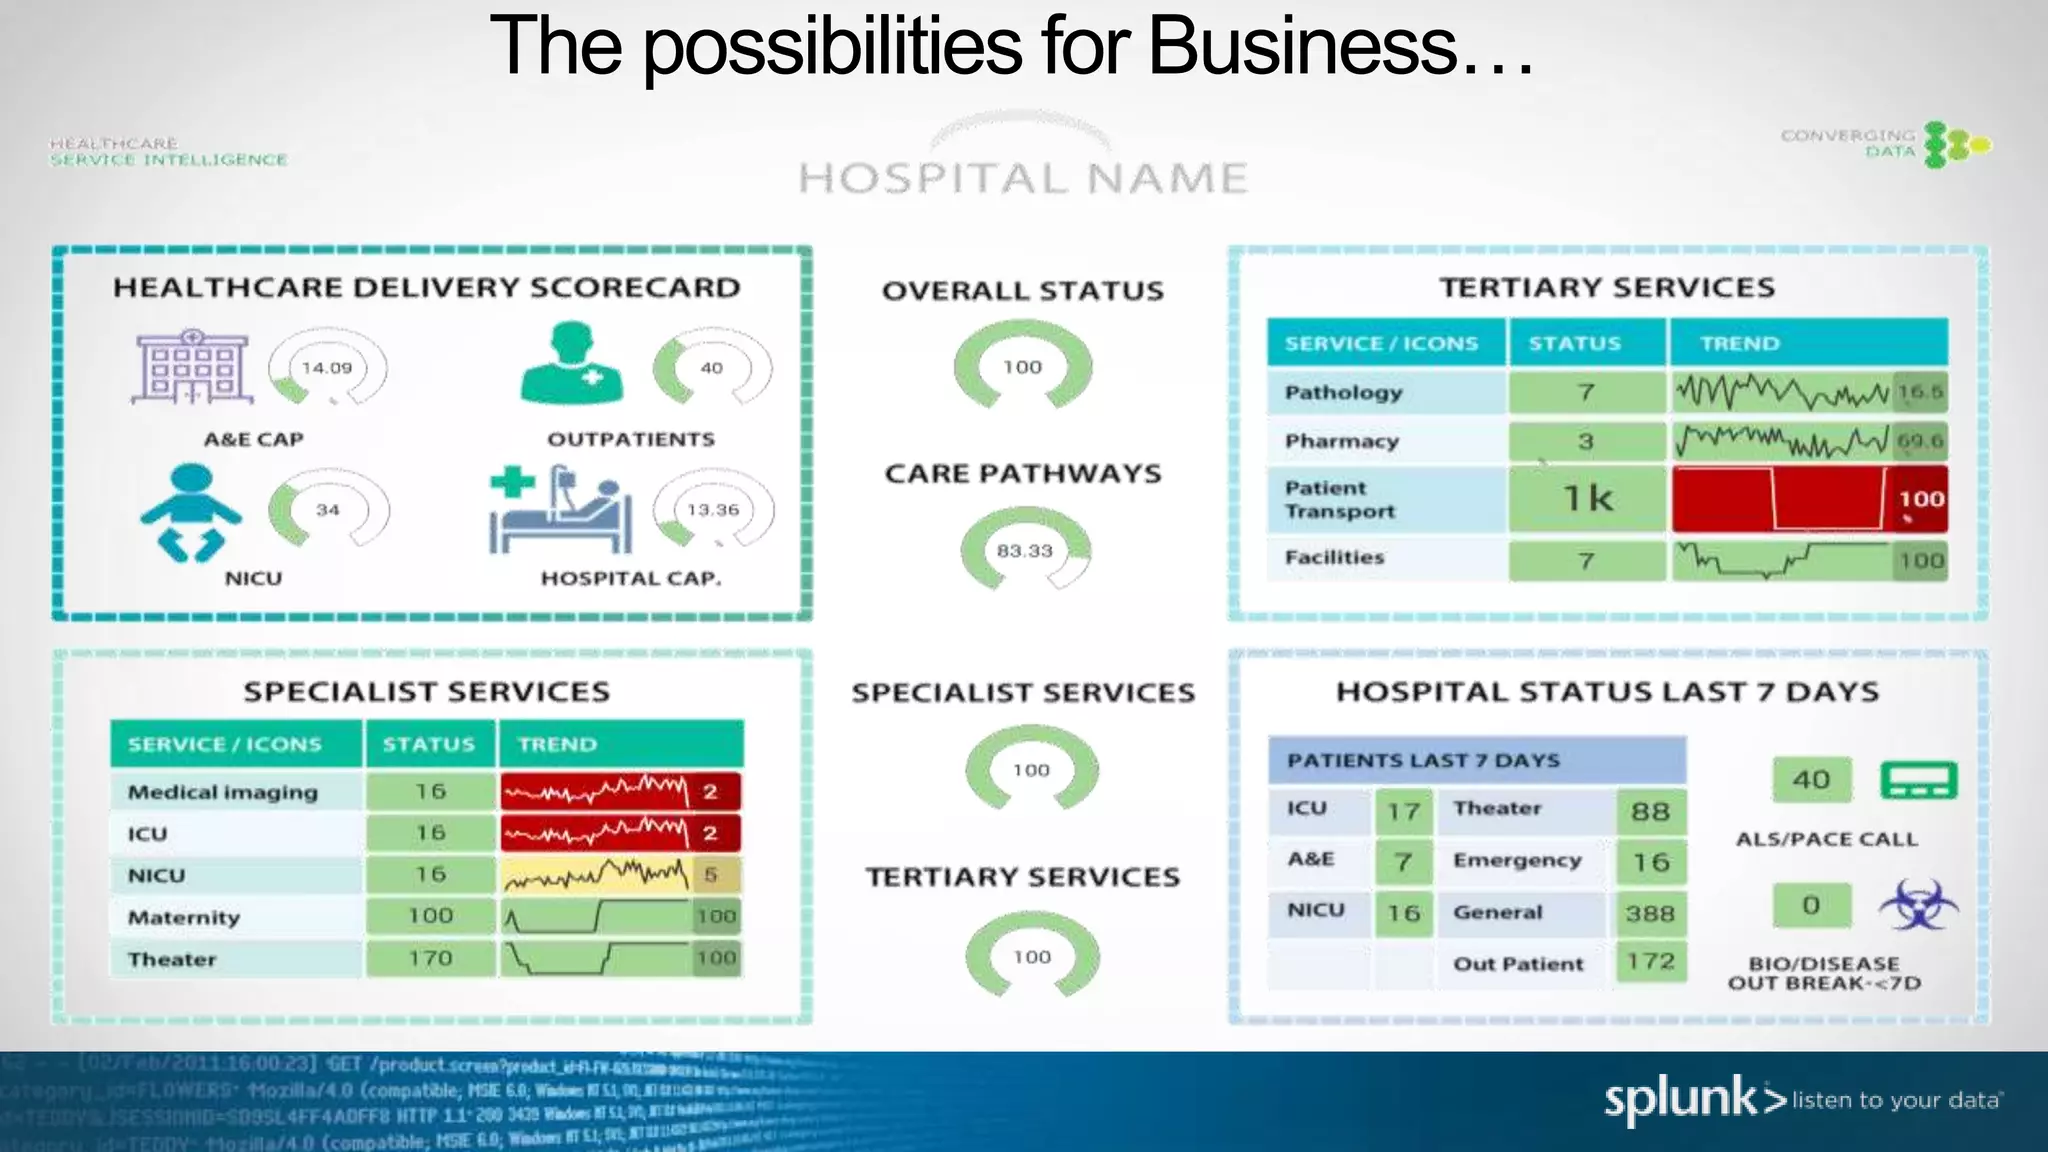
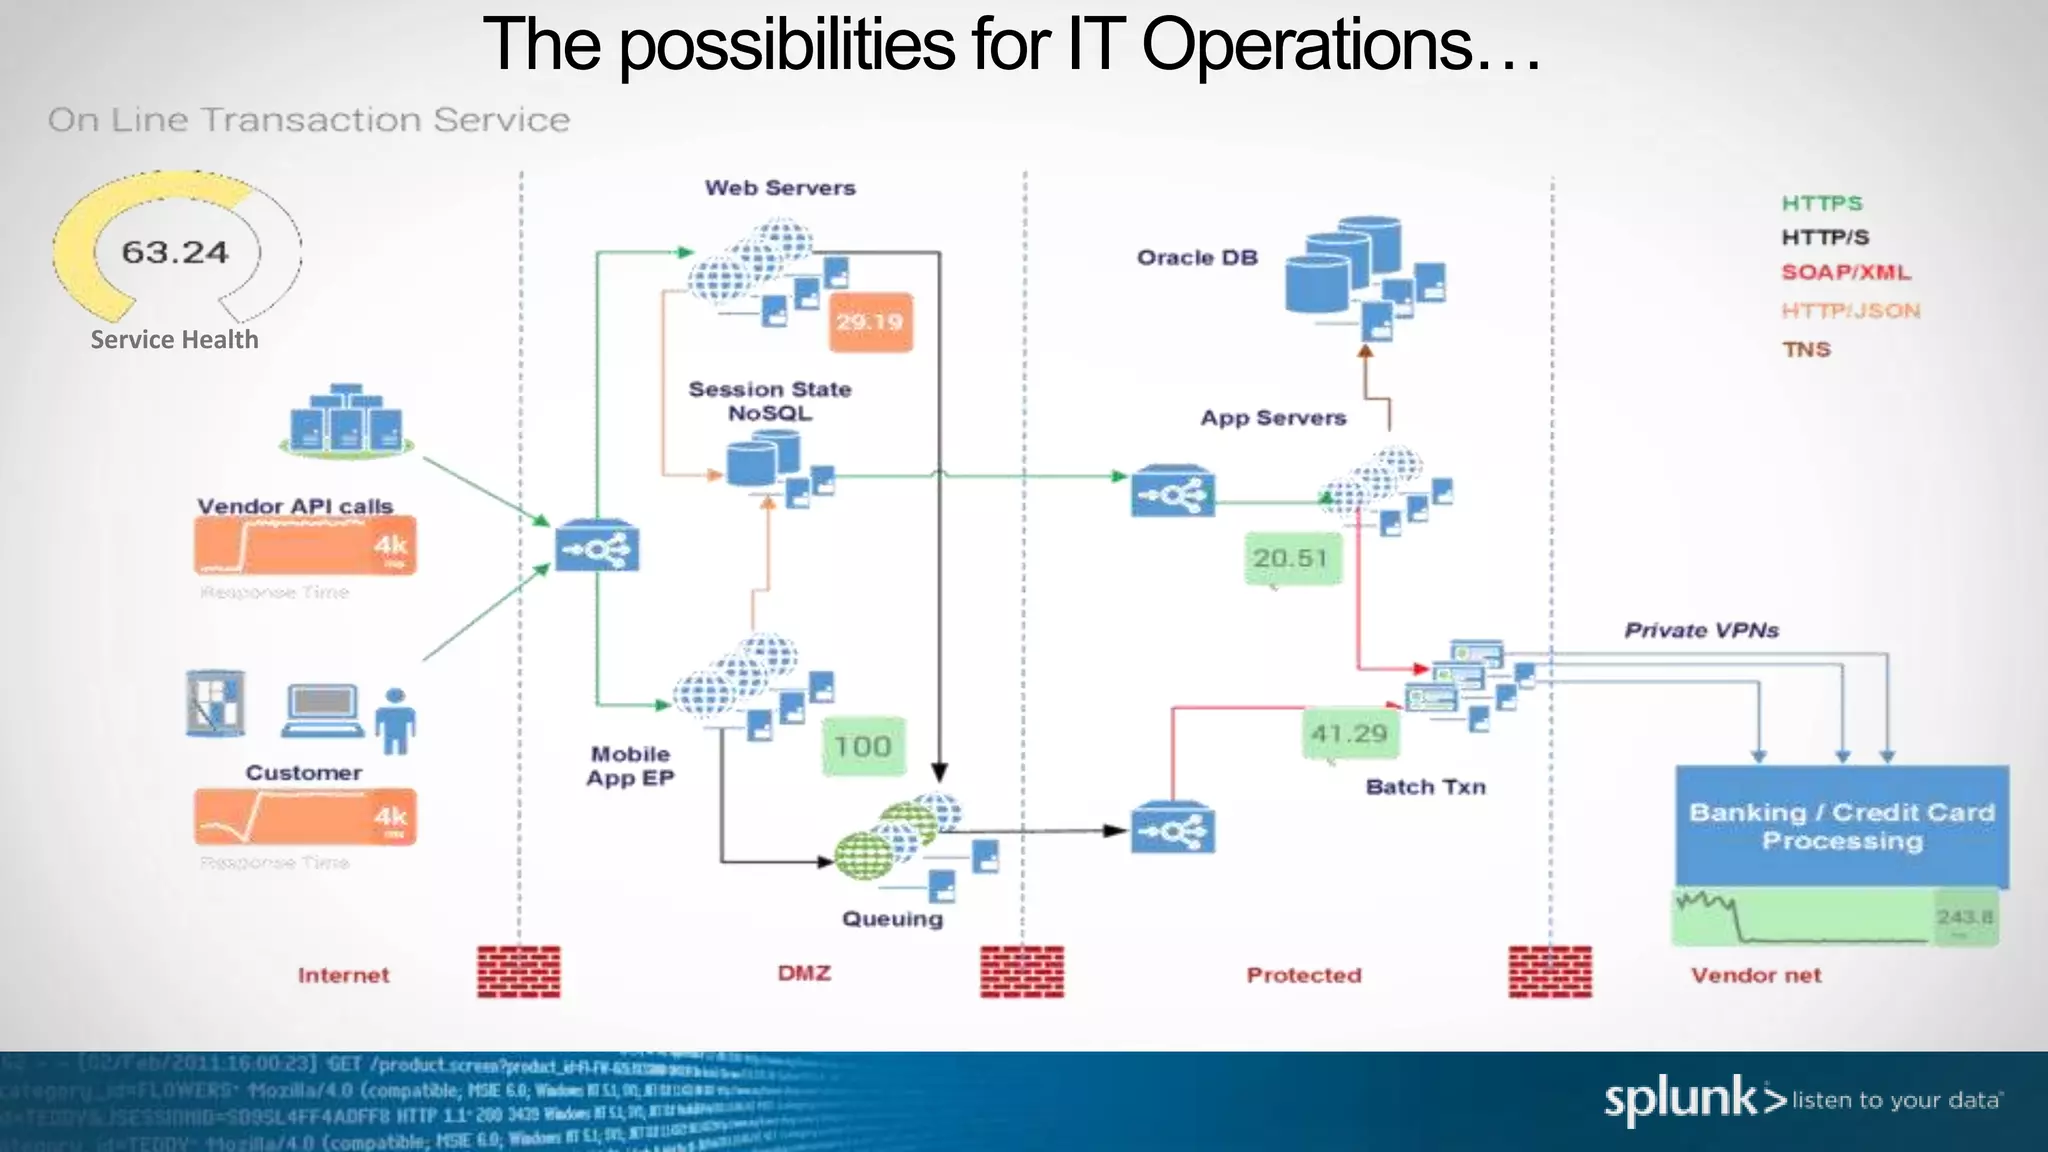
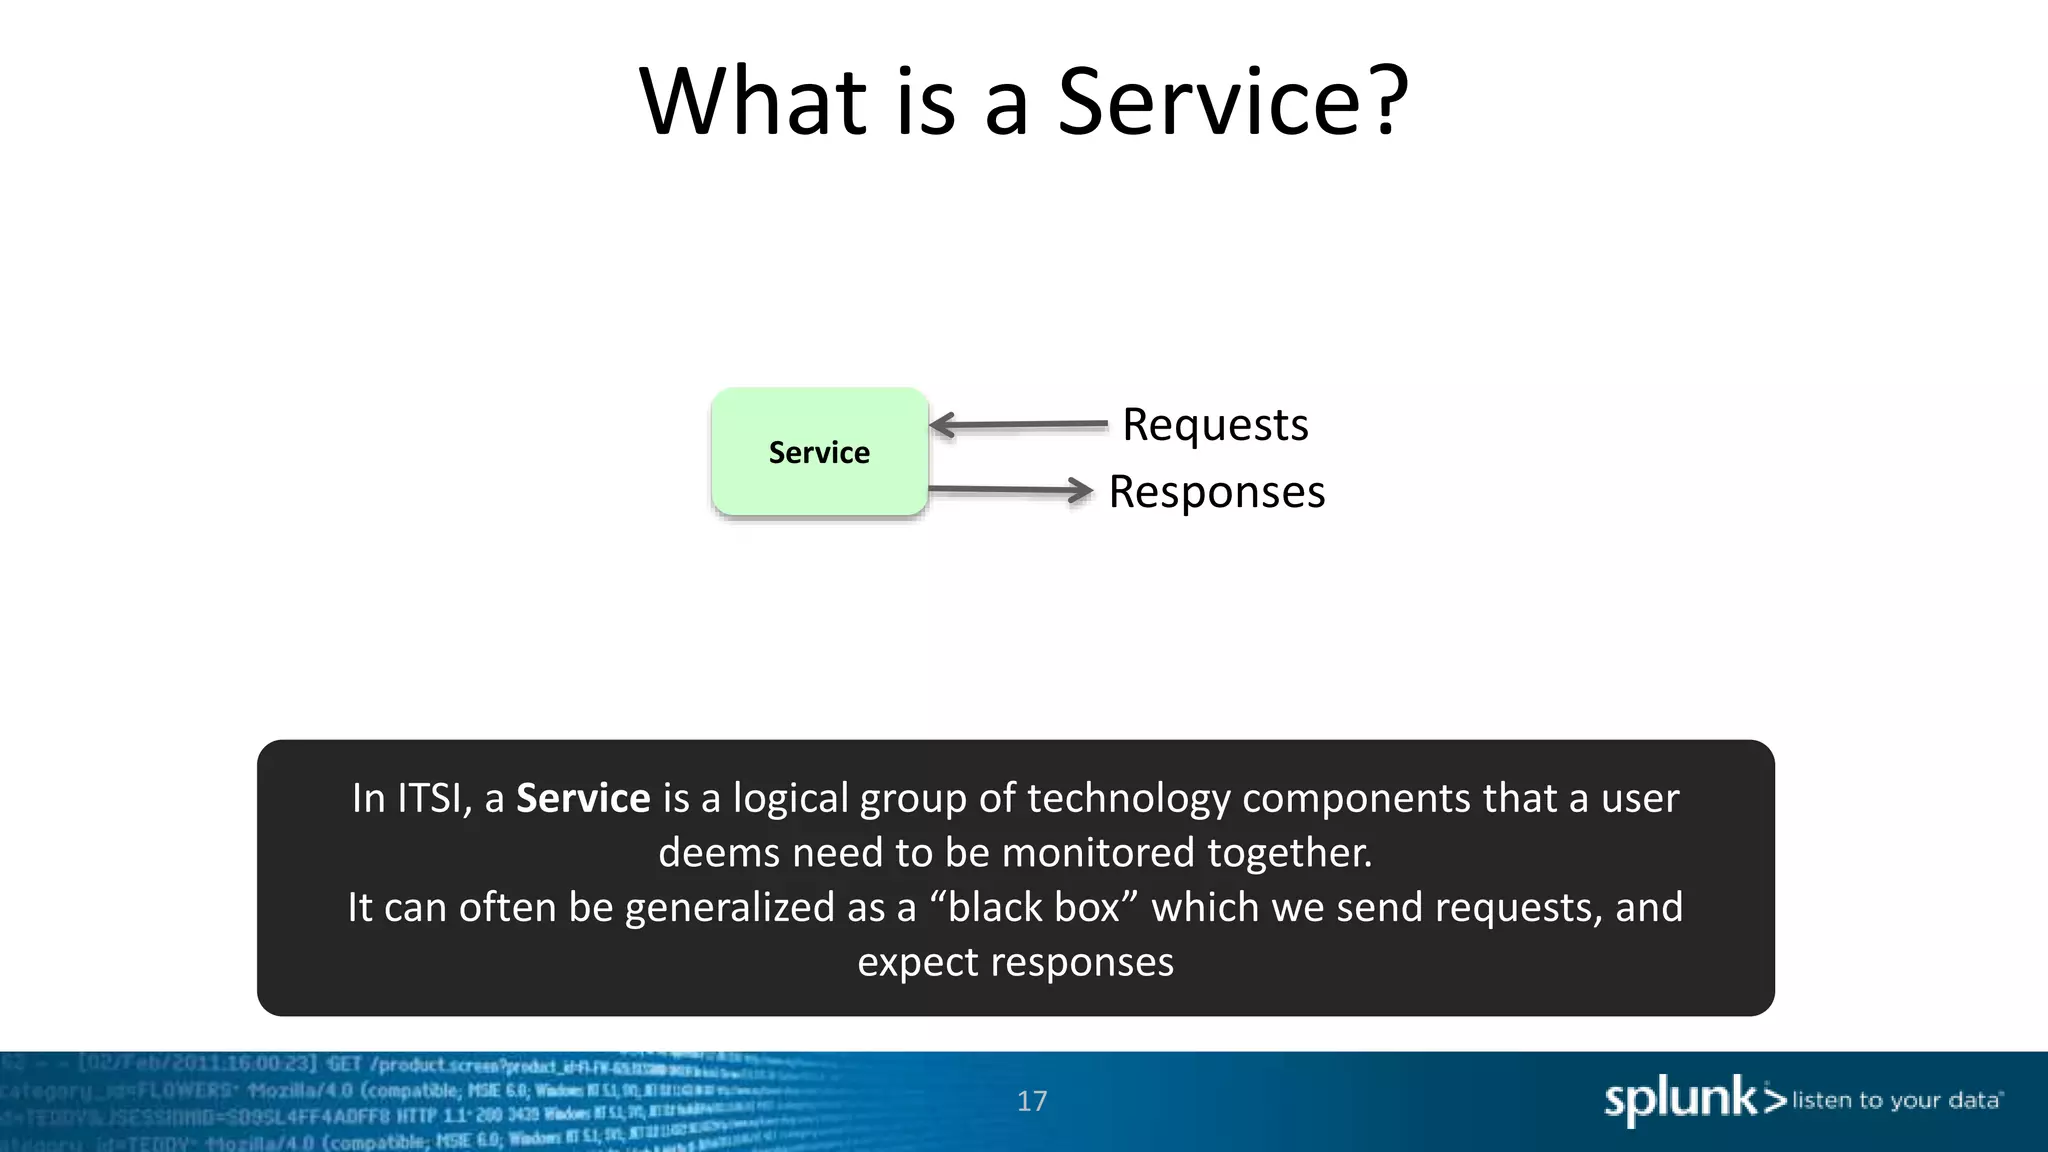
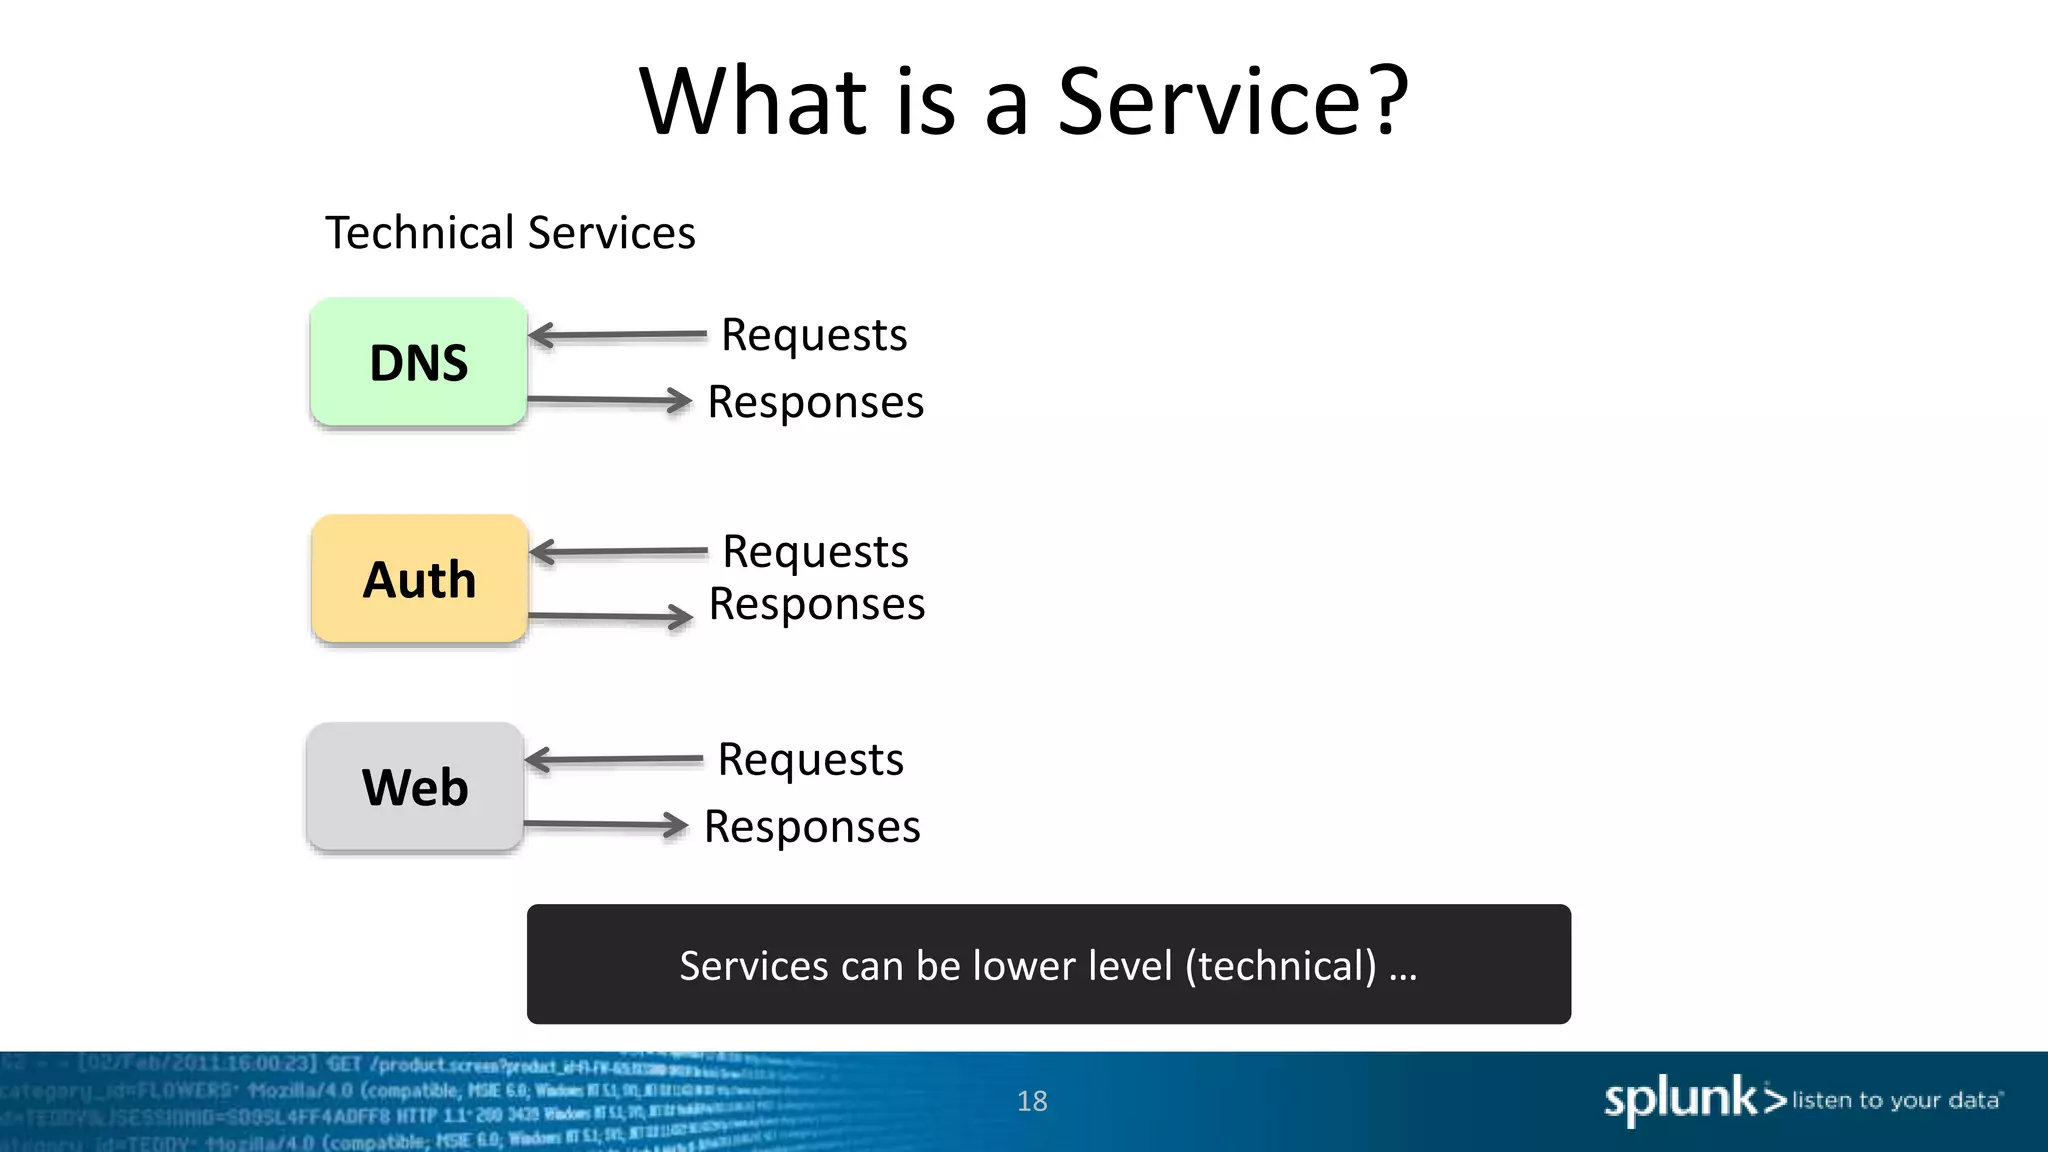
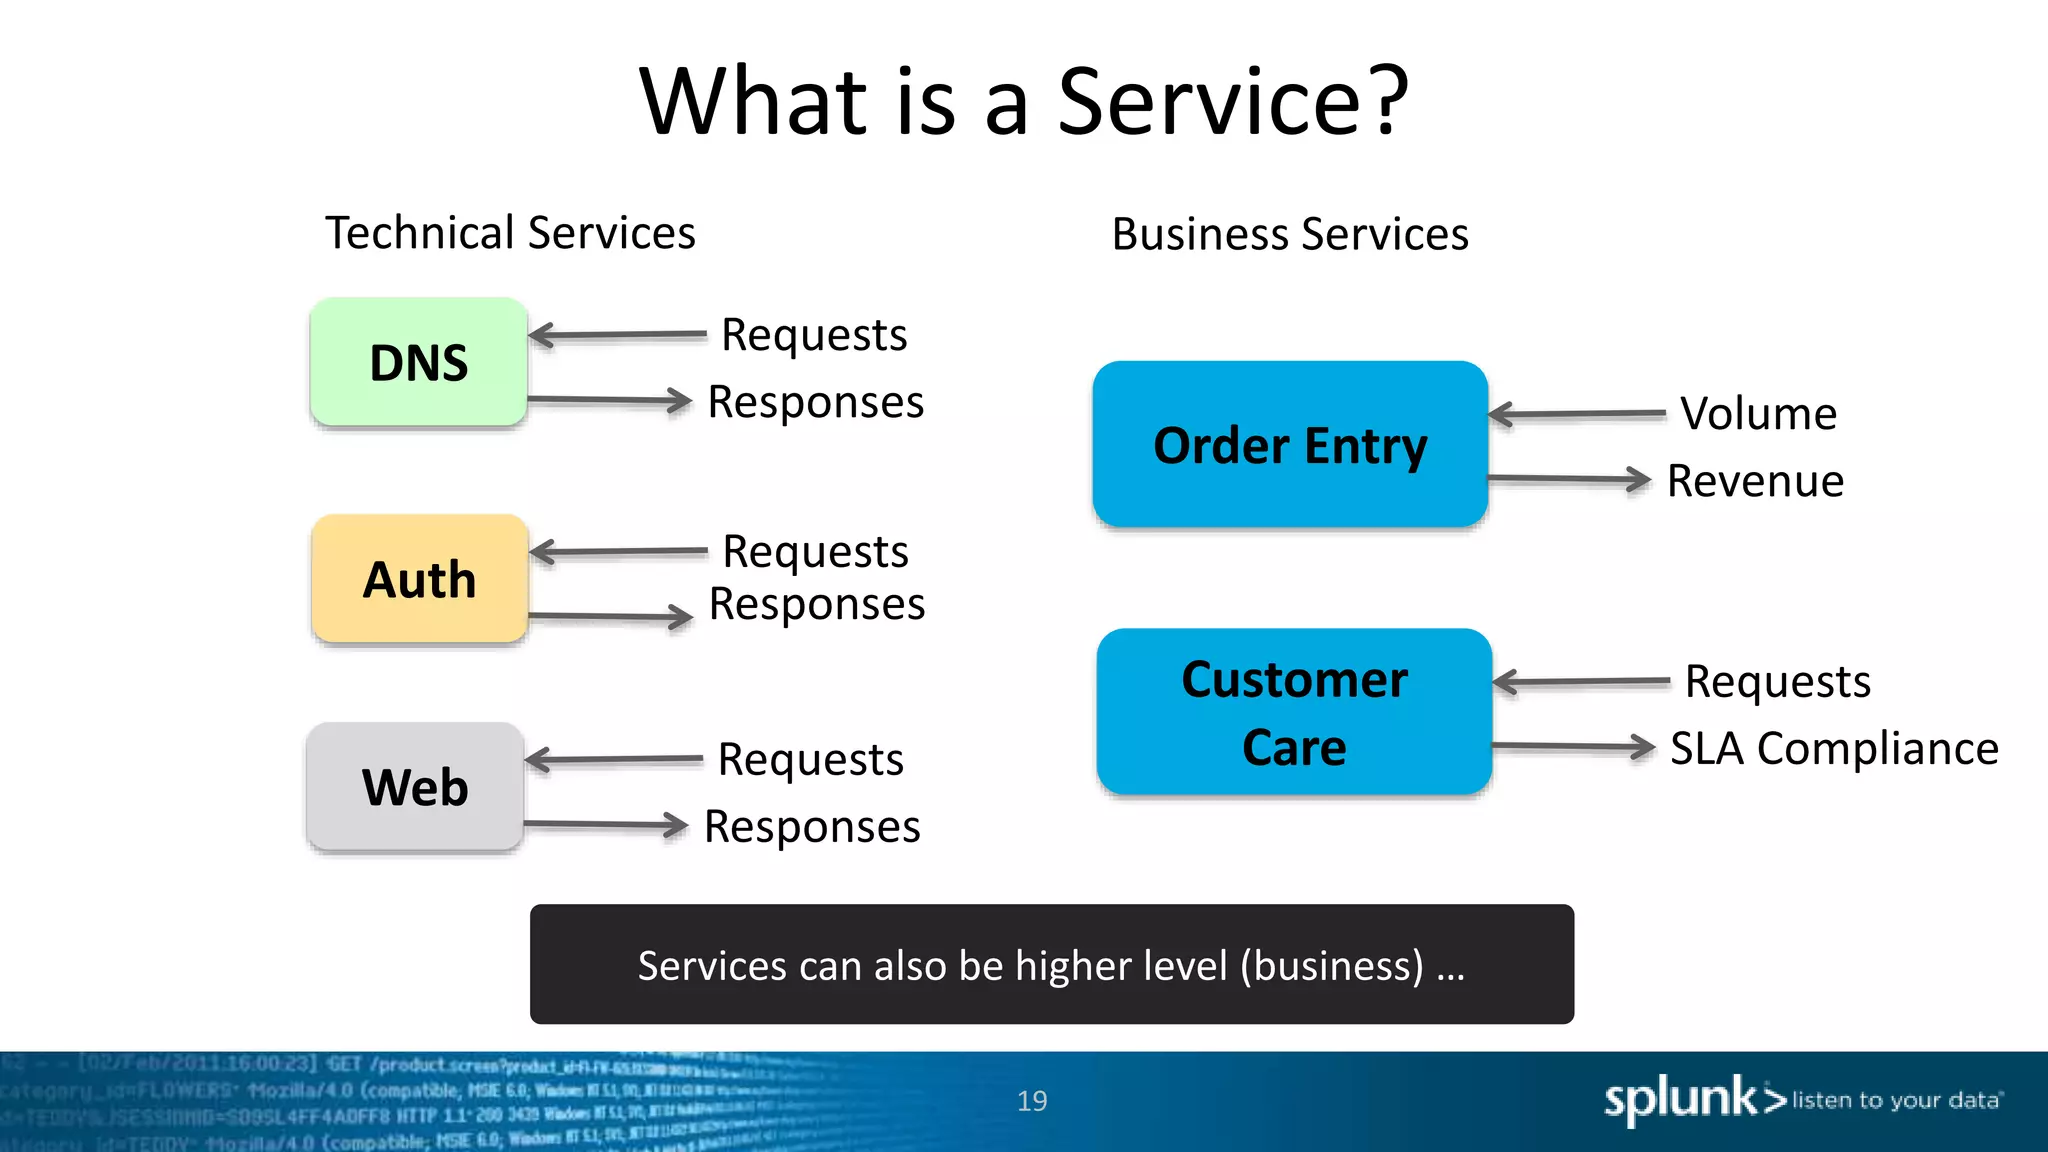
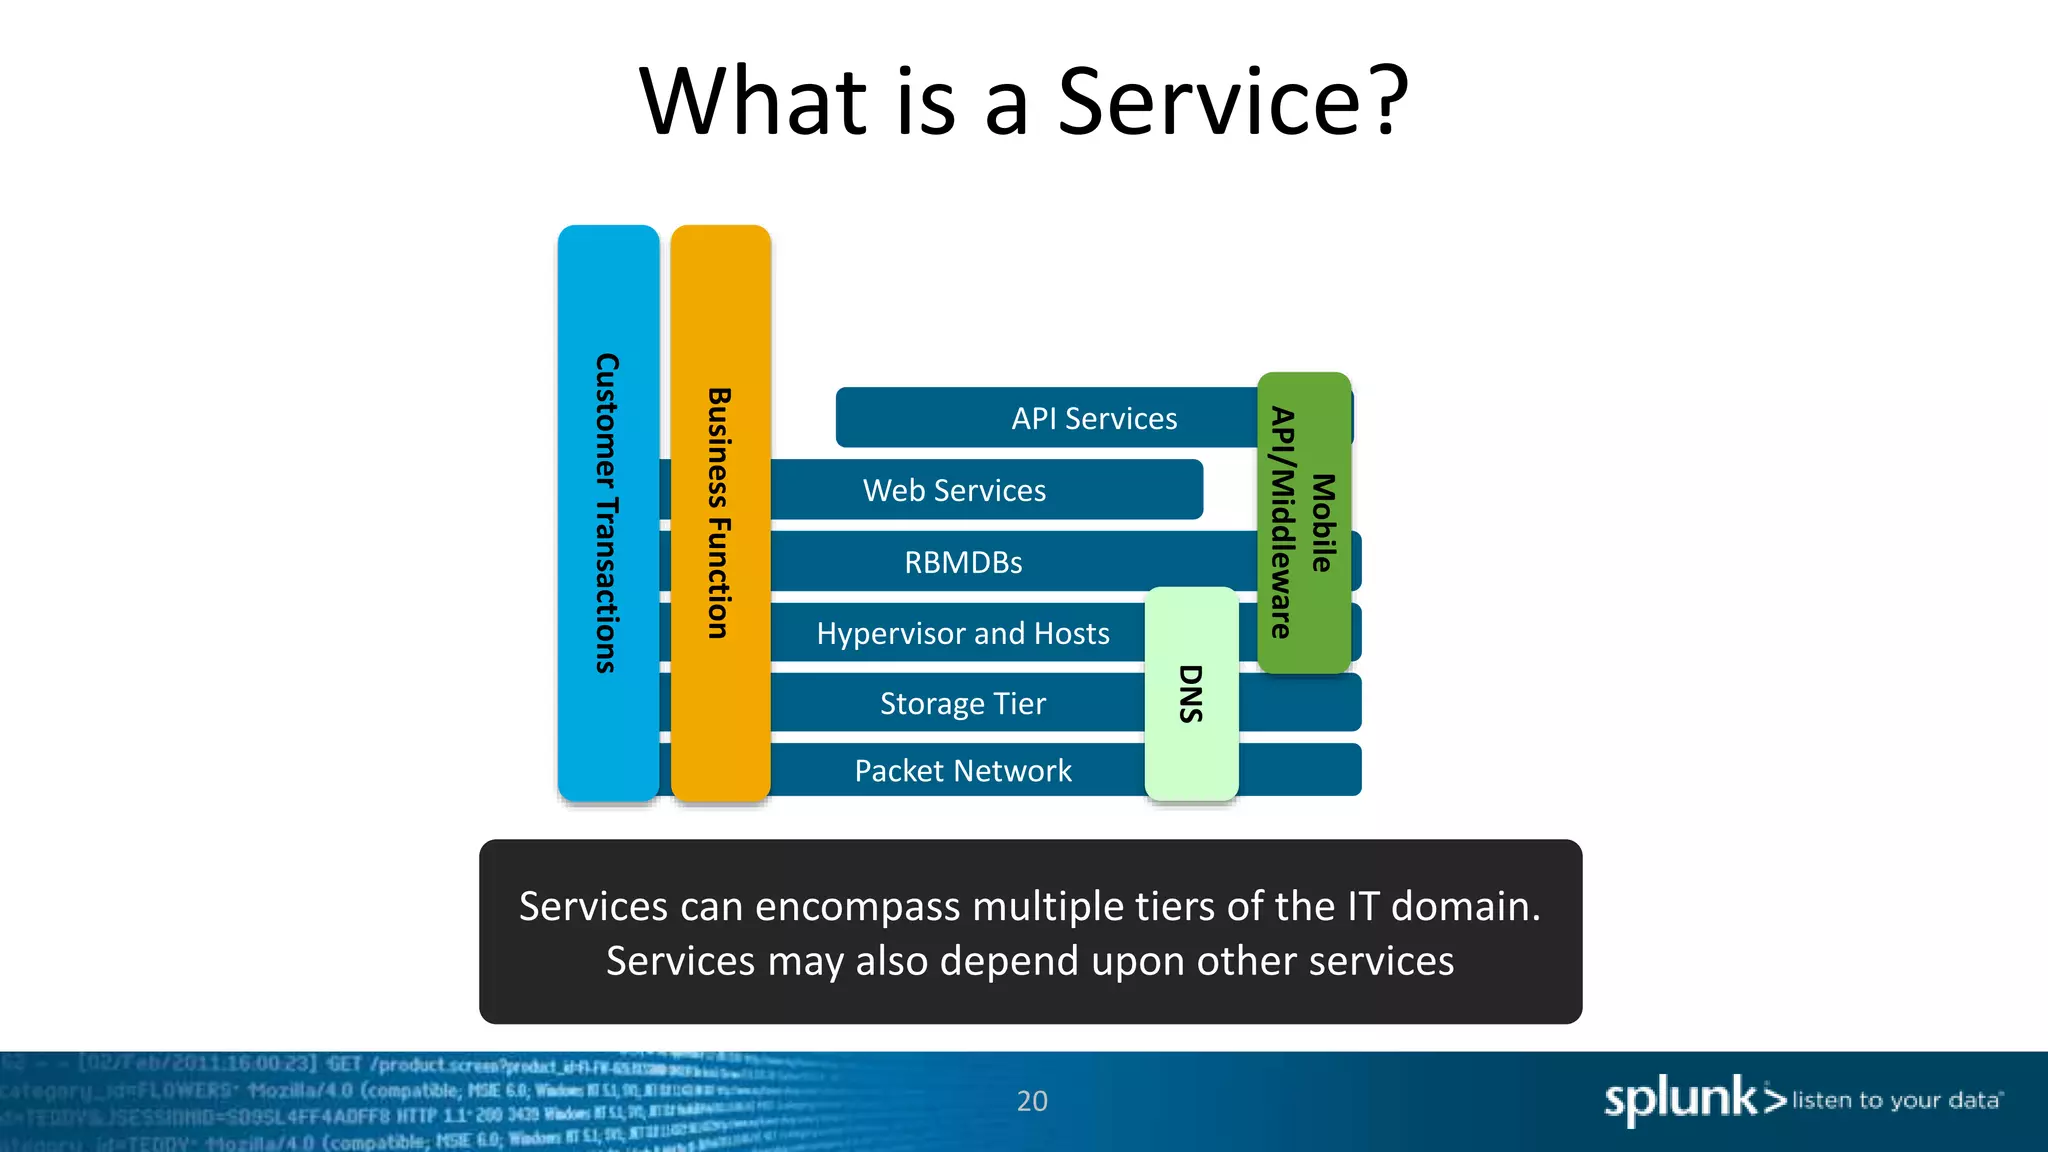
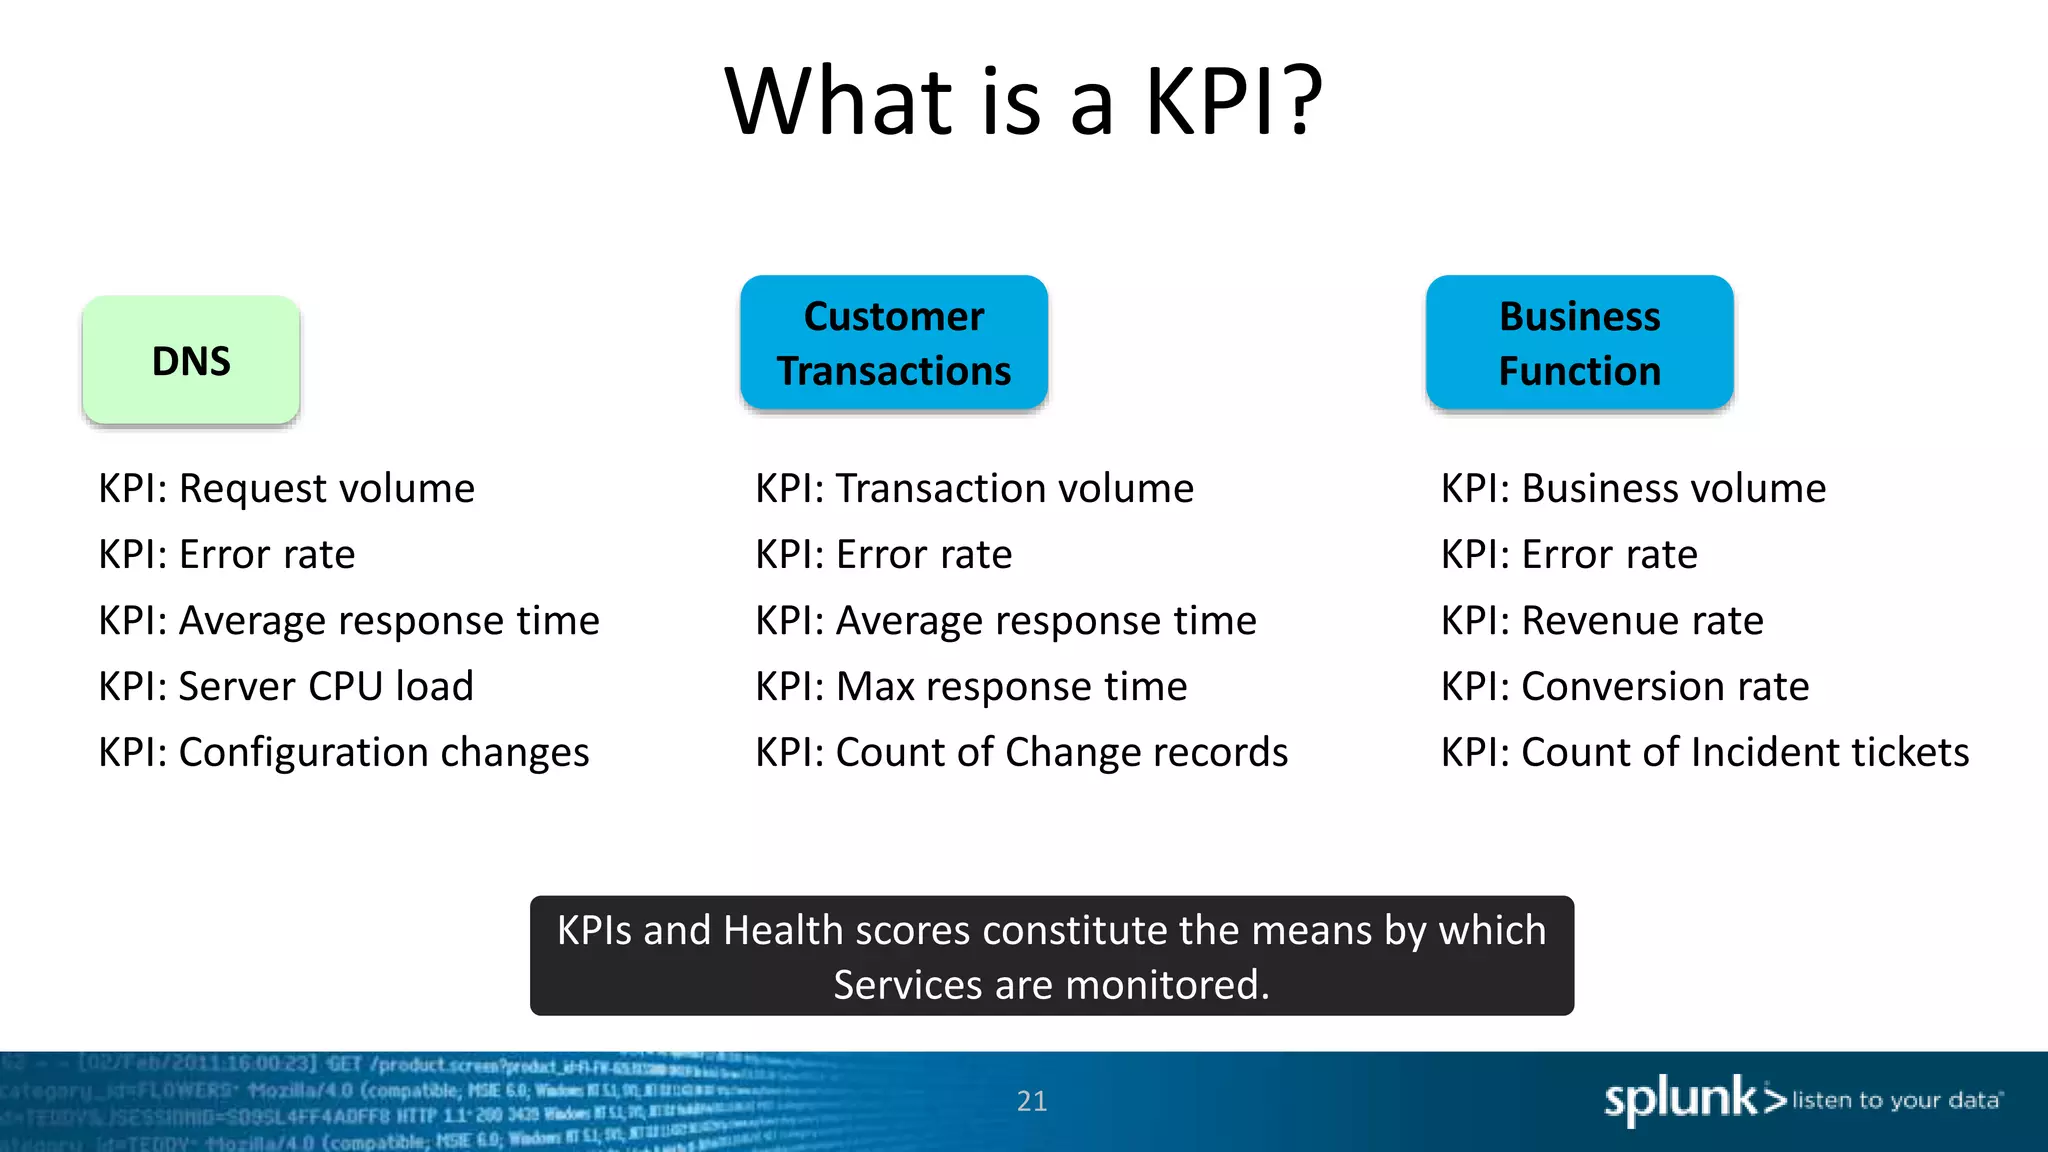
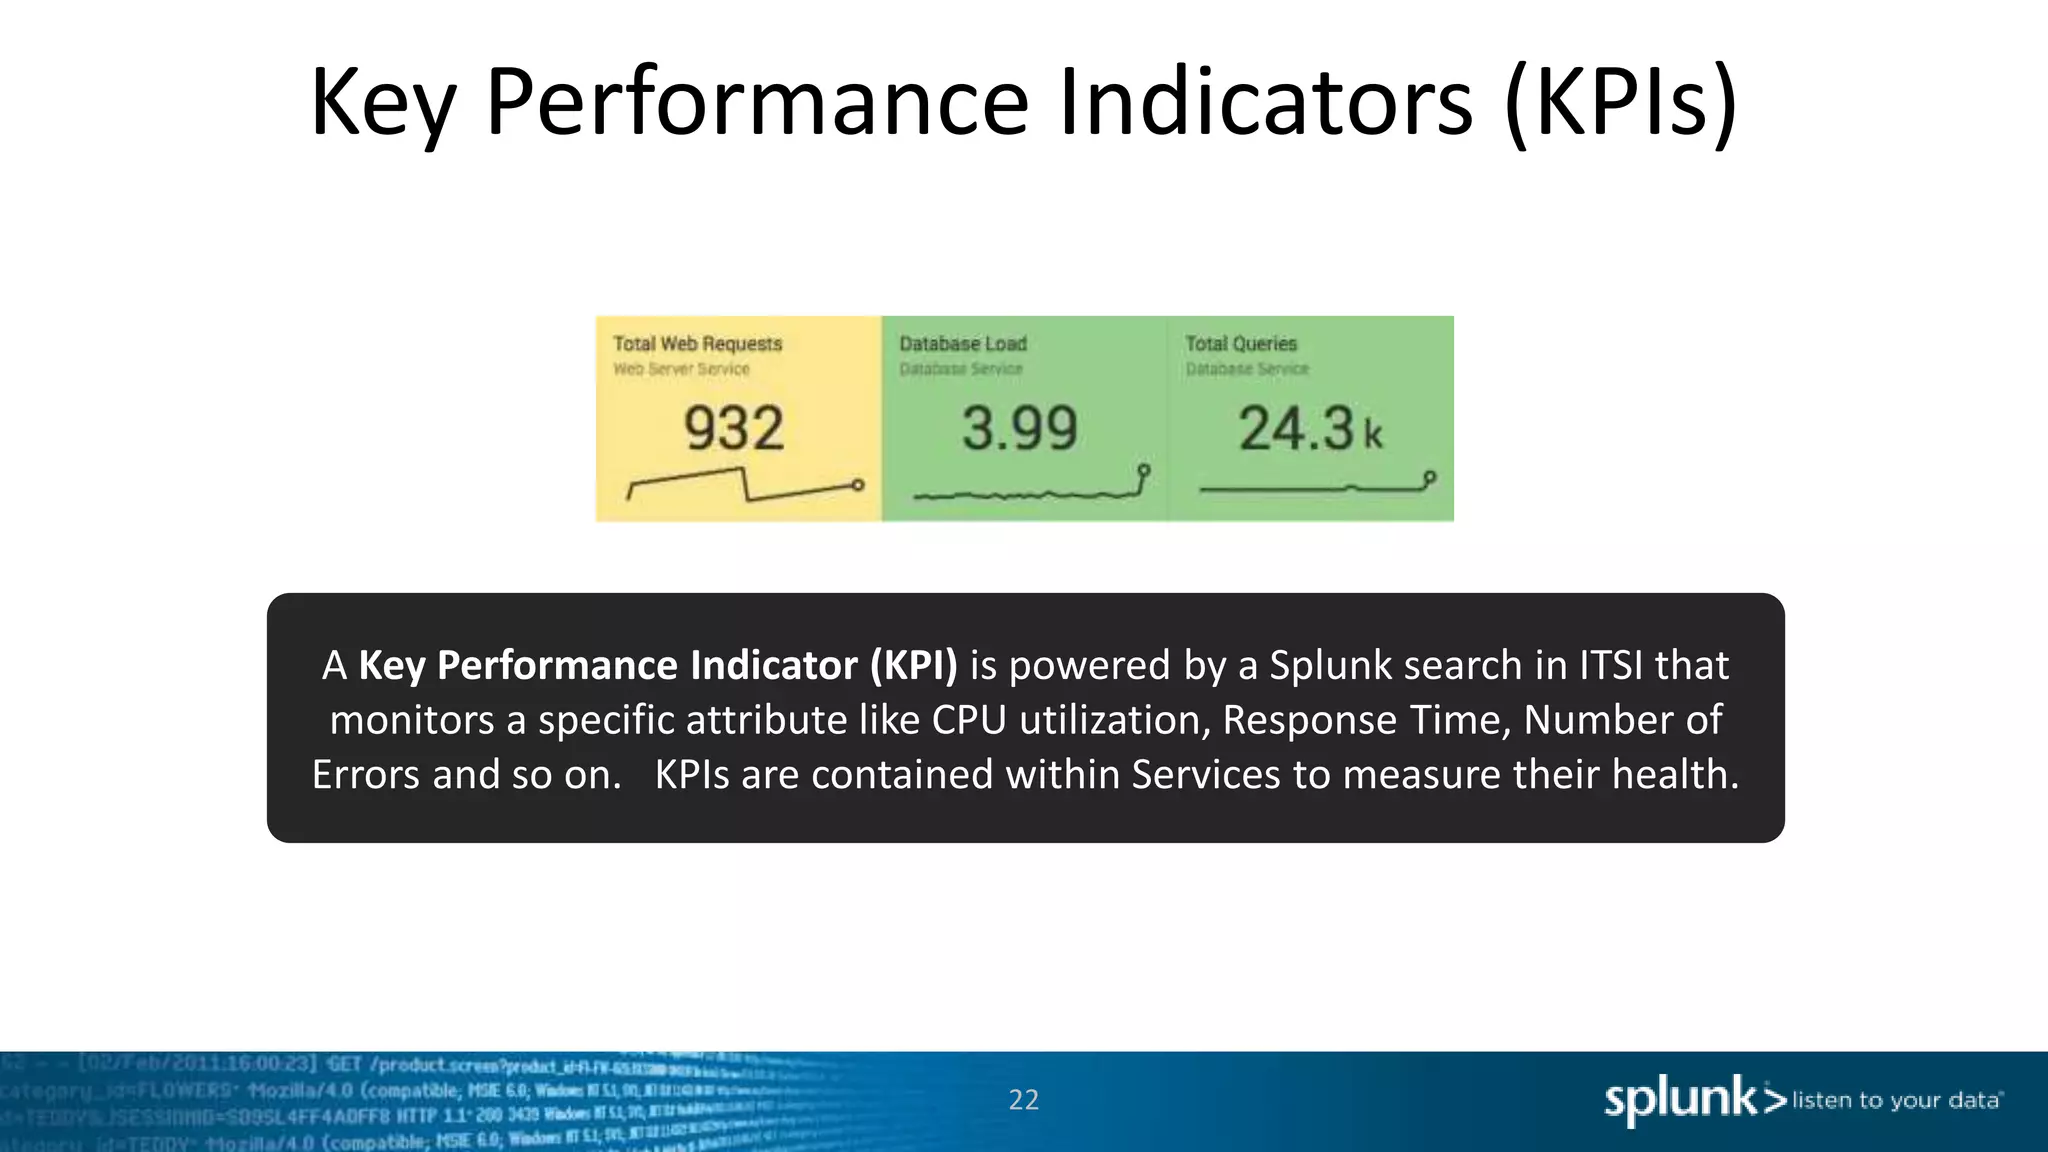
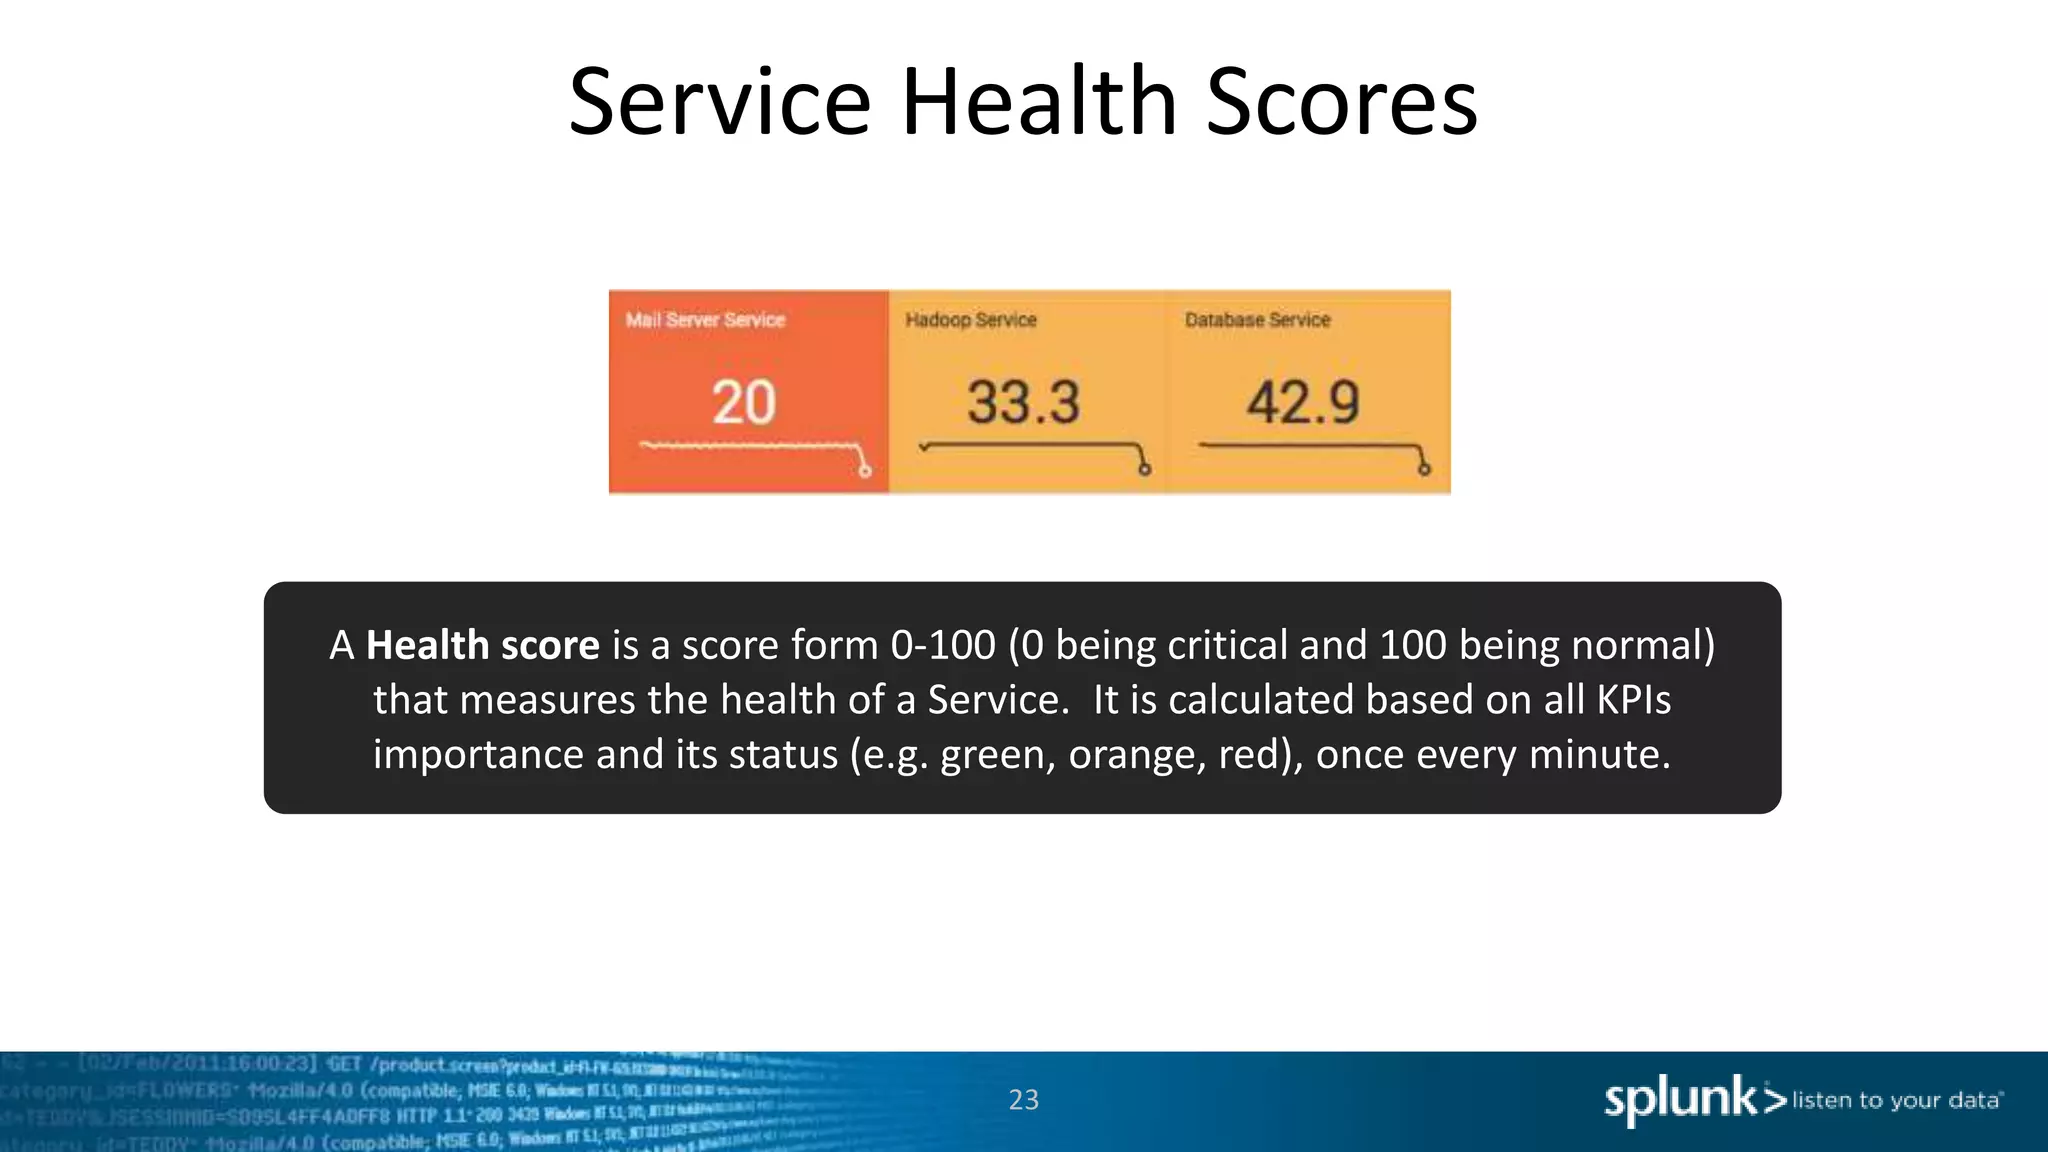
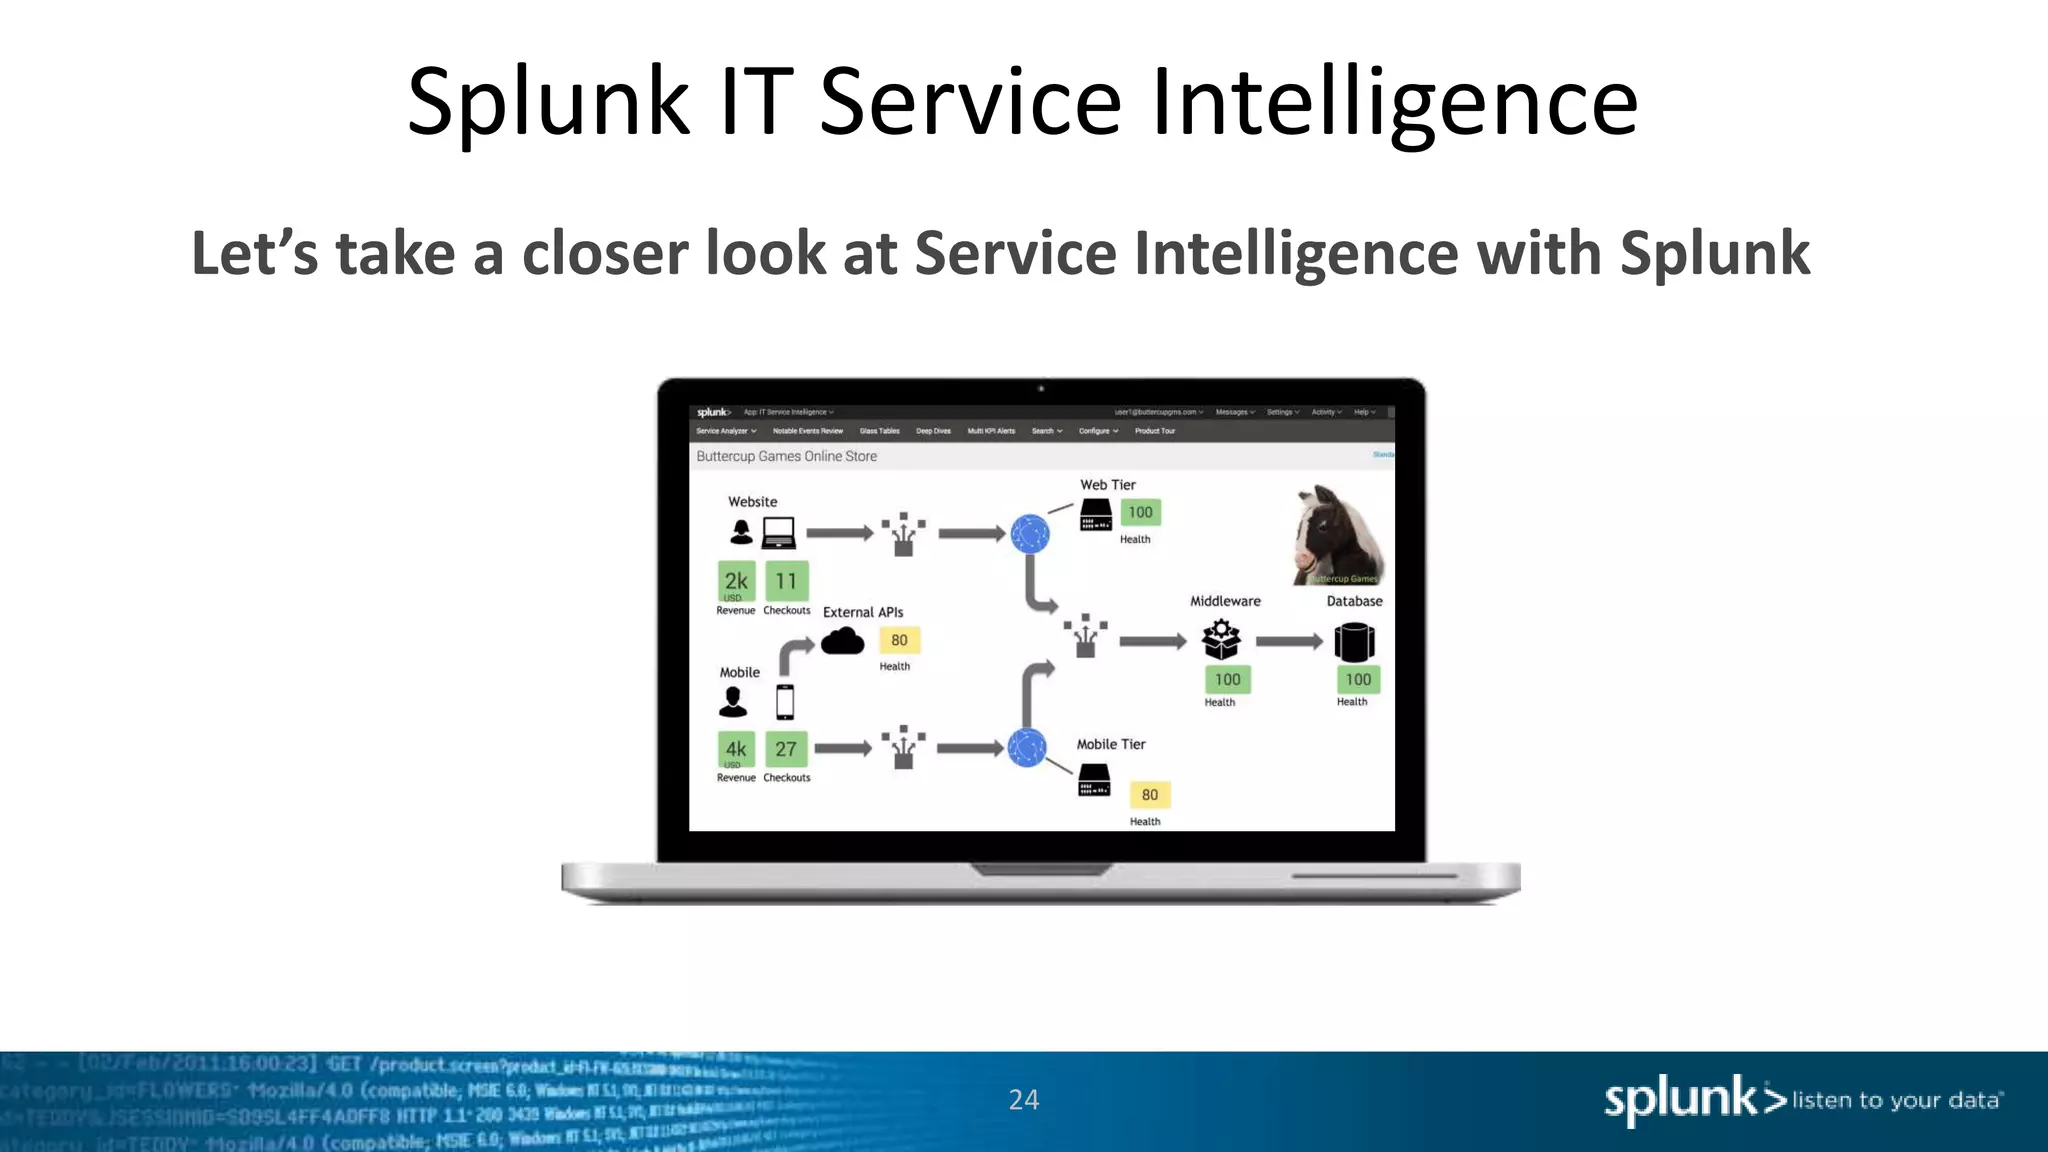
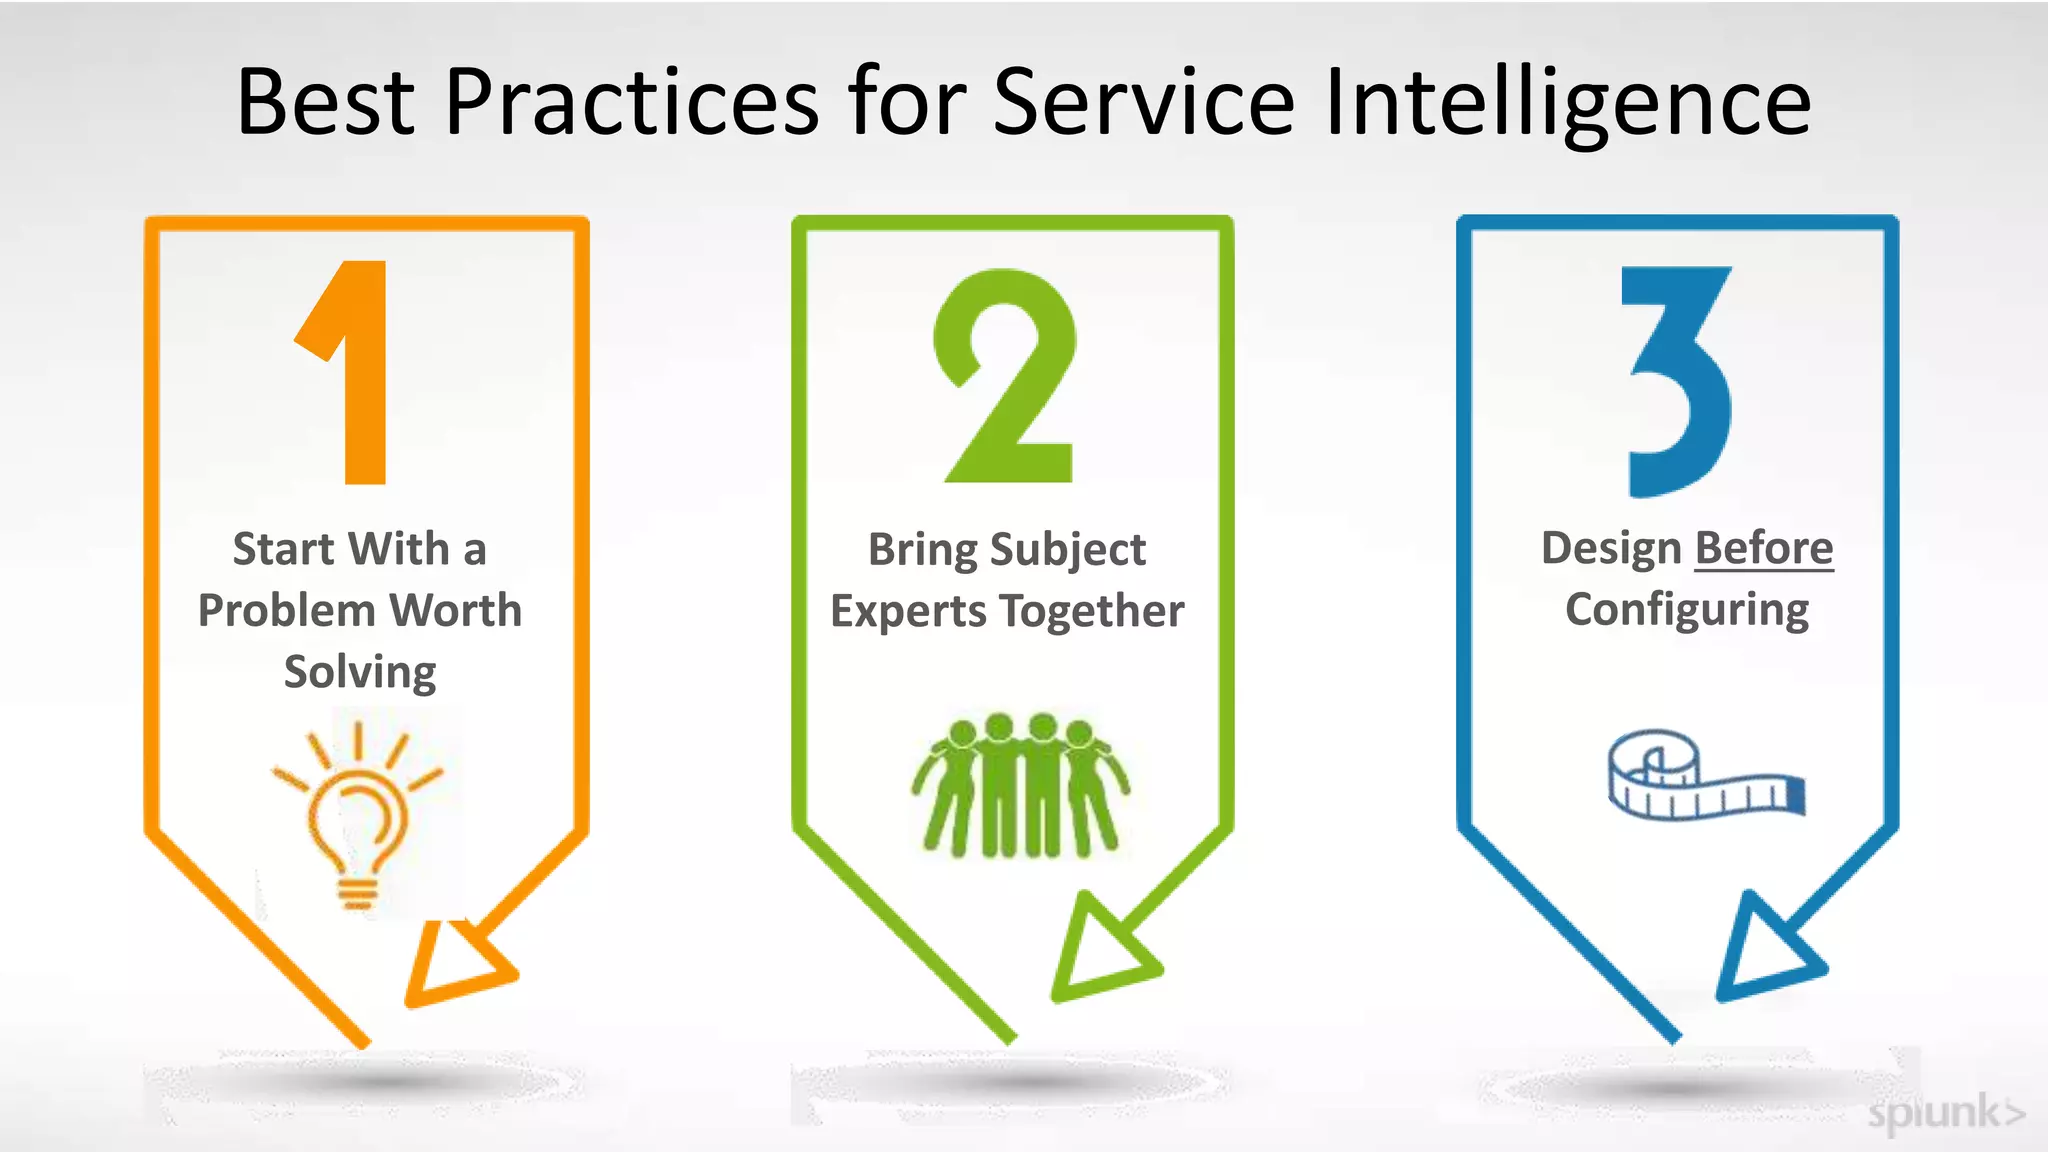
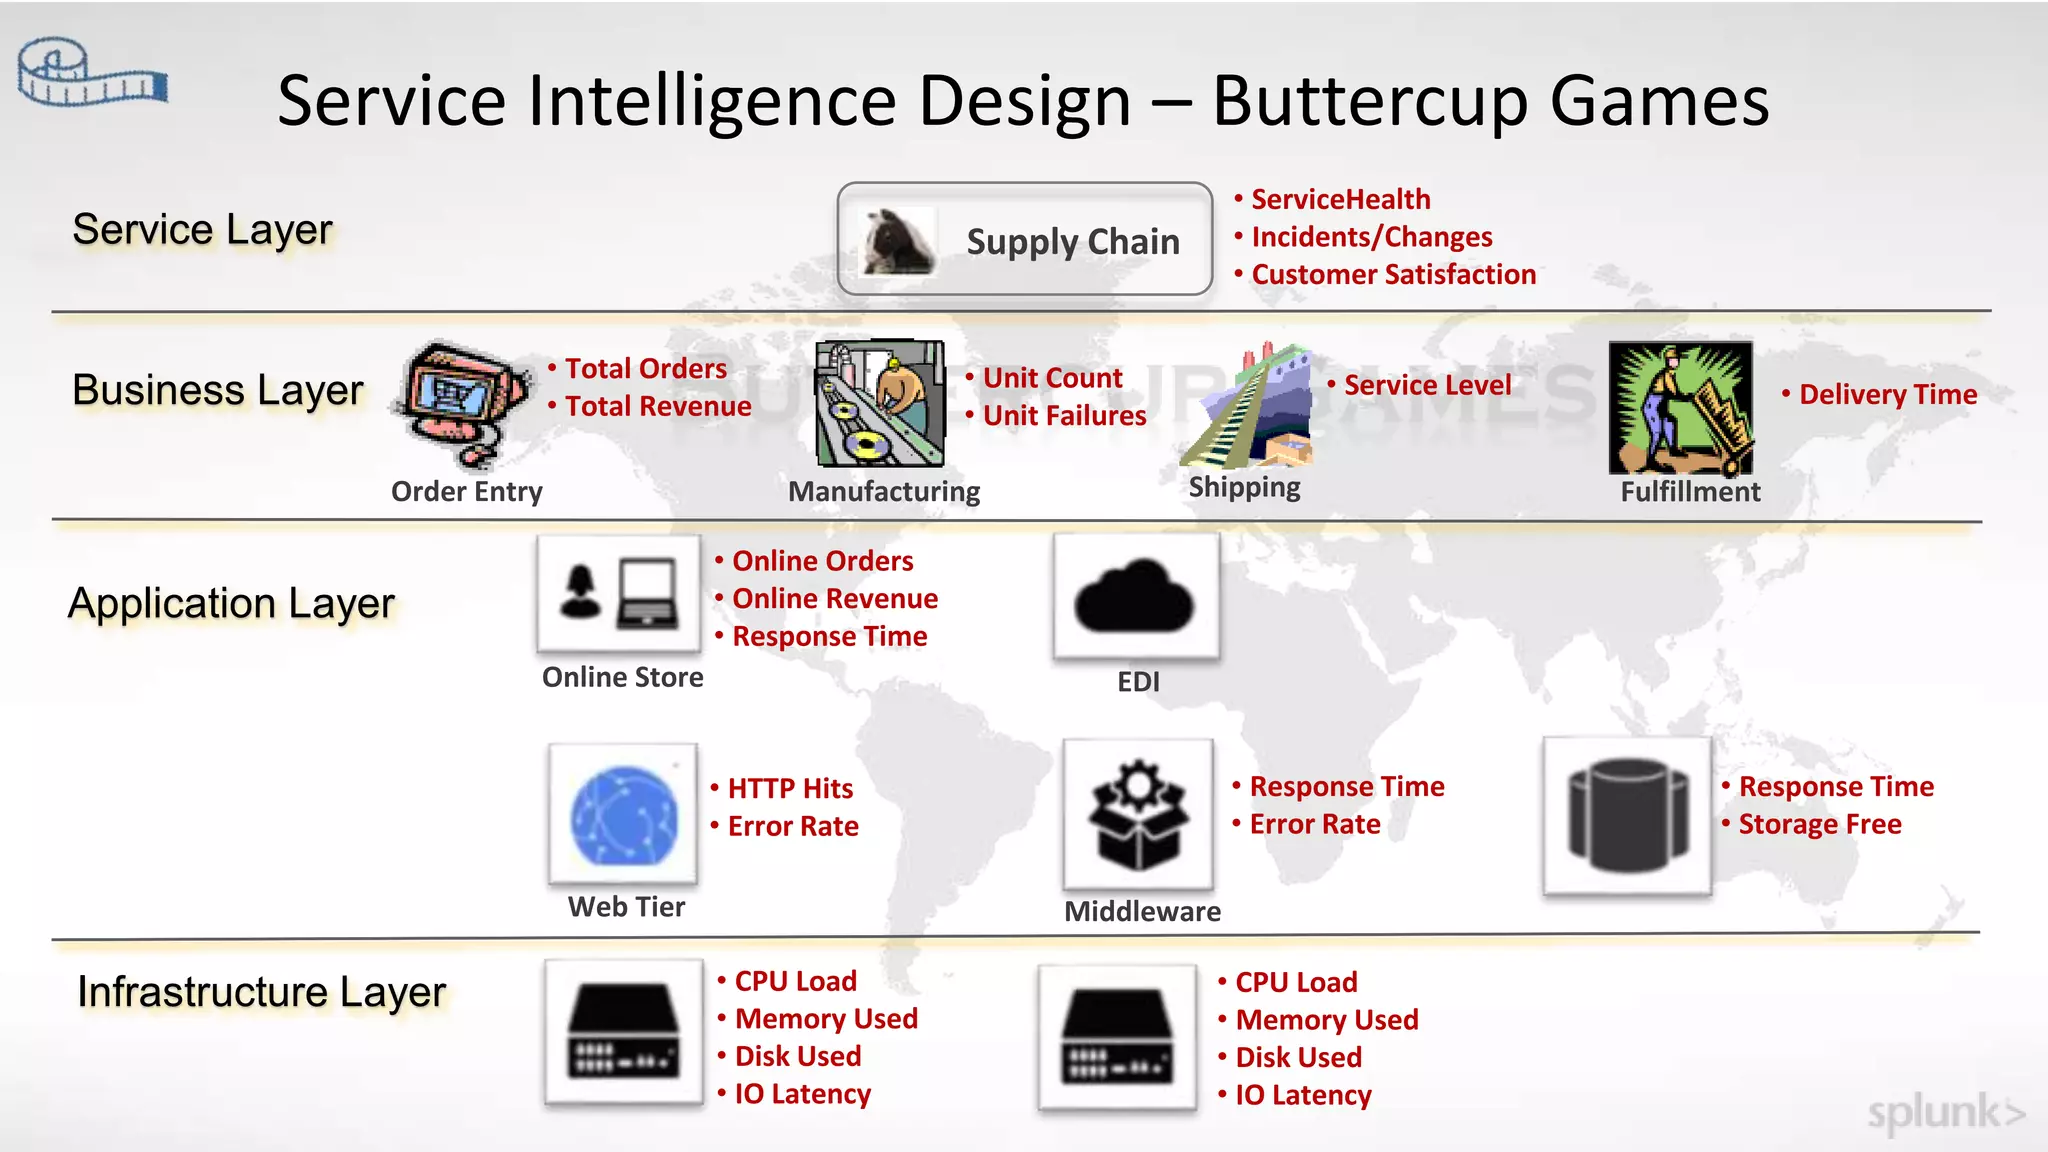
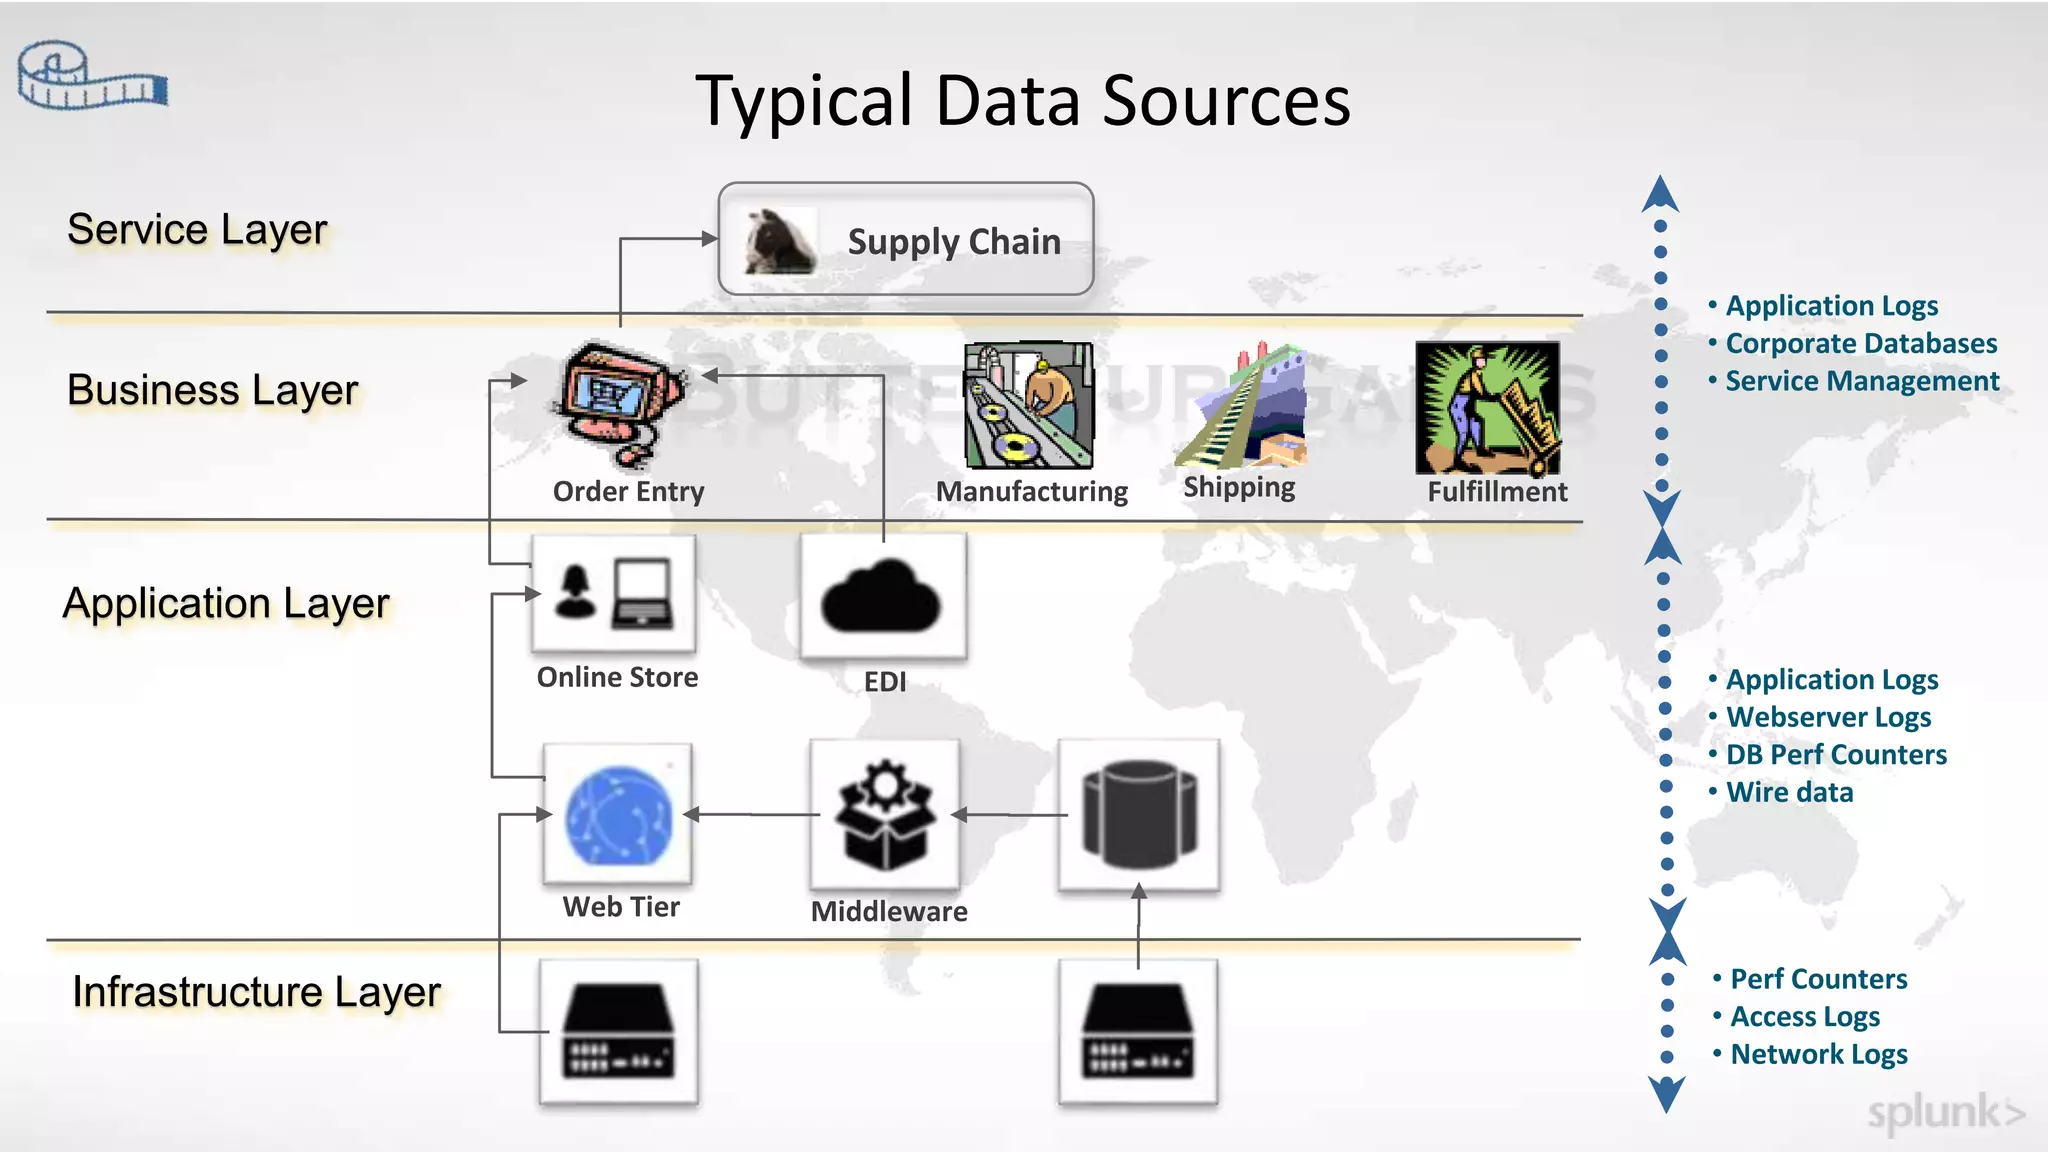
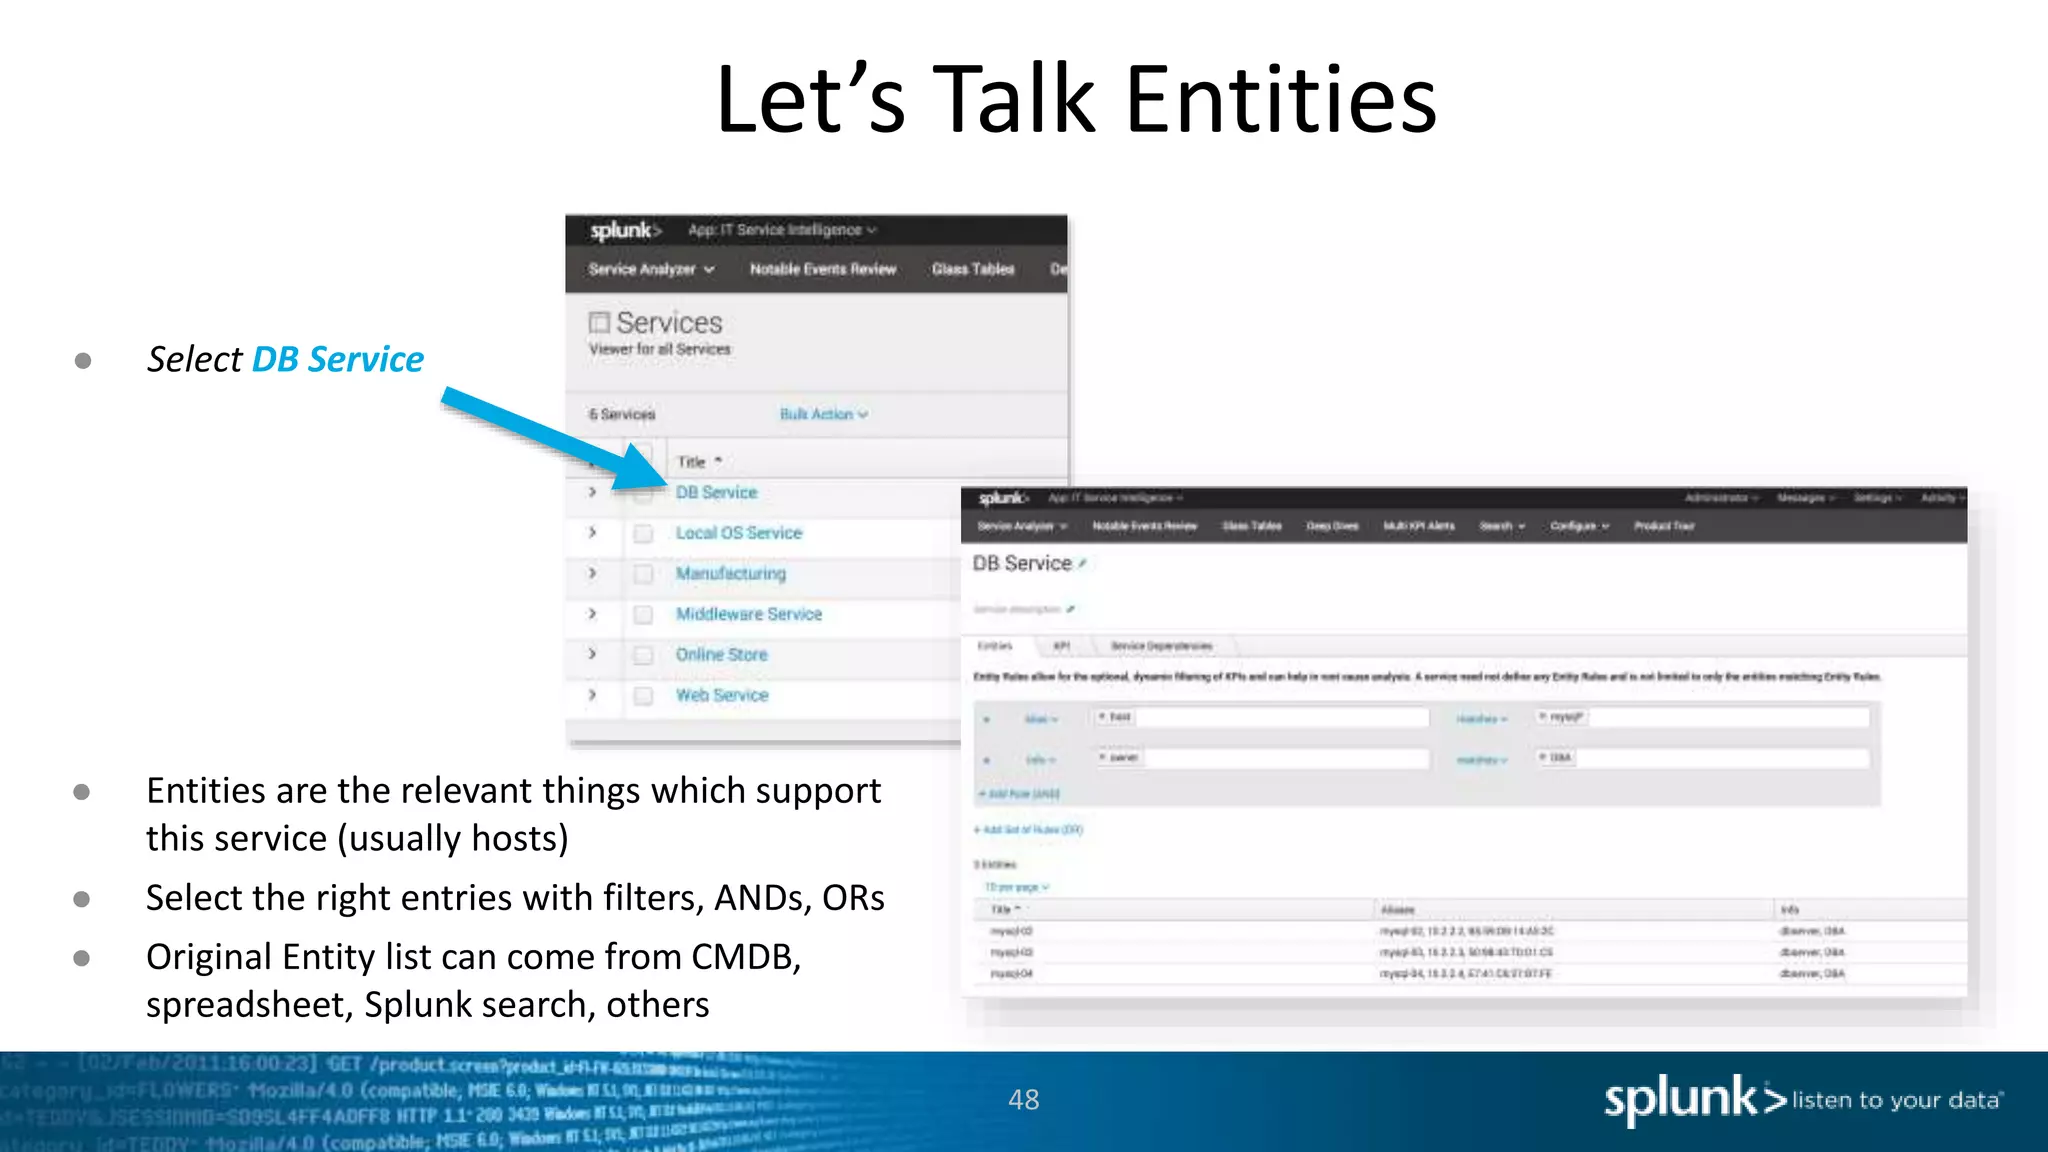
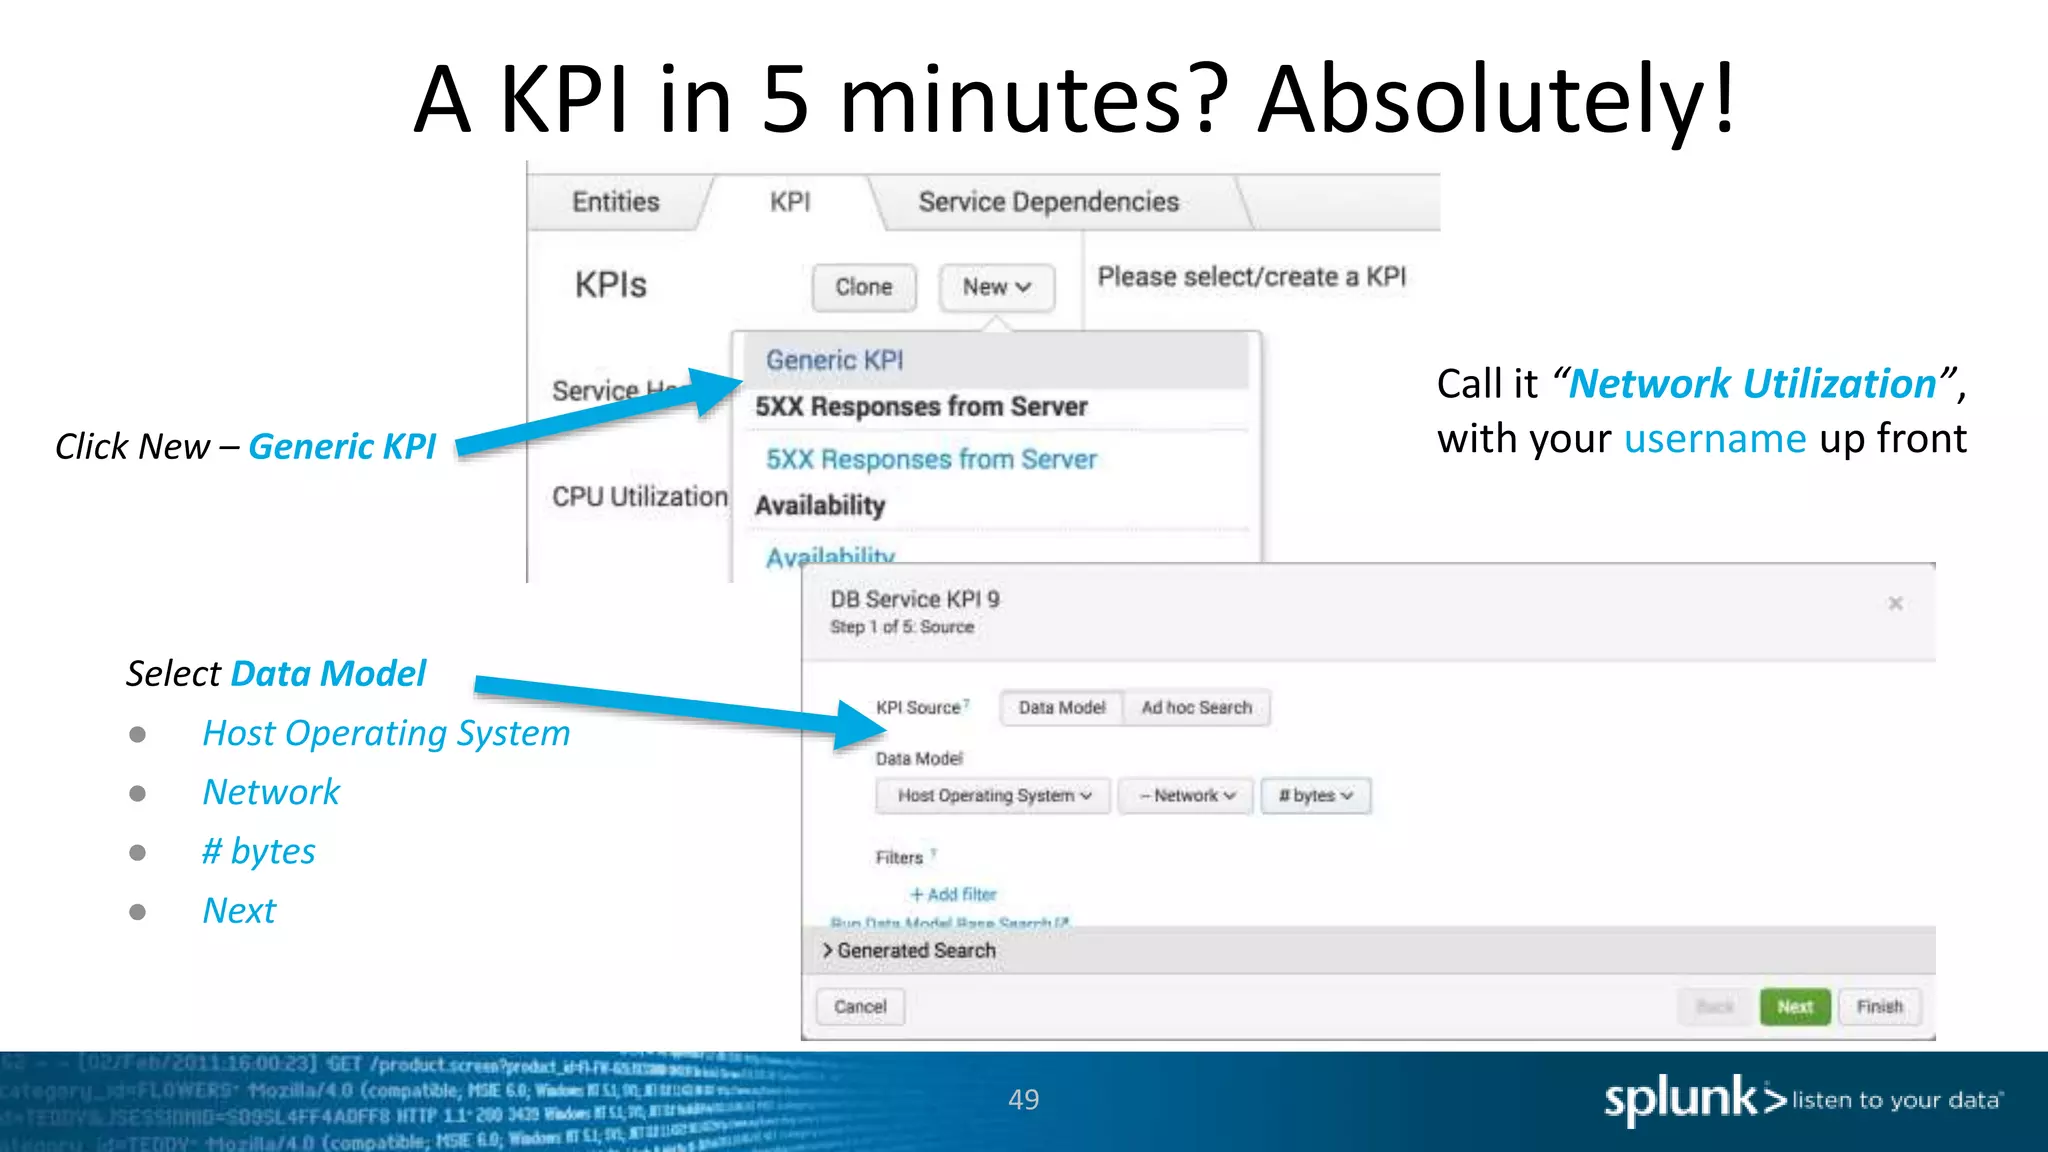
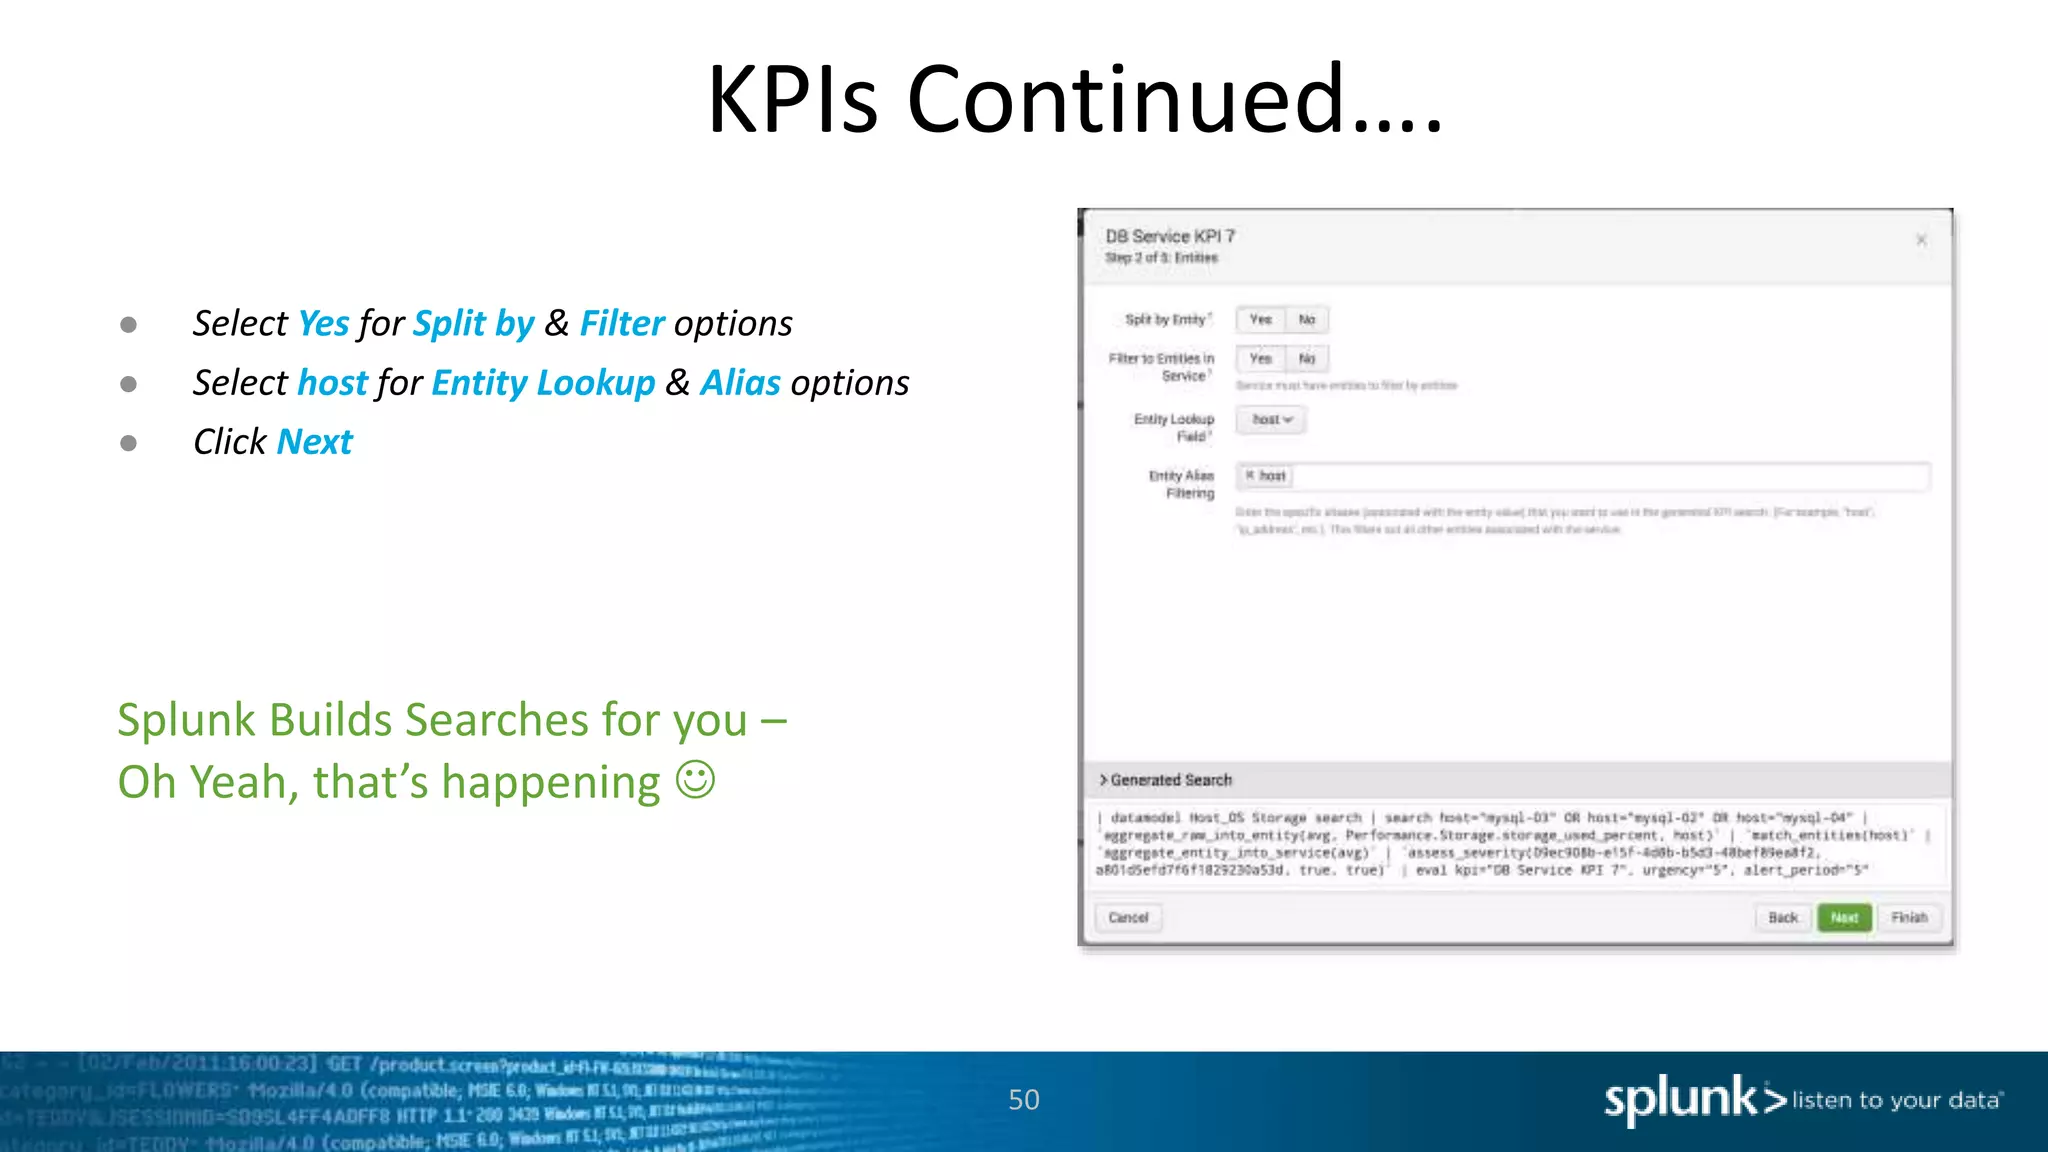
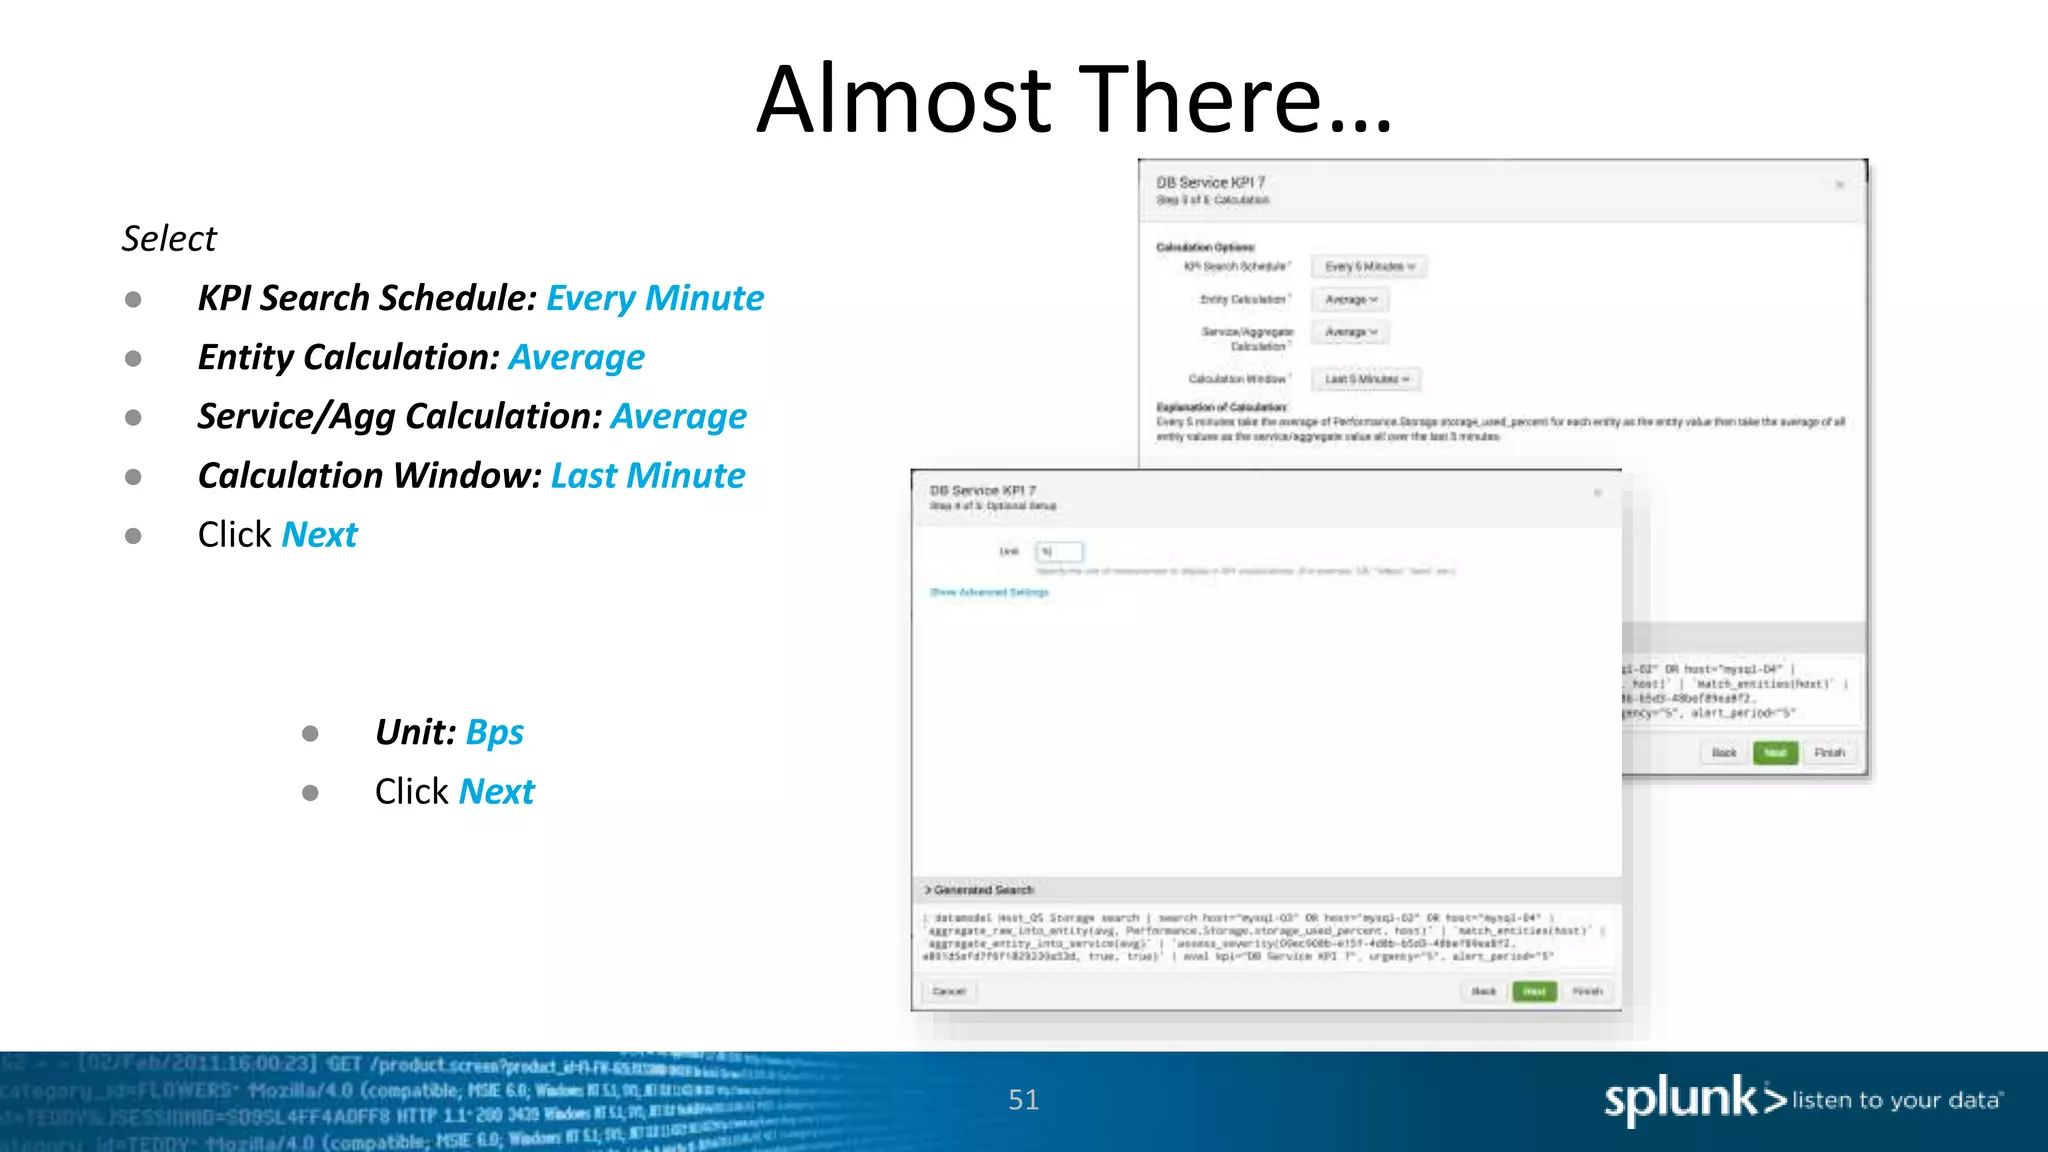
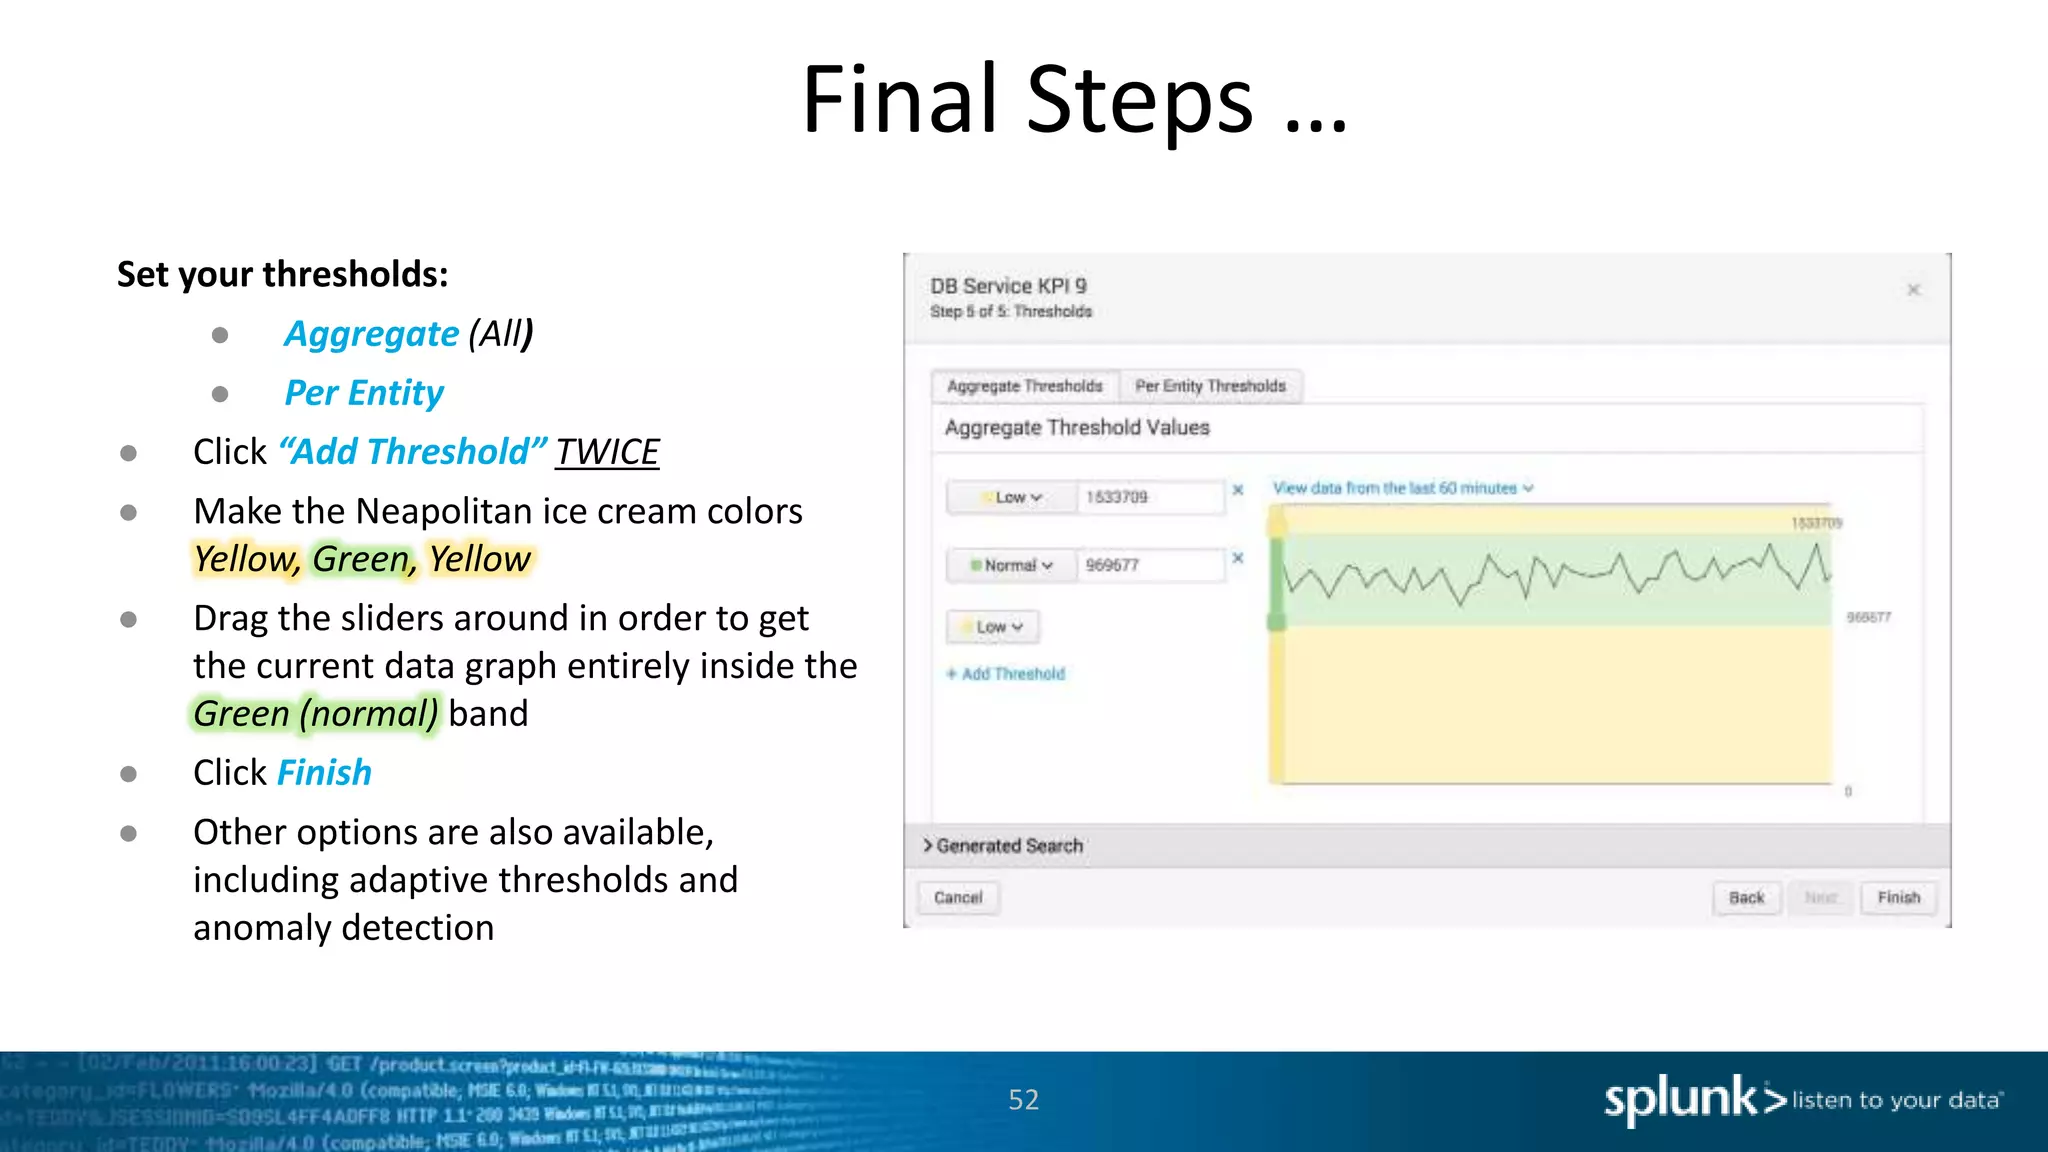
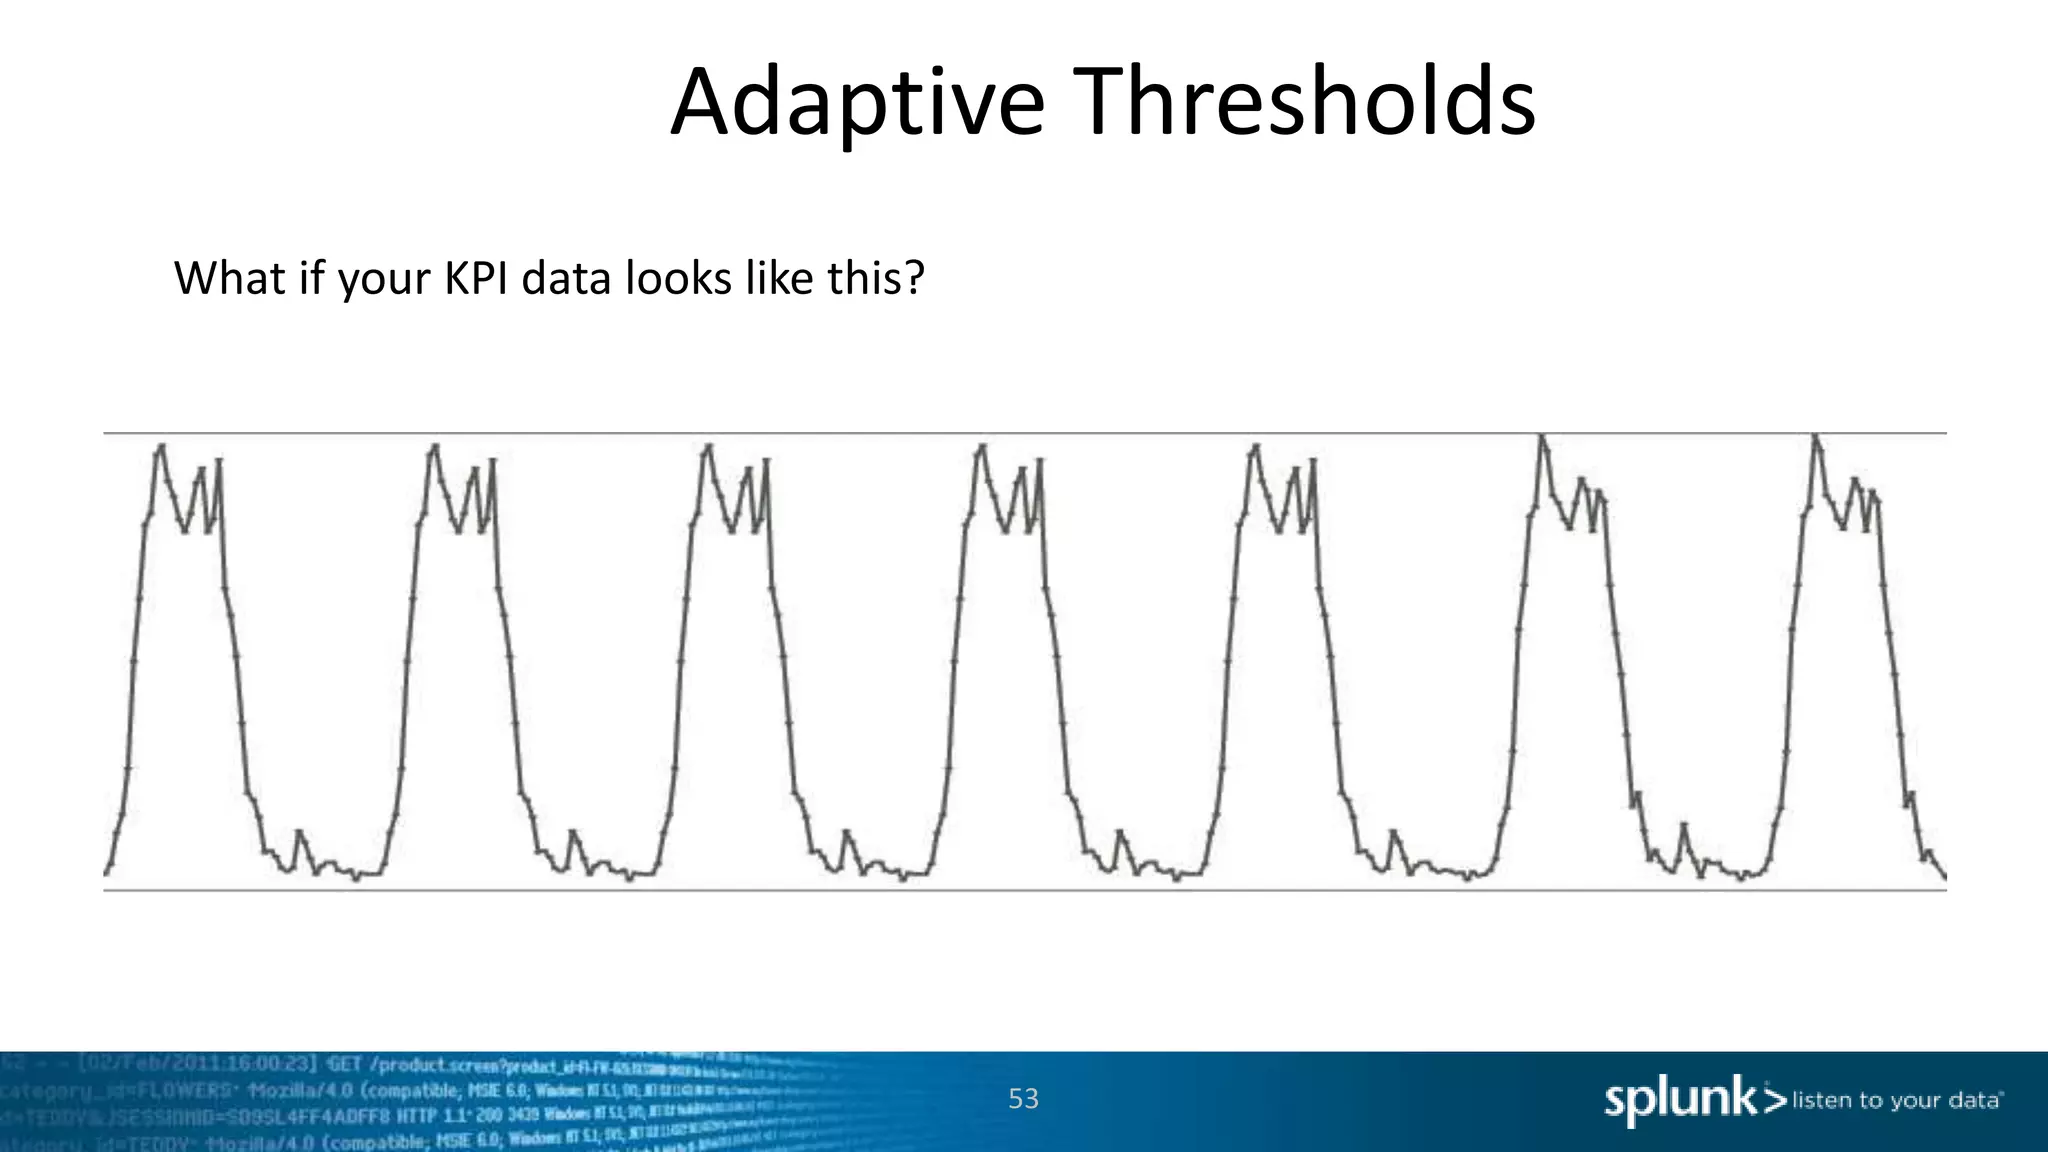
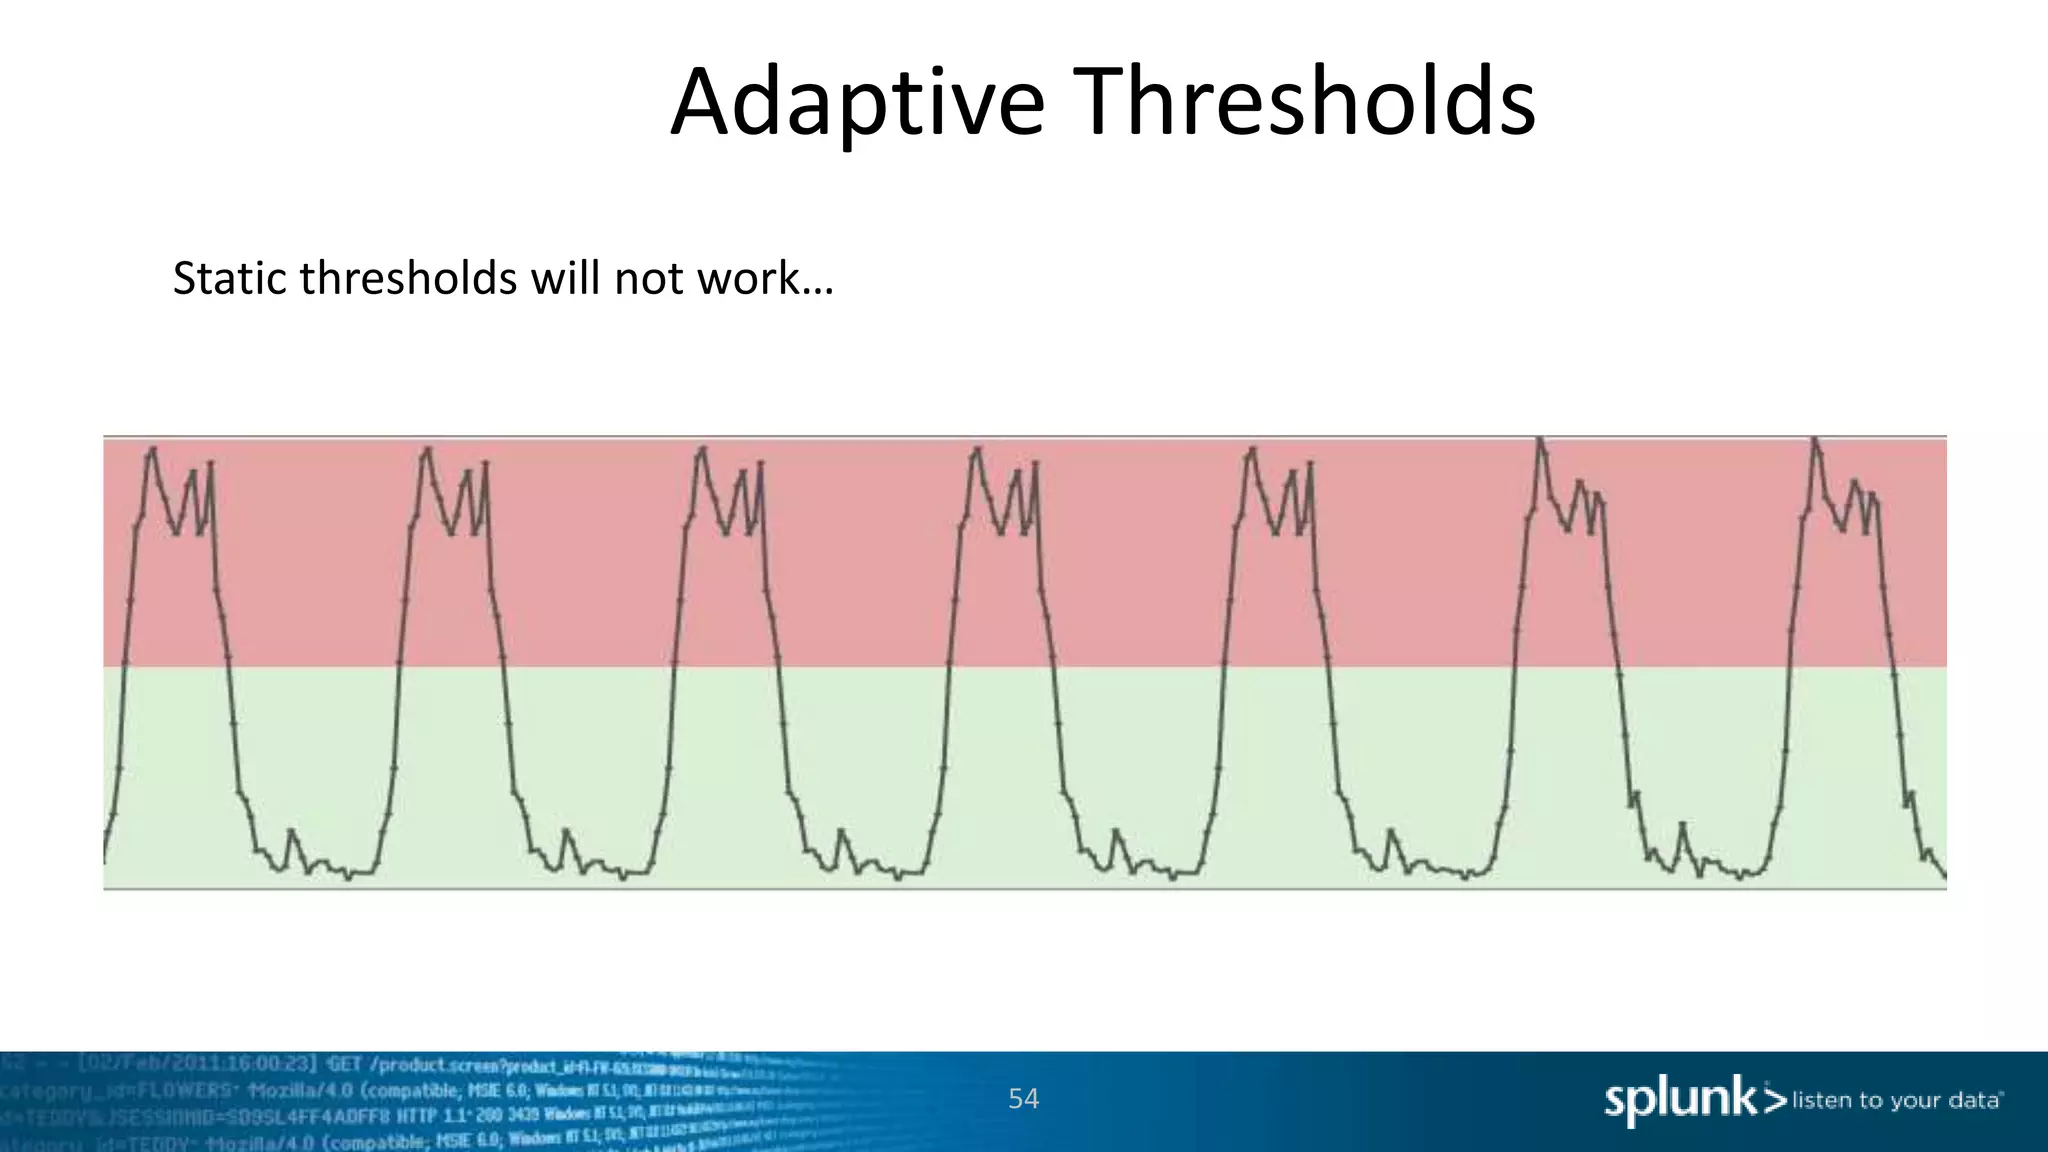
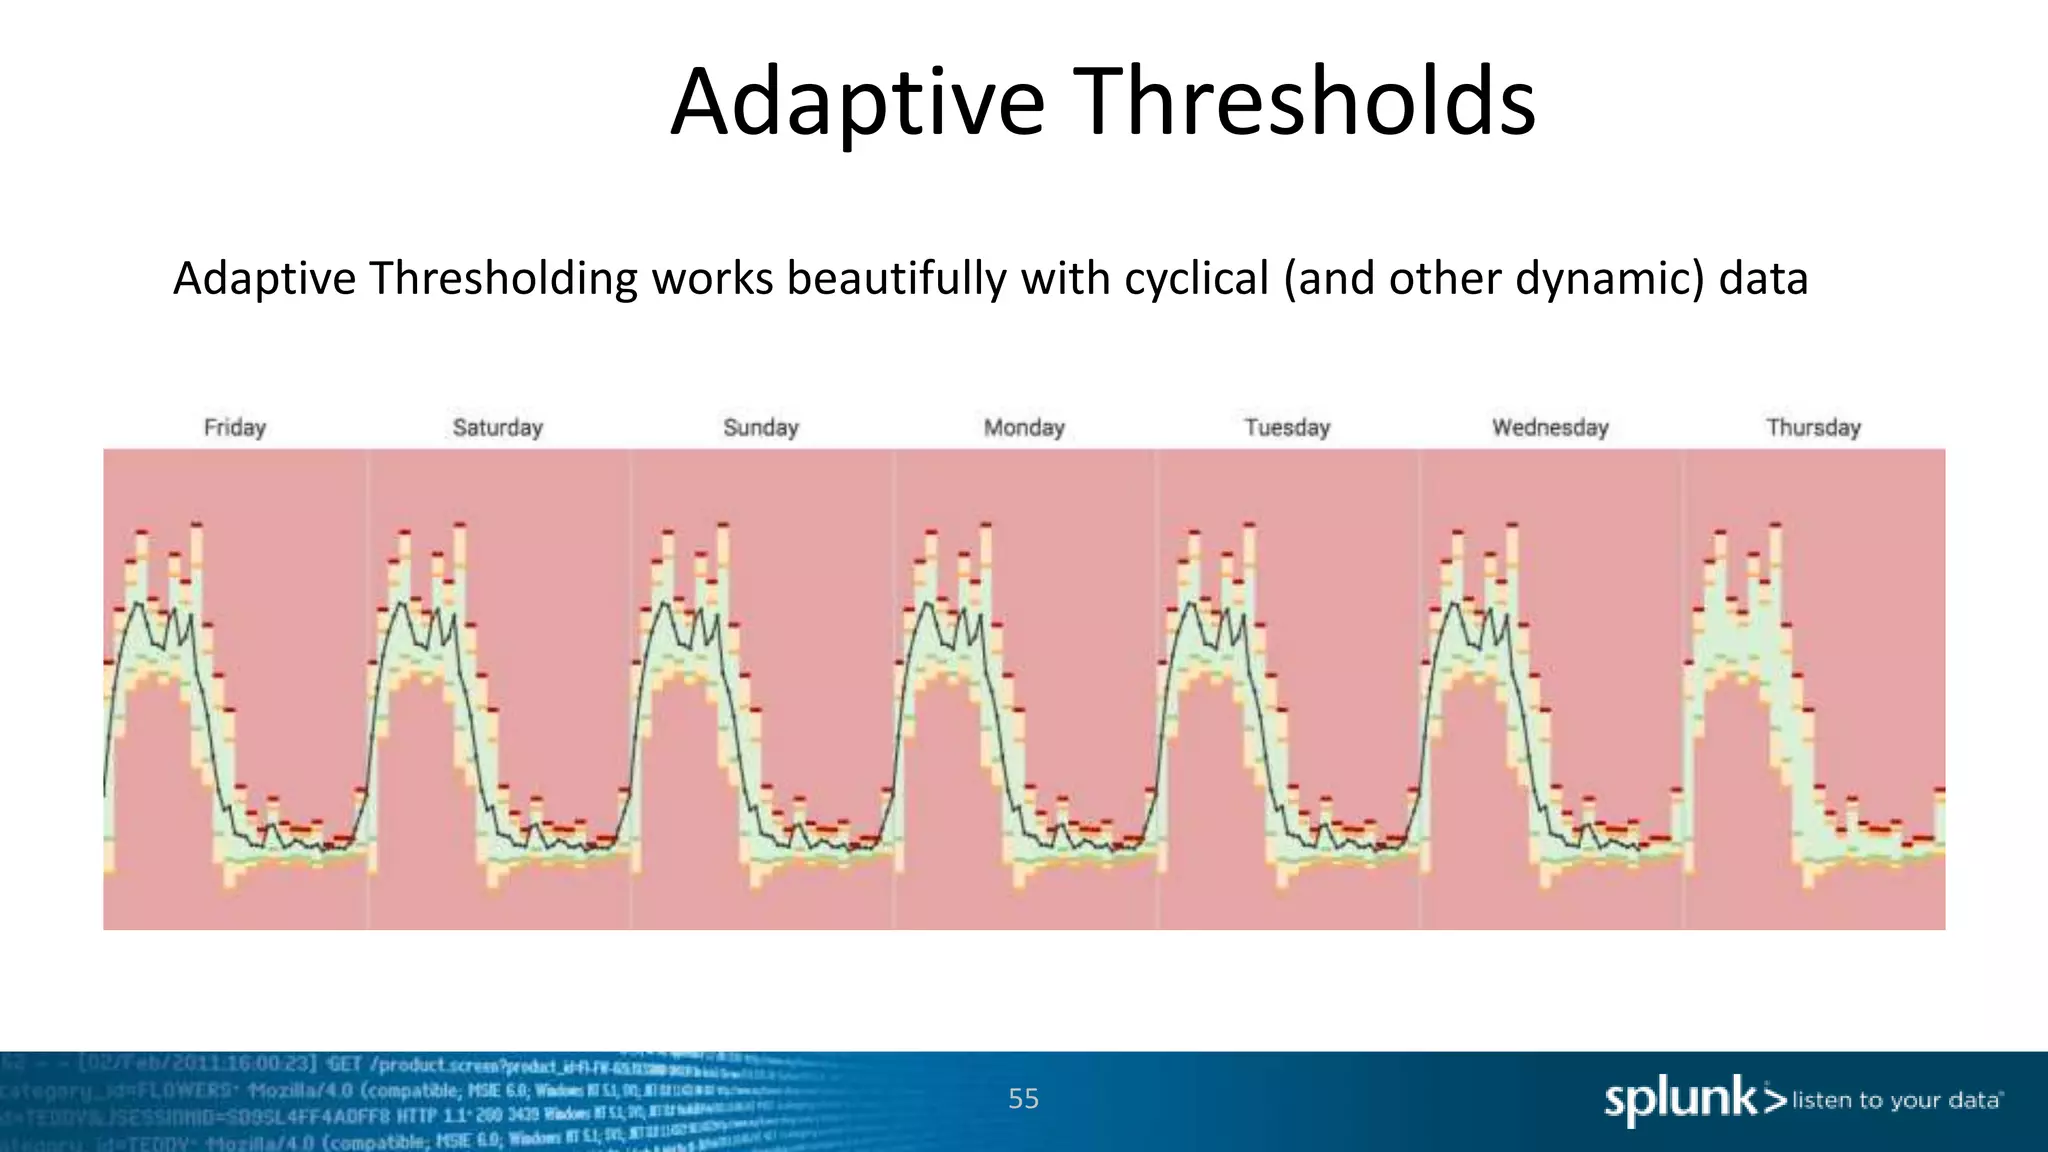
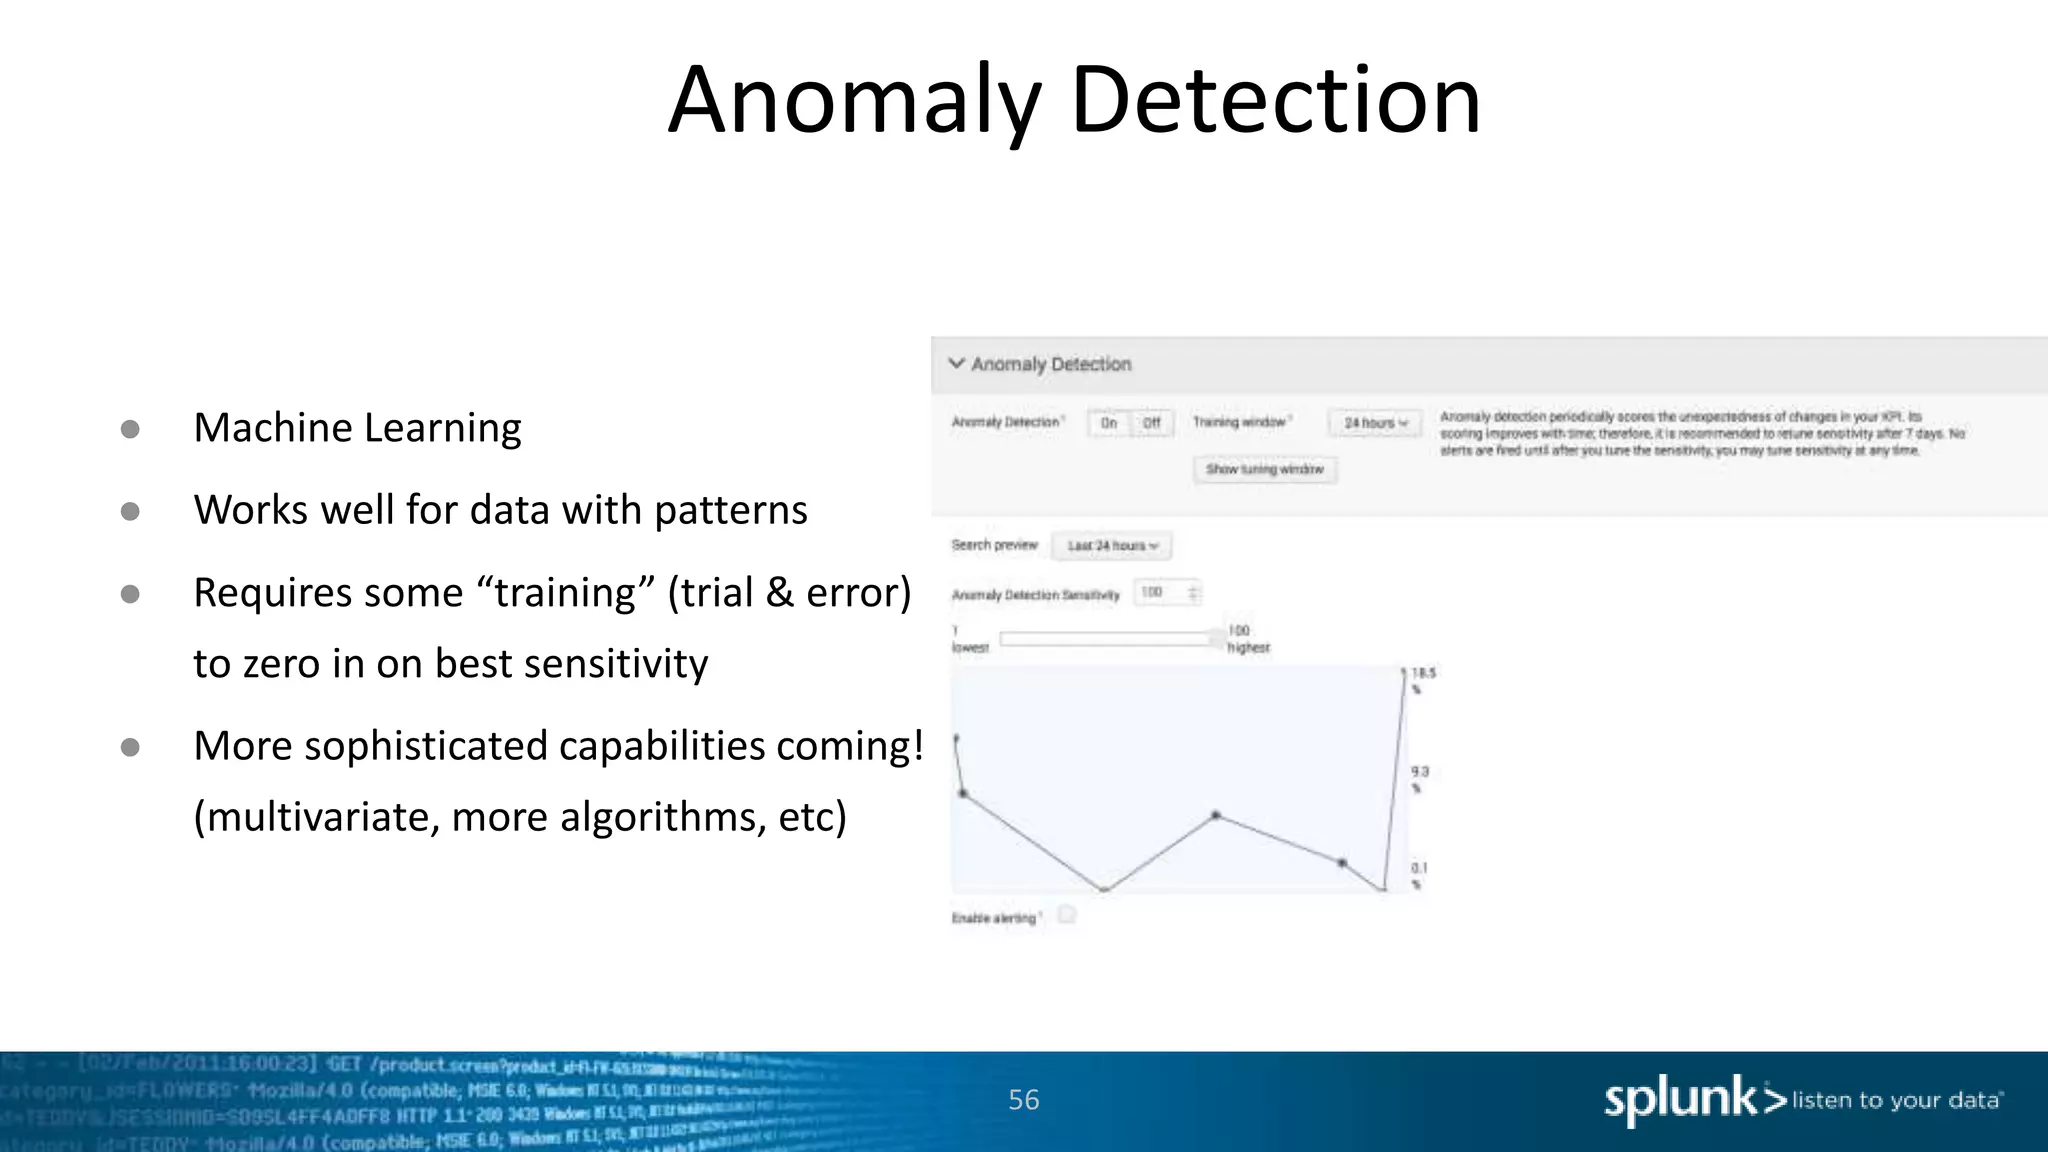
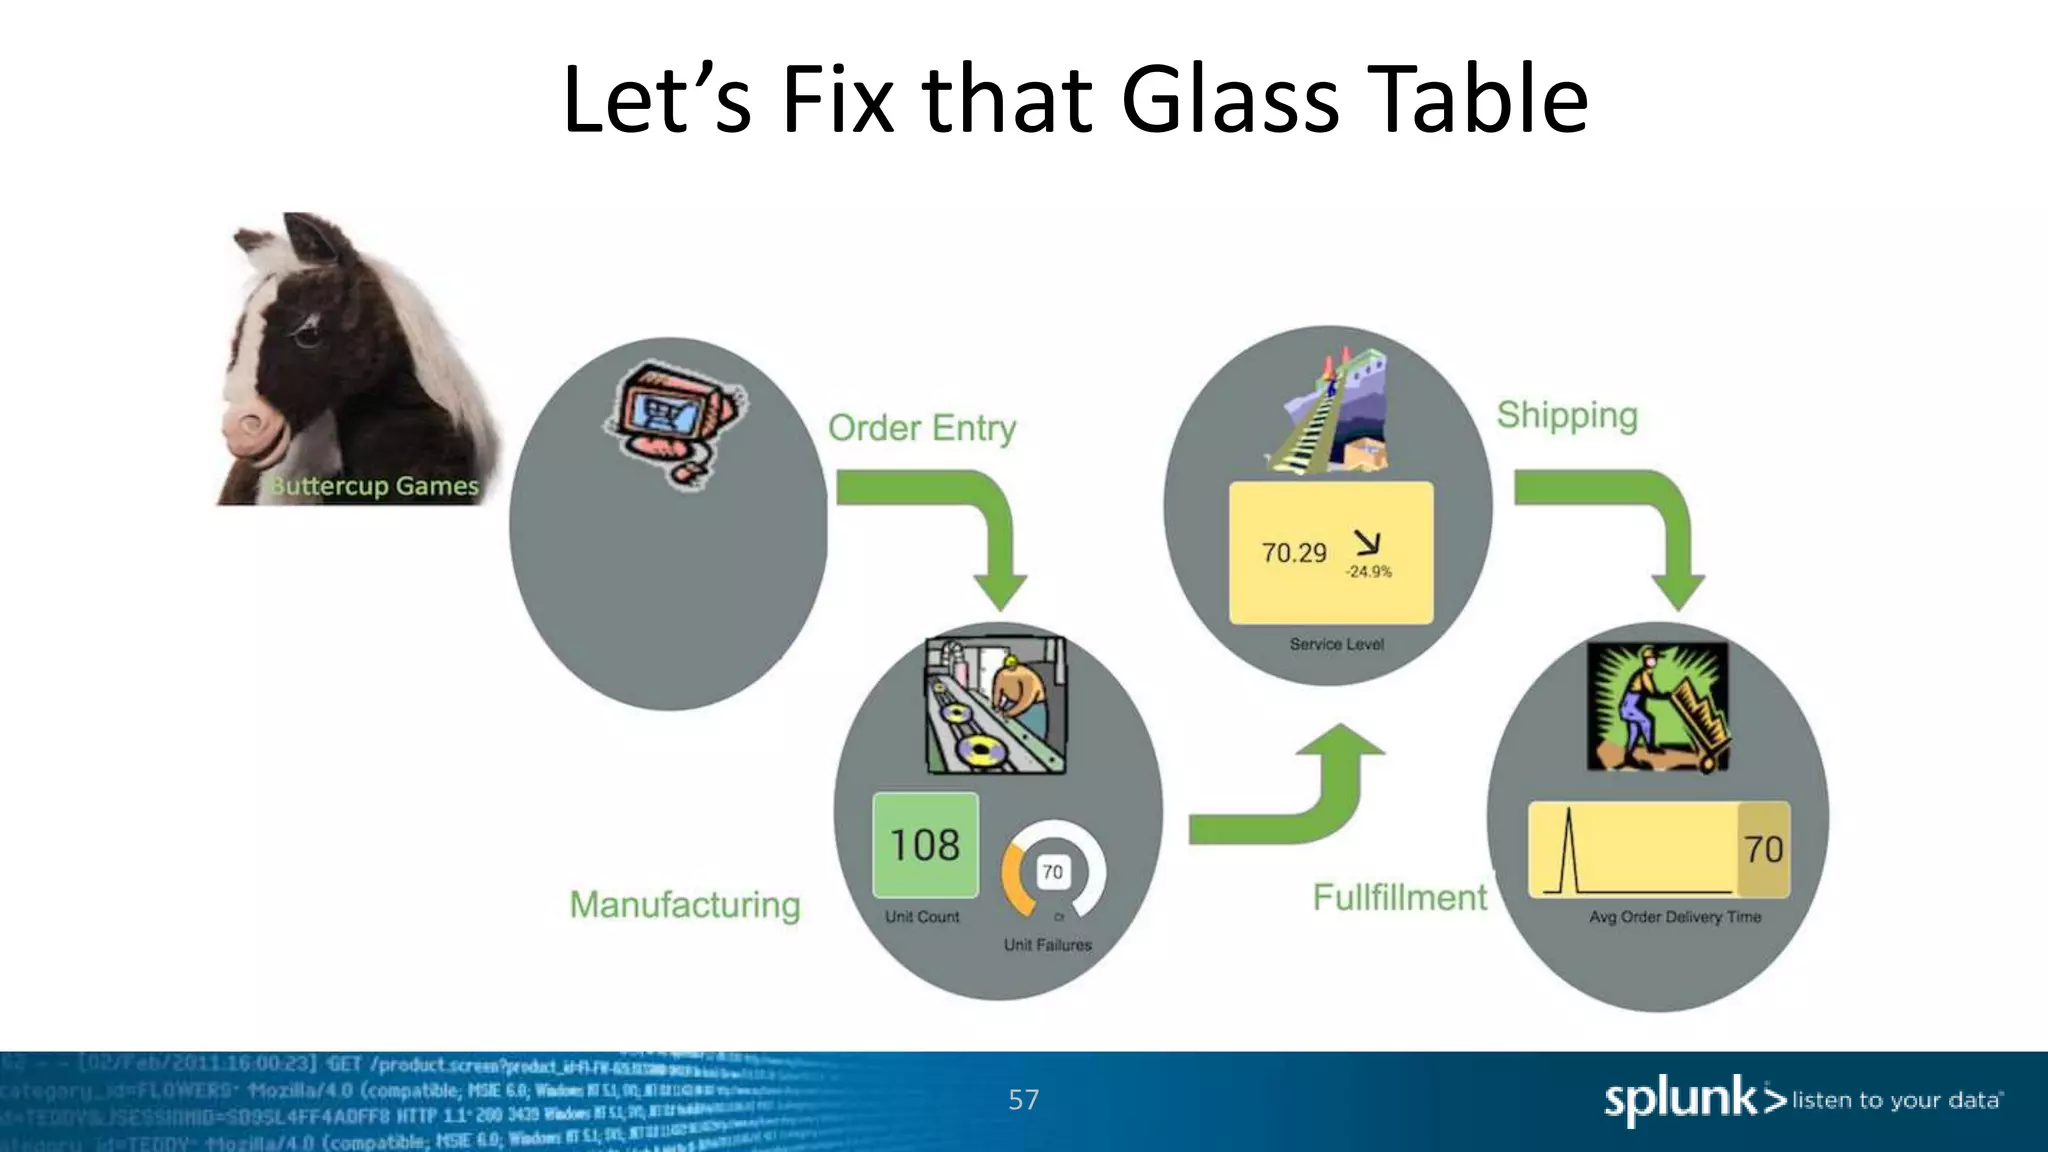
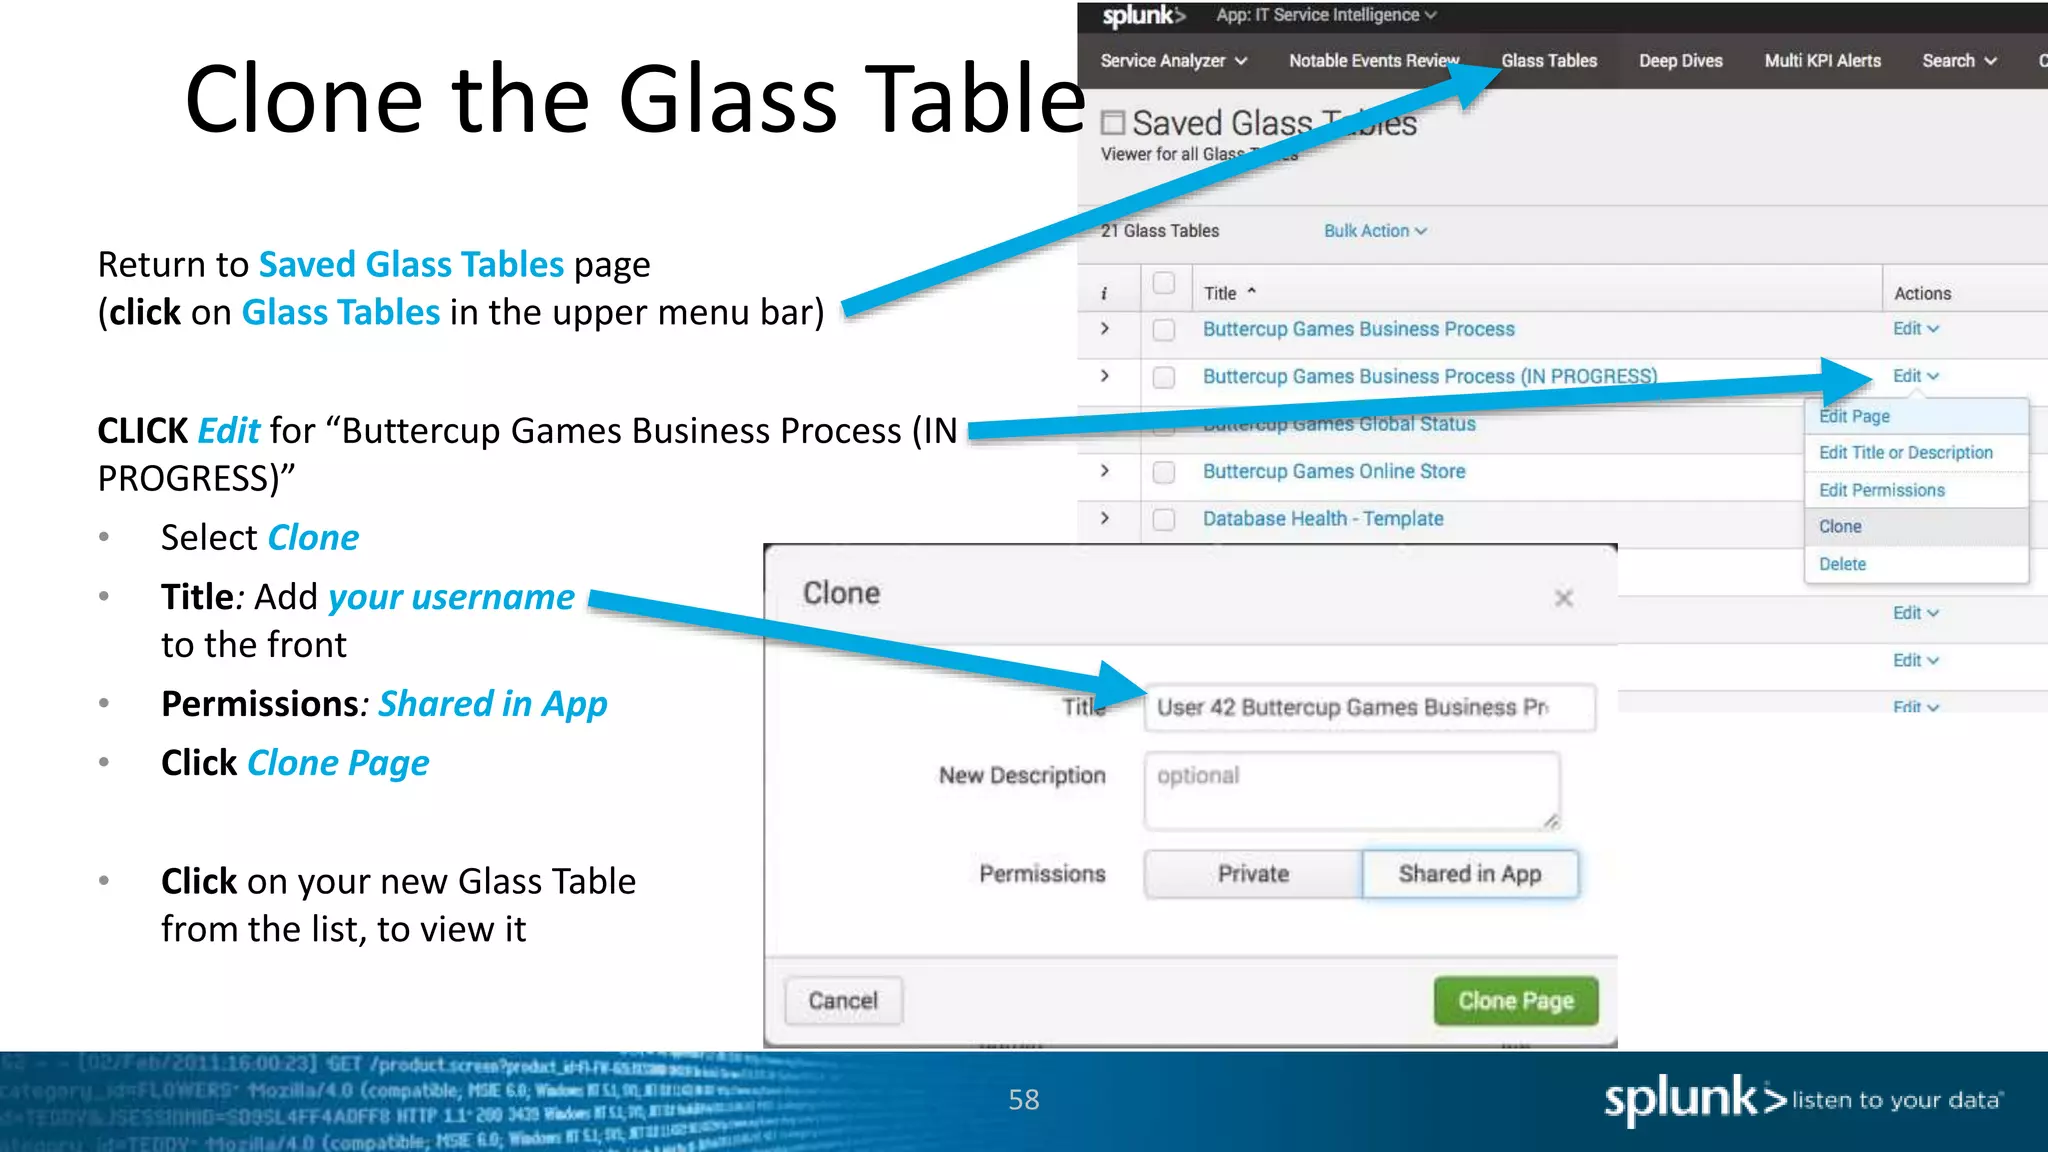
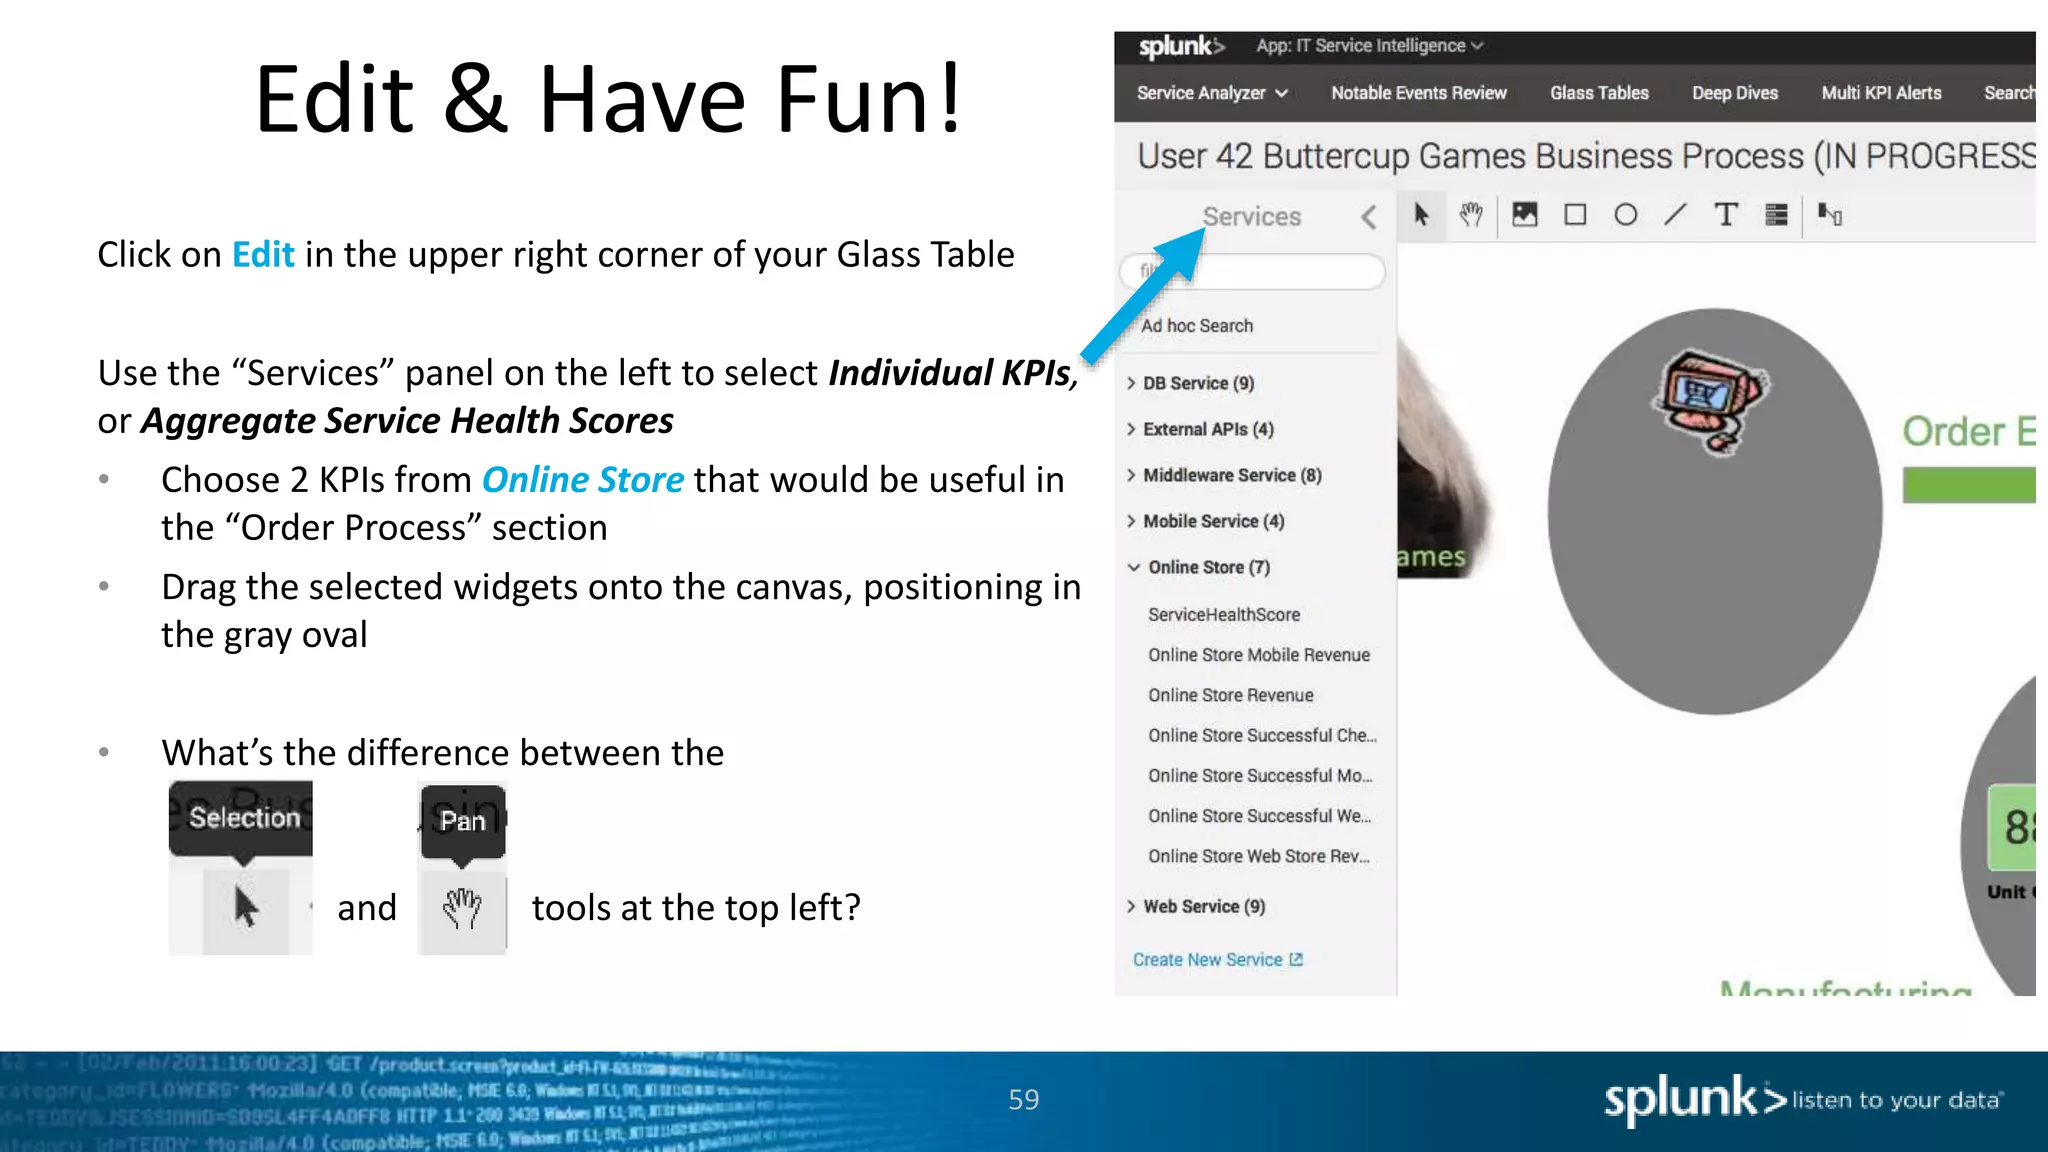
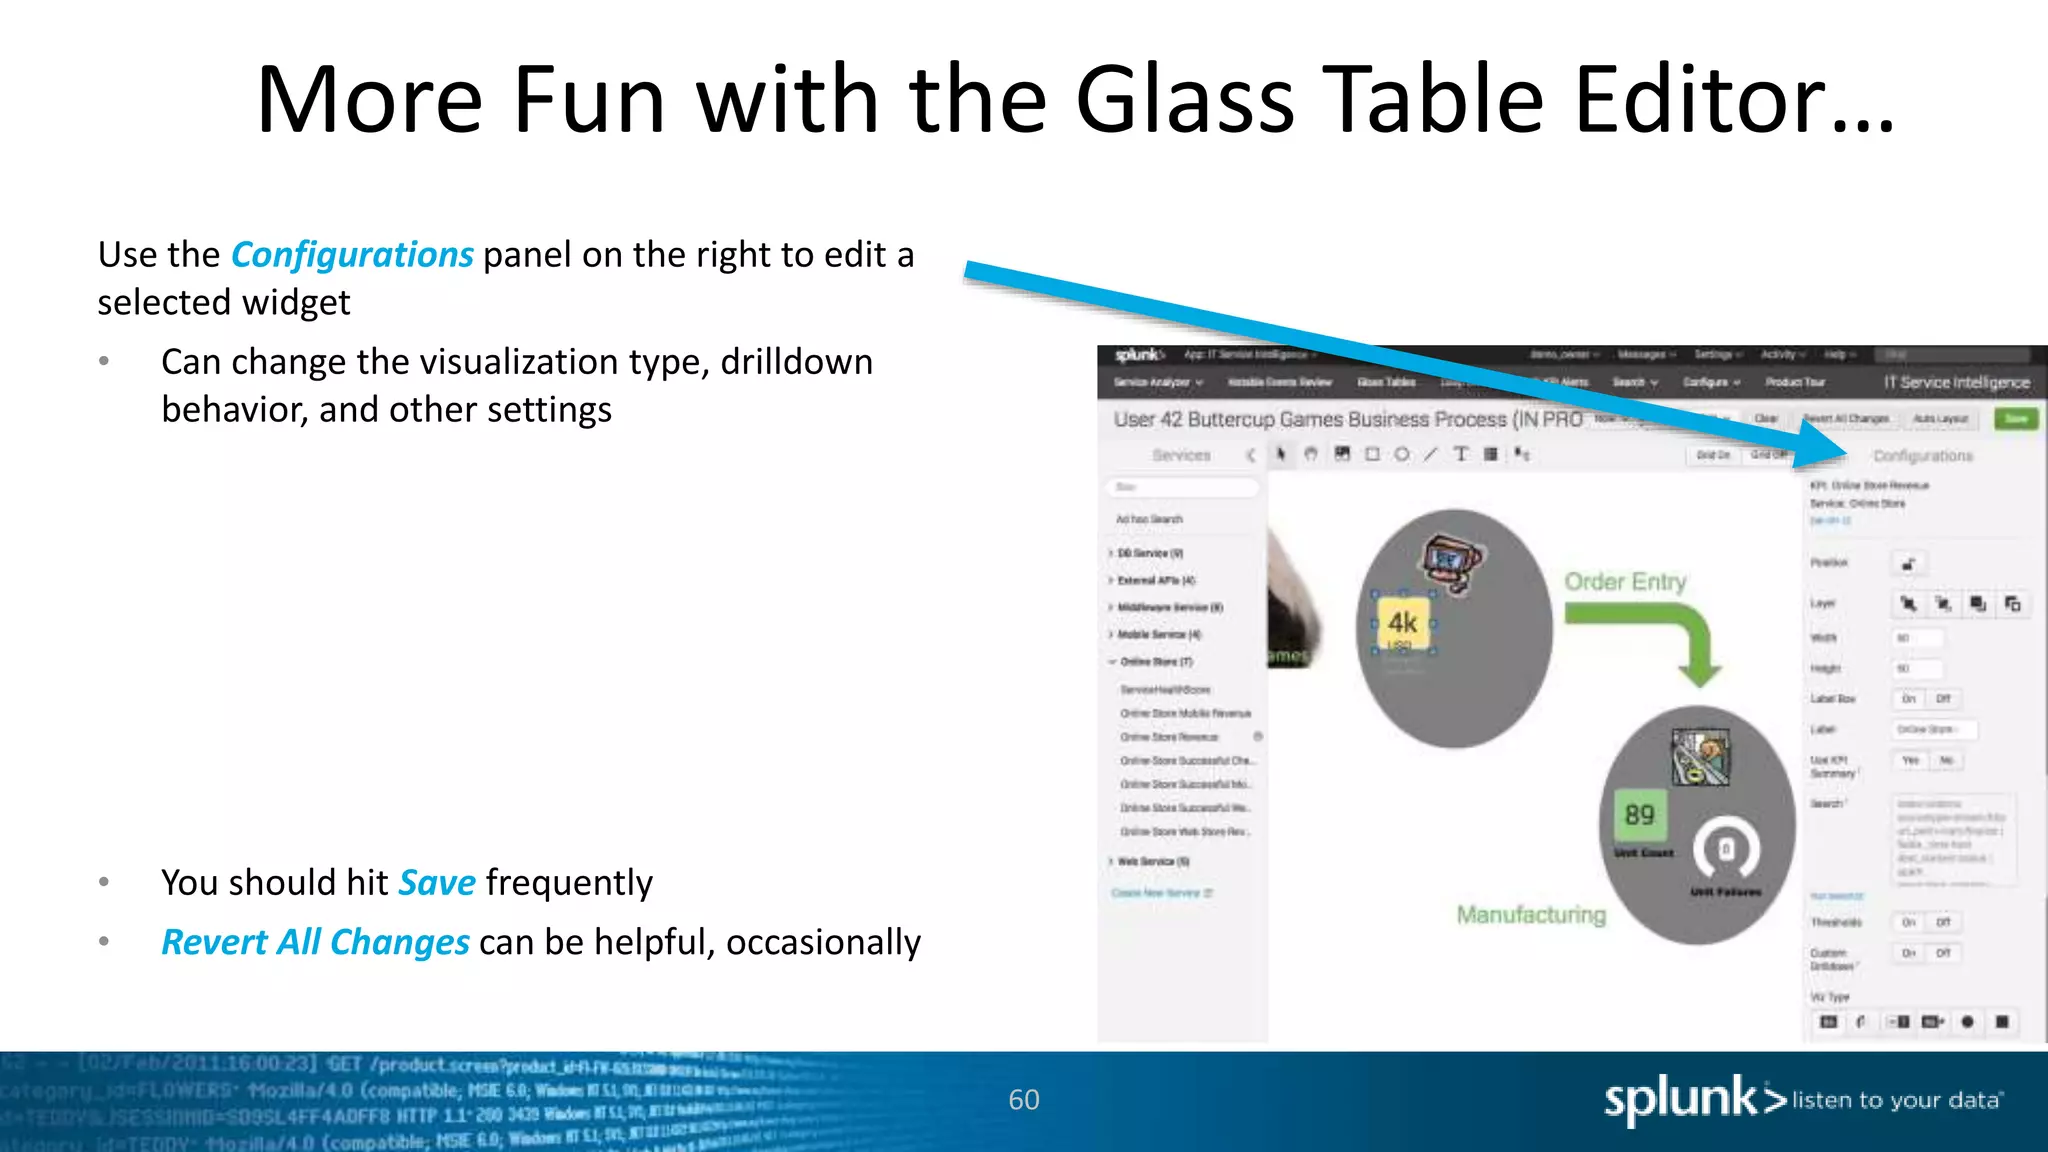
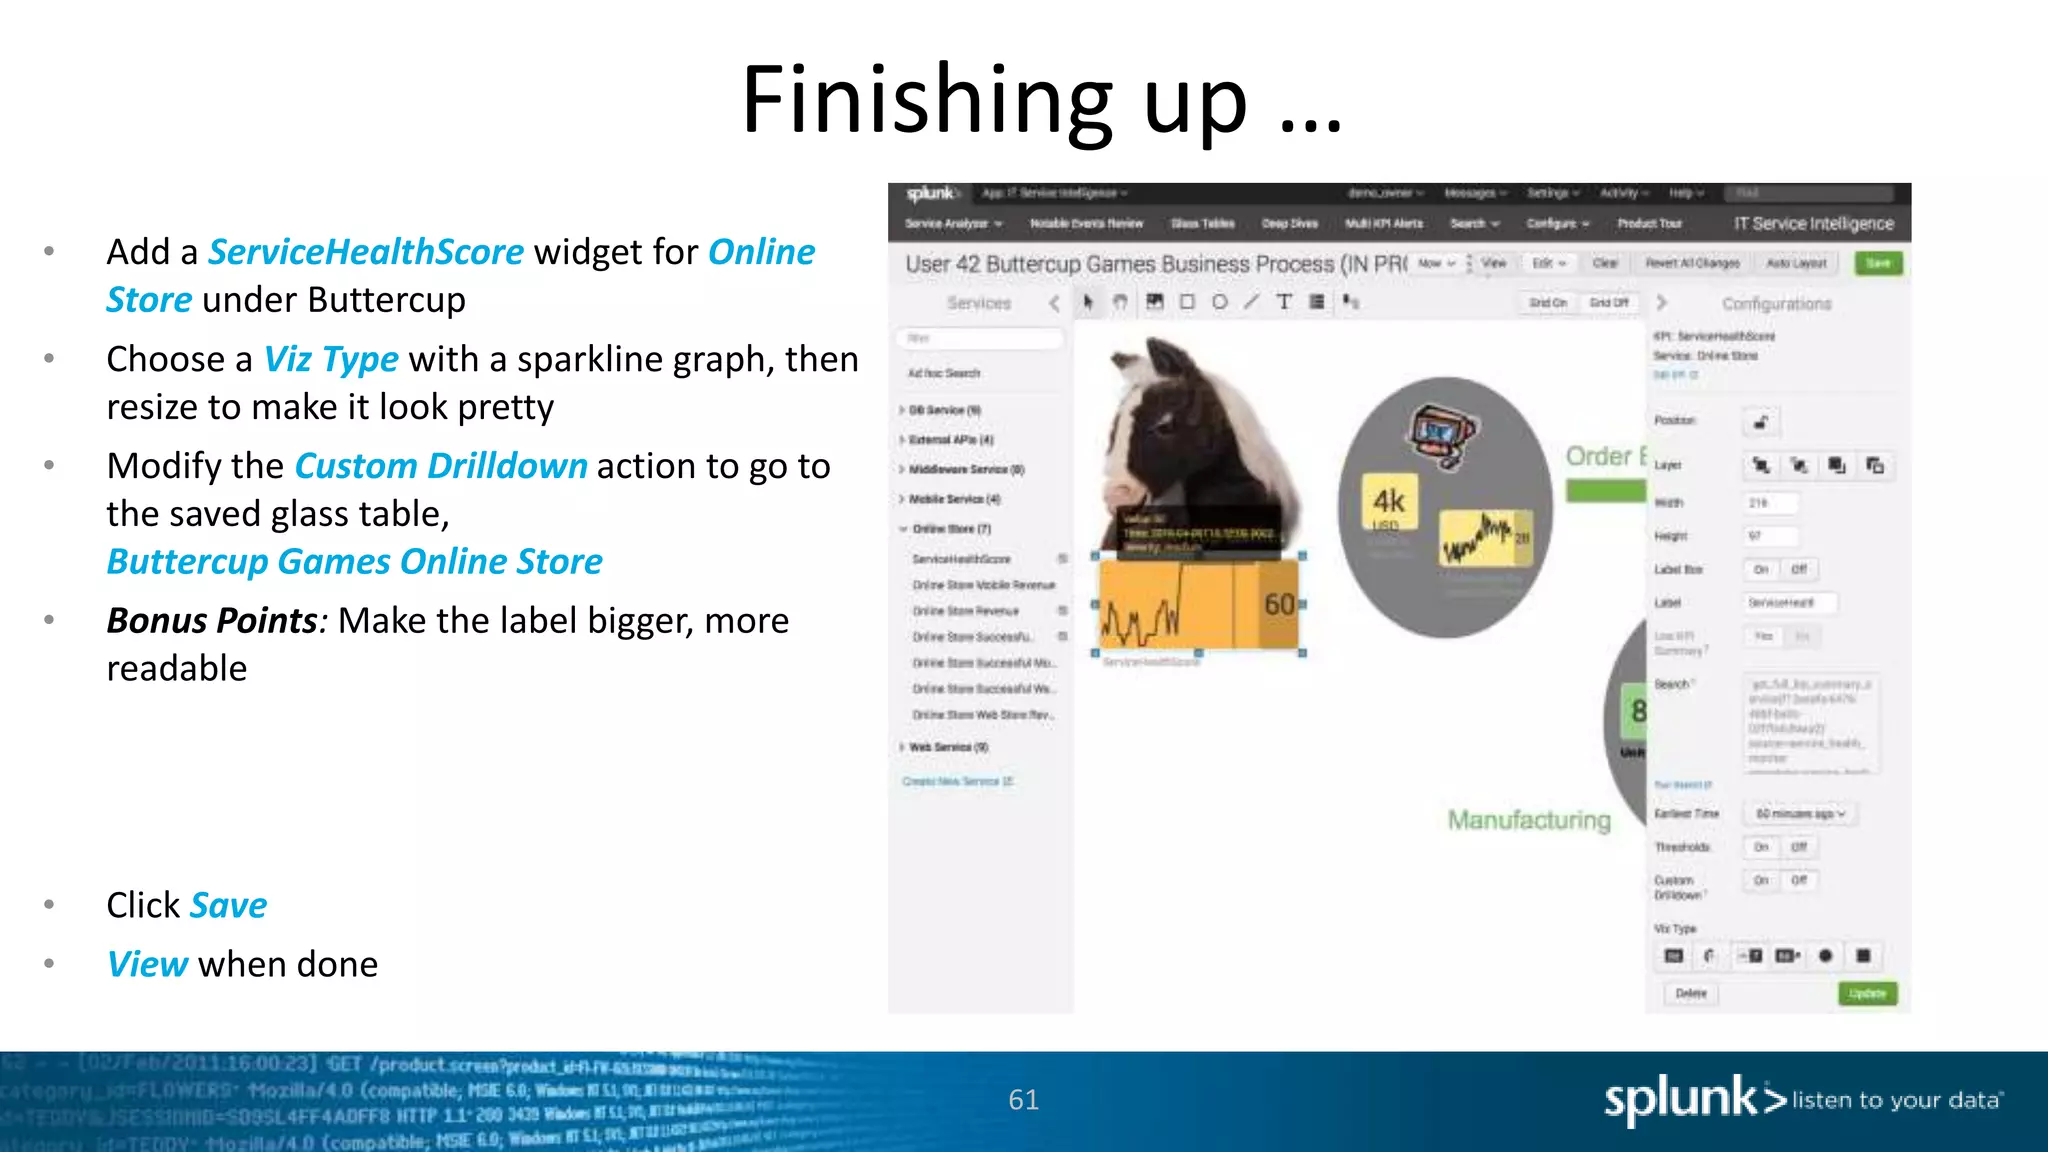
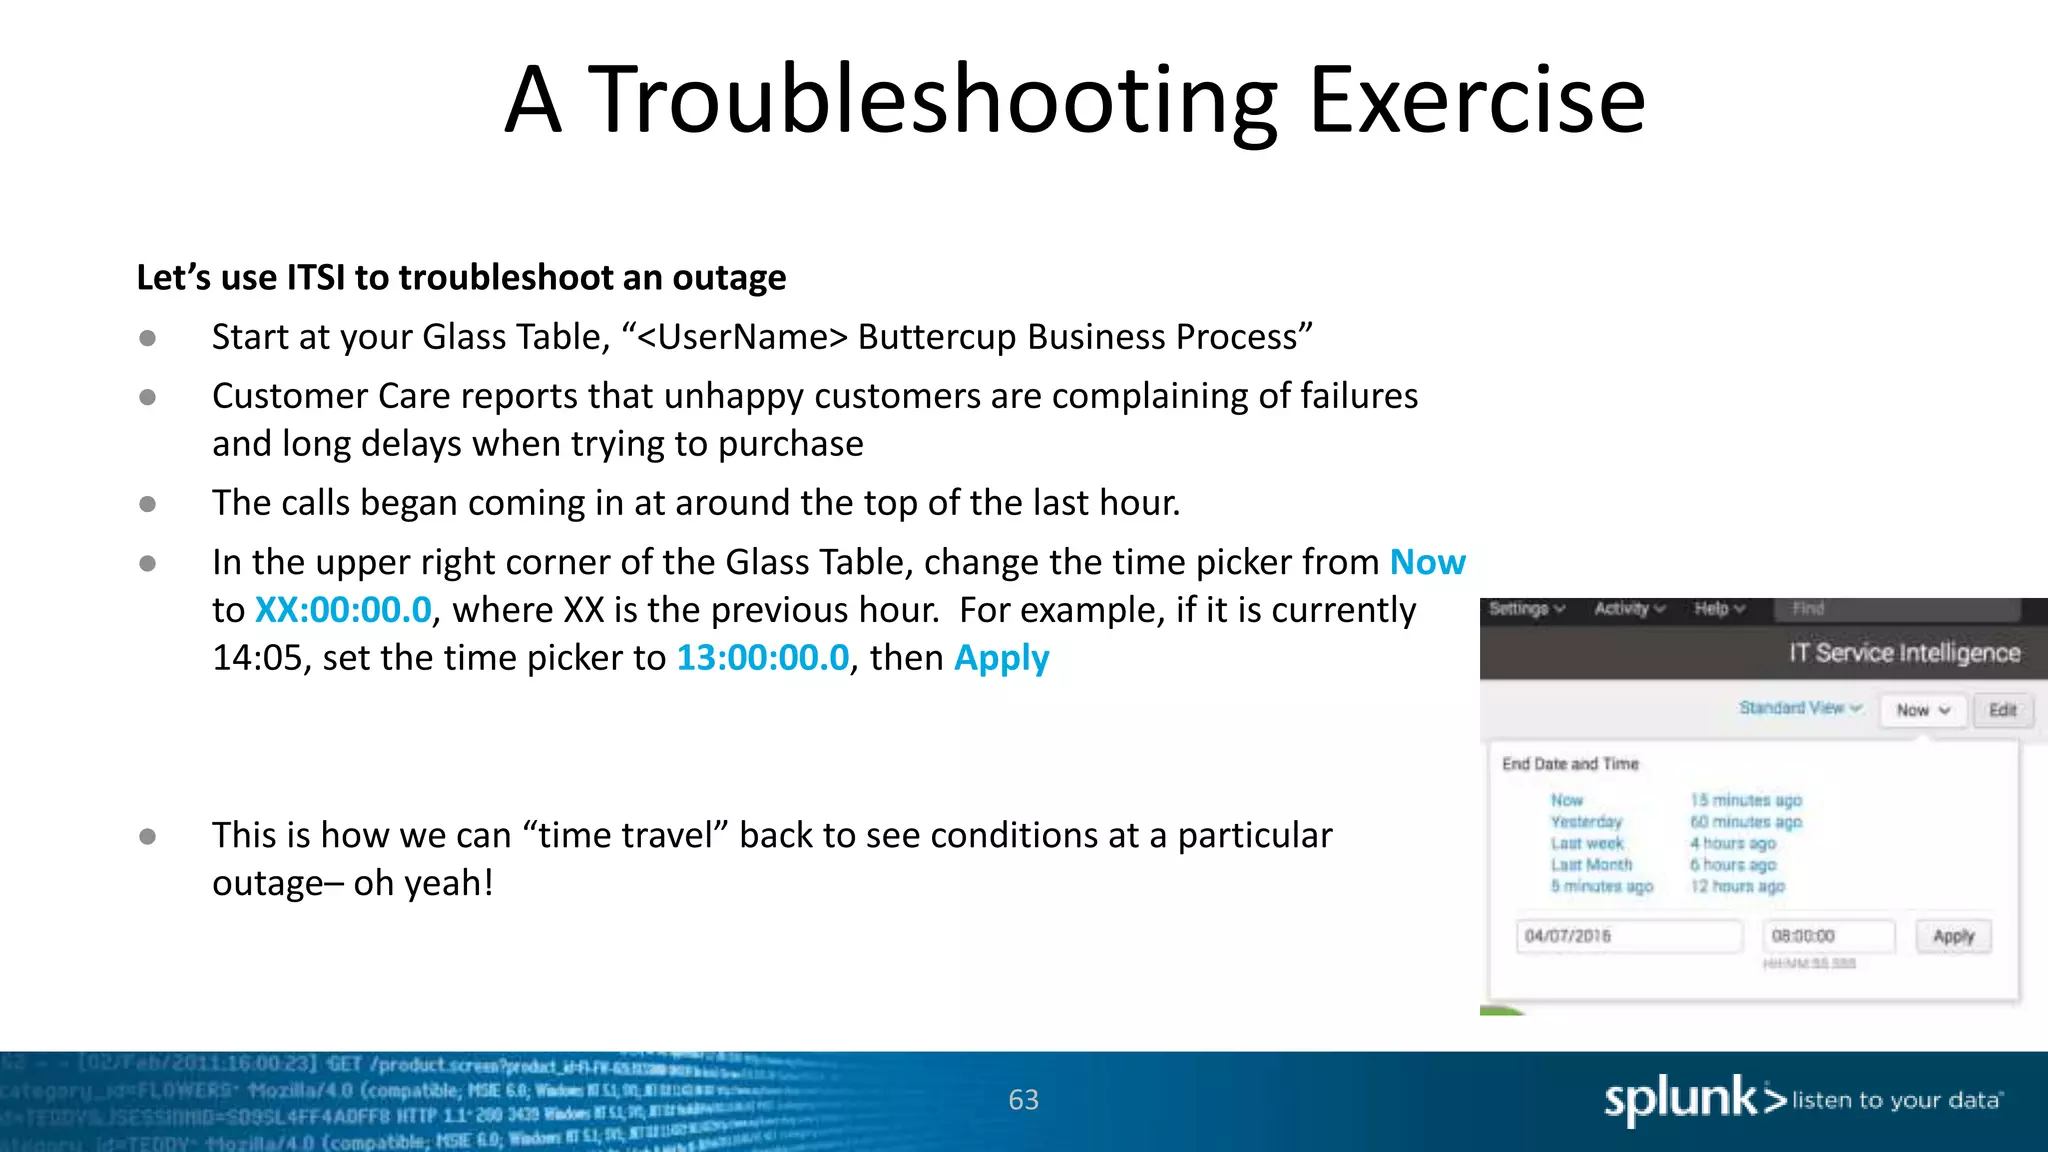
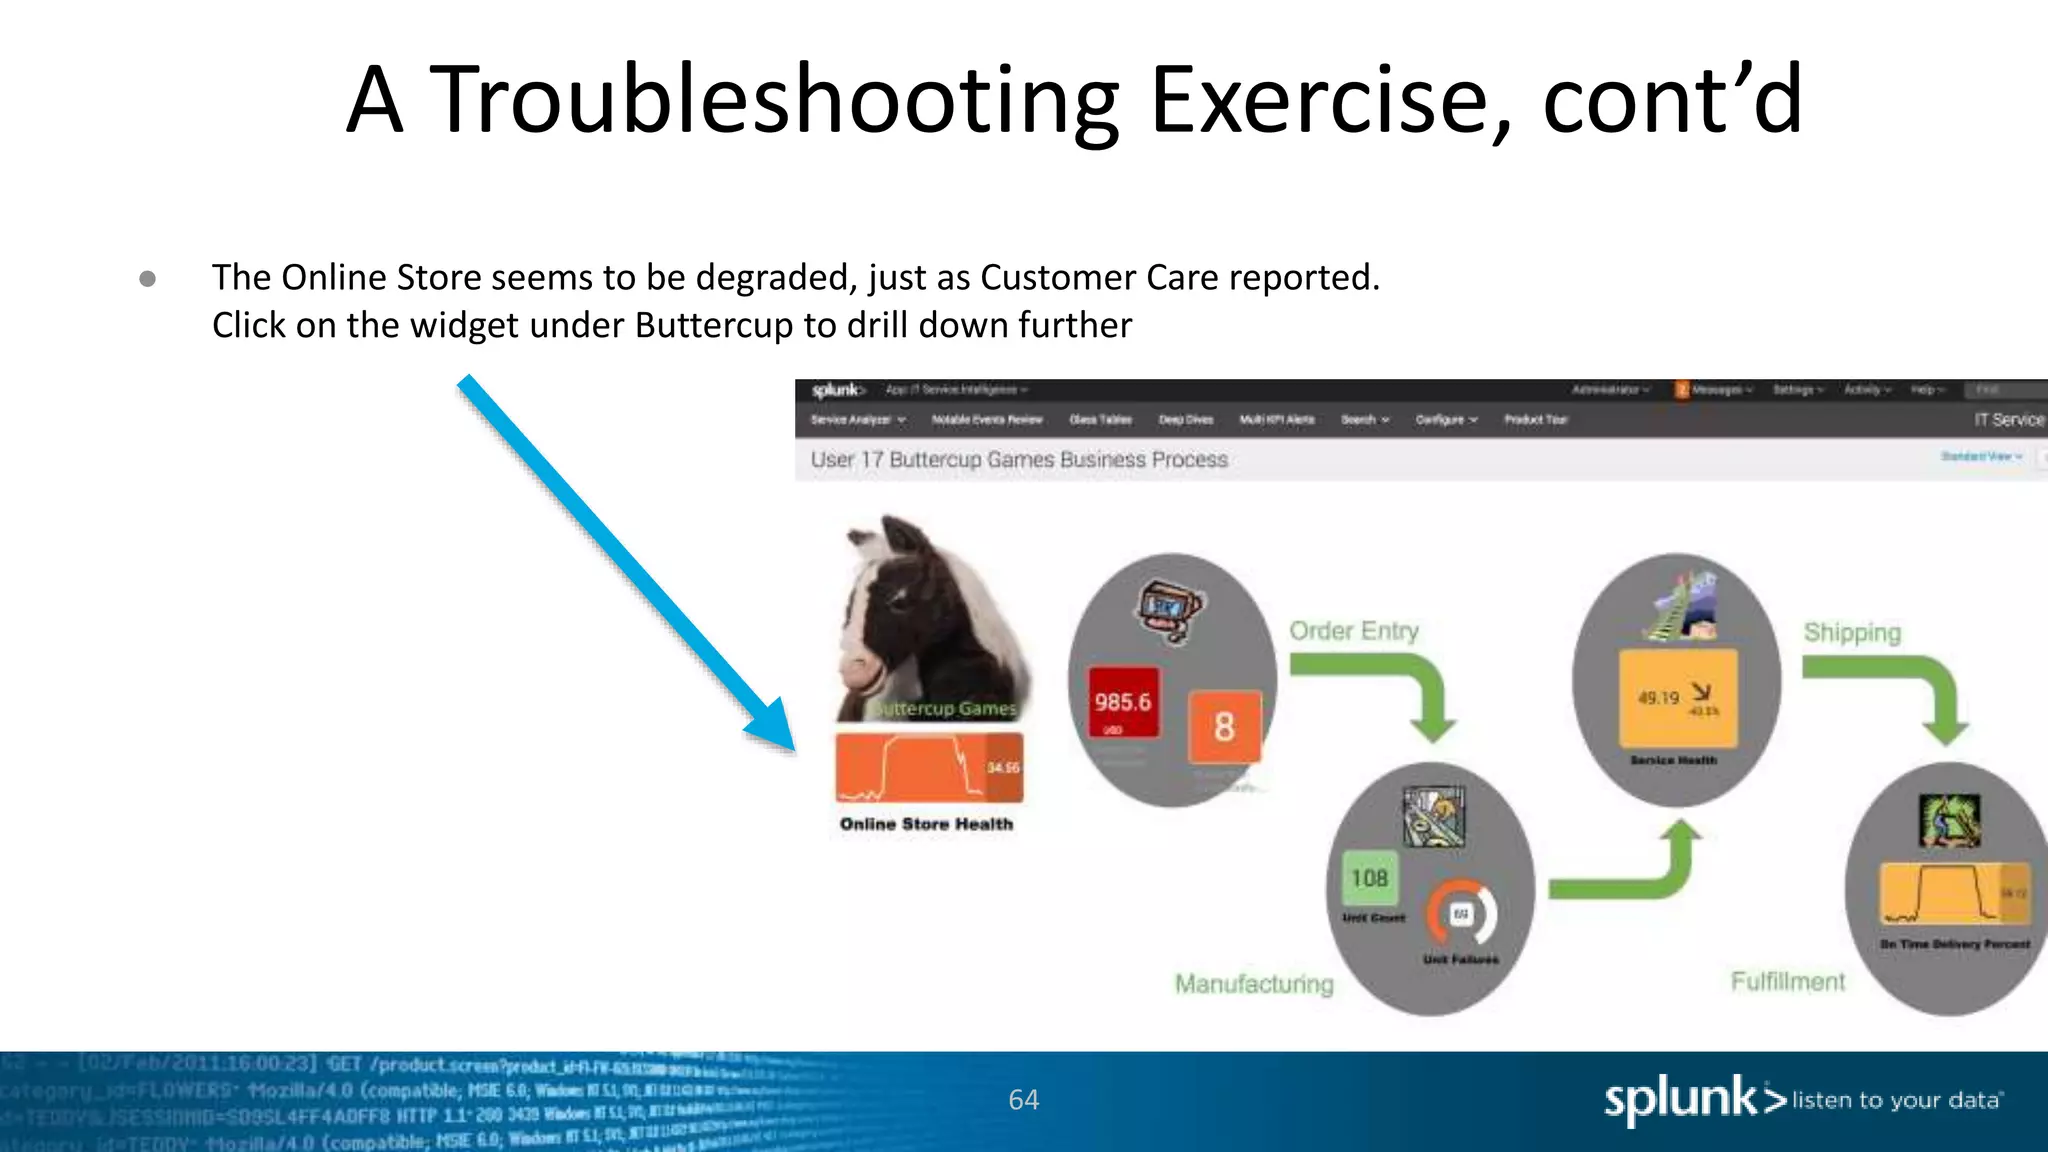
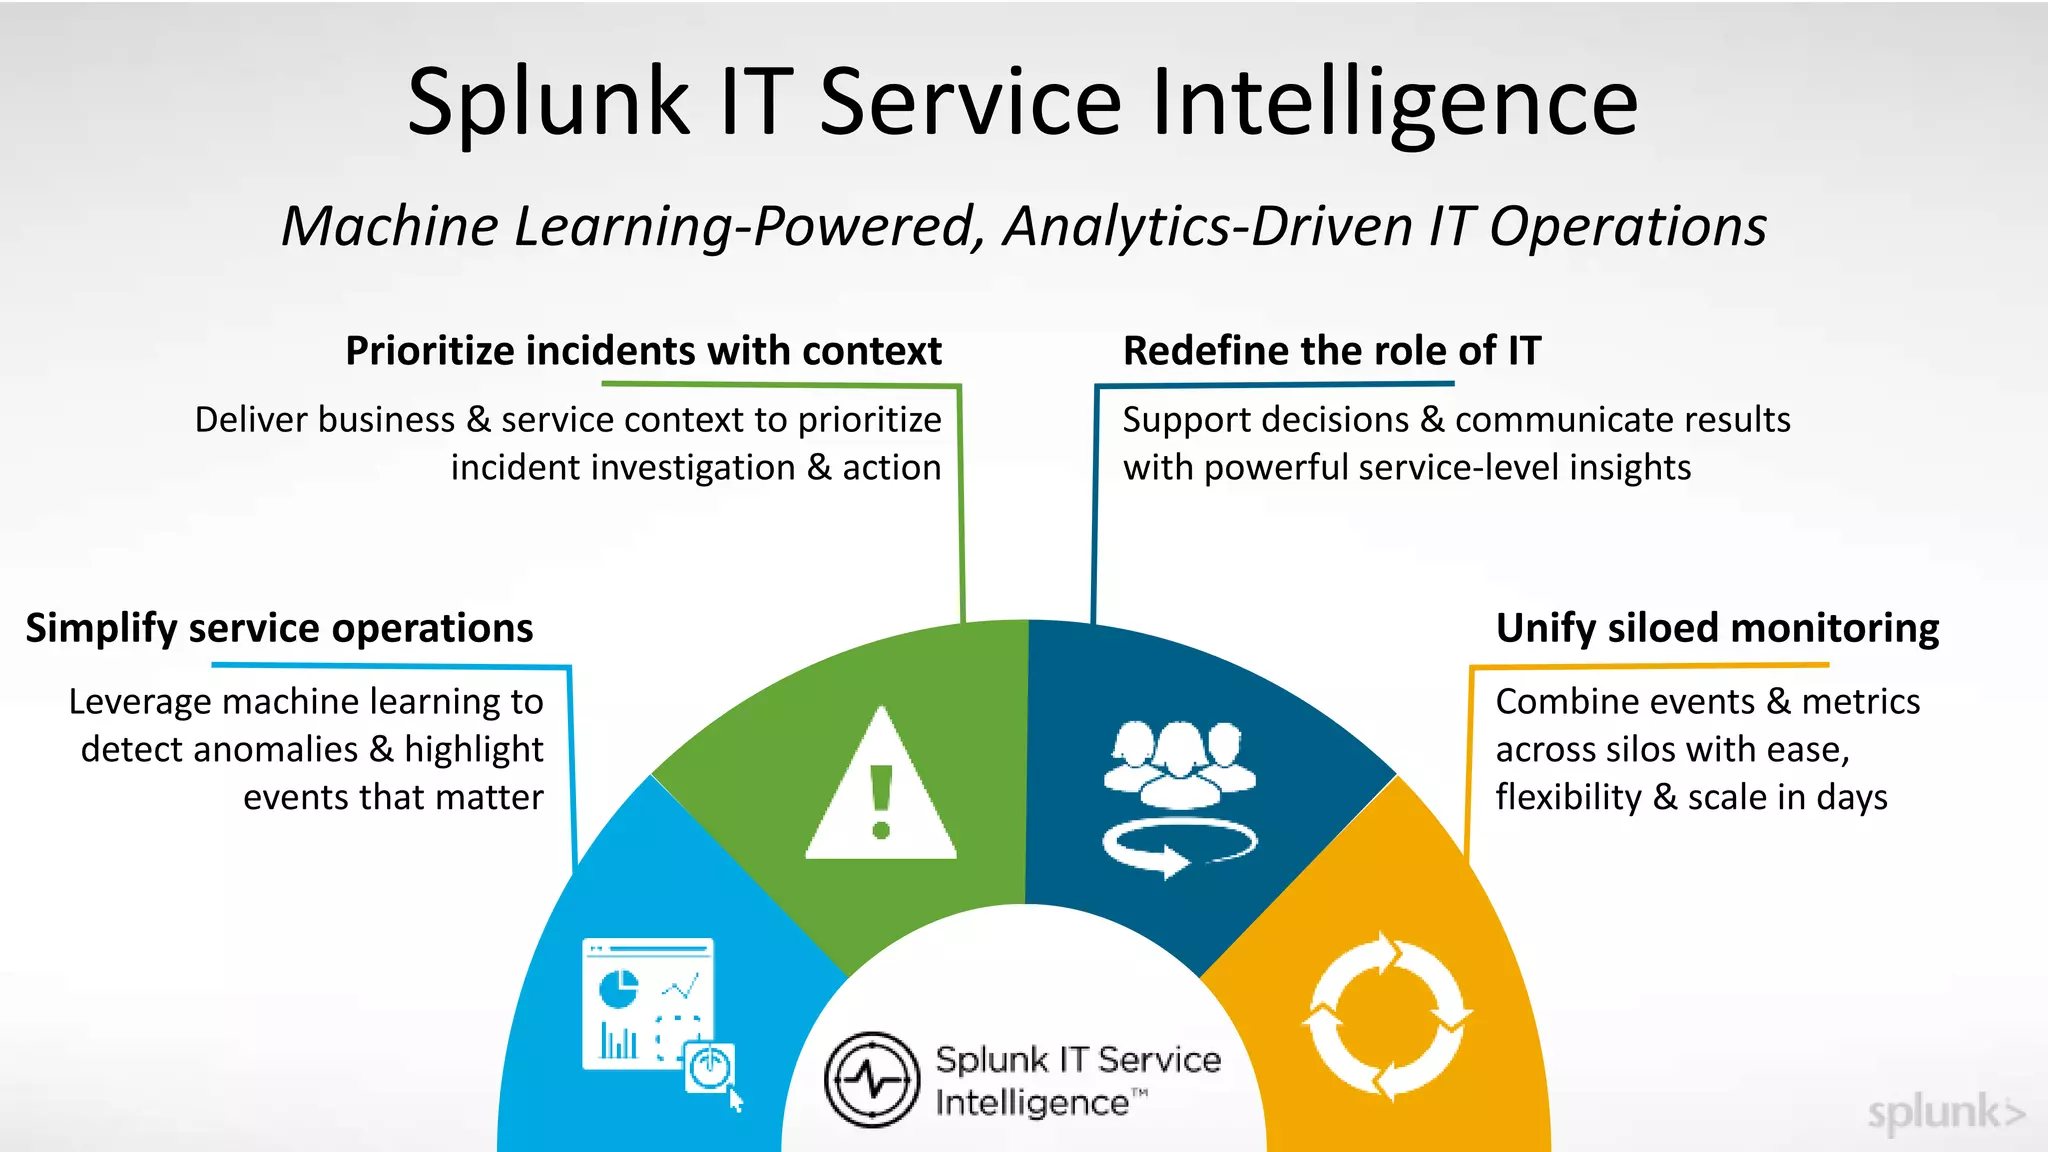
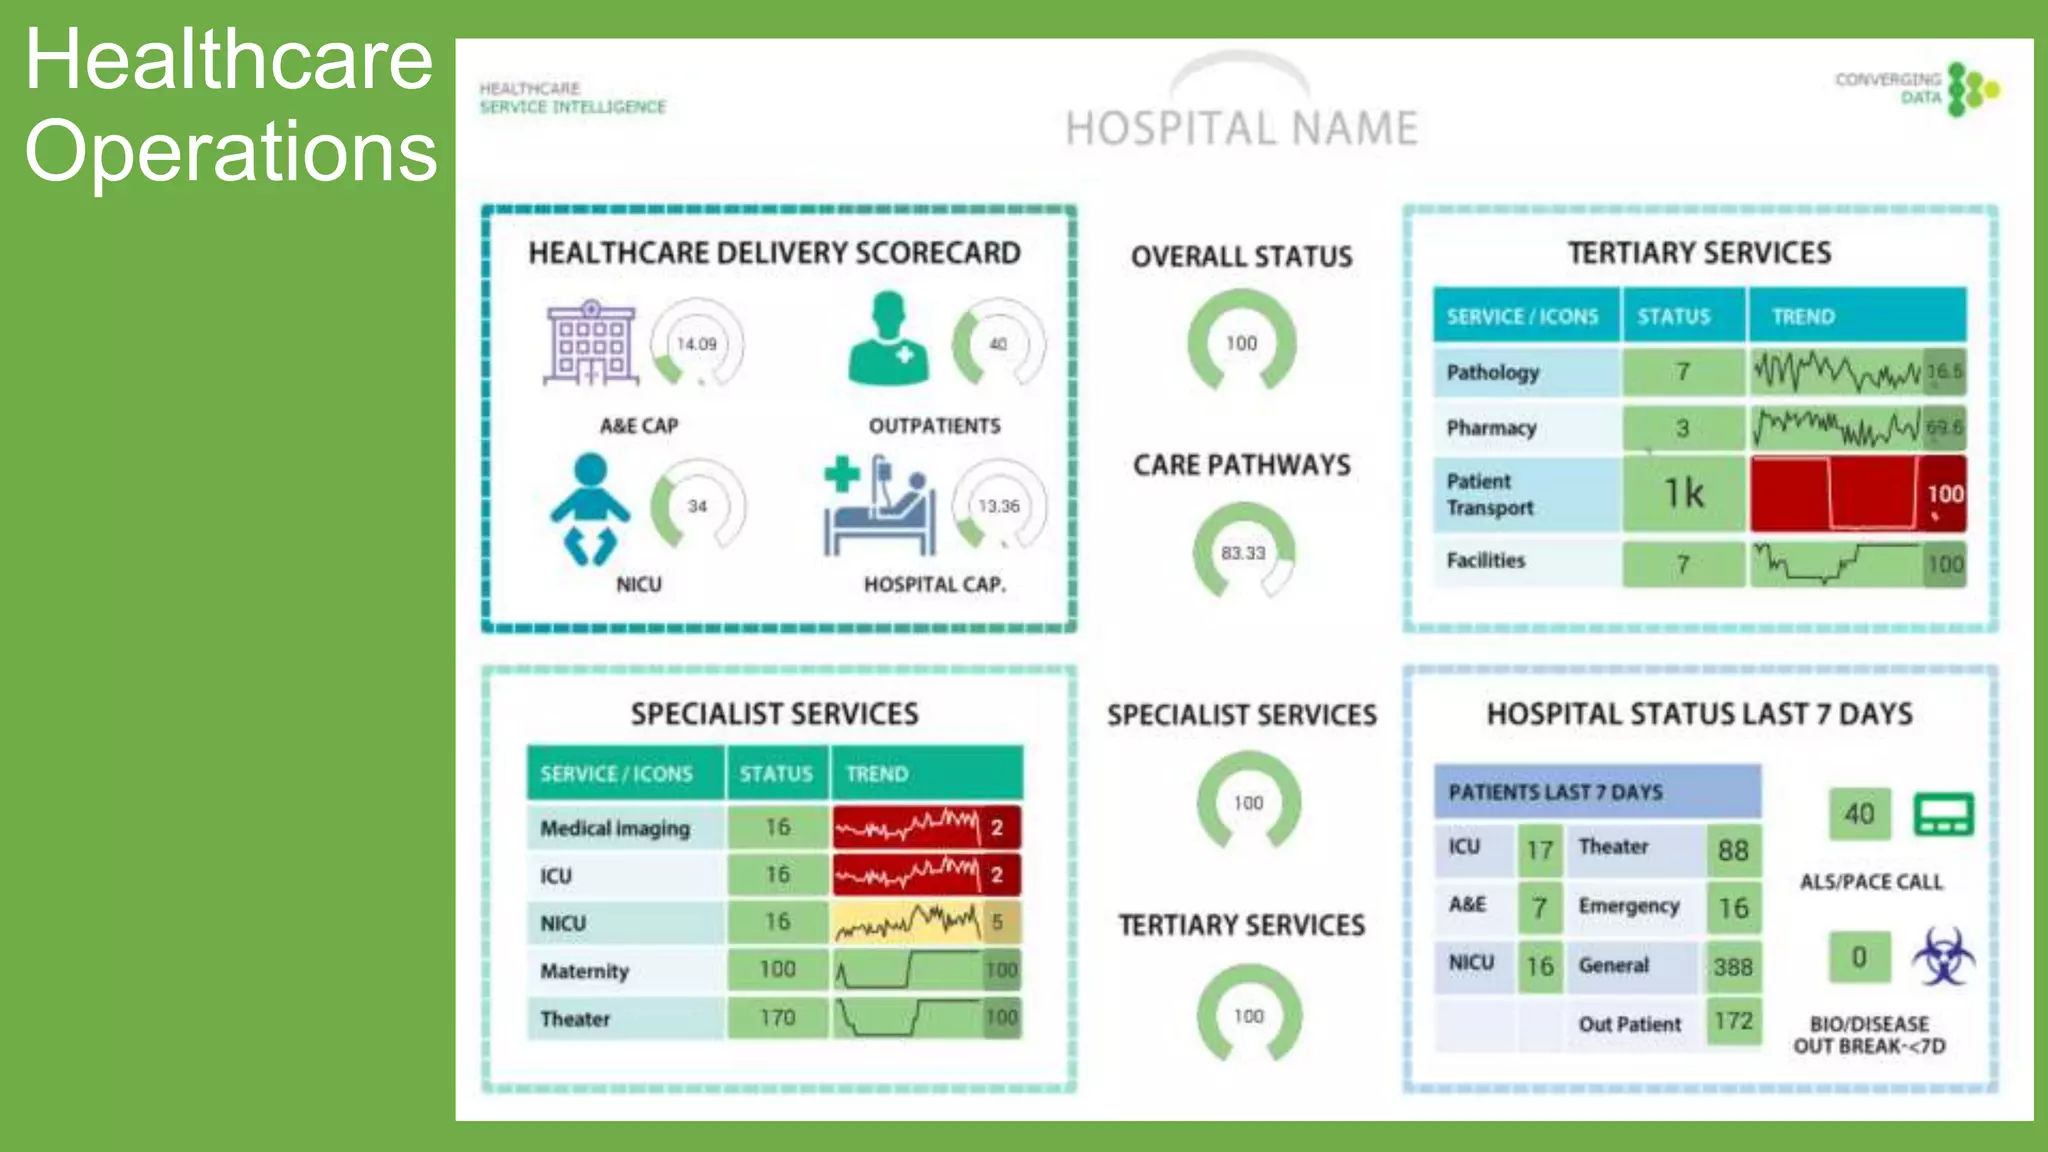
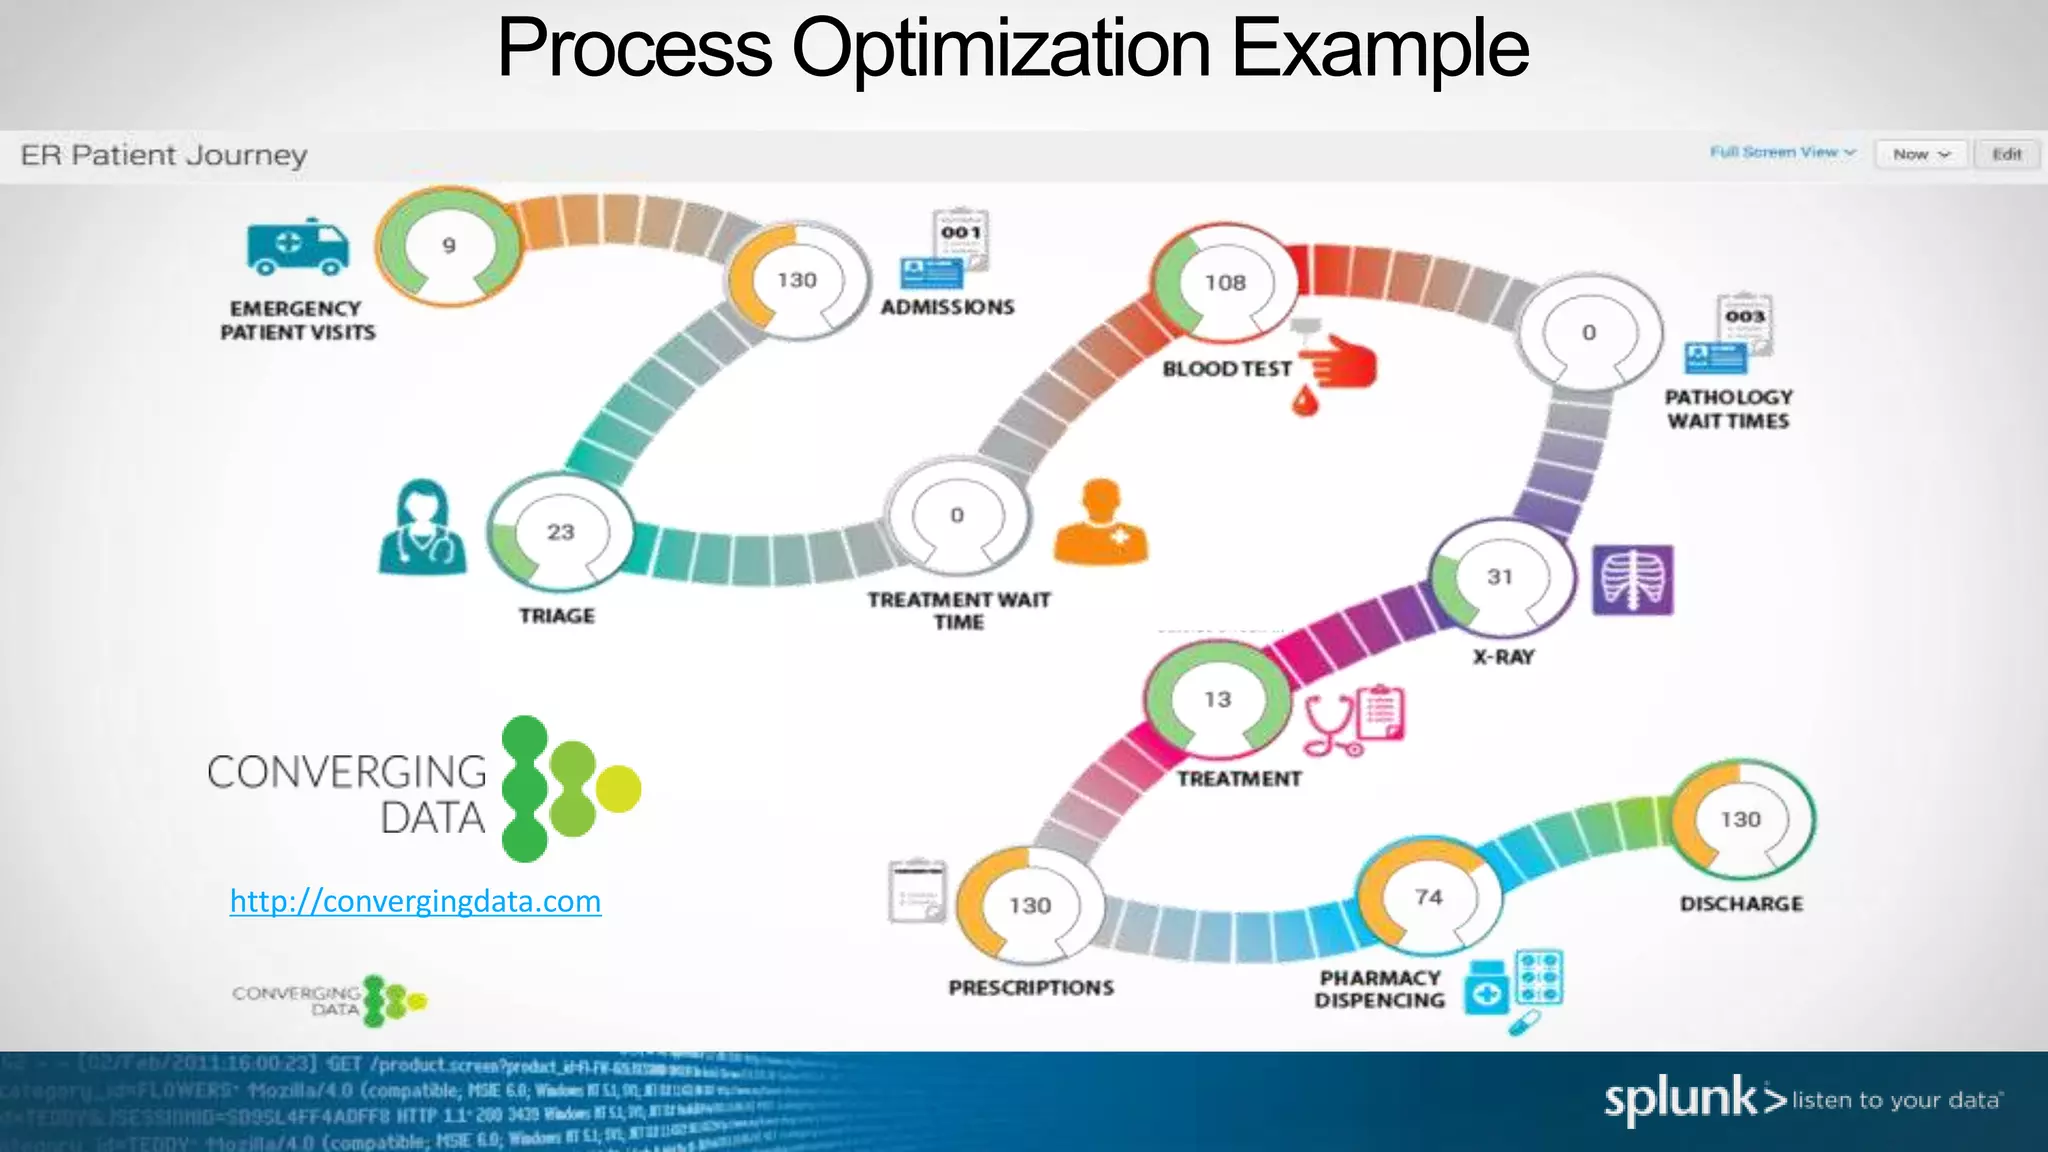
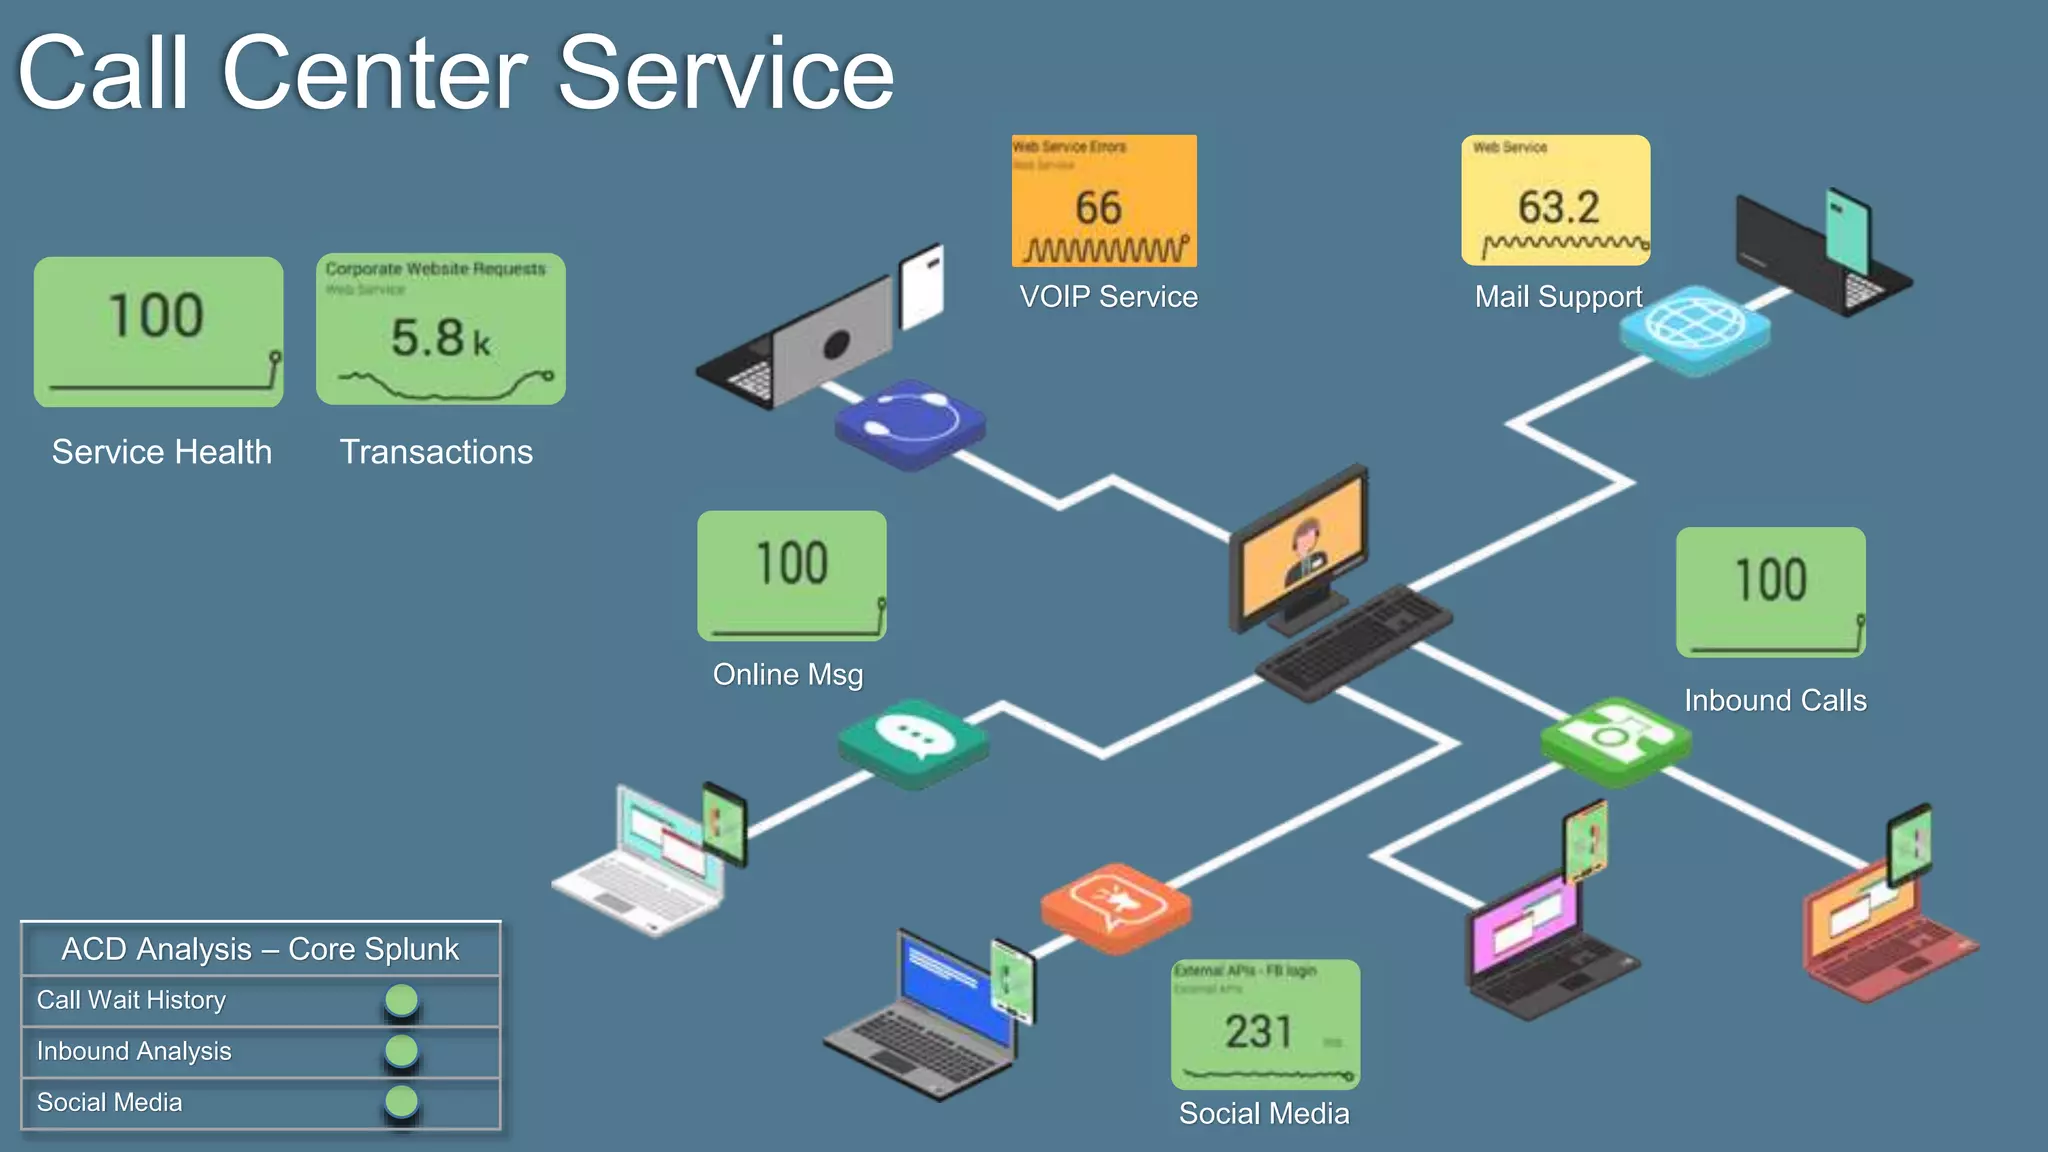
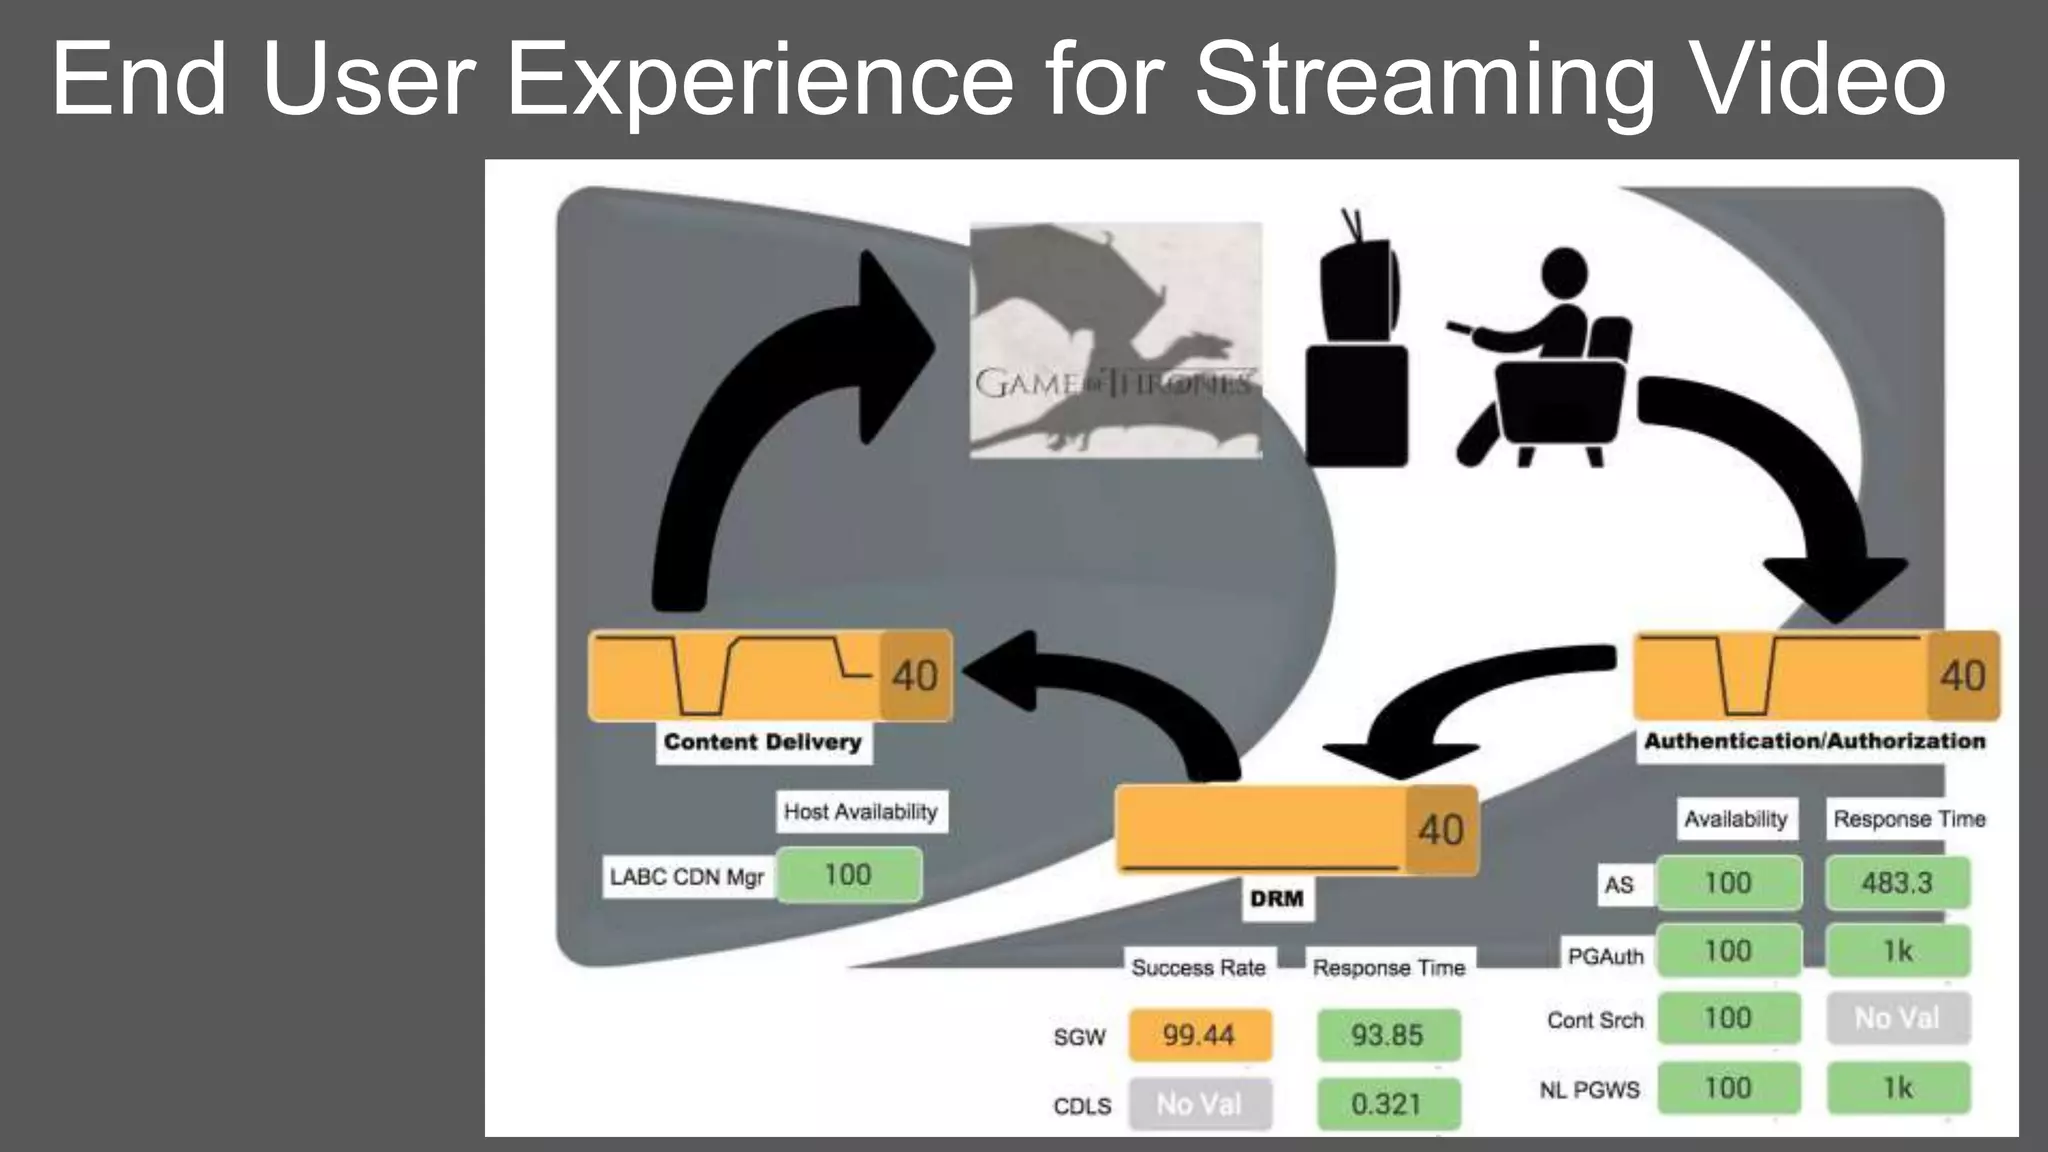
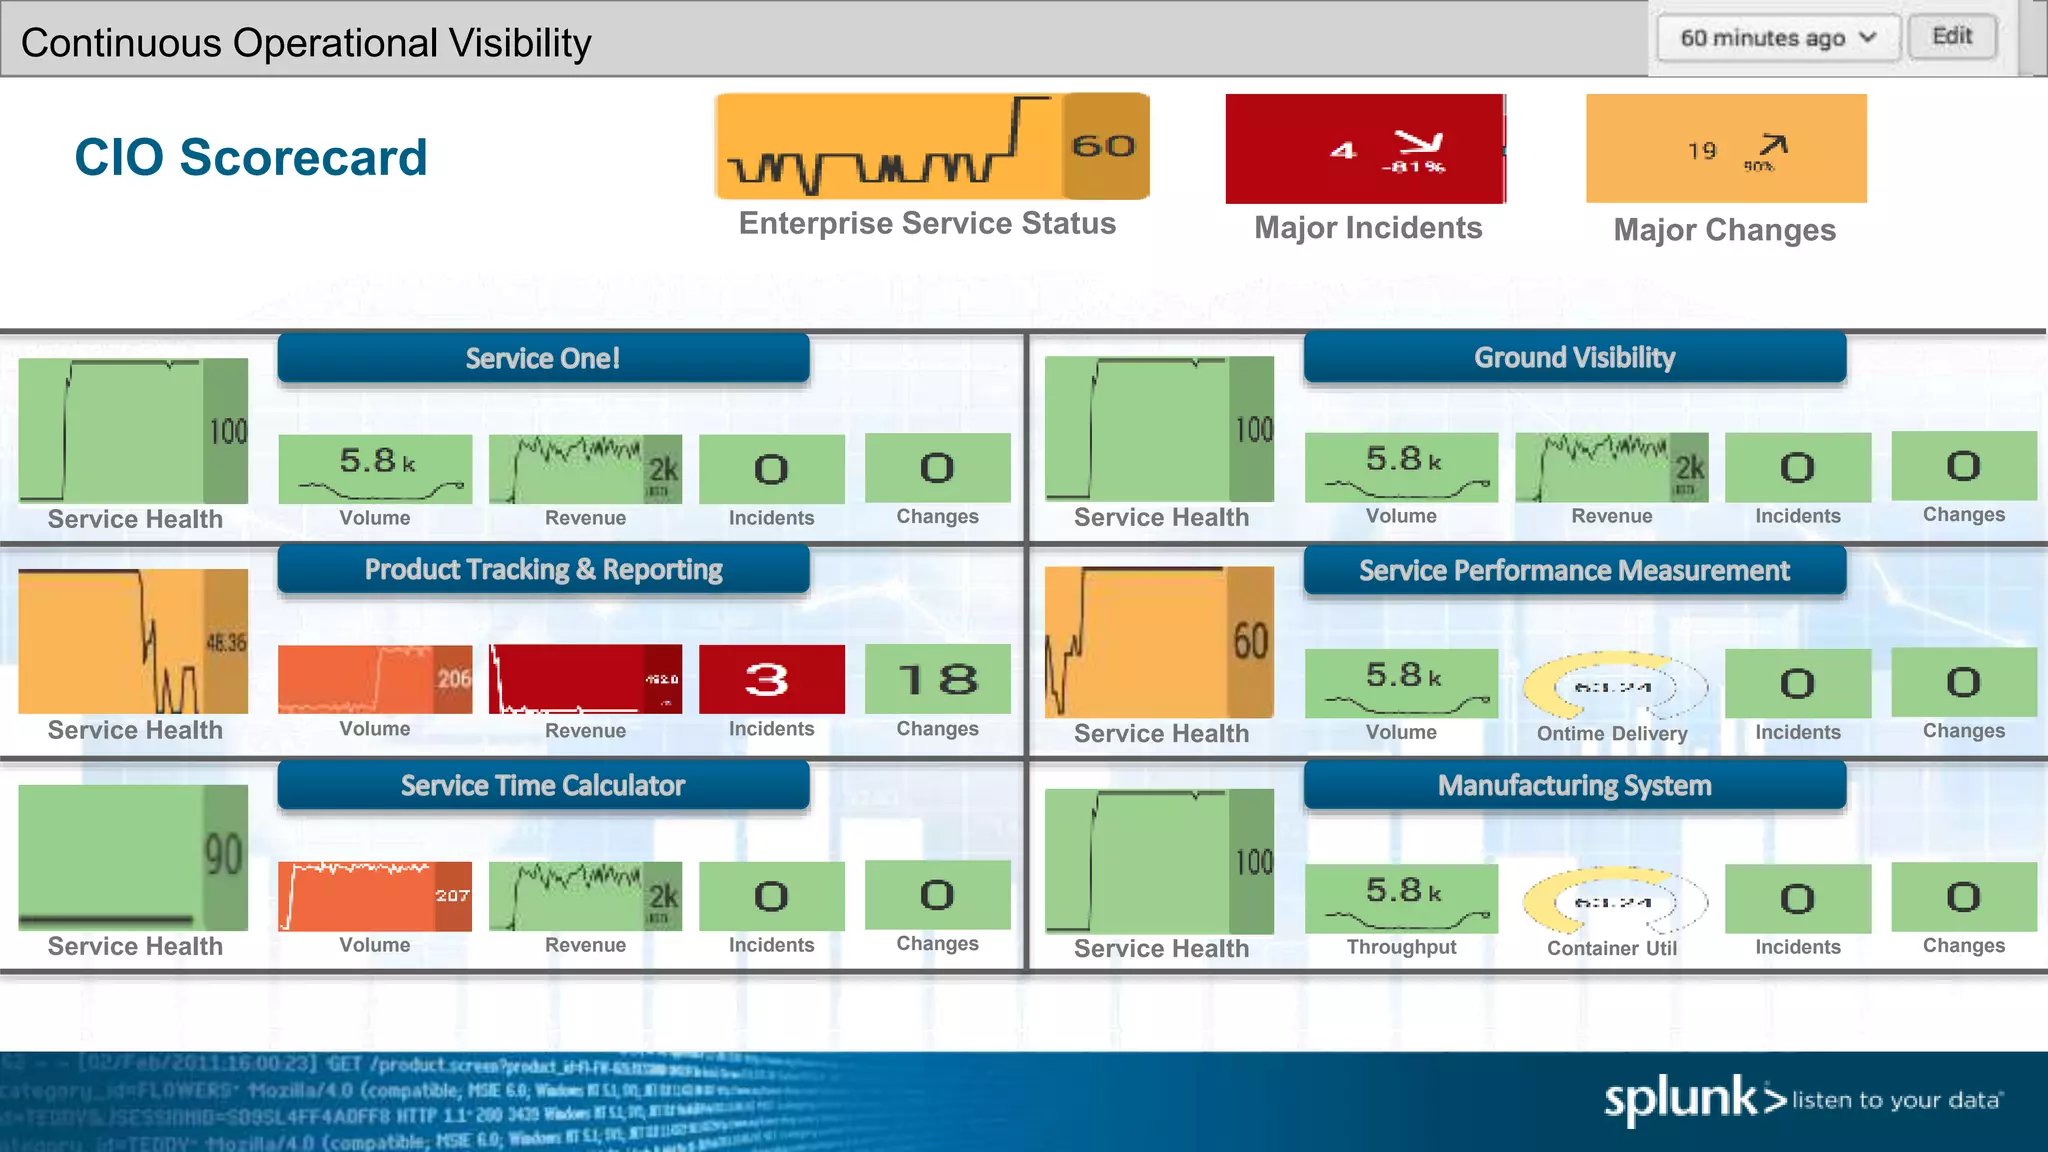
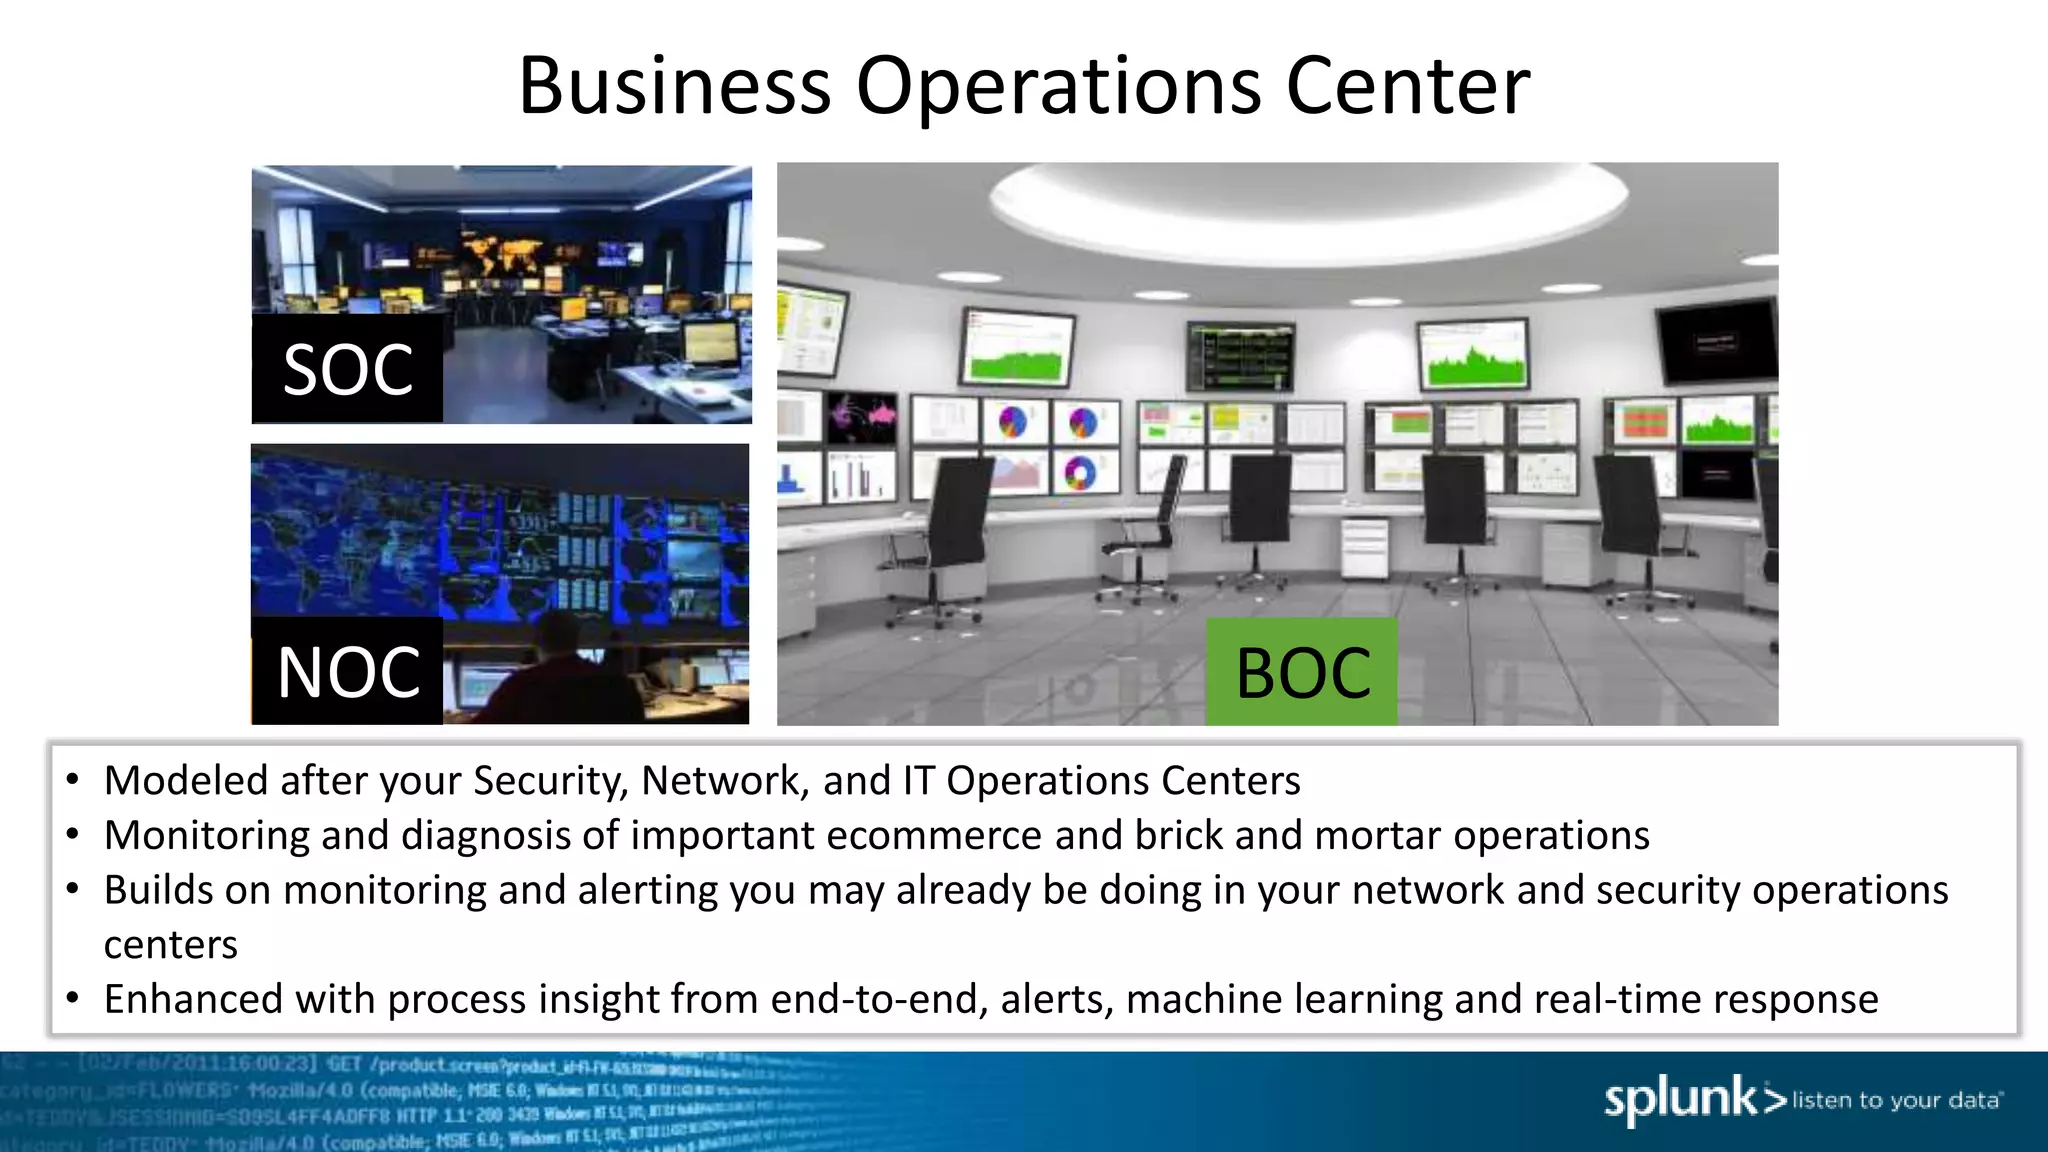
Setup Before You Can Play
1. Download this presentation slide deck: https://splunk.box.com/v/ITSI-HandsOn-Calgary
2. If you have not done so already, Sign up for the FREE Splunk ITSI Online Sandbox:
• http://splunk.com/itsi
• Select "Free Online Sandbox"
3. Please test access to your sandbox;
• Chrome, Firefox, Safari
are recommended;
• IE is NOT recommended
4. After logging in, select
IT Service Intelligence from the
list of apps at the left
1
Copyright © 2016 Splunk Inc.
Building Business
Service Intelligence with
Splunk IT Service Intelligence
Stuart Ainsworth
IT Operations Specialist
Thursday October 20, 2016
WiFi: Marriott_CONFERENCE / splunk
Julian Andre
Sales Engineer
Agenda
3
 Introductions and Set Up
 Splundamentals – IT Troubleshooting with Splunk
 What is IT Service Intelligence?
 Service Intelligence Design Practices
 Let's Play!
 What's Next?
 Happy Hour!
Safe Harbor Statement
During the course of this presentation, we may make forward looking statements regarding future events
or the expected performance of the company. We caution you that such statements reflect our current
expectations and estimates based on factors currently known to us and that actual events or results could
differ materially. For important factors that may cause actual results to differ from those contained in our
forward-looking statements, please review our filings with the SEC. The forward-looking statements
made in this presentation are being made as of the time and date of its live presentation. If reviewed
after its live presentation, this presentation may not contain current or accurate information. We do not
assume any obligation to update any forward looking statements we may make. In addition, any
information about our roadmap outlines our general product direction and is subject to change at any
time without notice. It is for informational purposes only and shall not be incorporated into any contract
or other commitment. Splunk undertakes no obligation either to develop the features or functionality
described orto includeany suchfeatureor functionalityina futurerelease.
4
What is Service Intelligence?
Enabling a business-aware IT
Measuring and reporting on indicators that matter
Unlocking operational efficiencies
Collaborating across silos to improve service operations
Using data-driven decision making
Solving problems and anticipating pitfalls with sophisticated
analytics and powerful insights from machine data
Key Takeaways
1 Build on what you are already doing with Splunk
Service Intelligence design and configuration practices
3 What is possible with Splunk IT Service Intelligence
Splundamentals – IT
Troubleshooting with
Splunk
Traditional Methods
Network
InfrastructureLayer
HP NNMi, HP NA, Solar
Winds, CA Spectrum,
Storage
HP Storage Operations,
NetApp, EMC
Server
HP OV / Sitescope,
SCOM, Nagios, Tivoli,
BMC Patrol, CA UIM
74%
-36%
ApplicationLayer
Synthetic APM
AppD, New Relic,
Dynatrace, HP APM, CA,
IBM, Appica
Byte Code Instrumentation
AppD, New Relic,
Dynatrace, HP Diag, CA
Wily
Adaptive Thresholding
HP SHA, BMC Proactive
Net, Netuitive, Preelert
HP Run-Time Service Model
CA Service Operations Insight
IBM NetCool/Omnibus
Service Model definition
& Correlation Engine
Business Layer
Aggregation/Correlation/Visualization
Service Layer
Challenges
• Too many disparate components
• Difficult to define Service Model
• Labor intensive
• Most implementations fail
• Very important source is
missing! (machine data)
Data Approach With Splunk>
Network
InfrastructureLayer
Packet, Payload, Traffic,
Utilization, Perf
Storage
Utilization, Capacity,
Performance
Server
Performance, Usage,
Dependency
74%
-36%
ApplicationLayer
Synthetic APM
Availability, Capacity,
User Experience
Byte Code Instrumentation
Usage, Experience,
Performance, Quality
Adaptive Thresholding
Apps, Services, Systems
Splunk> is the missing link
• Data Fidelity
• Single Repository for ALL data
• Easier to Manage Services
• Reduced Integrations
• Reduced Point Solutions
• Collaborative Approach
• Quick time to value
MACHINE DATA
Data Fabric Platform
Service Intelligence
Disruptive Approach to Unstructured Data
Structured
RDBMS
SQL Search
Schema at Write Schema at Read
Traditional Splunk
ETL Universal Indexing
10
Volume Velocity Variety
Unstructured
Listen to your data
Let’s take a closer look at IT troubleshooting with Splunk
11
Machine learning-powered analytics for real-time service
insights, simplified operations and root-cause isolation
Splunk IT Service Intelligence
Data-driven service monitoring and analytics
13
SPLUNK IT SERVICE INTELLIGENCE
Time-Series Index
Platform for Machine Data
Dynamic
Service Models
Schema-on-Read Data Model
Common
Information Model
At-a-Glance
Problem Analysis
Early Warning
on Deviations
Event Analytics
Simplified Incident
Workflows
The possibilities for Business…
The possibilities for IT Operations…
Service Health
What is a Service?
Service
Requests
Responses
In ITSI, a Service is a logical group of technology components that a user
deems need to be monitored together.
It can often be generalized as a “black box” which we send requests, and
expect responses
17
What is a Service?
DNS
Requests
Responses
Technical Services
Auth
Requests
Responses
Web
Requests
Responses
Services can be lower level (technical) …
18
What is a Service?
DNS
Requests
Responses
Technical Services
Order Entry
Volume
Revenue
Business Services
Auth
Requests
Responses
Web
Requests
Responses
Customer
Care
Requests
SLA Compliance
Services can also be higher level (business) …
19
What is a Service?
Packet Network
Hypervisor and Hosts
RBMDBs
Storage Tier
API Services
Web Services
CustomerTransactions
Mobile
API/Middleware
BusinessFunction
DNS
Services can encompass multiple tiers of the IT domain.
Services may also depend upon other services
20
What is a KPI?
DNS
KPI: Request volume
KPI: Error rate
KPI: Average response time
KPI: Server CPU load
KPI: Configuration changes
Customer
Transactions
KPI: Transaction volume
KPI: Error rate
KPI: Average response time
KPI: Max response time
KPI: Count of Change records
KPIs and Health scores constitute the means by which
Services are monitored.
21
Business
Function
KPI: Business volume
KPI: Error rate
KPI: Revenue rate
KPI: Conversion rate
KPI: Count of Incident tickets
Key Performance Indicators (KPIs)
22
A Key Performance Indicator (KPI) is powered by a Splunk search in ITSI that
monitors a specific attribute like CPU utilization, Response Time, Number of
Errors and so on. KPIs are contained within Services to measure their health.
Service Health Scores
23
A Health score is a score form 0-100 (0 being critical and 100 being normal)
that measures the health of a Service. It is calculated based on all KPIs
importance and its status (e.g. green, orange, red), once every minute.
Splunk IT Service Intelligence
Let’s take a closer look at Service Intelligence with Splunk
24
Service Intelligence
Design Practices
25
Bring Subject
Experts Together
Design Before
Configuring
Best Practices for Service Intelligence
Start With a
Problem Worth
Solving
Start With A Problem Worth Solving
Review your organization’s critical services
Identify a service that has impactful and measurable
challenges
Buttercup Games – How Can We Help?
Manufacturer of toys and games
Desire to improve supply chain efficiency and customer satisfaction
New online store has issues that impact customer experience and revenue
The Business Problem for Buttercup Games
Supply
Chain
Limited
Visibility
Frequent
Bottlenecks
ERP
Systems
Business
Impact
$48,000/wk in
revenue loss
War rooms
32 hrs/wk
??
?
Failed
Interactions
Online
Store
Poor Customer
Satisfaction
Bring Subject Experts Together
Identify stakeholders and support personnel for the
selected service
Create awareness and invite their collaboration to solve
the business challenge
Your Service IntelligenceCollaborators
31
Service Owners
• Business
functions
• Performance
indicators
• Common
business issues
• Frequency of
issues
• Business impact
of issues
Operations and
Support
• Common issues
• Performance
indicators
• Resolution
processes
• Tools used for
resolving issues
• Frequency of
issues
• IT impact of
issues
Enterprise
Architecture
• Business
processes
• Key inputs and
outputs
• Technology
architecture
• Data
architecture
• Common issues
Administrators
• Current tools
and usage, and
adoption levels
• Splunk expertise
• Environment
expertise
• Personal pain
Design Before Configuring
Identify pains, performance indicators
and measurement goals for the service
Identify components and data
needed to drive service insights
Consolidate the mappings into
an enterprise process/IT services map
Service Intelligence Goals for Buttercup Games
Supply
Chain
Limited
Visibility
Frequent
Bottlenecks
ERP
Systems
Business
Impact
$48,000/wk in
revenue loss
War rooms
32 hrs/wk
??
?
Failed
Interactions
Online
Store
Poor Customer
Satisfaction
GOAL 1
Continuous improvement
through visibility to key
indicators of supply chain
performance
GOAL 2
Increase customer satisfaction and reduce
cost through fewer failures and restoration
activities
Service Intelligence Design – Buttercup Games
Infrastructure Layer
Application Layer
Business Layer
Service Layer
Order Entry Manufacturing Shipping Fulfillment
Supply Chain
Online Store EDI
Web Tier Middleware
• Total Orders
• Total Revenue
• Unit Count
• Unit Failures
• Service Level • Delivery Time
• Online Orders
• Online Revenue
• Response Time
• ServiceHealth
• Incidents/Changes
• Customer Satisfaction
• HTTP Hits
• Error Rate
• CPU Load
• Memory Used
• Disk Used
• IO Latency
• CPU Load
• Memory Used
• Disk Used
• IO Latency
• Response Time
• Error Rate
• Response Time
• Storage Free
Service Decomposition
InfrastructureLayer
Power/Cooling/Facilities
Server–Networking–Storage
ServiceLayer BusinessService
ApplicationLayer
Middleware–ApplicationServer-Database
CustomApps
BusinessLayer
MailTransport-OrderProcessing
E-Commerce-Financials
Service Intelligence Design in ITSI
1. High-value business services
• Buttercup Games Online Store and Supply Chain
2. Major business functions
• Order Entry, Manufacturing, Shipping Fulfillment
3. Supporting services
• Web, Middleware, Database
4. Relevant KPIs for each service
• Database:, errors, SQL hits, …)
5. Splunk search for each KPI
• (index=DB (warn* OR error*) | stats count)
36
Service Decomposition – Buttercup Games
Infrastructure Layer
Application Layer
Business Layer
Service Layer
Order Entry Manufacturing Shipping Fulfillment
Supply Chain
Online Store EDI
Web Tier Middleware
Putting It All Together
Infrastructure Layer
Application Layer
Business Layer
Service Layer
Order Entry Manufacturing Shipping Fulfillment
Supply Chain
Online Store EDI
Web Tier Middleware
• Total Orders
• Total Revenue
• Unit Count
• Unit Failures
• Service Level • Delivery Time
• Online Orders
• Online Revenue
• Response Time
• ServiceHealth
• Incidents/Changes
• Customer Satisfaction
• HTTP Hits
• Error Rate
• CPU Load
• Memory Used
• Disk Used
• IO Latency
• CPU Load
• Memory Used
• Disk Used
• IO Latency
• Response Time
• Error Rate
• Response Time
• Storage Free
Typical Data Sources
Infrastructure Layer
Application Layer
Business Layer
Service Layer
Order Entry Manufacturing Shipping Fulfillment
Supply Chain
Online Store EDI
Web Tier Middleware
• Application Logs
• Corporate Databases
• Service Management
• Application Logs
• Webserver Logs
• DB Perf Counters
• Wire data
• Perf Counters
• Access Logs
• Network Logs
Copyright © 2016 Splunk Inc.
Let’s Play!
Setting up Service Intelligence
Service Visibility in ITSI
41
CLICK
“Glass Tables”
Service Visibility in ITSI
42
CLICK (open in new tab)
“Buttercup Games
Business Process (IN
PROGRESS)”
Service Visibility in ITSI
43
CLICK (open in new tab)
“Buttercup Games
Online Store”
Goal 1: Supply Chain Visibility
44
Goal 2: Online Store Process Flow
45
New Requirements!
46
● Create a new KPI for the DB Service:
● Network Utilization
● Modify the Executive Glass Table
in order to show off the services
you slave over
“WE only have about 15min
TO DO WHAT ???!!???”
Think about how long this
would take you today?
47
Configuration of DB Service
Click Configure >
Click Services
Let’s Talk Entities
48
● Select DB Service
● Entities are the relevant things which support
this service (usually hosts)
● Select the right entries with filters, ANDs, ORs
● Original Entity list can come from CMDB,
spreadsheet, Splunk search, others
A KPI in 5 minutes? Absolutely!
49
Click New – Generic KPI
Select Data Model
● Host Operating System
● Network
● # bytes
● Next
Call it “Network Utilization”,
with your username up front
KPIs Continued….
50
Splunk Builds Searches for you –
Oh Yeah, that’s happening 
● Select Yes for Split by & Filter options
● Select host for Entity Lookup & Alias options
● Click Next
Almost There…
51
Select
● KPI Search Schedule: Every Minute
● Entity Calculation: Average
● Service/Agg Calculation: Average
● Calculation Window: Last Minute
● Click Next
● Unit: Bps
● Click Next
Final Steps …
52
Set your thresholds:
● Aggregate (All)
● Per Entity
● Click “Add Threshold” TWICE
● Make the Neapolitan ice cream colors
Yellow, Green, Yellow
● Drag the sliders around in order to get
the current data graph entirely inside the
Green (normal) band
● Click Finish
● Other options are also available,
including adaptive thresholds and
anomaly detection
Adaptive Thresholds
53
What if your KPI data looks like this?
54
Adaptive Thresholds
Static thresholds will not work…
55
Adaptive Thresholds
Adaptive Thresholding works beautifully with cyclical (and other dynamic) data
Anomaly Detection
56
● Machine Learning
● Works well for data with patterns
● Requires some “training” (trial & error)
to zero in on best sensitivity
● More sophisticated capabilities coming!
(multivariate, more algorithms, etc)
Let’s Fix that Glass Table
57
Clone the Glass Table
58
Return to Saved Glass Tables page
(click on Glass Tables in the upper menu bar)
CLICK Edit for “Buttercup Games Business Process (IN
PROGRESS)”
• Select Clone
• Title: Add your username
to the front
• Permissions: Shared in App
• Click Clone Page
• Click on your new Glass Table
from the list, to view it
Edit & Have Fun!
59
Click on Edit in the upper right corner of your Glass Table
Use the “Services” panel on the left to select Individual KPIs,
or Aggregate Service Health Scores
• Choose 2 KPIs from Online Store that would be useful in
the “Order Process” section
• Drag the selected widgets onto the canvas, positioning in
the gray oval
• What’s the difference between the
and tools at the top left?
More Fun with the Glass Table Editor…
60
Use the Configurations panel on the right to edit a
selected widget
• Can change the visualization type, drilldown
behavior, and other settings
• You should hit Save frequently
• Revert All Changes can be helpful, occasionally
Finishing up …
61
• Add a ServiceHealthScore widget for Online
Store under Buttercup
• Choose a Viz Type with a sparkline graph, then
resize to make it look pretty
• Modify the Custom Drilldown action to go to
the saved glass table,
Buttercup Games Online Store
• Bonus Points: Make the label bigger, more
readable
• Click Save
• View when done
Copyright © 2016 Splunk Inc.
Let’s Play!
A Troubleshooting Exercise
63
Let’s use ITSI to troubleshoot an outage
● Start at your Glass Table, “<UserName> Buttercup Business Process”
● Customer Care reports that unhappy customers are complaining of failures
and long delays when trying to purchase
● The calls began coming in at around the top of the last hour.
● In the upper right corner of the Glass Table, change the time picker from Now
to XX:00:00.0, where XX is the previous hour. For example, if it is currently
14:05, set the time picker to 13:00:00.0, then Apply
● This is how we can “time travel” back to see conditions at a particular
outage– oh yeah!
A Troubleshooting Exercise, cont’d
64
● The Online Store seems to be degraded, just as Customer Care reported.
Click on the widget under Buttercup to drill down further
A Troubleshooting Exercise, cont’d.
65
● The Online Store Glass Table shows a much more detailed view, including the impacted customer-facing KPIs
at the far left (Revenue, etc)
● Based on this view of all the relevant
services, where do you think the root cause
lies?
● Which service should we troubleshoot first?
● Click on Health widget for that service, to
drill down to a Deep Dive
Deep Dive
66
● Deep Dive shows multiple KPIs and Health Scores in parallel “swim
lanes”.
● The Health Score for this Service is the top swim lane. Can you see
when it begins to degrade from 100%?
● Mousing over this point in time, can you spot the KPI with the
leading fault indication, i.e., what failed first?
● To improve readability, make sure the
Primary Time Range (lower left corner) is
set to Presets > Last 60 minutes
Multi-KPI Alerts and Notable Events
67
● Click on Notable Events Review
● Multiple KPIs and Healthscores can
be combined in sophisticated ways
to create Multi-KPI alerts
● When a Multi-KPI alert fires, one
of the outcomes is the creation of
a Notable Event
● Notable Events allow NOC
personnel and others to triage and
coordinate event management
efforts
Service Analyzer
68
● Click on Service Analyzer > Default Service Analyzer
● Back where we started!
● This view shows a “no-frills” list of
services (top) and hottest KPIs
(bottom)
● Provides access into Service Details
● It is useful for NOCs and others
who need a high-level situational
view
Copyright © 2016 Splunk Inc.
Let’s Play!
Advanced Exercises
Summary
70
● High-value services can be decomposed and modeled in ITSI, using machine data
from the relevant systems
● Services and KPIs can be created in minutes, with sophisticated thresholding
techniques to distinguish “normal” from “not normal”
● Glass Tables allow service health and KPI metrics to be displayed in a way that
makes sense to specific groups, such as Executive Leadership, Business Service
Owners, the NOC, DevOps & Others
● Deep Dives allow KPIs to be compared side-by-side across any time range,
accelerating root cause analysis and significantly reducing MTTR
● Multi-KPI Alerts and Notable Events reduce alert noise, producing actionable
events and a means to manage them
● … and it’s fast+fun to build!
What our ITSI
Customers are
doing
Splunk IT Service Intelligence
Machine Learning-Powered, Analytics-Driven IT Operations
Simplify service operations
Prioritize incidents with context Redefine the role of IT
Combine events & metrics
across silos with ease,
flexibility & scale in days
Unify siloed monitoring
Leverage machine learning to
detect anomalies & highlight
events that matter
Deliver business & service context to prioritize
incident investigation & action
Support decisions & communicate results
with powerful service-level insights
73
Healthcare
Operations
http://convergingdata.com
Process Optimization Example
Call Center Service
Service Health Transactions
ACD Analysis – Core Splunk
Call Wait History
Inbound Analysis
Social Media
Online Msg
Social Media
Mail SupportVOIP Service
Inbound Calls
76
End User Experience for Streaming Video
Whatever This Is
77
CIO Scorecard
Enterprise Service Status Major Incidents
Service Health
Continuous Operational Visibility
Volume Revenue Incidents Changes
Major Changes
Service Health Volume Revenue Incidents Changes
Service Health Volume Ontime DeliveryIncidents Changes Service Health VolumeRevenue Incidents Changes
Service Health Volume Revenue Incidents Changes Container UtilService Health Throughput Incidents Changes
Business Operations Center
• Modeled after your Security, Network, and IT Operations Centers
• Monitoring and diagnosis of important ecommerce and brick and mortar operations
• Builds on monitoring and alerting you may already be doing in your network and security operations
centers
• Enhanced with process insight from end-to-end, alerts, machine learning and real-time response
NOC
SOC
BOC
Sign Up Now – We’re here to help!
Harness the creativity and domain knowledge of your organization
to unlock the value of data and solve an important Business
Service problem through a joint service intelligence workshop
with key stakeholders
Define methods for:
› Proactive service monitoring
› Reduced risk and failures
› Faster issue resolution
› Increased business performance
What is it?
› 1 Day Onsite Workshop
› Tightly linked with value
› Collaborative approach
› Build your own Glass Table
Our Workshop InAction
Bring your subject
experts together
Conduct a Service
Intelligence
workshop
YourMission,shouldyouchoosetoacceptit…
Find a problem
worth solving in
your enterprise
Reference Stuff
83
● ITSI Guidebook: In your ITSI instance:
Search -> Dashboards -> ITSI Sandbox Guide
● ITSI Documentation:
http://docs.splunk.com/Documentation/ITSI
Thank You

Building Service Intelligence with Splunk IT Service Intelligence (ITSI)

  • 1.
    Setup Before YouCan Play 1. Download this presentation slide deck: https://splunk.box.com/v/ITSI-HandsOn-Calgary 2. If you have not done so already, Sign up for the FREE Splunk ITSI Online Sandbox: • http://splunk.com/itsi • Select "Free Online Sandbox" 3. Please test access to your sandbox; • Chrome, Firefox, Safari are recommended; • IE is NOT recommended 4. After logging in, select IT Service Intelligence from the list of apps at the left 1
  • 2.
    Copyright © 2016Splunk Inc. Building Business Service Intelligence with Splunk IT Service Intelligence Stuart Ainsworth IT Operations Specialist Thursday October 20, 2016 WiFi: Marriott_CONFERENCE / splunk Julian Andre Sales Engineer
  • 3.
    Agenda 3  Introductions andSet Up  Splundamentals – IT Troubleshooting with Splunk  What is IT Service Intelligence?  Service Intelligence Design Practices  Let's Play!  What's Next?  Happy Hour!
  • 4.
    Safe Harbor Statement Duringthe course of this presentation, we may make forward looking statements regarding future events or the expected performance of the company. We caution you that such statements reflect our current expectations and estimates based on factors currently known to us and that actual events or results could differ materially. For important factors that may cause actual results to differ from those contained in our forward-looking statements, please review our filings with the SEC. The forward-looking statements made in this presentation are being made as of the time and date of its live presentation. If reviewed after its live presentation, this presentation may not contain current or accurate information. We do not assume any obligation to update any forward looking statements we may make. In addition, any information about our roadmap outlines our general product direction and is subject to change at any time without notice. It is for informational purposes only and shall not be incorporated into any contract or other commitment. Splunk undertakes no obligation either to develop the features or functionality described orto includeany suchfeatureor functionalityina futurerelease. 4
  • 5.
    What is ServiceIntelligence? Enabling a business-aware IT Measuring and reporting on indicators that matter Unlocking operational efficiencies Collaborating across silos to improve service operations Using data-driven decision making Solving problems and anticipating pitfalls with sophisticated analytics and powerful insights from machine data
  • 6.
    Key Takeaways 1 Buildon what you are already doing with Splunk Service Intelligence design and configuration practices 3 What is possible with Splunk IT Service Intelligence
  • 7.
  • 8.
    Traditional Methods Network InfrastructureLayer HP NNMi,HP NA, Solar Winds, CA Spectrum, Storage HP Storage Operations, NetApp, EMC Server HP OV / Sitescope, SCOM, Nagios, Tivoli, BMC Patrol, CA UIM 74% -36% ApplicationLayer Synthetic APM AppD, New Relic, Dynatrace, HP APM, CA, IBM, Appica Byte Code Instrumentation AppD, New Relic, Dynatrace, HP Diag, CA Wily Adaptive Thresholding HP SHA, BMC Proactive Net, Netuitive, Preelert HP Run-Time Service Model CA Service Operations Insight IBM NetCool/Omnibus Service Model definition & Correlation Engine Business Layer Aggregation/Correlation/Visualization Service Layer Challenges • Too many disparate components • Difficult to define Service Model • Labor intensive • Most implementations fail • Very important source is missing! (machine data)
  • 9.
    Data Approach WithSplunk> Network InfrastructureLayer Packet, Payload, Traffic, Utilization, Perf Storage Utilization, Capacity, Performance Server Performance, Usage, Dependency 74% -36% ApplicationLayer Synthetic APM Availability, Capacity, User Experience Byte Code Instrumentation Usage, Experience, Performance, Quality Adaptive Thresholding Apps, Services, Systems Splunk> is the missing link • Data Fidelity • Single Repository for ALL data • Easier to Manage Services • Reduced Integrations • Reduced Point Solutions • Collaborative Approach • Quick time to value MACHINE DATA Data Fabric Platform Service Intelligence
  • 10.
    Disruptive Approach toUnstructured Data Structured RDBMS SQL Search Schema at Write Schema at Read Traditional Splunk ETL Universal Indexing 10 Volume Velocity Variety Unstructured
  • 11.
    Listen to yourdata Let’s take a closer look at IT troubleshooting with Splunk 11
  • 12.
    Machine learning-powered analyticsfor real-time service insights, simplified operations and root-cause isolation
  • 13.
    Splunk IT ServiceIntelligence Data-driven service monitoring and analytics 13 SPLUNK IT SERVICE INTELLIGENCE Time-Series Index Platform for Machine Data Dynamic Service Models Schema-on-Read Data Model Common Information Model At-a-Glance Problem Analysis Early Warning on Deviations Event Analytics Simplified Incident Workflows
  • 14.
  • 15.
    The possibilities forIT Operations… Service Health
  • 16.
    What is aService? Service Requests Responses In ITSI, a Service is a logical group of technology components that a user deems need to be monitored together. It can often be generalized as a “black box” which we send requests, and expect responses 17
  • 17.
    What is aService? DNS Requests Responses Technical Services Auth Requests Responses Web Requests Responses Services can be lower level (technical) … 18
  • 18.
    What is aService? DNS Requests Responses Technical Services Order Entry Volume Revenue Business Services Auth Requests Responses Web Requests Responses Customer Care Requests SLA Compliance Services can also be higher level (business) … 19
  • 19.
    What is aService? Packet Network Hypervisor and Hosts RBMDBs Storage Tier API Services Web Services CustomerTransactions Mobile API/Middleware BusinessFunction DNS Services can encompass multiple tiers of the IT domain. Services may also depend upon other services 20
  • 20.
    What is aKPI? DNS KPI: Request volume KPI: Error rate KPI: Average response time KPI: Server CPU load KPI: Configuration changes Customer Transactions KPI: Transaction volume KPI: Error rate KPI: Average response time KPI: Max response time KPI: Count of Change records KPIs and Health scores constitute the means by which Services are monitored. 21 Business Function KPI: Business volume KPI: Error rate KPI: Revenue rate KPI: Conversion rate KPI: Count of Incident tickets
  • 21.
    Key Performance Indicators(KPIs) 22 A Key Performance Indicator (KPI) is powered by a Splunk search in ITSI that monitors a specific attribute like CPU utilization, Response Time, Number of Errors and so on. KPIs are contained within Services to measure their health.
  • 22.
    Service Health Scores 23 AHealth score is a score form 0-100 (0 being critical and 100 being normal) that measures the health of a Service. It is calculated based on all KPIs importance and its status (e.g. green, orange, red), once every minute.
  • 23.
    Splunk IT ServiceIntelligence Let’s take a closer look at Service Intelligence with Splunk 24
  • 24.
  • 25.
    Bring Subject Experts Together DesignBefore Configuring Best Practices for Service Intelligence Start With a Problem Worth Solving
  • 26.
    Start With AProblem Worth Solving Review your organization’s critical services Identify a service that has impactful and measurable challenges
  • 27.
    Buttercup Games –How Can We Help? Manufacturer of toys and games Desire to improve supply chain efficiency and customer satisfaction New online store has issues that impact customer experience and revenue
  • 28.
    The Business Problemfor Buttercup Games Supply Chain Limited Visibility Frequent Bottlenecks ERP Systems Business Impact $48,000/wk in revenue loss War rooms 32 hrs/wk ?? ? Failed Interactions Online Store Poor Customer Satisfaction
  • 29.
    Bring Subject ExpertsTogether Identify stakeholders and support personnel for the selected service Create awareness and invite their collaboration to solve the business challenge
  • 30.
    Your Service IntelligenceCollaborators 31 ServiceOwners • Business functions • Performance indicators • Common business issues • Frequency of issues • Business impact of issues Operations and Support • Common issues • Performance indicators • Resolution processes • Tools used for resolving issues • Frequency of issues • IT impact of issues Enterprise Architecture • Business processes • Key inputs and outputs • Technology architecture • Data architecture • Common issues Administrators • Current tools and usage, and adoption levels • Splunk expertise • Environment expertise • Personal pain
  • 31.
    Design Before Configuring Identifypains, performance indicators and measurement goals for the service Identify components and data needed to drive service insights Consolidate the mappings into an enterprise process/IT services map
  • 32.
    Service Intelligence Goalsfor Buttercup Games Supply Chain Limited Visibility Frequent Bottlenecks ERP Systems Business Impact $48,000/wk in revenue loss War rooms 32 hrs/wk ?? ? Failed Interactions Online Store Poor Customer Satisfaction GOAL 1 Continuous improvement through visibility to key indicators of supply chain performance GOAL 2 Increase customer satisfaction and reduce cost through fewer failures and restoration activities
  • 33.
    Service Intelligence Design– Buttercup Games Infrastructure Layer Application Layer Business Layer Service Layer Order Entry Manufacturing Shipping Fulfillment Supply Chain Online Store EDI Web Tier Middleware • Total Orders • Total Revenue • Unit Count • Unit Failures • Service Level • Delivery Time • Online Orders • Online Revenue • Response Time • ServiceHealth • Incidents/Changes • Customer Satisfaction • HTTP Hits • Error Rate • CPU Load • Memory Used • Disk Used • IO Latency • CPU Load • Memory Used • Disk Used • IO Latency • Response Time • Error Rate • Response Time • Storage Free
  • 34.
  • 35.
    Service Intelligence Designin ITSI 1. High-value business services • Buttercup Games Online Store and Supply Chain 2. Major business functions • Order Entry, Manufacturing, Shipping Fulfillment 3. Supporting services • Web, Middleware, Database 4. Relevant KPIs for each service • Database:, errors, SQL hits, …) 5. Splunk search for each KPI • (index=DB (warn* OR error*) | stats count) 36
  • 36.
    Service Decomposition –Buttercup Games Infrastructure Layer Application Layer Business Layer Service Layer Order Entry Manufacturing Shipping Fulfillment Supply Chain Online Store EDI Web Tier Middleware
  • 37.
    Putting It AllTogether Infrastructure Layer Application Layer Business Layer Service Layer Order Entry Manufacturing Shipping Fulfillment Supply Chain Online Store EDI Web Tier Middleware • Total Orders • Total Revenue • Unit Count • Unit Failures • Service Level • Delivery Time • Online Orders • Online Revenue • Response Time • ServiceHealth • Incidents/Changes • Customer Satisfaction • HTTP Hits • Error Rate • CPU Load • Memory Used • Disk Used • IO Latency • CPU Load • Memory Used • Disk Used • IO Latency • Response Time • Error Rate • Response Time • Storage Free
  • 38.
    Typical Data Sources InfrastructureLayer Application Layer Business Layer Service Layer Order Entry Manufacturing Shipping Fulfillment Supply Chain Online Store EDI Web Tier Middleware • Application Logs • Corporate Databases • Service Management • Application Logs • Webserver Logs • DB Perf Counters • Wire data • Perf Counters • Access Logs • Network Logs
  • 39.
    Copyright © 2016Splunk Inc. Let’s Play! Setting up Service Intelligence
  • 40.
    Service Visibility inITSI 41 CLICK “Glass Tables”
  • 41.
    Service Visibility inITSI 42 CLICK (open in new tab) “Buttercup Games Business Process (IN PROGRESS)”
  • 42.
    Service Visibility inITSI 43 CLICK (open in new tab) “Buttercup Games Online Store”
  • 43.
    Goal 1: SupplyChain Visibility 44
  • 44.
    Goal 2: OnlineStore Process Flow 45
  • 45.
    New Requirements! 46 ● Createa new KPI for the DB Service: ● Network Utilization ● Modify the Executive Glass Table in order to show off the services you slave over “WE only have about 15min TO DO WHAT ???!!???” Think about how long this would take you today?
  • 46.
    47 Configuration of DBService Click Configure > Click Services
  • 47.
    Let’s Talk Entities 48 ●Select DB Service ● Entities are the relevant things which support this service (usually hosts) ● Select the right entries with filters, ANDs, ORs ● Original Entity list can come from CMDB, spreadsheet, Splunk search, others
  • 48.
    A KPI in5 minutes? Absolutely! 49 Click New – Generic KPI Select Data Model ● Host Operating System ● Network ● # bytes ● Next Call it “Network Utilization”, with your username up front
  • 49.
    KPIs Continued…. 50 Splunk BuildsSearches for you – Oh Yeah, that’s happening  ● Select Yes for Split by & Filter options ● Select host for Entity Lookup & Alias options ● Click Next
  • 50.
    Almost There… 51 Select ● KPISearch Schedule: Every Minute ● Entity Calculation: Average ● Service/Agg Calculation: Average ● Calculation Window: Last Minute ● Click Next ● Unit: Bps ● Click Next
  • 51.
    Final Steps … 52 Setyour thresholds: ● Aggregate (All) ● Per Entity ● Click “Add Threshold” TWICE ● Make the Neapolitan ice cream colors Yellow, Green, Yellow ● Drag the sliders around in order to get the current data graph entirely inside the Green (normal) band ● Click Finish ● Other options are also available, including adaptive thresholds and anomaly detection
  • 52.
    Adaptive Thresholds 53 What ifyour KPI data looks like this?
  • 53.
  • 54.
    55 Adaptive Thresholds Adaptive Thresholdingworks beautifully with cyclical (and other dynamic) data
  • 55.
    Anomaly Detection 56 ● MachineLearning ● Works well for data with patterns ● Requires some “training” (trial & error) to zero in on best sensitivity ● More sophisticated capabilities coming! (multivariate, more algorithms, etc)
  • 56.
    Let’s Fix thatGlass Table 57
  • 57.
    Clone the GlassTable 58 Return to Saved Glass Tables page (click on Glass Tables in the upper menu bar) CLICK Edit for “Buttercup Games Business Process (IN PROGRESS)” • Select Clone • Title: Add your username to the front • Permissions: Shared in App • Click Clone Page • Click on your new Glass Table from the list, to view it
  • 58.
    Edit & HaveFun! 59 Click on Edit in the upper right corner of your Glass Table Use the “Services” panel on the left to select Individual KPIs, or Aggregate Service Health Scores • Choose 2 KPIs from Online Store that would be useful in the “Order Process” section • Drag the selected widgets onto the canvas, positioning in the gray oval • What’s the difference between the and tools at the top left?
  • 59.
    More Fun withthe Glass Table Editor… 60 Use the Configurations panel on the right to edit a selected widget • Can change the visualization type, drilldown behavior, and other settings • You should hit Save frequently • Revert All Changes can be helpful, occasionally
  • 60.
    Finishing up … 61 •Add a ServiceHealthScore widget for Online Store under Buttercup • Choose a Viz Type with a sparkline graph, then resize to make it look pretty • Modify the Custom Drilldown action to go to the saved glass table, Buttercup Games Online Store • Bonus Points: Make the label bigger, more readable • Click Save • View when done
  • 61.
    Copyright © 2016Splunk Inc. Let’s Play! A Troubleshooting Exercise
  • 62.
    A Troubleshooting Exercise 63 Let’suse ITSI to troubleshoot an outage ● Start at your Glass Table, “<UserName> Buttercup Business Process” ● Customer Care reports that unhappy customers are complaining of failures and long delays when trying to purchase ● The calls began coming in at around the top of the last hour. ● In the upper right corner of the Glass Table, change the time picker from Now to XX:00:00.0, where XX is the previous hour. For example, if it is currently 14:05, set the time picker to 13:00:00.0, then Apply ● This is how we can “time travel” back to see conditions at a particular outage– oh yeah!
  • 63.
    A Troubleshooting Exercise,cont’d 64 ● The Online Store seems to be degraded, just as Customer Care reported. Click on the widget under Buttercup to drill down further
  • 64.
    A Troubleshooting Exercise,cont’d. 65 ● The Online Store Glass Table shows a much more detailed view, including the impacted customer-facing KPIs at the far left (Revenue, etc) ● Based on this view of all the relevant services, where do you think the root cause lies? ● Which service should we troubleshoot first? ● Click on Health widget for that service, to drill down to a Deep Dive
  • 65.
    Deep Dive 66 ● DeepDive shows multiple KPIs and Health Scores in parallel “swim lanes”. ● The Health Score for this Service is the top swim lane. Can you see when it begins to degrade from 100%? ● Mousing over this point in time, can you spot the KPI with the leading fault indication, i.e., what failed first? ● To improve readability, make sure the Primary Time Range (lower left corner) is set to Presets > Last 60 minutes
  • 66.
    Multi-KPI Alerts andNotable Events 67 ● Click on Notable Events Review ● Multiple KPIs and Healthscores can be combined in sophisticated ways to create Multi-KPI alerts ● When a Multi-KPI alert fires, one of the outcomes is the creation of a Notable Event ● Notable Events allow NOC personnel and others to triage and coordinate event management efforts
  • 67.
    Service Analyzer 68 ● Clickon Service Analyzer > Default Service Analyzer ● Back where we started! ● This view shows a “no-frills” list of services (top) and hottest KPIs (bottom) ● Provides access into Service Details ● It is useful for NOCs and others who need a high-level situational view
  • 68.
    Copyright © 2016Splunk Inc. Let’s Play! Advanced Exercises
  • 69.
    Summary 70 ● High-value servicescan be decomposed and modeled in ITSI, using machine data from the relevant systems ● Services and KPIs can be created in minutes, with sophisticated thresholding techniques to distinguish “normal” from “not normal” ● Glass Tables allow service health and KPI metrics to be displayed in a way that makes sense to specific groups, such as Executive Leadership, Business Service Owners, the NOC, DevOps & Others ● Deep Dives allow KPIs to be compared side-by-side across any time range, accelerating root cause analysis and significantly reducing MTTR ● Multi-KPI Alerts and Notable Events reduce alert noise, producing actionable events and a means to manage them ● … and it’s fast+fun to build!
  • 70.
  • 71.
    Splunk IT ServiceIntelligence Machine Learning-Powered, Analytics-Driven IT Operations Simplify service operations Prioritize incidents with context Redefine the role of IT Combine events & metrics across silos with ease, flexibility & scale in days Unify siloed monitoring Leverage machine learning to detect anomalies & highlight events that matter Deliver business & service context to prioritize incident investigation & action Support decisions & communicate results with powerful service-level insights
  • 72.
  • 73.
  • 74.
    Call Center Service ServiceHealth Transactions ACD Analysis – Core Splunk Call Wait History Inbound Analysis Social Media Online Msg Social Media Mail SupportVOIP Service Inbound Calls
  • 75.
    76 End User Experiencefor Streaming Video
  • 76.
  • 77.
    CIO Scorecard Enterprise ServiceStatus Major Incidents Service Health Continuous Operational Visibility Volume Revenue Incidents Changes Major Changes Service Health Volume Revenue Incidents Changes Service Health Volume Ontime DeliveryIncidents Changes Service Health VolumeRevenue Incidents Changes Service Health Volume Revenue Incidents Changes Container UtilService Health Throughput Incidents Changes
  • 78.
    Business Operations Center •Modeled after your Security, Network, and IT Operations Centers • Monitoring and diagnosis of important ecommerce and brick and mortar operations • Builds on monitoring and alerting you may already be doing in your network and security operations centers • Enhanced with process insight from end-to-end, alerts, machine learning and real-time response NOC SOC BOC
  • 79.
    Sign Up Now– We’re here to help! Harness the creativity and domain knowledge of your organization to unlock the value of data and solve an important Business Service problem through a joint service intelligence workshop with key stakeholders Define methods for: › Proactive service monitoring › Reduced risk and failures › Faster issue resolution › Increased business performance What is it? › 1 Day Onsite Workshop › Tightly linked with value › Collaborative approach › Build your own Glass Table
  • 80.
  • 81.
    Bring your subject expertstogether Conduct a Service Intelligence workshop YourMission,shouldyouchoosetoacceptit… Find a problem worth solving in your enterprise
  • 82.
    Reference Stuff 83 ● ITSIGuidebook: In your ITSI instance: Search -> Dashboards -> ITSI Sandbox Guide ● ITSI Documentation: http://docs.splunk.com/Documentation/ITSI
  • 83.

Editor's Notes

  • #2 FOR THE PRESENTER: This slide is a good one to leave up initially, as the students file in to the room. Encourage the students to log in to their assigned VMs early, as they’re filing in to the room. Encourage students to download the presentation deck, so that they can follow along locally, and can “catch up” if necessary. This exercise will require students to toggle between looking up at the Big Screen, and down at their own screen. You, the presenter, should be as clear as possible as to what “mode” the students should be in. I.e., “Please look up here for a few minutes”, or “you will be working with your own instance for the next section…”, etc. This deck provides explicit, click-by-click instructions on how to do the various exercises. During those sections, I recommend that you NOT use the slides– instead, toggle to your own live Splunk instance and perform the exercise as the students should be doing, while talking through your actions, pausing on menu pull-downs, etc. Slow down!
  • #4 Here is a 3.5-hr schedule: 00:00     (slides 1-6) Introductions and Setup 00:07     (slides 7-11) Splundamentals -- Core Splunk in IT Ops 00:15     IT Troubleshooting Demo 00:25 (slides 12-24) Splunk IT Service Intelligence (ITSI) 00:45     ITSI Tour 00:55     BREAK   01:00     (slides 25-39) Service Intelligence Design Practices 01:20     (slides 40-62 / demo) Let's Play – Setting up Service Intelligence 01:55     BREAK   02:00     (slides 62-67 / demo) Let’s Play -Troubleshooting exercise 02:15     (demo) Advanced Exercise #1 - Create a SmartPhone Service 02:15     (demo) explore the 'sourcetype=mint:network' data; what KPIs are possible? 02:20     (demo) Create new service ("SmartPhone"), create 3 KPIs 02:35     BREAK   02:40 Advanced exercises continued 02:40     (demo) Modify 'Online Store' GT to add the new service 02:45     (demo) Advanced Exercise #2 - Show Adaptive Thresholding 02:47     (demo) Advanced Exercise #3 - Show Anomaly Detection 02:50     (slide 70) Summary 02:55     BREAK   03:00 (slides 71-78) What our ITSI customers are doing 03:20     (slide 79-80 + sign up discussion) What is GTE?  Ideas for ITSI use cases? 03:25     (slides 81-82) Wrap up 03:30     DONE!
  • #5 Splunk safe harbor statement.
  • #6 So what is service intelligence? Service intelligence is the ability bring business-aware alignment and enablement to IT, which means the ability to monitor business and service activity using metrics and performance indicators that are aligned with strategic goals and objectives Service intelligence is also the ability to unlock operational efficiencies by answering unanticipated questions by merging, exploring and analyzing data across any data source and breaking down silos And continually using data and analytics to make fact-based rapid business decisions
  • #7 1. Just like the work on this slide, Traditional methods are becoming outdated, irrelevant, and used less and less over time. 2. Data analytics and using the power of information effectively, without dilution, with speed, with precision and
  • #8 This is the “IT Troubleshooting” demo, about 15-20 min Cover Splunk 101 basics
  • #9 Challenges – To many components – Most organizations have 3-5 tools for each of these areas – Do the integration math n(n-1) / 2 (Ex: 3 tools each area * 6 areas = 15 (14/2) = 105 Integration points) Difficult to define service – Must manual define service; must change definition if point solutions shift or information drifts Must have expertise in each of the tool areas to understand the metrics and events generation, how to federation, reconcile and analyze What about the machine data? What if important information is lost in translation – what we refer to as Data Fidelity.
  • #11 Traditionally, machine data was generated and part of the data would be stored in a specific, pre-defined way. This creates limits in the questions that can be asked of the data. Splunk takes a disruptive approach by storing the data in it’s raw, original format, and creates a schema at the last possible moment; when the question is asked. Because of this, there are no limits to the questions that can be asked of the data. Speaking of no limits… No limits on where you can collect it from No limits on the formats of data And no limits on scale   Some customers are indexing 100’s of TB per day, searching across thousands of types of data all in different formats. 
  • #13 That brings us to Splunk IT Service Intelligence – a packaged solution that enables real-time visibility into services driven by machine data. Splunk ITSI speeds and simplifies service monitoring and analytics and enables IT to make better, smarter and informed business decisions. This solution allows you to gain a deep understanding of your services. With Splunk ITSI, you have real-time views into the health of your services, and can use advanced analytics to find patterns, detect anomalies and trends to proactively monitor and address issues. As a result you have improved service visibility, reduced resolution times, and a transformative approach to monitoring and analytics driven by machine-data.
  • #14 With Splunk ITSI, customers get the higher level benefits based on the underlying platform. So, from deep-in-the-weeds solving IT operational use cases with Splunk enterprise, we’re up-leveling the use cases and making IT more relevant to the business. The can visualize meaningful and contextual data and inter-relationships with dynamic service models, organize and correlate performance indicators for at-a-glance problem analysis, get proactive with early warnings on anomalies, deviations and pre-configured correlated alerts, and simplify workflows.
  • #26 FOR THE PRESENTER: This entire Tour section should last no more than 10 min. Describe how GTs can show KPIs & health scores to any audience/group/team: Show GTs: Buttercup Games Business Process (executives, business service owners) On Line Transaction Service (NOC, Tier2); “can use visio diagrams…” Buttercup Games Online Store (service flow, sub-services) Show saved Deep Dive “DB Deep Dive”; BRIEFLY describe DD functionality (you will be able to go into more depth later) Show Notable Event Review, BRIEFLY describe (you will be able to go into more depth later) Show Service Analyzer, briefly describe Ask if the students have questions.
  • #27 Unlike the traditional approaches, starting with the business services eliminates irrelevant and distracting data by surgically focusing on critical elements important to the business. The benefits are immediate since we are: 1) Focusing on the service in the organization that is impactful and requires oversight. Think about a service in your organization that supports the business, it may maintain any number of metrics and can be measured to understand past, currently, and future performance 2) Bringing together subject matter experts who own and support the the service, exposing the tribal knowledge important for increased IT efficiency and leveraging the institutional knowledge within the organization and baking that experience into monitoring the service so that the next person you onboard or assign the monitoring task to doesn’t have to wake you in the middle of the night to determine what is going on. 3) Designing the service model and simplifying the metrics that are important in calculating overall health of a service and their supporting entities by only consuming metrics needed to support the service. Whether it is; a database, middleware, servers, networking, storage or even social media versus discovering and reconciling all of the information in a repeated and laborious exercise.
  • #28 Is it impactful, valuable measurable Drive decision making with quantifiable measurements How do you drive decisions to meet business needs What are the top business services in your enterprise? How do you measure the customer experience with these services? Are customers happy with their experience?
  • #29 Everyone at Splunk loves Buttercup our mascot. Buttercup Games manufactures stuffed toys and games. Let’s do a role play that uncovers the services important to the company and where there are problems worth solving. As a manufacturing company, the supply chain is extremely important. It’s a system that allows us to track the flow of good. So, making sure that
  • #31 How often do customers experience issues with the service? When issues arise, who gets involved in resolving them? How do teams work together to resolve issues? Evaluate the performance of a process or a service – the measurements can be based upon the effectiveness (business value derived) or efficiency (how quickly the service is delivered) Identify pains, performance indicators and measurement goals for the service Develop an end-to-end map of the services
  • #32 Titles for monitoring tools manager Put people pictures next to them (map to Marc Olesen, Ravi Anandawalla, John Butler)
  • #33 What components do we need to include in the service; db, middleware What data is needed to drive the metrics Meet with business leaders, and their teams, to review the consolidated mapping and modify as necessary
  • #37 In the “real world”, it will probably be necessary to iterate up & down these steps a few times. For example, what if a KPI requires data which is not being collected by Splunk?
  • #42 FOR THE PRESENTER: The next three slides set the students up for decomp discussion, later. GOALS: Get the students to open two specific GTs in separate browser tabs.
  • #43 These actions set the student up for decomp discussion, later
  • #44 These actions set the student up for decomp discussion, later
  • #45 TO STUDENTS: You have this glass table on your own system. This Glass Table shows the high-level business process for Buttercup Games. Does anyone notice anything missing? (no info in Order Entry) We need better visibility into our Online Store, which is part of the Order Entry process.
  • #46 TO STUDENTS: You have this glass table on your own system. This Glass Table shows a more detailed process flow for the Online Store service. Notice the sub-services which make up our Online Store service, and how the process flows.
  • #47 Based on a recent DB outage which was caused by a saturated network interface, we’ve decided that network utilization would be a handy KPI for our Database Service. We’re also going to tweak the high-level Business Process Glass Table to provide more visibility into the Online Store service. And we’re going to do it in 15 minutes!
  • #48 FOR THE PRESENTER: Remind the students that they can refer to their own locally-downloaded slides for “click-by-click” reference for the process of adding a KPI. Then switch to your own browser and demonstrate these steps “live”. Have fun with the concept that a roomful of people can build a new KPI in only a few minutes, and that “the clock is ticking”.
  • #49 FOR THE PRESENTER: SHORT discussion of entities
  • #50 FOR THE PRESENTER: Briefly cover “data model” vs “ad hoc search”. Don’t spend a lot of time here.
  • #51 FOR THE PRESENTER: Briefly cover the concepts on this page, and point how the “Generated Search” window at the bottom, and how cool it is that Splunk builds the search for you; does anyone in the audience have users who could benefit from this? QUICK TANGENT: In the typical working environment, which often has a chasm between the “Business Types” and the “Tech Types”, how long would it take to map services to actual infrastructure?  "Many quarters, and possibly a year-- on the conservative side, right?" To quantify that, by show of hands, has anyone here been involved in an IT Service Management / Business Management team trying to map every server to a service or business function?  Did you sustain any long-term injuries?  And even IF you are successful in this effort, as soon as you finish you have to start over. ITSI is remarkable because it can allow the Business teams and Technical teams to map out the important services realistically and effectively– in DAYS and WEEKS. We offer a Glass Table Workshop to facilitate such an exercise on YOUR services and YOUR data– in a single day.
  • #52 Keep moving…
  • #53 FOR THE PRESENTER: This might take a while for “waiting for data” to produce an actual graph for the students (1-2 minutes, typically). Instruct the students that if will take a couple of minutes for the data to appear, and to not click on anything in the meantime. Then skip to the Adaptive Thresholds and Anomaly Detection slides and discussion, while the students wait. Afterwards, can be helpful to gauge progress by asking for a show of hands to see how many students are still waiting. If necessary, simply show the students how to set thresholds (on your own browser), then move forward.
  • #54 FOR THE PRESENTER: Talk through-- NOT HANDS ON
  • #55 FOR THE PRESENTER: Talk through-- NOT HANDS ON
  • #56 FOR THE PRESENTER: Talk through-- NOT HANDS ON
  • #57 Talk through NOT WORK
  • #58 We’ve already discussed the high-level business process for Buttercup Games. We need better visibility into our Online Store, which is part of the Order Entry process.
  • #59 FOR THE PRESENTER: As before, switch to your own browser and demonstrate these steps “live”. Have fun with the concept of saving a copy before editing– so that you don’t muck it up.
  • #60 FOR THE PRESENTER: Have fun with this GT editor section. The GT editor is a bit twitchy, so exploit the humor and have fun with the students. GOALS (for the next 3 slides): Identify 2 “interesting/useful” KPIs from the Online Store service, to position in the gray “Order Entry” oval; let the students choose details and viz types Put a ServiceHealthScore widget (from Online Store) under the pony, to show overall health of the service. Modify “custom drilldown” to land on the “Buttercup Games Online Store” GT Encourage the students to use text boxes and other techniques to make the widget more readable, prettier to look at Remind the students that “the boss’ boss” will be looking at this GT, and we want to make sure that they’ve got good visibility into “our” service (Online Store).
  • #62 FOR THE PRESENTER: When finished (after everyone have hit ‘Save’ and ‘View’, and are looking at their own beautiful GTs): How long did it take to create a new KPI and make major changes to a Glass Table? Pretty cool! Ask the students if this (ITSI) could be useful in their own environments If you have more than 15 min of remaining time, speak through some actual (referenceable) customer ITSI use cases.
  • #64 FOR THE PRESENTER: This hands-on section can be very powerful for the students. This allows them to “put it all together”, driving ITSI with their own fingers. As before, switch to your own browser and demonstrate these troubleshooting steps “live”. The corresponding slides are intended as reference for the students. If pressed for time (i.e., less than about 10 min), talk through and show this process– but don’t have the students attempt to “click along” in real time.
  • #65 If pressed for time, talk through and show this process– but don’t have the students attempt to “click along” in real time
  • #66 Note that this “drill down” has inherited the same time selection (i.e., an earlier outage)– pretty cool! FOR THE PRESENTER: The major points here: During the heat of battle, when troubleshooting an outage, being able to visualize the entire service flow is extremely valuable By being able to see health status of all the underlying services, we can quickly choose where and how best to proceed. Potentially huge time savings– customers report major reductions in MTTR
  • #67 FOR THE PRESENTER: This is a good “variable time” section. You can spend as little or as much time as you choose, depending on how much time you have remaining in the session. Remind the students that they will have more time to play with DD later (yes, they might be confused by this, since only a few minutes remain in the session)
  • #68 FOR THE PRESENTER: This is another good “variable time” section. You can spend as little or as much time as you choose, depending on how much time you have remaining in the session. Remind the students that they will have more time to play with this stuff later (yes, they might be confused by this, since only a few minutes remain in the session)
  • #70 If time permits, try some or all of these: Create a new service based on app data coming from the customers’ smartphones (sourcetype="mint:network”) No identified entities, though we will show “pseudo entities” KPI 1: Total hits (sourcetype="mint:network" | stats count) KPI 2: Errors by device type (sourcetype="mint:network" statusCode>399 | stats count by device) KPI 3: Latency by carrier (sourcetype="mint:network" | eval latency=(latency/1000) | stats avg(latency) by device) (Show pseudo-entities in Service Details) Add the new service to the “Online Store” GT Show students how to access & play with Adaptive Thresholds in Configure Services -> Web Service -> Corporate Web Requests Show students how to access & play with Anomaly Detection in Configure Services -> Web Service -> CPU % Show students more details about modules, through Service Details Create a new GT, using a customer diagram as the background Use existing services & KPIs as mockups, renaming the widgets to fit the customer’s environment
  • #81 For the Presenter: After describing what a Glass Table Exercise is, and how they could benefit from one, ask for use cases that they think could benefit from ITSI. Try to get a room discussion going.