Download as PDF, PPTX
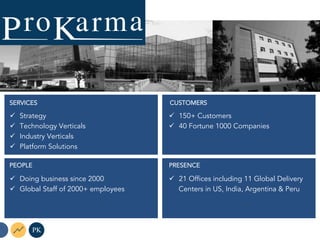


This document provides an overview of Prokarma Inc., a technology company that offers data science and machine learning services. It discusses Prokarma's strategy, technology and industry verticals, platform solutions, global presence with 21 offices and 11 delivery centers, large customer base of over 150 customers including 40 Fortune 1000 companies, and workforce of over 2000 employees.


![谷歌留痕技术教程[ 𝙩𝙤𝙥 𝟮𝟯𝟯. 𝙘 𝙤𝙢 ]](https://cdn.slidesharecdn.com/ss_thumbnails/top233-260130173900-2eb784f9-thumbnail.jpg?width=640&height=640&fit=bounds)


