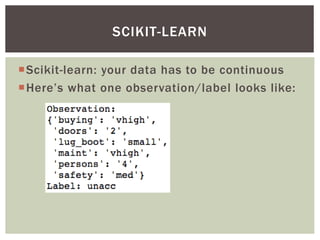
Sarah Guido
@sarah_guido
Reonomy
PYTN 2015
ANALYZING DATA WITH
PYTHON
Data scientist at Reonomy
University of Michigan graduate
NYC Python organizer
PyGotham organizer
ABOUT ME
Bird’s-eye overview: not comprehensive
explanation of these tools!
Take data from start-to-finish
Preprocessing: Pandas
Analysis: scikit-learn
Analysis: nltk
Data pipeline: MRjob
Visualization: ggplot
What next?
ABOUT THIS TALK
So many tools
Preprocessing, analysis, statistics, machine learning,
natural language processing, network analysis,
visualization, scalability
Community support
“Easy” language to learn
Both a scripting and production-ready
language
WHY PYTHON?
How to find the best tool(s)?
The 90/10 rule
Simple is better than complex
FROM POINT A TO POINT…X?
Available resources
Documentation, tutorials, books, videos
Ease of use (with a grain of salt)
Community support and continuous development
Widely used
WHY I CHOSE THESE TOOLS
The importance of data preprocessing
AKA wrangling, cleaning, manipulating, and so on
Preprocessing is also getting to know your
data
Missing values? Categorical/continuous?
Distribution?
PREPROCESSING
Data analysis and modeling
Similar to R and Excel
Easy-to-use data structures
DataFrame
Data wrangling tools
Merging, pivoting, etc
PANDAS
Keep everything in Python
Community support/resources
Use for preprocessing
File I/0, cleaning, manipulation, etc
Combinable with other modules
NumPy, SciPy, statsmodel, matplotlib
PANDAS
File I/O
PANDAS
Finding missing values
PANDAS
Removing missing values
PANDAS
Pivoting
PANDAS
Other things
Statistical methods
Merge/join like SQL
Time series
Has some visualization functionality
PANDAS
Application of algorithms that learn from
examples
Representation and generalization
Useful in everyday life
Especially useful in data analysis
MACHINE LEARNING
Supervised learning
Classification and regression
Unsupervised learning
Clustering and dimensionality reduction
MACHINE LEARNING
Machine learning module
Open-source
Built-in datasets
Good resources for learning
SCIKIT-LEARN
Scikit-learn: your data has to be continuous
Here’s what one observation/label looks like:
SCIKIT-LEARN
Transform categorical values/labels
SCIKIT-LEARN
Classification
SCIKIT-LEARN
Classification
SCIKIT-LEARN
Other things
Very comprehensive of machine learning
algorithms
Preprocessing tools
Methods for testing the accuracy of your model
SCIKIT-LEARN
Concerned with interactions between
computers and human languages
Derive meaning from text
Many NLP algorithms are based on machine
learning
NATURAL LANGUAGE PROCESSING
Natural Language ToolKit
Access to over 50 corpora
Corpus: body of text
NLP tools
Stemming, tokenizing, etc
Resources for learning
NLTK
Stopword removal
NLTK
Stopword removal
NLTK
Stemming
NLTK
Other things
Lemmatizing, tokenization, tagging, parse trees
Classification
Chunking
Sentence structure
NLTK
Data that takes too long to process on your
machine
Not “big data” but larger data
Solution: MapReduce!
Processing large datasets with a parallel,
distributed algorithm
Map step
Reduce step
PROCESSING LARGE DATA
Map step
Takes series of key/value pairs
Ex. Word counts: break line into words, return
word and count within line
Reduce step
Once for each unique key: iterates through values
associated with that key
Ex. Word counts: returns word and sum of all
counts
PROCESSING LARGE DATA
Write MapReduce jobs in Python
Test code locally without installing Hadoop
Lots of thorough documentation
A few things to know
Keep everything in one class
MRJob program in a separate file
Output to new file if doing something like word
counts
MRJOB
Stemmed file
Line 1: (‘miss’, 2), (‘taylor’, 1)
Line 2: (‘taylor’, 1), (‘first’, 1), (‘wed’, 1)
And so on…
MRJOB
Map
 Line 1: (‘miss’, 2),
(‘taylor’, 1)
 Line 2: (‘taylor’, 1),
(‘first’, 1), (‘wed’, 1)
 Line 3: (‘first’, 1),
(‘wed’, 1)
 Line 4: (‘father’, 1)
 Line 5: (‘father’, 1)
Reduce
 (‘miss’, 2)
 (‘taylor’, 2)
 (‘first’, 2)
 (‘wed’, 2)
 (‘father’, 2)
MRJOB
Let’s count all words in the Gutenberg file
Map step
MRJOB
Reduce (and run) step
MRJOB
Results
Mapped counts reduced
Key/val pairs
MRJOB
Other things
Run on Hadoop clusters
Can write highly complex jobs
Works with Elasticsearch
MRJOB
The “final step”
Conveying your results in a meaningful way
Literally see what’s going on
DATA VISUALIZATION
Remember this?
DATA VISUALIZATION
Bar chart of distribution
DATA VISUALIZATION
2D visualization library
Based on the similar R library
Wrapper around matplotlib
Wide variety of nice-looking plots
Easy to feed in Pandas
GGPLOT
Bar chart of distribution
GGPLOT
Layers
Aesthetics
aes()
No need for value_counts()!
GGPLOT
 Breakdown of
class per
maintenance type
GGPLOT
Other things
Many different kinds of graphs
Customizable
Smoothing, facets
Time series
Themes!
GGPLOT
theme_xkcd()
GGPLOT
Phew!
Which tool to choose depends on your needs
Workflow:
Preprocess
Analyze
Visualize
WHAT NEXT?
Pandas
http://pandas.pydata.org/
scikit-learn
http://scikit-learn.org/
NLTK
http://www.nltk.org/
MRJob
http://mrjob.readthedocs.org/
ggplot
http://ggplot.yhathq.com/
RESOURCES
Twitter
@sarah_guido
LinkedIn
https://www.linkedin.com/in/sarahguido
NYC Python
http://www.meetup.com/nycpython/
CONTACT ME!
AND FINALLY…
Questions?
THE END!

Analyzing Data With Python