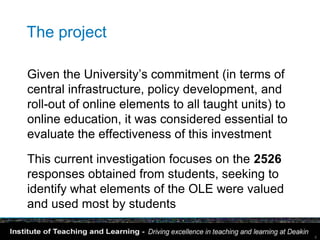
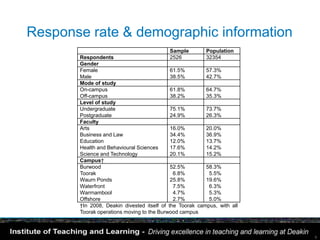
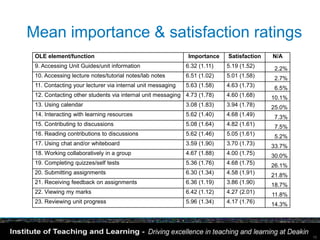
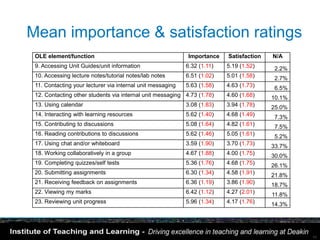
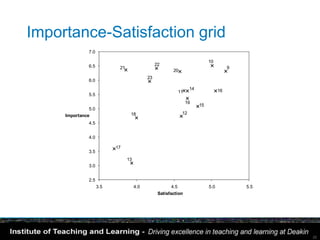
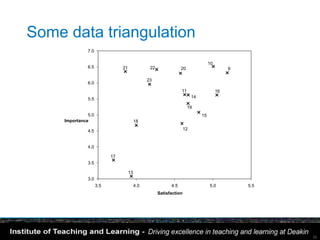
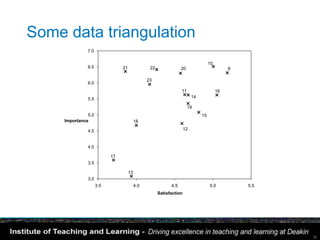
This document summarizes a study that investigated the impact of demographic differences on student experience with an online learning environment (OLE) at Deakin University. The study collected survey responses from over 2,500 students regarding importance and satisfaction ratings of various OLE elements. Key findings included:
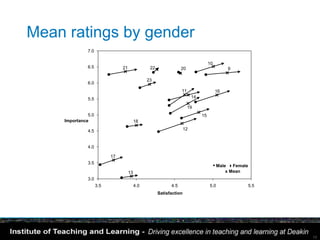
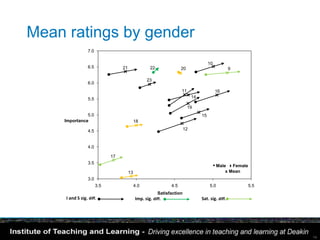
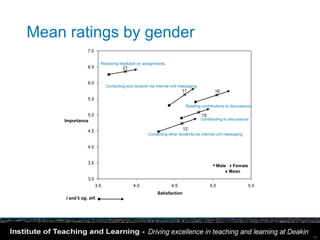
1) Female students generally gave higher ratings than males, particularly for elements related to online interaction and community.
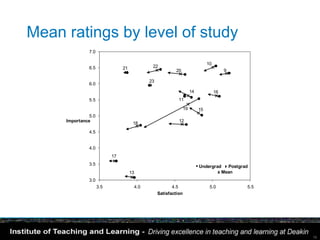
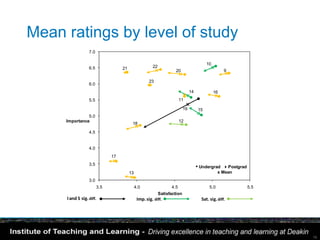
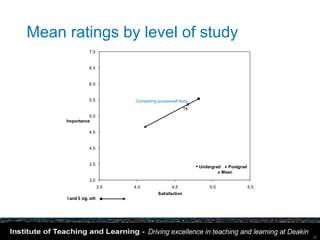
2) Postgraduate students generally gave lower satisfaction ratings than undergraduates, though differences were small.
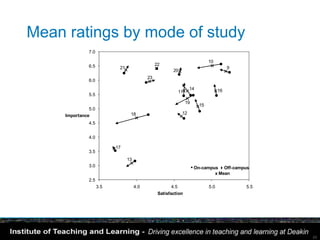
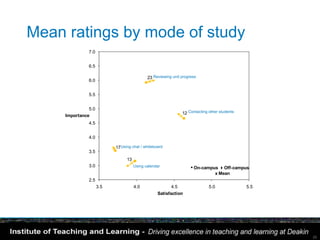
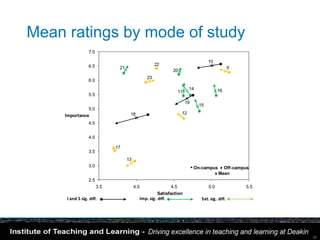
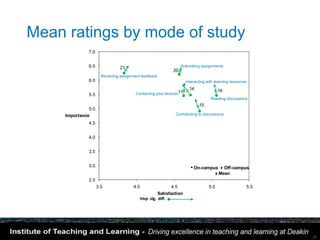
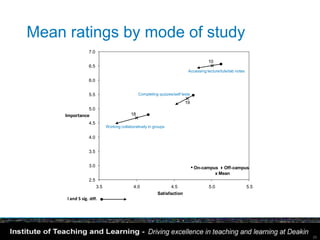
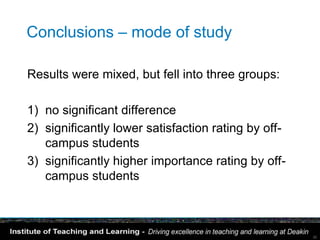
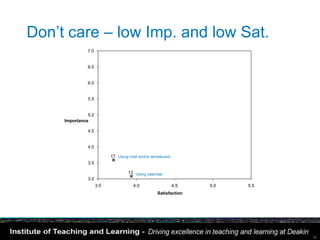
3) Analyses were also conducted to compare ratings based on mode of study (on-campus vs off-campus) with few significant differences found.
The study provides insights into how demographic factors may


![Social Media in the Classroom [KL Sept 2010]](https://cdn.slidesharecdn.com/ss_thumbnails/socialmediaintheclassroomklsept2010-100930014506-phpapp01-thumbnail.jpg?width=640&height=640&fit=bounds)


