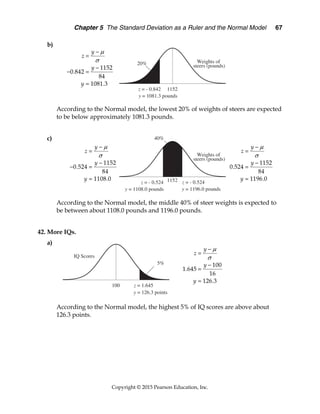
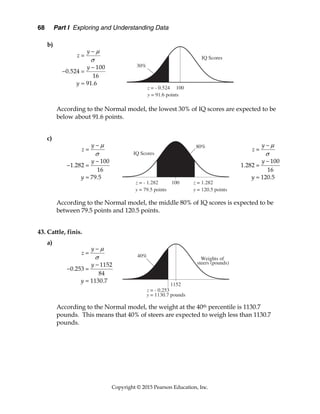
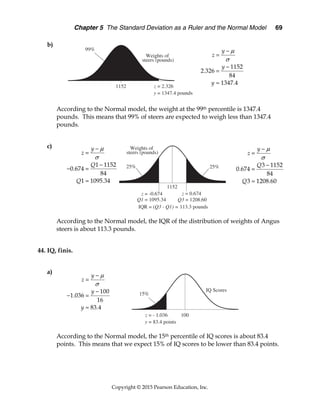
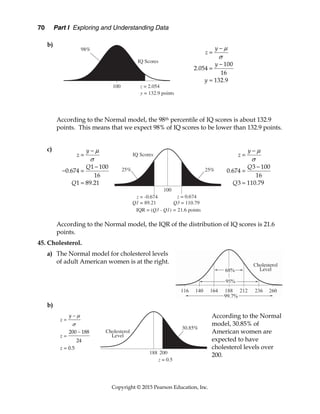
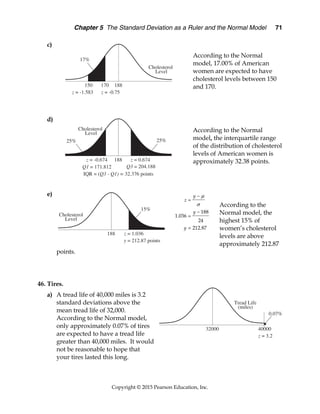
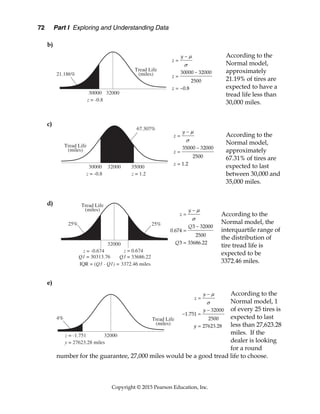
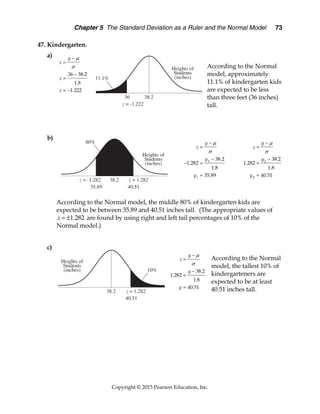
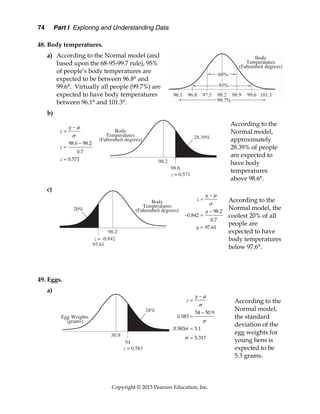
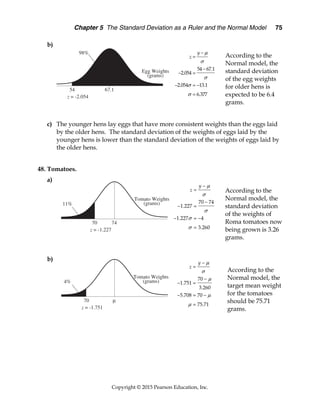
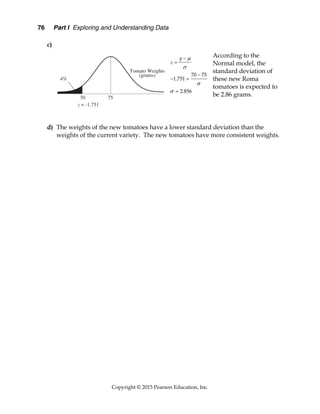
This document provides examples that use standard deviation to describe data distributions and calculate z-scores. It explains how standard deviation can be used as a "ruler" to measure distances from the mean in standard deviation units. Various datasets like test scores, home run totals, birth rates, and more are presented along with calculations of their means, standard deviations, and z-scores. Examples show how z-scores can be used to compare values across distributions and determine how many standard deviations a data point is from the mean.
Qnt 351 final exam new april 2016 versionAdams-ASs
QNT 351 FINAL EXAM NEW APRIL 2016 VERSION
Buy Solutions: http://hwsoloutions.com/downloads/qnt-351-final-exam-new-april-2016-version/
QNT 351 FINAL EXAM
NEW APRIL 2016 VERSION
A time series trend equation for Hammer Hardware is Y’ = 5.6 + 1.2t, where sales are in millions of dollars and t increases by one unit for each year. If the value of sales in the base year of 2016 is $5.6 million, what would be the estimated sales amount for 2018?
$8 million
$6.8 million
Unable to determine from given information
$5.6 million
A weight-loss company wants to statistically prove that its methods work. They randomly selected 10 clients who had been on the weight loss program for between 55 and 65 days. They looked at their beginning weights and their current weight. The statistical test they should utilize is:
t test for difference in paired samples
z test for two population proportions
Master statistics 1#10 Empirical Rule of Standard Deviation Florin Neagu
The empirical rule is a statistical rule which declares that for a normal distribution, almost all data will fall within three standard deviations of the mean.
The empirical rule is most often used in statistics to anticipate final outcomes. After a standard deviation is calculated and before exact data can be collected, this rule can be used as a rough estimate of the outcome of the data. This probability can be used meanwhile since gathering appropriate data may be time-consuming or even impossible to obtain. The empirical rule is also used as a rough way to test a distribution's "normality". If too many data points fall outside the three standard deviation boundaries, this could suggest that the distribution is not normal
QuestionWhich of the following data sets is most likel.docxcatheryncouper
Question
Which of the following data sets is most likely to be normally distributed? For other choices, explain why you believe they would not follow a normal distribution.
The hand span (measured from the tip of the thumb to the tip of the extended 5th finger) of a random sample of high school seniors.
The annual salaries of all employees of a large shipping company
The annual salaries of a random sample of 50 CEOs of major companies (25 men and 25 women)
The dates of 100 pennies taken from a cash drawer in a convenience store
Question
Assume than the mean weight of 1 year old girls in the US is normally distributed with a mean value of 9.5 kg and standard deviation of 1.1. Without using a calculator (use the empirical rule 68 %, 95 %, 99%), estimate the percentage of 1 year old girls in the US that meet the following conditions. Draw a sketch and shade the proper region for each problem…
Less than 8.1 kg
Between 7.3 and 11.7 kg.
More than 12.8 kg.
Question
The grades on a marketing research course midterm are normally distributed with a mean (81) and standard deviation (6.3) . Calculate the z score for each of the following exam grades. Draw and label a sketch for each example.
65
83
93
100
Question
The grades on a marketing research course midterm are normally distributed with a mean (81) and standard deviation (6.3) . Calculate the z score for each of the following exam grades. Draw and label a sketch for each example.
65
83
93
100
Question…
What is the relative frequency of observations below 1.18? That is, find the relative frequency of the event Z < 1.18.
z .00 .01 ... .08 .09
0.0 .5000 .5040 ... .5319 .5359
0.1 .5398 .5438 ... .5714 .5753
... ... ... ... ... ...
1.0 .8413 .8438 ... .8599 .8621
1.1 .8643 .8665 ... .8810 8830
1.2 .8849 .8869 ... .8997 .9015
... ... ... ... ... ...
Question
Find the value z such that the event Z > z has relative frequency 0.80.
Question
For borrowers with good credits the mean debt for revolving and installment accounts is $ 15, 015. Assume the standard deviation is $3,540 and that debt amounts are normally distributed.
What is the probability that the debt for a borrower with good credit is more than $ 18,000.
Question
The average stock price for companies making up the S&P 500 is $30, and the standard deviation is $ 8.20. Assume the stock prices are normally distributed.
How high does a stock price have to be to put a company in the top 10 % … ?
Question
The scores on a statewide geometry exam were normally distributed with μ=72 and σ=8. What fraction of test-takers had a grade between 70 and 72 on the exam? Use the cumulative z-table provided below.
z. 00 .01 .02. 03. 04. 05. 06. 07 .08 .09
0.00. 50000 .50400 .50800 .51200 .51600 .51990 .52390 .52790 .53190 .5359
0.10. 53980 .54380 .54780 .55170 .55570 .55960 .56360 .56750 .57140 .5753
0.20. 57930 .58320 .58710 .59100 .59480 .59870 .60260 .60640 .61 ...
Introduction to AI for Nonprofits with Tapp NetworkTechSoup
Dive into the world of AI! Experts Jon Hill and Tareq Monaur will guide you through AI's role in enhancing nonprofit websites and basic marketing strategies, making it easy to understand and apply.
Honest Reviews of Tim Han LMA Course Program.pptxtimhan337
Personal development courses are widely available today, with each one promising life-changing outcomes. Tim Han’s Life Mastery Achievers (LMA) Course has drawn a lot of interest. In addition to offering my frank assessment of Success Insider’s LMA Course, this piece examines the course’s effects via a variety of Tim Han LMA course reviews and Success Insider comments.
The Roman Empire A Historical Colossus.pdfkaushalkr1407
The Roman Empire, a vast and enduring power, stands as one of history's most remarkable civilizations, leaving an indelible imprint on the world. It emerged from the Roman Republic, transitioning into an imperial powerhouse under the leadership of Augustus Caesar in 27 BCE. This transformation marked the beginning of an era defined by unprecedented territorial expansion, architectural marvels, and profound cultural influence.
The empire's roots lie in the city of Rome, founded, according to legend, by Romulus in 753 BCE. Over centuries, Rome evolved from a small settlement to a formidable republic, characterized by a complex political system with elected officials and checks on power. However, internal strife, class conflicts, and military ambitions paved the way for the end of the Republic. Julius Caesar’s dictatorship and subsequent assassination in 44 BCE created a power vacuum, leading to a civil war. Octavian, later Augustus, emerged victorious, heralding the Roman Empire’s birth.
Under Augustus, the empire experienced the Pax Romana, a 200-year period of relative peace and stability. Augustus reformed the military, established efficient administrative systems, and initiated grand construction projects. The empire's borders expanded, encompassing territories from Britain to Egypt and from Spain to the Euphrates. Roman legions, renowned for their discipline and engineering prowess, secured and maintained these vast territories, building roads, fortifications, and cities that facilitated control and integration.
The Roman Empire’s society was hierarchical, with a rigid class system. At the top were the patricians, wealthy elites who held significant political power. Below them were the plebeians, free citizens with limited political influence, and the vast numbers of slaves who formed the backbone of the economy. The family unit was central, governed by the paterfamilias, the male head who held absolute authority.
Culturally, the Romans were eclectic, absorbing and adapting elements from the civilizations they encountered, particularly the Greeks. Roman art, literature, and philosophy reflected this synthesis, creating a rich cultural tapestry. Latin, the Roman language, became the lingua franca of the Western world, influencing numerous modern languages.
Roman architecture and engineering achievements were monumental. They perfected the arch, vault, and dome, constructing enduring structures like the Colosseum, Pantheon, and aqueducts. These engineering marvels not only showcased Roman ingenuity but also served practical purposes, from public entertainment to water supply.
Unit 8 - Information and Communication Technology (Paper I).pdfThiyagu K
This slides describes the basic concepts of ICT, basics of Email, Emerging Technology and Digital Initiatives in Education. This presentations aligns with the UGC Paper I syllabus.
A Strategic Approach: GenAI in EducationPeter Windle
Artificial Intelligence (AI) technologies such as Generative AI, Image Generators and Large Language Models have had a dramatic impact on teaching, learning and assessment over the past 18 months. The most immediate threat AI posed was to Academic Integrity with Higher Education Institutes (HEIs) focusing their efforts on combating the use of GenAI in assessment. Guidelines were developed for staff and students, policies put in place too. Innovative educators have forged paths in the use of Generative AI for teaching, learning and assessments leading to pockets of transformation springing up across HEIs, often with little or no top-down guidance, support or direction.
This Gasta posits a strategic approach to integrating AI into HEIs to prepare staff, students and the curriculum for an evolving world and workplace. We will highlight the advantages of working with these technologies beyond the realm of teaching, learning and assessment by considering prompt engineering skills, industry impact, curriculum changes, and the need for staff upskilling. In contrast, not engaging strategically with Generative AI poses risks, including falling behind peers, missed opportunities and failing to ensure our graduates remain employable. The rapid evolution of AI technologies necessitates a proactive and strategic approach if we are to remain relevant.
Model Attribute Check Company Auto PropertyCeline George
In Odoo, the multi-company feature allows you to manage multiple companies within a single Odoo database instance. Each company can have its own configurations while still sharing common resources such as products, customers, and suppliers.
Welcome to TechSoup New Member Orientation and Q&A (May 2024).pdfTechSoup
In this webinar you will learn how your organization can access TechSoup's wide variety of product discount and donation programs. From hardware to software, we'll give you a tour of the tools available to help your nonprofit with productivity, collaboration, financial management, donor tracking, security, and more.