s-oil 010950 Algorithm Investment Report
•
0 likes•11 views

This document provides financial and performance data for Algorithm company over several periods from 2020-2023. It includes key metrics like sales, operating profit, net income, debt ratios, and stock prices. It also evaluates the company's current stock price compared to an indication price range and suggests the amount that could be purchased. Additional sections show the stock's probability of rising over past periods and compliance information for the analysis.
![[Price for scheduled purchasing]
Arbitrarily made
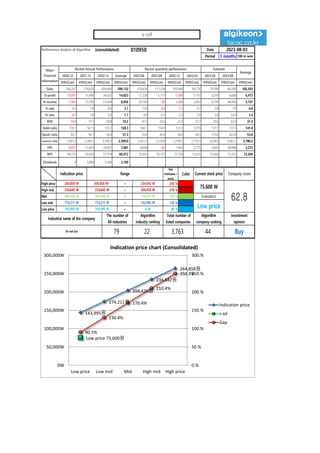
Algorithm stocks Trading Strategies (consolidated) 010950 Date
Period
Gap
(Indication /
stock)
Color
low price 143,995 W 143,995 W ~ 0 W 90 % -8,076,457 W -56
Low mid 174,211 W 174,211 W ~ 143,995 W 130 % -11,644,499 W All selling
Mid 204,426 W 204,426 W ~ 174,211 W 170 % -15,212,542 W All selling
High mid 234,642 W 234,642 W ~ 204,426 W 210 % -18,780,584 W All selling
Suggested Purchase
Amount 8,927,280 W
Number of stocks
purchased 118
Indication price Range Buying / Selling Buying / Selling [Stocks]
High price 264,858 W 264,858 W~ ~ 234,642 W 250 % -22,348,627 W All selling
2023-08-03
3 months
Current stock price Evaluation
Stock price rise
probability score
Investment opinion Prospective purchase amount
75,600 W Low price 67.1 Buy 14,000,000 W
38.4 35.5 42.0 21.7 51.0 48.8
2023.03.09 2023.04.06 2023.05.08 2023.06.07 2023.07.05 2023.08.02
Stock price rise
probability score
A Sector 45.5 49.7 38.1 51.1 44.5 52.5
67.1
B Sector 31.3 21.3 45.8 51.1 57.5 45.0
Total average
2023.05.08 2023.06.07 2023.07.05 2023.08.02
Total of
increase rate
Total score
A Sector 8 % -31 % 25 % -15 % 15 %
-7 % 48.7
B Sector -47 % 54 % 10 % 11 % -28 %
Total average -8 % 15 % -94 % 58 % -5 %
2023.04.06
46
50
38
51
44
53
31
21
46
51
58
45
38 35
42
22
51 49
0
10
20
30
40
50
60
70
2023.03.09 2023.04.06 2023.05.08 2023.06.07 2023.07.05 2023.08.02
Stock price rise probability score
A sector
B sector
Total average
8%
-31%
25%
-15%
15%
-47%
54%
10% 11%
-28%
-8%
15%
-94%
58%
-5%
-150%
-100%
-50%
0%
50%
100%
2023.04.06 2023.05.08 2023.06.07 2023.07.05 2023.08.02
Increase rate of stock price rise
A sector
B sector
Total average
s-oil](data:image/gif;base64,R0lGODlhAQABAIAAAAAAAP///yH5BAEAAAAALAAAAAABAAEAAAIBRAA7)
Recommended
Recommended
More Related Content
Similar to s-oil 010950 Algorithm Investment Report
Similar to s-oil 010950 Algorithm Investment Report (20)
More from 알고리즘 기업분석 컨설팅-알기컨,algikeon
More from 알고리즘 기업분석 컨설팅-알기컨,algikeon (20)
Recently uploaded
Recently uploaded (20)
s-oil 010950 Algorithm Investment Report
- 1. Performance Analysis of Algorithm (consolidated) 010950 Date Period 3 months 100-m won 2020.12 2021.12 2022.12 Average 2022.06 2022.09 2022.12 2023.03 2023.06 2023.09 IFRS(Con) IFRS(Con) IFRS(Con) IFRS(Con) IFRS(Con) IFRS(Con) IFRS(Con) IFRS(Con) IFRS(Con) IFRS(Con) IFRS(Con) Sales 168,297 274,639 424,460 289,132 114,424 111,226 105,940 90,776 79,389 84,200 105,592 O-profit -10,991 21,409 34,052 14,823 17,220 5,117 -1,604 5,157 2,079 6,668 6,473 N-income -7,961 13,785 21,044 8,956 10,142 -96 2,289 2,653 4,595 44,956 3,747 O-rate -6.5 7.8 8.0 3.1 15.0 4.6 -1.5 5.7 2.6 7.9 6.0 N-rate -4.7 5.0 5.0 1.7 8.9 -0.1 2.2 2.9 5.8 53.4 3.5 ROE -14.0 19.7 24.8 10.2 47.5 23.5 27.3 27.7 29.6 62.0 31.5 Debt-ratio 176.1 167.5 131.2 158.3 140.1 154.9 131.2 137.9 137.7 137.5 141.0 Quick-ratio 42.7 56.7 54.4 51.3 53.8 45.4 54.4 58.5 115.6 653.0 53.0 reserve-ratio 1,841.2 2,286.5 2,799.3 2,309.0 2,821.3 2,729.8 2,799.3 2,770.5 3,034.9 3,463.1 2,780.2 EPS -6,827 11,822 18,047 7,681 8,698 -82 1,963 2,275 3,941 38,986 3,213 BPS 48,733 59,929 72,754 60,472 73,301 70,727 72,754 72,035 71,642 71,252 72,204 Dividends 0 3,800 5,500 3,100 Major Financial Information Recent Annual Performance Recent quarterly performance Estimate Average 2023-08-03 Gap (Indication / stock) Color High price ~ 250 % High mid ~ 210 % Mid ~ 170 % Low mid ~ 130 % Low price ~ 90 % Buy 143,995 W 143,995 W 0 W Industrial name of the company The number of All industries Algorithm Industry ranking Total number of listed companies Algorithm company ranking Investment opinion Oil and Gas 79 22 3,763 44 234,642 W 234,642 W 204,426 W 204,426 W 204,426 W 174,211 W Evaluation 264,858 W 264,858 W~ 234,642 W 75,600 W 62.8 174,211 W 174,211 W 143,995 W Low price Indication price Range Current stock price Company score 143,995원 174,211원 204,426원 234,642원 264,858원 Low price 75,600원 90.5% 130.4% 170.4% 210.4% 250.3% 0.% 50.% 100.% 150.% 200.% 250.% 300.% 0W 50,000W 100,000W 150,000W 200,000W 250,000W 300,000W Low price Low mid Mid High mid High price Indication price chart (Consolidated) Indication price s-oil Gap s-oil
- 2. [Price for scheduled purchasing] Arbitrarily made Algorithm stocks Trading Strategies (consolidated) 010950 Date Period Gap (Indication / stock) Color low price 143,995 W 143,995 W ~ 0 W 90 % -8,076,457 W -56 Low mid 174,211 W 174,211 W ~ 143,995 W 130 % -11,644,499 W All selling Mid 204,426 W 204,426 W ~ 174,211 W 170 % -15,212,542 W All selling High mid 234,642 W 234,642 W ~ 204,426 W 210 % -18,780,584 W All selling Suggested Purchase Amount 8,927,280 W Number of stocks purchased 118 Indication price Range Buying / Selling Buying / Selling [Stocks] High price 264,858 W 264,858 W~ ~ 234,642 W 250 % -22,348,627 W All selling 2023-08-03 3 months Current stock price Evaluation Stock price rise probability score Investment opinion Prospective purchase amount 75,600 W Low price 67.1 Buy 14,000,000 W 38.4 35.5 42.0 21.7 51.0 48.8 2023.03.09 2023.04.06 2023.05.08 2023.06.07 2023.07.05 2023.08.02 Stock price rise probability score A Sector 45.5 49.7 38.1 51.1 44.5 52.5 67.1 B Sector 31.3 21.3 45.8 51.1 57.5 45.0 Total average 2023.05.08 2023.06.07 2023.07.05 2023.08.02 Total of increase rate Total score A Sector 8 % -31 % 25 % -15 % 15 % -7 % 48.7 B Sector -47 % 54 % 10 % 11 % -28 % Total average -8 % 15 % -94 % 58 % -5 % 2023.04.06 46 50 38 51 44 53 31 21 46 51 58 45 38 35 42 22 51 49 0 10 20 30 40 50 60 70 2023.03.09 2023.04.06 2023.05.08 2023.06.07 2023.07.05 2023.08.02 Stock price rise probability score A sector B sector Total average 8% -31% 25% -15% 15% -47% 54% 10% 11% -28% -8% 15% -94% 58% -5% -150% -100% -50% 0% 50% 100% 2023.04.06 2023.05.08 2023.06.07 2023.07.05 2023.08.02 Increase rate of stock price rise A sector B sector Total average s-oil
- 3. 정보와 완전 정보 결 투자판단 있습니 위배 무단으 숙지하 Compliance notice ① The information provided by The Algorithm Company Analysis Consulting is obtained through reliable data and information and The Algorithm Company Analysis Program (TACAP), but its accuracy or completeness are not guaranteed. Furthermore, it may change over time.Therefore, we are not legally responsible for the results of the data provided by The Algorithm Company Analysis Consulting because of information errors or omissions. ② The Algorithm Company Analysis Consulting and all the information provided on it site are reference materials for investment decisions and the final responsibility of investment is up to users utilizing this information. ③ The Algorithm Company Analysis Consulting and its site do not do anything that violates the related laws such as discretionary transaction. ④ Users can not reallocate and recycle the information provided by The Algorithm Company Analysis Consulting firm let alone the information provided by its Site. ⑤ Be sure to know about application period of this algorithm analysis report in order to improve its accuracy. Tel : 070 - 4667 - 5009 Email : tacac@tacac.co.kr Homepage : tacac.co.kr Blog : tacac.blog.me SERVICES M&A, IPO, RECOVER, CORPORATE RESTRUCTURING, MANAGEMENT OF TECHNOLOGY, BUSINESS STRATEGY, FAMILY BUSINESS Request : http://tacac.co.kr/?page_id=1374 ① Consulting is o The Algorithm accuracy or com change over tim results of the d Consulting bec ② information pr investment dec up ③ do anything th transaction. ④ The Algorithm information pr ⑤ analysis report