Downloaded 148 times

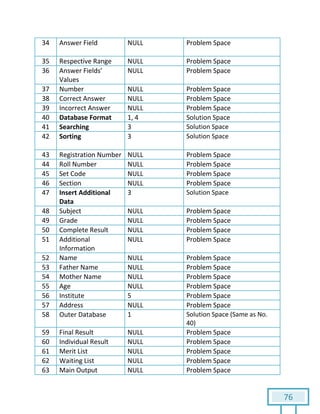
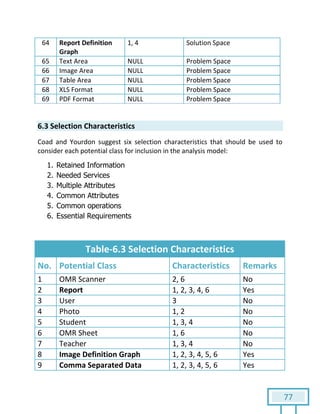
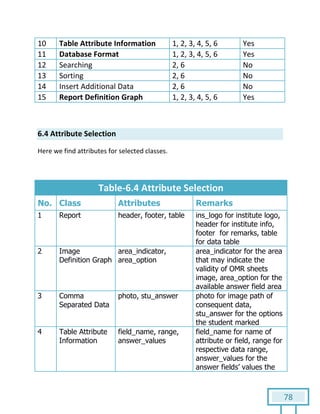
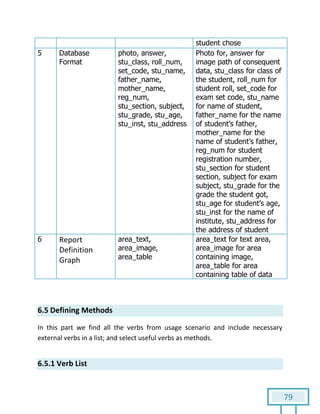

The document is a Software Requirements Specification (SRS) for the Result Analysis Tool (RAT), detailing the functional and non-functional requirements for processing OMR scanned data of students' exams. It includes stakeholder identification, requirement elicitation, and various modeling approaches to ensure comprehensive understanding and execution of the project's objectives. The SRS serves as a communication medium between stakeholders and developers, ensuring all requirements are documented and addressed during the development process.