Downloaded 329 times


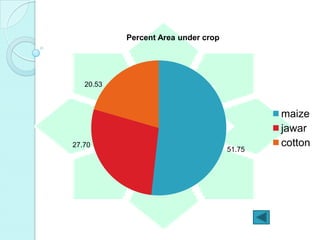

The village survey report summarizes the results of a survey of 143 farmers in Narayanpur village. Key findings include: 1) Most farmers are over 35 years old and illiterate, with few young people entering farming. 2) Major crops are maize, jawar, and cotton. Maize accounts for over half the cultivated area. 3) Input costs are highest for cotton, while labor costs are highest for maize cultivation. 4) Programs like MGNREGA have not significantly impacted farmers' lives. Labor rates and access to services remain issues.


