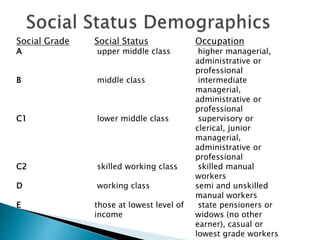
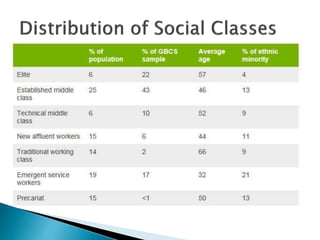
Social Grade Social Status Occupation
A upper middle class higher managerial,
administrative or
professional
B middle class intermediate
managerial,
administrative or
professional
C1 lower middle class supervisory or
clerical, junior
managerial,
administrative or
professional
C2 skilled working class skilled manual
workers
D working class semi and unskilled
manual workers
E those at lowest level of
income
state pensioners or
widows (no other
earner), casual or
lowest grade workers
 Social status can be broken down 6 groups,
each of which is represented by a letter.
These are ordered mainly by income which
then also depends on occupation. This
demographic can be used to group social
societies and communities and then used to
observe how they will react to certain media
texts.
 This data shows the percentage
distribution of each social demographic
in the UK. It is clear that this is skewed
towards the bottom end as there are
many lower grade workers in
complaisant to the small amount of
elites/higher class. This data also
included the average ages of class
however there is no clear correlation
between age and class.
 This image shows the
proportion of the elite
in relation to the
amount of near by
elites in their area.
From this you can see
that the highest class
cluster together in
most places. Also
where there is low
income, the
surrounding areas also
have lower incomes.

Social status classifications

  • 2.
    Social Grade SocialStatus Occupation A upper middle class higher managerial, administrative or professional B middle class intermediate managerial, administrative or professional C1 lower middle class supervisory or clerical, junior managerial, administrative or professional C2 skilled working class skilled manual workers D working class semi and unskilled manual workers E those at lowest level of income state pensioners or widows (no other earner), casual or lowest grade workers
  • 3.
     Social statuscan be broken down 6 groups, each of which is represented by a letter. These are ordered mainly by income which then also depends on occupation. This demographic can be used to group social societies and communities and then used to observe how they will react to certain media texts.
  • 5.
     This datashows the percentage distribution of each social demographic in the UK. It is clear that this is skewed towards the bottom end as there are many lower grade workers in complaisant to the small amount of elites/higher class. This data also included the average ages of class however there is no clear correlation between age and class.
  • 6.
     This imageshows the proportion of the elite in relation to the amount of near by elites in their area. From this you can see that the highest class cluster together in most places. Also where there is low income, the surrounding areas also have lower incomes.