Download to read offline

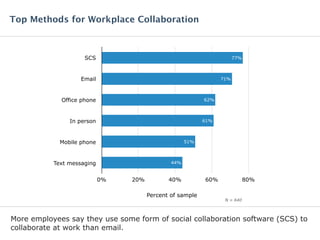

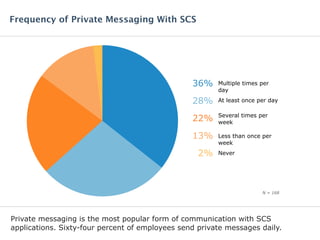
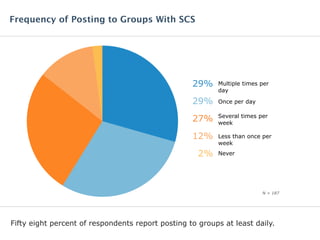


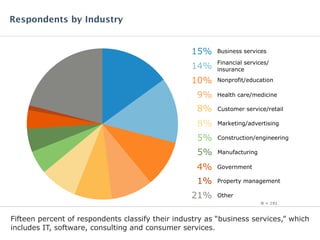


The report on social collaboration software (SCS) in March 2015 reveals that more employees use SCS for workplace collaboration than email, with 58% using it daily to collaborate on documents. Private messaging is the most common communication method within SCS platforms, and the majority of respondents are from midsize businesses. Additionally, the report highlights the benefits of SCS in enhancing internal communication and documentation across various industries.
![[Slides] Strengthening Employee Relationships in the Digital Era by Altimeter...](https://cdn.slidesharecdn.com/ss_thumbnails/slidesstrengtheningemployeerelationshipsinthedigitaleraaltimetergroup-150120125512-conversion-gate02-thumbnail.jpg?width=640&height=640&fit=bounds)


![Lect 1 Number systems and base conversions. [Autosaved].pptx](https://cdn.slidesharecdn.com/ss_thumbnails/lect1numbersystemsandbaseconversions-260111134109-67c2d865-thumbnail.jpg?width=640&height=640&fit=bounds)


