
Recommended
More Related Content
Similar to Soc 1-4 Homework 5Tables.PRINTED –not handwritten - HARD COPY.docx
Similar to Soc 1-4 Homework 5Tables.PRINTED –not handwritten - HARD COPY.docx (20)
More from jensgosney
More from jensgosney (20)
Recently uploaded
Recently uploaded (20)
Soc 1-4 Homework 5Tables.PRINTED –not handwritten - HARD COPY.docx
- 1. Soc 1-4 Homework 5:Tables.PRINTED –not handwritten - HARD COPY NO TURNITIN Due Monday 10/5/15 at the beginning of class. PRINTOUT HARD COPY NO TURNITIN P.1 Format: Papers should contain a table and interpretation. These may be on the same page or different pages. • The table MUST be PRINTED on a PRINTER. • The writeup MUST be typed and printed, double-spaced with a 12-point font please. It may be 1 to 3 sentences or more, but overall it should be less than 250 words. • If the table is on a different sheet of paper from your interpretation, please staple or paper-clip them together. Make sure your name is on both sheets. I invite you to work together. However each person must produce their own work. No copying and pasting each other’s answers, please. Papers we judge to be the same will receive 0. Build a table This assignment asks you to collect data, interpret them, and then put them in a table and interpret the table. You will need to know the following: variables, attributes, independent variables, dependent variables, percents and column percents. You will also need to know how to read a bivariate table – the instructions are presented in class, and are repeated on the other side of this sheet.
- 2. The data we collected in class were in answer to the following question: Which of the following best describes you? A. I am FEMALE and I HAVE bought marijuana from a dealer B. I am FEMALE and I HAVE NOT bought marijuana from a dealer C. I am MALE and I HAVE bought marijuana from a dealer D. I am MALE and I HAVE NOT bought marijuana from a dealer E. Even though I know this poll is anonymous, I respectfully decline to answer We collected data for answer E., but we will not be using it. Please do not use the number from “E” The data we collected are below. Do not simply reproduce this thing! If you are downloading this from ANGEL, I will post this same document you are reading sometime Friday afternoon with numbers filled in for your section. 1. Please make a table of these data. The table MUST be produced using a computer, and printed out. Please round to the nearest .1 (eg 45.05 rounds up to 45.1). 2. Please interpret the table. In 1 to 3 sentences, please describe what is going on in this table. Please do so in no more than 250 words. Grades for this homework 5 will be assigned on the basis of how well you follow the rules of table- making (see the other side), and how correctly you interpret the results. Tip: Simply be sure of your independent and dependent variables, then use the table on the
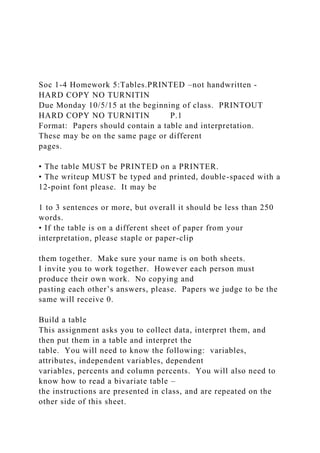
- 3. other side of this paper as a model, and you can’t go wrong (in building the table, anyway)! A B C D 46 70 63 38 10/2/15 Sociology 001: Table instructions: p.2 How to make a bivariate table, how to read it, with an example Male Female Total Should marijuana be made legal? Yes 292 282 574 48.0 39.2 43.2 No 264 385 649 43.4 53.5 48.9 Don't Know 52 53 105 8.6 7.4 7.9 Total 608 720 1328 100.0 100.0 100.0 Table 3. Should marijuana be made legal, by respondent's sex, General Social Survey, 2012
- 4. Sex 2. Dependent variable in row (GRASS) 5. Title the table: “Table X. Dependent BY Independent” (where “X” is the table number) 6. Label Independent variable values in column headers 7. Label Dependent variable values in row stub 9. Total Column 1. Independent variable in column (SEX)
- 5. 3. Cell Counts AND Column Percentages. 4. Percentage down column (within independent) How to make a bivariate table: Summary of rules: 1. Independent variable in column 2. Dependent variable in row 3. Cell Counts AND Column Percentages 4. Percentages down column (within independent) 5. Title table, “Dependent BY Independent” 6. Label Independent variable values 7. Label Dependent variable values 8. Total Row 9. Total Column How to read a bivariate table: 1. Numbers are interesting, but ultimately we care more about percentages. 2. Calculate the percentage in the column, but read across the row! This compares the effect of increasing the value of the independent variable (SEX) on each value of the dependent variable (GRASS). 3. For example, read the row “Yes.” Note that 48.0 percent of males answered “Yes,”
- 6. while 39.2 percent of females answered “Yes.” Gender definitely influences whether or not someone favors legalization: males are much more in favor (9 percentage points). As one of the largest daily commodity production enterprises around the world, people have the tendency to pay attention to the company‘s production energy consumption, environmental pollution, and the product‘s packaging with higher expectations. Procter and Gamble, because of this increased awareness, now organizes a program that is called ―Change that Matters. The program covers four parts in doing business ethically; this includes environmental sustainability, social responsibility, employees, and stakeholders. The main ethical dilemmas that Procter and Gamble faces in regards to the above would be environmental pollution and energy consumption. Environmental Pollution is their first challenge. Environment damaging stack effect goes along with the large production gross of P&G. In general, the raw material for the products contains a large number of environmental hormones. According to studies, the amount of their emissions of chemical species may be breathtaking. That may cause great pollution. However, since many years ago, P&G has been making continuous research for the green and low contamination of the products. Apart from that, P&G devote to make the environmentally friendly process for their manufacture, supplying chain, as well as logistics. They apply smart eco- design in manufacturing, more sustainable design to reduce waste during transportation, and making scorecard system for their suppliers aiming to help reducing environment pollution in their supplying chain. Energy Consumption are the second challenges. As scientist discovered, the energy saving and the emission reduction is mainly embodied in the production line, P & G has to take the resource problems into consideration in the
- 7. production process. For instance, they have to save water and electricity, but that may influence their productivity. On the other hand, energy-saving technology costs are high. First, they keep the materials from disposal by devising creative alternative uses. Second, they have made a Sustainable development plan which includes 100% the use of sustainable energy production, and zero waste landfill. Third, they are taking actions to collecting rain water for supplying plant landscape water, and maximize the use of natural light and solar energy. Having an innovative culture has actively helped Procter & Gamble develop and transfer technologies and bring new products to market. For over 170 years P&G has been in continuous operation in the consumer products industry, growing to become a multi-billion dollar global corporation. P&G has pioneered a series of strategic innovations that have sustained its competitive advantage in a number of highly contested market spaces. P&G has five key strategic innovations: direct to consumer advertising, direct product distribution, marketing research, brand management, and technological and product innovation. Porter argues that a competitive advantage strategy of both cost leadership and differentiation is impossible to sustain. Overall cost leadership requires firms to develop policies aimed at becoming and remaining the lowest-cost producer and/or distributor in the industry. The low-cost leader gains competitive advantage by getting its costs of production or distribution lower than those of the other firms in its market. Differentiating the product or service, requires a firm to create something about its product or service that is perceived as unique throughout the industry. I would argue that Porter’s argument does not apply to P&G. P&G’s brand and product innovations drive category market growth, which creates value for P&G’s retail customers and suppliers. Innovative new
- 8. products earned Procter & Gamble five of the top 10 spots on the IRI New Product Pacesetters™ ranking of the most successful non-food product launches of 2014. Running head: EXECUTIVE MEMO 1 EXECUTIVE MEMO 5 u03a1: Strategic Fit of the Firm Assessment Demetrius Price MBA6024 Organizational Strategy 9656 Barlow Road Fort Belvoir, VA 22060 Telephone: 910-987-2621 Email: [email protected] Instructor: Dr. Vincent DeFazio Date: 13 September 2015 Date: 13 September, 2015 To: Terri Bell, Vice President of Strategy
- 9. From: Demetrius R. Price CC: Vincent DeFazio, DM Subject: Procter & Gamble Strategic Fit Assessment Executive Summary P&G is an international company that has been in existence for a very long time. It is the largest producer of household goods and prides itself of having consumers from over 180 countries. The organization’s competitive advantage is differentiation. It is able to make unique products that can be told apart from those of its competitors. The company does this by branding. In addition, it is also innovative since it has created a lot of products. It also has good employees who work round the clock to ensure that the customers are satisfied. The firm’s corporate structure and the employees all work together for the success of the company. Business Strategy Procter and Gamble use differentiation as one of their competitive advantage strategies. The firm uses the tangible kind of differentiation. The products that they manufacture are differentiated from those of their competitors. The company packages their products in attractive material. Moreover, it also ensure that all their products are packaged according to size and many colors are used in the packaging material. The firm also deals in a wide range of variety of consumer goods. This form of diversifications also plays a major role in providing a competitive advantage. In addition, the organization has been in existence for so long and consumers have trusted them with production of quality products. This has also provided the company with a competitive edge. The business is an international organization that operates round the globe. It is innovative and manufactures products that consumers need in
- 10. their houses. Their products are of high quality and this makes consumers to keep coming back for more. Furthermore, the firm charges fair prices. These prices generate adequate revenue for the firm and makes consumers happy. Strategic Fit with the Goals and Values of the Firm P&G has been in operation for a very long term. The company has goals that give rise to new ones once the previous objectives have been achieved. The organization aims at ensuring that they provide quality products and services that will be enhance the lives of consumers for a long time (Admin, 2014). This is done by ensuring that they are innovative and that their products suit the needs of customers. They firm’s intention is to design products that delight customers (Staff, 2014). Moreover, the company also aim at conserving the environment and making the world a better place. It plans on using renewable energy in the plants and renewable and recyclable materials in packaging (Staff, 2014). The company is founded on the value of doing the right thing. This can be evidenced from the way they treat their employees with respect (Staff, 2014). The firm also offers competitive wages to its employees. In addition it also offers excellent financial stewardship to its shareholders (Staff, 2014). There is ample distribution of profits in the organization. The needs of the employees and those of shareholders are balanced because the firm avoids conflict of interest. It does not prioritize the needs of either one of them. This ensures that business goes on smoothly. Strategic Fit with the Resources and Capabilities of the Firm P&G is a firm whose competitive advantage is Differentiation. The firm has various ways that they differentiate their products so as to make them unique. The organization also attempts to take advantage of innovation and efficiency. The company is ingenious and invents new products now and then. It relies on two forms of innovation, both brand innovation and business innovation. As a result, the firm’s customers have a wide range of products and services to choose from. In addition, it also endeavors to make use of its international status in order to
- 11. satisfy its customers who are in over 180 countries (Admin, 2014). The firm invests in highly trained employees who are innovative and ready to work under minimal supervision. It also invests in huger plants that have high tech machines that are used in the manufacture of the products. Moreover, the firm ensures that they keep their employees happy by offering them competitive salaries and treating them with respect. For this reason, the employees work hard to maintain the organization’s image and treat customer’s in the right way. P&G has investors who fund the activities of the company. These are the shareholders. The funds are used in the proper way and the firm ensures that it generate revenue and maximizes on profits. In turn, the shareholders get a piece of the pie when they are given dividends. Organizational structure and Management systems Procter and Gamble’s corporate governance is made up of the management, shareholders, and a board of governance. The employees are the next in line and they are responsible for making the firm operational. P&G is a team based organization where they all work together towards a common goal which is ensuring customer satisfaction and generation of revenue. Both the stakeholders and shareholders are considered in the success of the business. The employees also share in the profits. The organization allows the employees to have a share in the profits. This move was meant to motivate them to generate revenue. Segregation of duties is a one of the primary activities of the company. Each employee given instructions and they know the role they have to play. There are written policies and procedures that are followed by everyone. Communications is transparent and to the necessary individuals. Preliminary Findings and Conclusions P&G relies heavily on differentiation in order to make unique laundry and personal care products for the target market. Branding and making exclusive products to suit customer taste and needs is what keeps the firm afloat. Furthermore, the firm has managed to sell its products through some of the largest
- 12. chain stores such as Walmart. However, the company is losing its market share and experiencing dwindling profits because of competition from similar businesses. References Admin, P. a. (2014). Proctor and Gamble Corporation. Retrieved from Proctor and Gamble Corporation Website: http://www.pg.com/en_US/index.shtml Manktelow, J. (1996-2015). Mind Tools Corporation. Retrieved from Mind Tools Corporation Website: https://www.mindtools.com/pages/article/newSTR_66.htm Staff, P. a. (2014). Proctor and Gamble Corporation. Retrieved from Proctor and Gamble Corporation Website: http://www.pg.com/en_US/sustainability/social_responsibility/i ndex.shtml
- 13. Running head: Industry Environment 1 Industry Environment 5 u04a1: Strategic Fit with the Industry Environment Assessment Demetrius Price MBA6024 Organizational Strategy 9656 Barlow Road Fort Belvoir, VA 22060 Telephone: 910-987-2621 Email: [email protected] Instructor: Dr. Vincent DeFazio Date: 21 September 2015 Date: 21 September, 2015 To: Terri Bell, Vice President of Strategy From: Demetrius R. Price CC: Vincent DeFazio, DM
- 14. Subject: Procter & Gamble Industry Environment Assessment Competitive analysis of Proctor and Gamble Analysis of Proctor and Gamble (P&G) shows advantages in the sales they obtain due to their sales strategies of enabling their household products to be sold globally. The sales of products in different regions expose the company and market it into a bigger brand. This builds the name of the company to bigger and wider scopes and influences more people. P&G has a range of products from skin care products to food and even cosmetics. This increases the market competition globally because of the many companies that manufacture this product globally (Leavy, 2013). The industries conditions are shaped through political, economic, social and technological factors. The most competitive forces those are most intense in the firm according to the Porter’s Five Forces are threats of substitutes and the threat of competition. New products arise in the market every time; these products may be better and more effective than those in the market initially. This new product overshadows the initial product and replaces them. It poses a threat to P&G. Strategic position and direction of Proctor and Gamble P&G company strategy is to have global recognition of all their products and to be approved by all, in all regions in the world. The strategy is to renew their products and manufacture better products that are outstanding in the current market. To make products those are attractive and acceptable to the customers at all levels. P&G participates in a wide sphere of products; Cosmetics, food, and even body cream products. P&G also introduced new products in the market like disposable diapers and synthetic detergents and even fluoride toothpaste. These are products for everyday use that has to be used on a daily basis. This is their market strategy. The buyer's purchase criterion is through online sale, wholesale or retail on the
- 15. grounds level. For competition purposes, the position and location outplayed by P&G are good in terms of marketing in a global scope and the target range is fine. The direction should not be altered (Staff, 2014). Proctor and Gamble strategic fit to competition, suppliers, and customers To curb competition, P&G uses the Porter’s Five factors to regulate their products in the market and to monitor the amount of competition in the market regarding products. P&G marketing strategy is beneficial and very good. The idea of distributing the products all over the world and investing in both media and other forms of marketing globally has helped to curb competition as a factor. By improving the product, they ensure relevance in the current market all the time and curb replacement of products. Suppliers are in large scale, the whole sale to supermarkets and all large stores all over the world and distribution to small stores for retail for the lay person to get access to their products. This is an advantage to the company as it takes the product to the people. The consumers can easily access the product from their home region due to the distribution done by the P&G staff (Admin, 2014) Organizational structure and management of Proctor and Gamble Due to diversification, the prices of the P&G products are standardized according to the locality and the region. In areas where there is inflation, the prices of the products inflate and in the areas where there is change in currency, the company regulates the prices of the products to a favorably fair price affordable to the customers. The prices are standardized to benefit the consumer; however it does not reduce the prices too low to hurt the company and the manufacture of new products. Products are of high standards regardless of the pricings. The value of the product matters to P&G. This is done by
- 16. studying the market dynamics of each market they venture into and applying different strategies to be highly competitive. The happiness of the staff is also a key factor that the management ensures it has put in place. When the employees are satisfied, carrying out their allocated duties becomes easy, and they can identify with the philosophy, values and goals, in the long run, ensuring longevity and reduced turnover (Leavy, 2013). References Admin, P. A. (2014). Proctor and Gamble Corporation. Retrieved from Proctor and Gamble Corporation Website: http://www.pg.com/en_US/index.shtml Leavy, B. (2013). Where to play and how to win–strategy fundamentals the Procter & Gamble way. Strategy & Leadership, 41(5), 7-16. Staff, P. A. (2014). Proctor and Gamble Corporation. Retrieved from Proctor and Gamble Corporation Website: http://www.pg.com/en_US/sustainability/social_responsibi lity/index.shtml Diversification is one key area I outlined previously as an area
- 17. of concern for P&G. Adopting a multi-brand approach does mean that P&G is practically everywhere in everybody’s lives – that has its advantages, as evident in P&G’s strong numbers in many markets. However, being everywhere at one time could well dilute P&G’s identity in the eyes of the consumer. To the average consumer, P&G is remembered as a multinational conglomerate that “makes many household items we use”. The sheer number makes it difficult for one to associate brands with P&G. The lack of identity may lead to low brand equity, with consumers failing to understand the values of the P&G brand positioning. Huge diversification has resulted in P&G’s market leadership in many markets, but with that it has lost the ability to build a strong, singular identity. Being a market leader with such a diverse portfolio, P&G has been inflexible due to the size of its organization and extensive bureaucracy in shifting to emerging markets. This ill-timed shift in focus means that P&G forgoes the opportunity to engage in either a market development strategy (selling existing products to new markets), or a diversification strategy (new innovative products brought into new and growing markets). To make up for this strategic product-mix mismatch, P&G has to reposition their products and increase decentralization of management, ensuring that they have the required marketing intelligence, in order to better understand and customize for the local needs and preferences of each emerging market. Despite efforts that have been made to penetrate these markets, with sales developing from markets making up 37% of P&G total sales in 2012. Lack of price sensitivity also hampers the company’s long term growth, most fiscally conscious consumers will begin to look for the same product from a cheaper competitor. The COMPREHENSIVE ORGANIZATIONAL STRATEGIC ASSESSMENT is explained in detail in Terry Bell’s assignment introduction, Unit 6. I suggest you refer to it to ensure you
- 18. have addressed the expectations of the VP in your assessment. Below are some hints on how to organize your paper. 1. Use a memo-title page format consistent with the other reports to the VP. 2. The Executive Summary can include the expectations articulated by the VP in the assignment introduction. 3. APA citations and reference page requirements remain the same. Please use topic headers that correspond to the grading criteria for the report, but don’t use verbatim, the criteria as your topic header. Below are some hints for the 4 topic headers and content of each topic. · Strategic Issues – summarize the issues from the previous reports, and refer to it to avoid too much detail. Analyze what issues are important or critical to a successful strategy (see figure 1.4 in the text) and explain your rationale with clear, persuasive arguments. Recall the essence of Unit 5 DQ’s and sure to call out and analyze the ones for which recommendations are required per the grading criteria (see below). · Recommendations for Significant Organizational Impact Issues – these recommendations relate to issues with the strategic position and direction of the firm, a criteria in U4a1. · Recommendations for significant Competitive Advantage Issues. – These recommendation relate to the sustainability of the firms competitive advantage (business) strategy. This was addressed in a DQ and in U3a1, and evaluation of how the firms structure and systems support its capabilities…a distinguished rating criteria. · Recommendations to mitigate Ethical Dilemmas. – These
- 19. recommendations relate to the goals and the values that guide strategic decisions. This was a criteria in U3a1, and the subject of a DQ. As always I will grade strictly according to the criteria. Don’t hesitate to contact me with questions or concerns. Dr. DeFazio