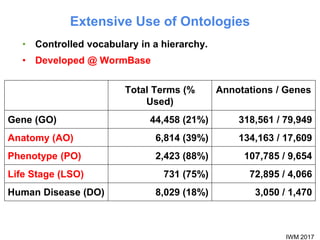
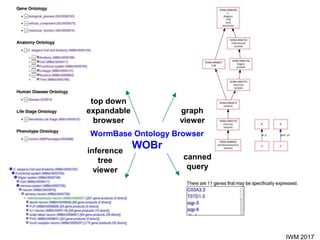
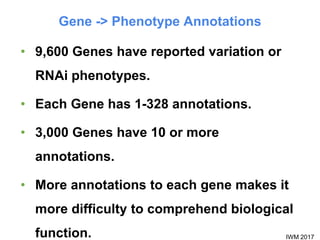
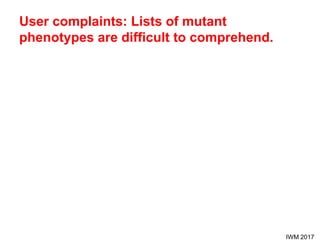
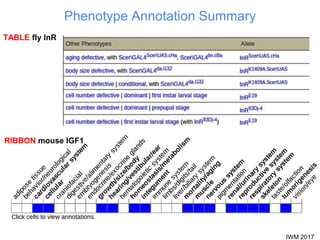
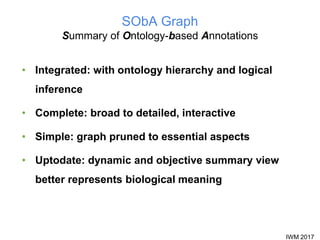
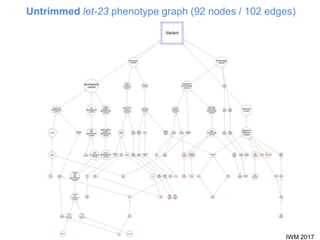
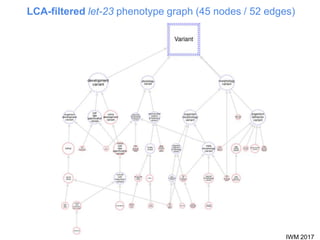
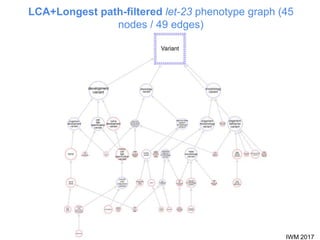
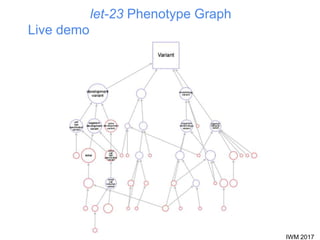
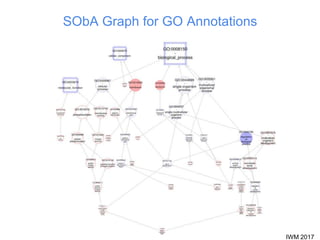
Ontology Annotation Browsing
Made Easy - SObA
Raymond Lee*, Juancarlos Chan, Chris A. Grove, and
Paul W. Sternberg
June 2017
21st International C. elegans Conference
Los Angeles, CA
IWM 2017
Extensive Use of Ontologies
• Controlled vocabulary in a hierarchy.
• Developed @ WormBase
Total Terms (%
Used)
Annotations / Genes
Gene (GO) 44,458 (21%) 318,561 / 79,949
Anatomy (AO) 6,814 (39%) 134,163 / 17,609
Phenotype (PO) 2,423 (88%) 107,785 / 9,654
Life Stage (LSO) 731 (75%) 72,895 / 4,066
Human Disease (DO) 8,029 (18%) 3,050 / 1,470
IWM 2017
WormBase Ontology Browser
WOBr
top down
expandable
browser
graph
viewer
inference
tree
viewer
canned
query
IWM 2017
Gene -> Phenotype Annotations
• 9,600 Genes have reported variation or
RNAi phenotypes.
• Each Gene has 1-328 annotations.
• 3,000 Genes have 10 or more
annotations.
• More annotations to each gene makes it
more difficulty to comprehend biological
function.
IWM 2017
User complaints: Lists of mutant
phenotypes are difficult to comprehend.
IWM 2017
Phenotype Annotation Summary
RIBBON mouse IGF1
TABLE fly InR
IWM 2017
SObA Graph
Summary of Ontology-based Annotations
• Integrated: with ontology hierarchy and logical
inference
• Complete: broad to detailed, interactive
• Simple: graph pruned to essential aspects
• Uptodate: dynamic and objective summary view
better represents biological meaning
IWM 2017
Untrimmed let-23 phenotype graph (92 nodes / 102 edges)
IWM 2017
LCA-filtered let-23 phenotype graph (45 nodes / 52 edges)
IWM 2017
LCA+Longest path-filtered let-23 phenotype graph (45
nodes / 49 edges)
IWM 2017
let-23 Phenotype Graph
Live demo
IWM 2017
Phenotype Graph Live Demo
• Direct vs. Inferred Annotation Nodes
• Node Size is Proportional to Annotation Count (on-
off)
• Interactive graph
• Exportable fully labelled graph (staging site)
IWM 2017
SObA Graph for GO Annotations
IWM 2017
Big Thanks To
• Sibyl Gao and Todd Harris
• Seth Carbon and Chris Mungall (AmiGO 2)

SObA WormBase Workshop International Worm Meeting 2017

  • 1.
    Ontology Annotation Browsing MadeEasy - SObA Raymond Lee*, Juancarlos Chan, Chris A. Grove, and Paul W. Sternberg June 2017 21st International C. elegans Conference Los Angeles, CA
  • 2.
    IWM 2017 Extensive Useof Ontologies • Controlled vocabulary in a hierarchy. • Developed @ WormBase Total Terms (% Used) Annotations / Genes Gene (GO) 44,458 (21%) 318,561 / 79,949 Anatomy (AO) 6,814 (39%) 134,163 / 17,609 Phenotype (PO) 2,423 (88%) 107,785 / 9,654 Life Stage (LSO) 731 (75%) 72,895 / 4,066 Human Disease (DO) 8,029 (18%) 3,050 / 1,470
  • 3.
    IWM 2017 WormBase OntologyBrowser WOBr top down expandable browser graph viewer inference tree viewer canned query
  • 4.
    IWM 2017 Gene ->Phenotype Annotations • 9,600 Genes have reported variation or RNAi phenotypes. • Each Gene has 1-328 annotations. • 3,000 Genes have 10 or more annotations. • More annotations to each gene makes it more difficulty to comprehend biological function.
  • 5.
    IWM 2017 User complaints:Lists of mutant phenotypes are difficult to comprehend.
  • 6.
    IWM 2017 Phenotype AnnotationSummary RIBBON mouse IGF1 TABLE fly InR
  • 7.
    IWM 2017 SObA Graph Summaryof Ontology-based Annotations • Integrated: with ontology hierarchy and logical inference • Complete: broad to detailed, interactive • Simple: graph pruned to essential aspects • Uptodate: dynamic and objective summary view better represents biological meaning
  • 8.
    IWM 2017 Untrimmed let-23phenotype graph (92 nodes / 102 edges)
  • 9.
    IWM 2017 LCA-filtered let-23phenotype graph (45 nodes / 52 edges)
  • 10.
    IWM 2017 LCA+Longest path-filteredlet-23 phenotype graph (45 nodes / 49 edges)
  • 11.
  • 12.
    IWM 2017 Phenotype GraphLive Demo • Direct vs. Inferred Annotation Nodes • Node Size is Proportional to Annotation Count (on- off) • Interactive graph • Exportable fully labelled graph (staging site)
  • 13.
    IWM 2017 SObA Graphfor GO Annotations
  • 14.
    IWM 2017 Big ThanksTo • Sibyl Gao and Todd Harris • Seth Carbon and Chris Mungall (AmiGO 2)

Editor's Notes

  • #3 At WormBase, we develop ontologies and use these structured controlled vocabularies to annotate genes extensively. Therefore, we want to make sure this information is easily accessible to our users. Browsing from the perspective of the ontologies,
  • #4 There is a WormBase Ontology Browser suite which offers multiple ways to view the hierarchies and to get at the set of genes annotated with each term. How about browsing from the Genes’ perspective?
  • #5 Say phenotype annotations: There are 10 Thousand genes have phenotype annotation Each gene can have upto 300 annotations (Pop-1 is the winner, followed by daf-16 and daf-2.) The annotation numbers tend to just keep growing as you publish more and we curate more. For genes that have more than a few phenotypes, comprehension across them becomes difficult.
  • #7 How can we make long and varied lists more comprehensible? One way is to canned them into a short list of static items. That is the RIBBON. The benefit of this ribbon approach is that it makes comparisons between genes easier by predefining what phenotypic aspects are important. The potential problem of ribbon approach is just that, it defines what’s important a priori. We started exploring a graph-based approach.
  • #8 The product is the SObA graph. Because ontologies are intrinsically graphs and graphs are visually intuitive to navigate along hierarchical structures. The SObA graph fully supports logical inference, each and every annotation is there in the graph but we do prune nonessential parts of the ontology hierarchy to make it less complex. And importantly, the whole graph is redrawn dynamically based on updated data, most of it is not static. We believe that better represent the biological meaning of annotations.
  • #9 Here I use let-23 as an example to show the pruning process. Let-23 is annotated with 30 phenotype terms. Adding inferred ones, there are 92 annotating terms and the ontology specifies 102 edges among the terms.
  • #10 An LCA, lowest common ancestor phenotype is an inferred, broader phenotype that multiple annotating phenotypes share. It represents the union or summary, if you will, of the phenotypes that specialize or partiion from it. For example, “Vulval Cell Induction Variant” is the LCA of “Vulvaless” and “Vulval Cell Induction Increase”. We think non-LCAs provide less useful information thus they are filtered out.
  • #11 We also hide redundant connections to simplify the graph.
  • #14 We are also developing a SObA graph for Gene Ontology annotations.
  • #15 Sibyl and Todd helped us implementing Cytoscape javascript on WormBase web site. Our backend SOLR document store is modified from the one developed by Seth, Chris and others for the AmiGO2 project.