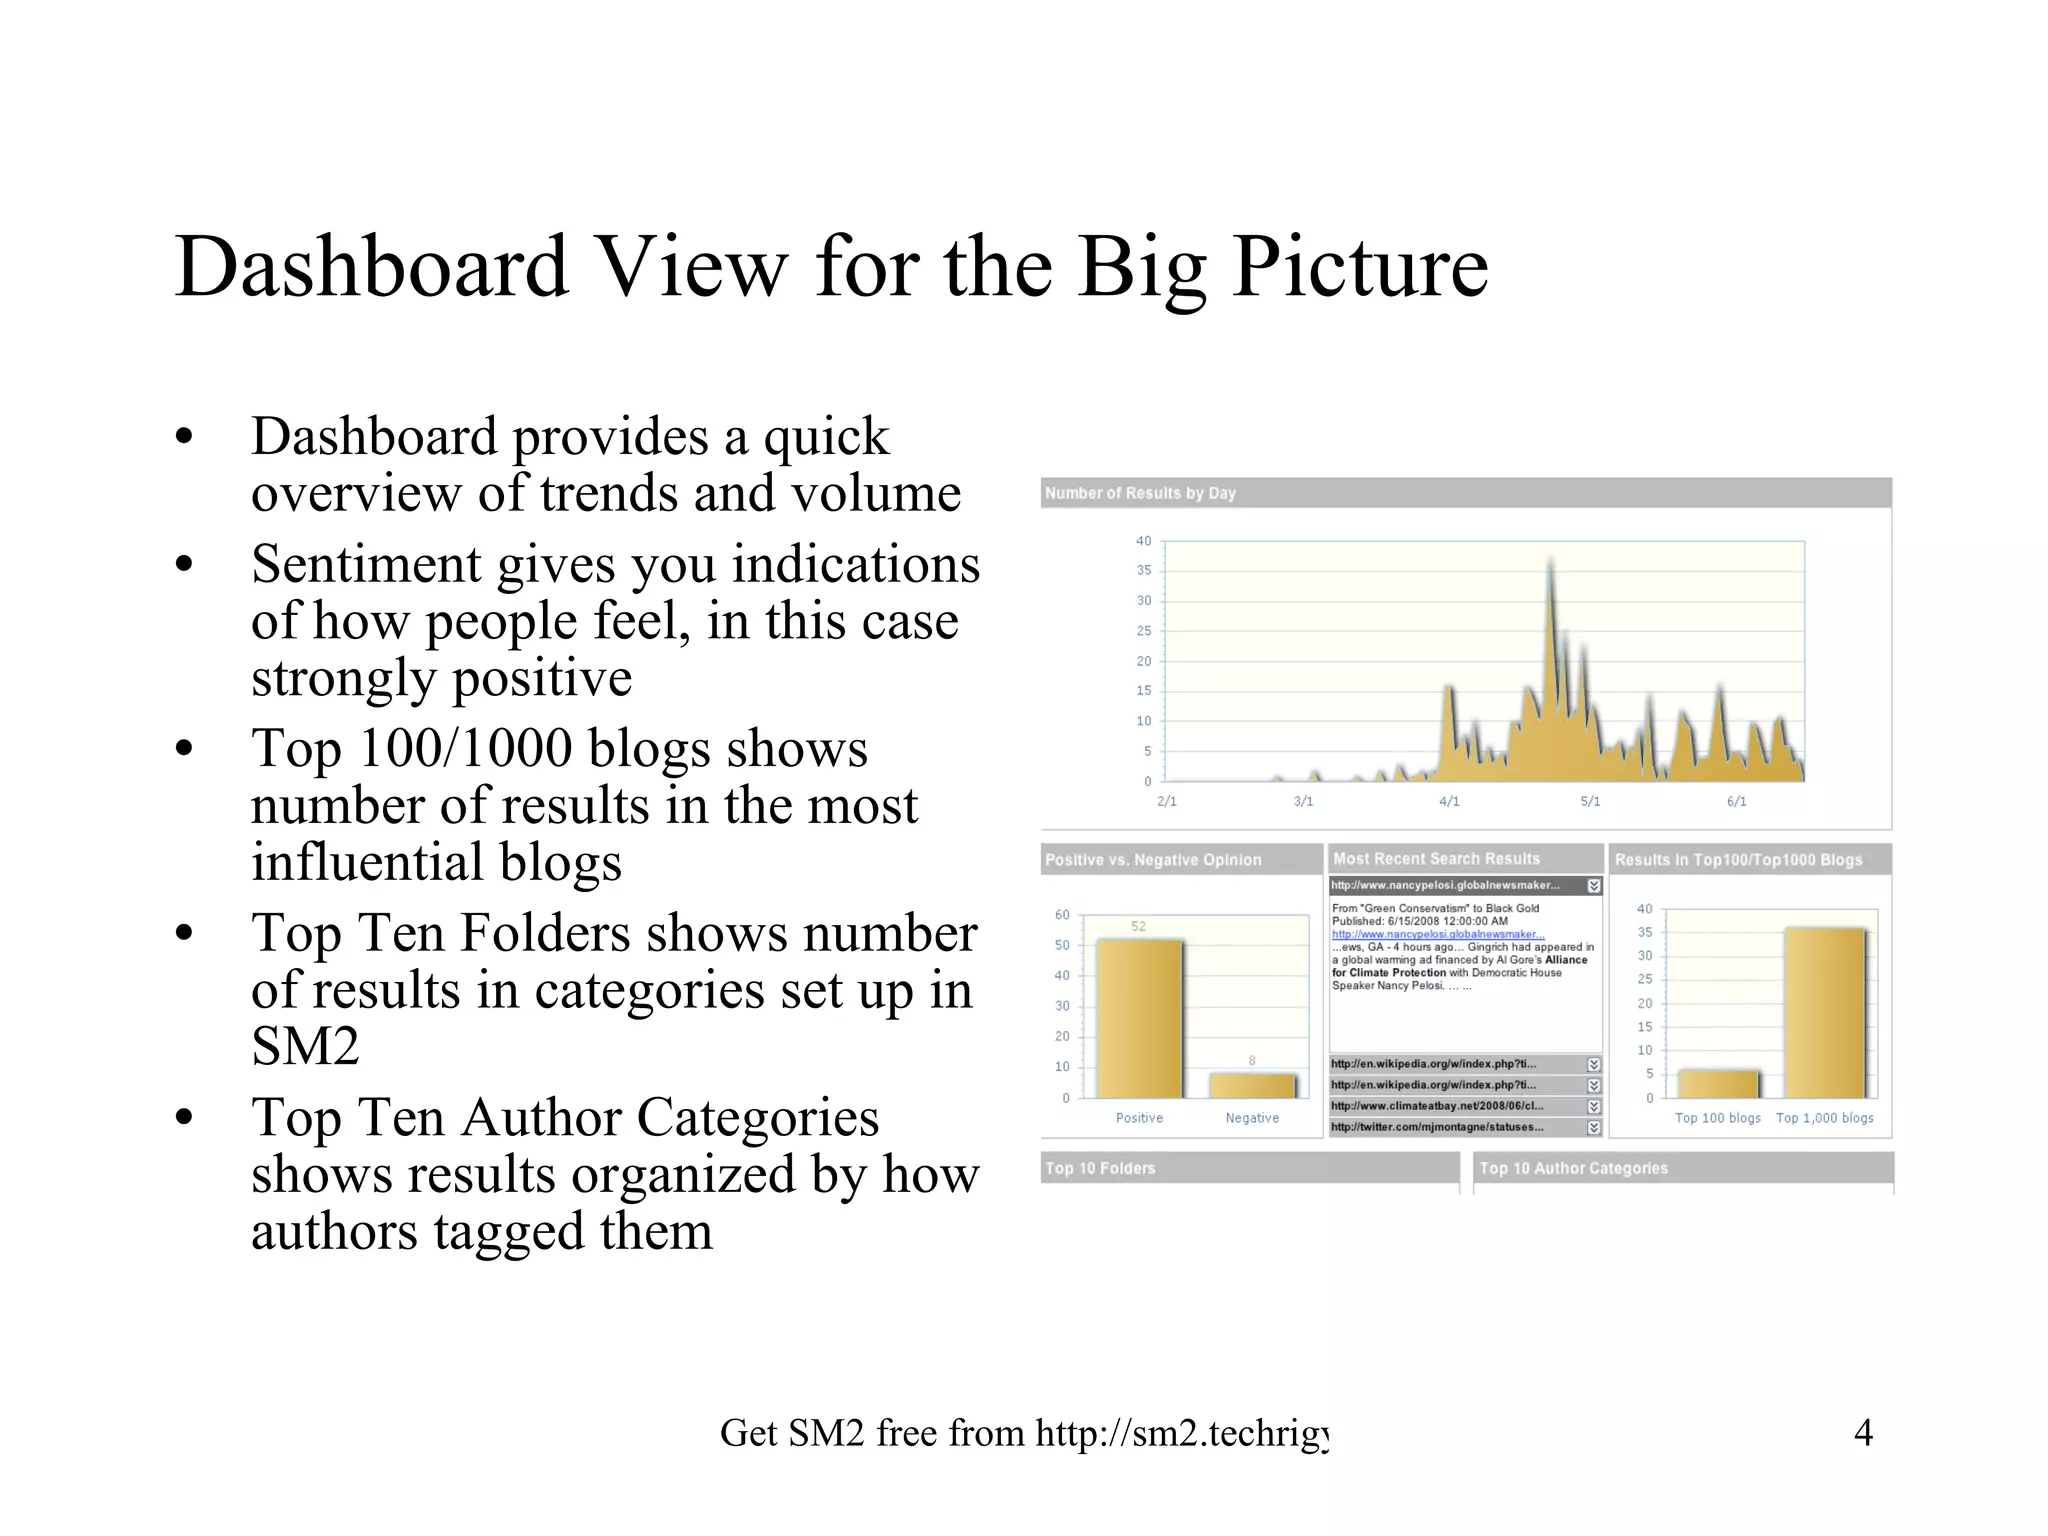
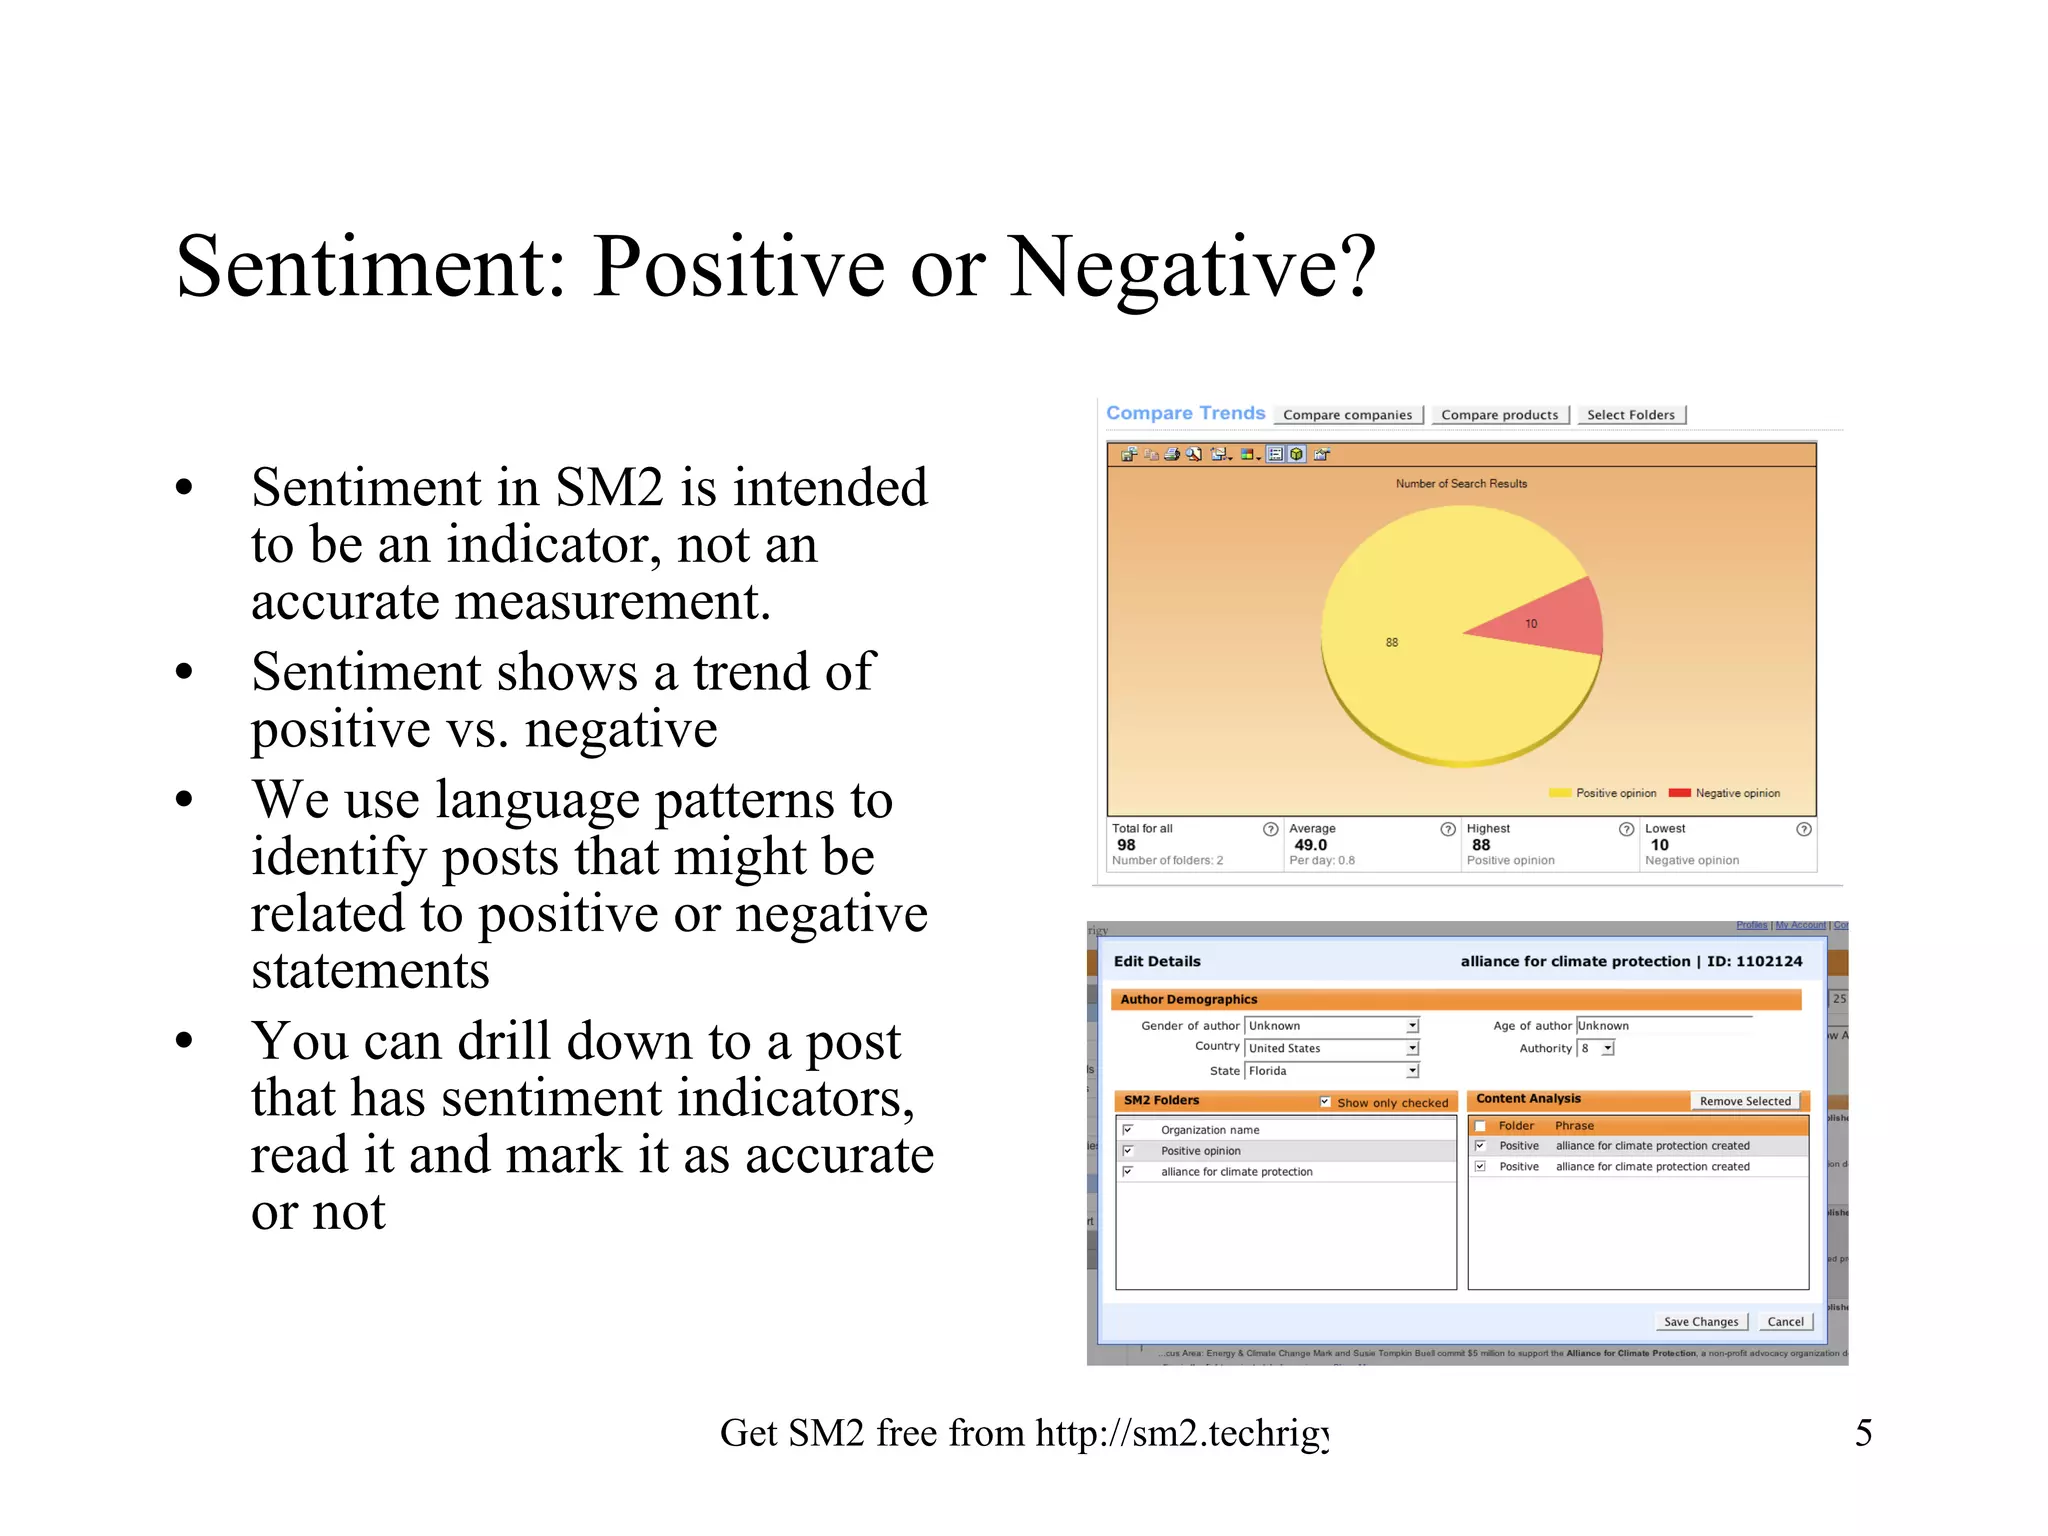
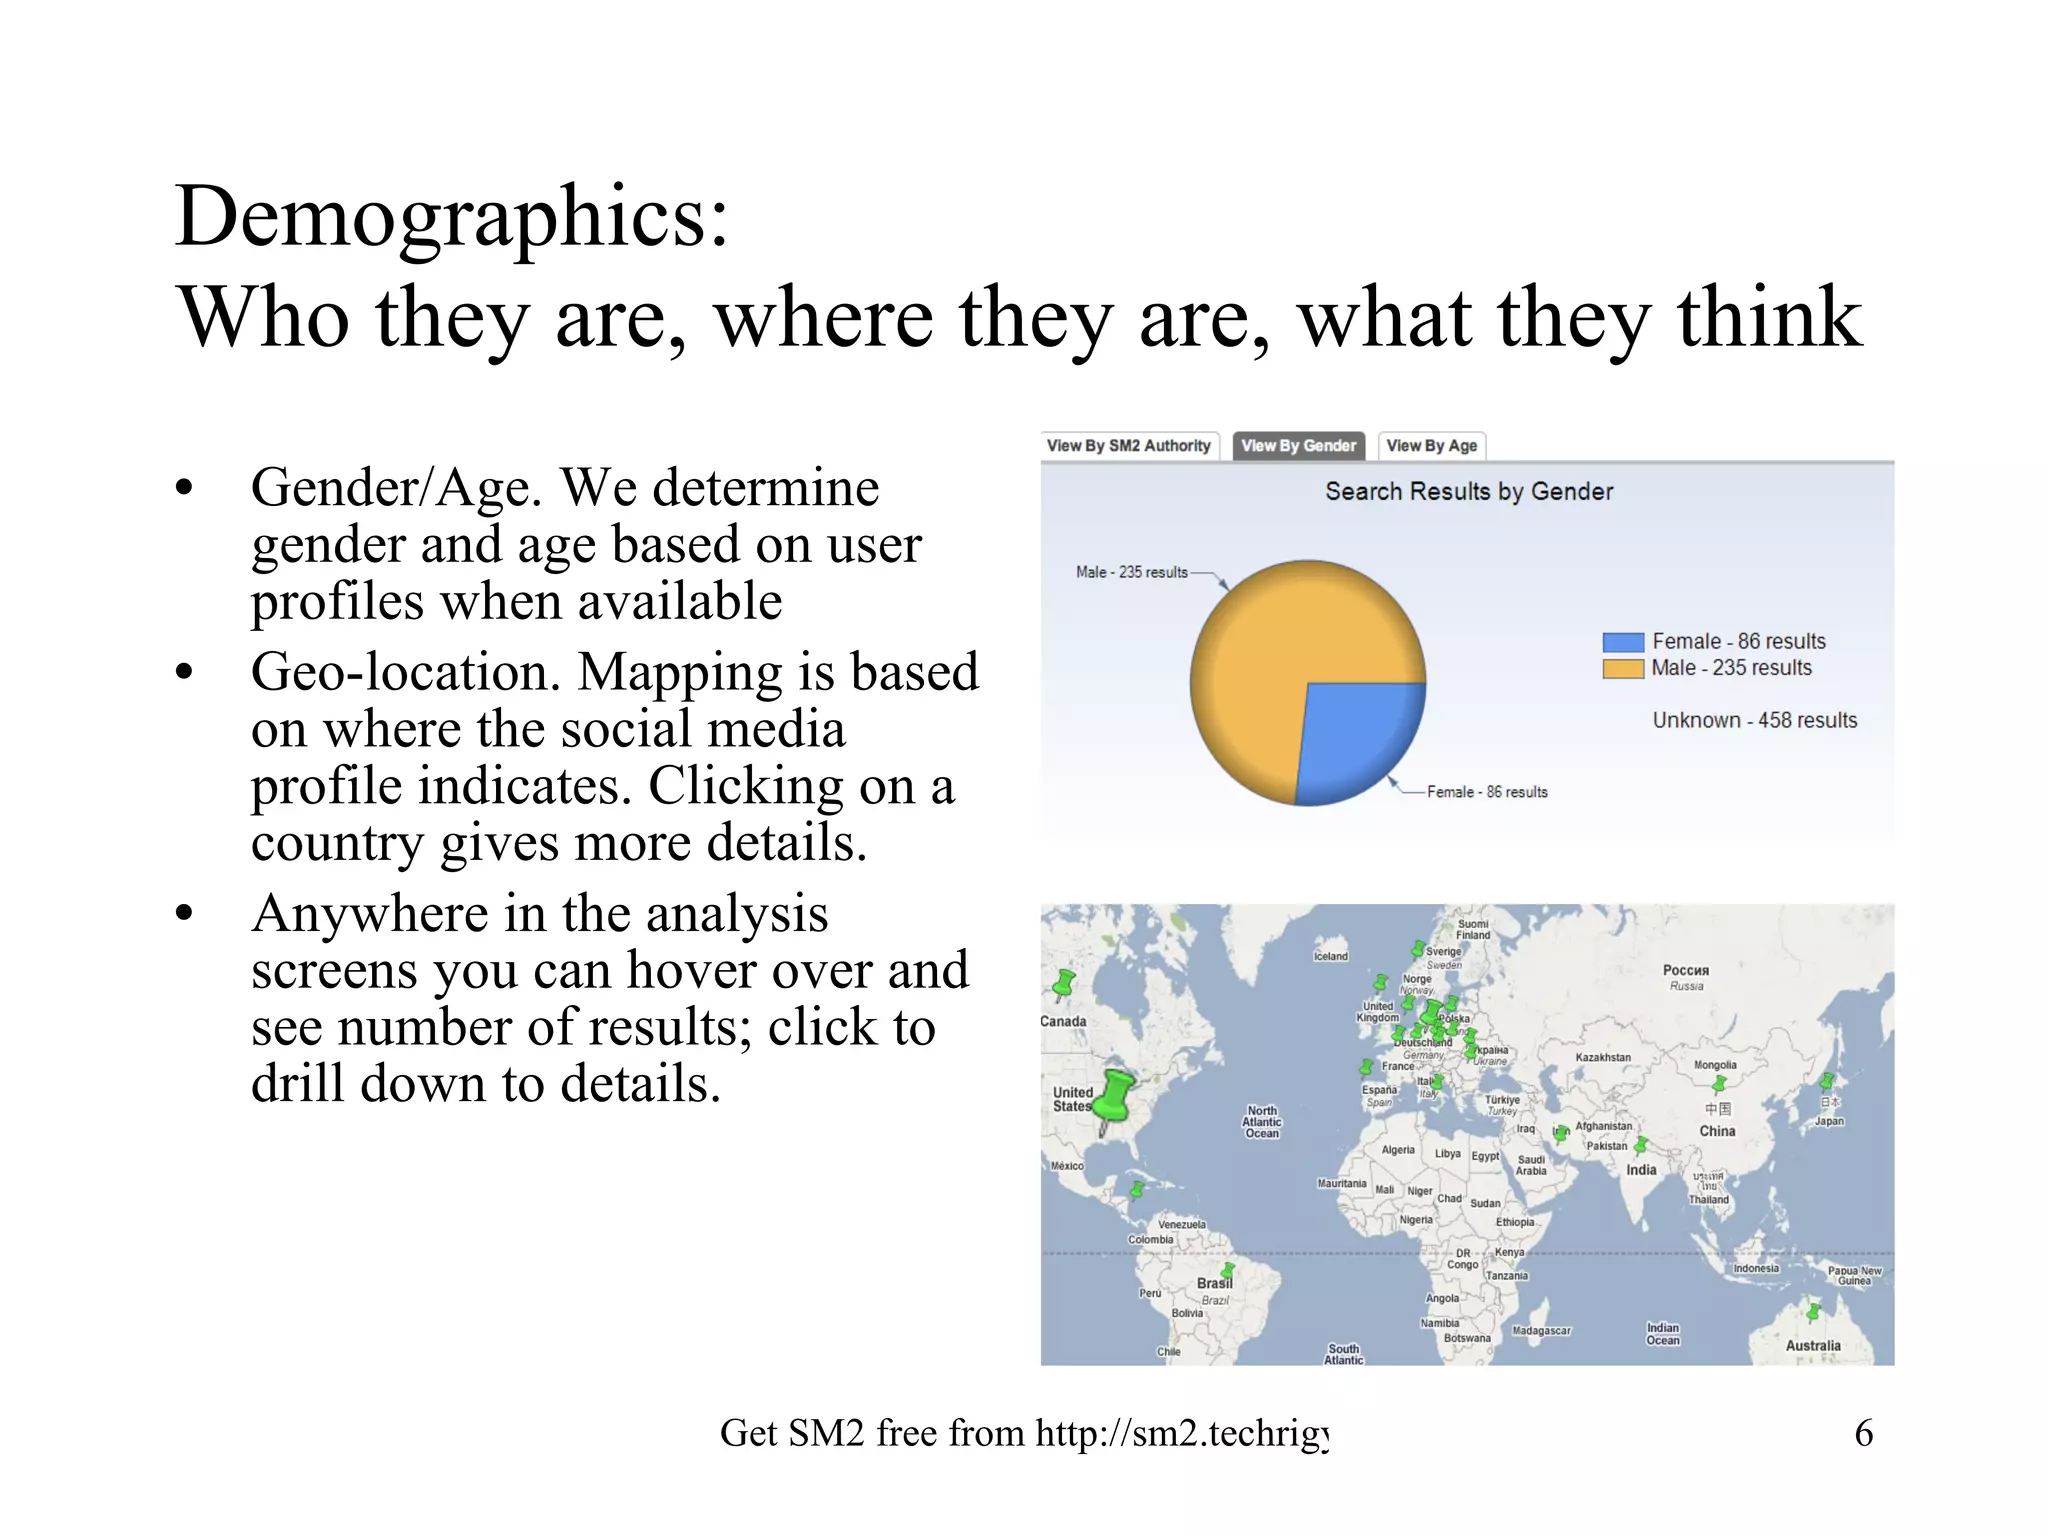
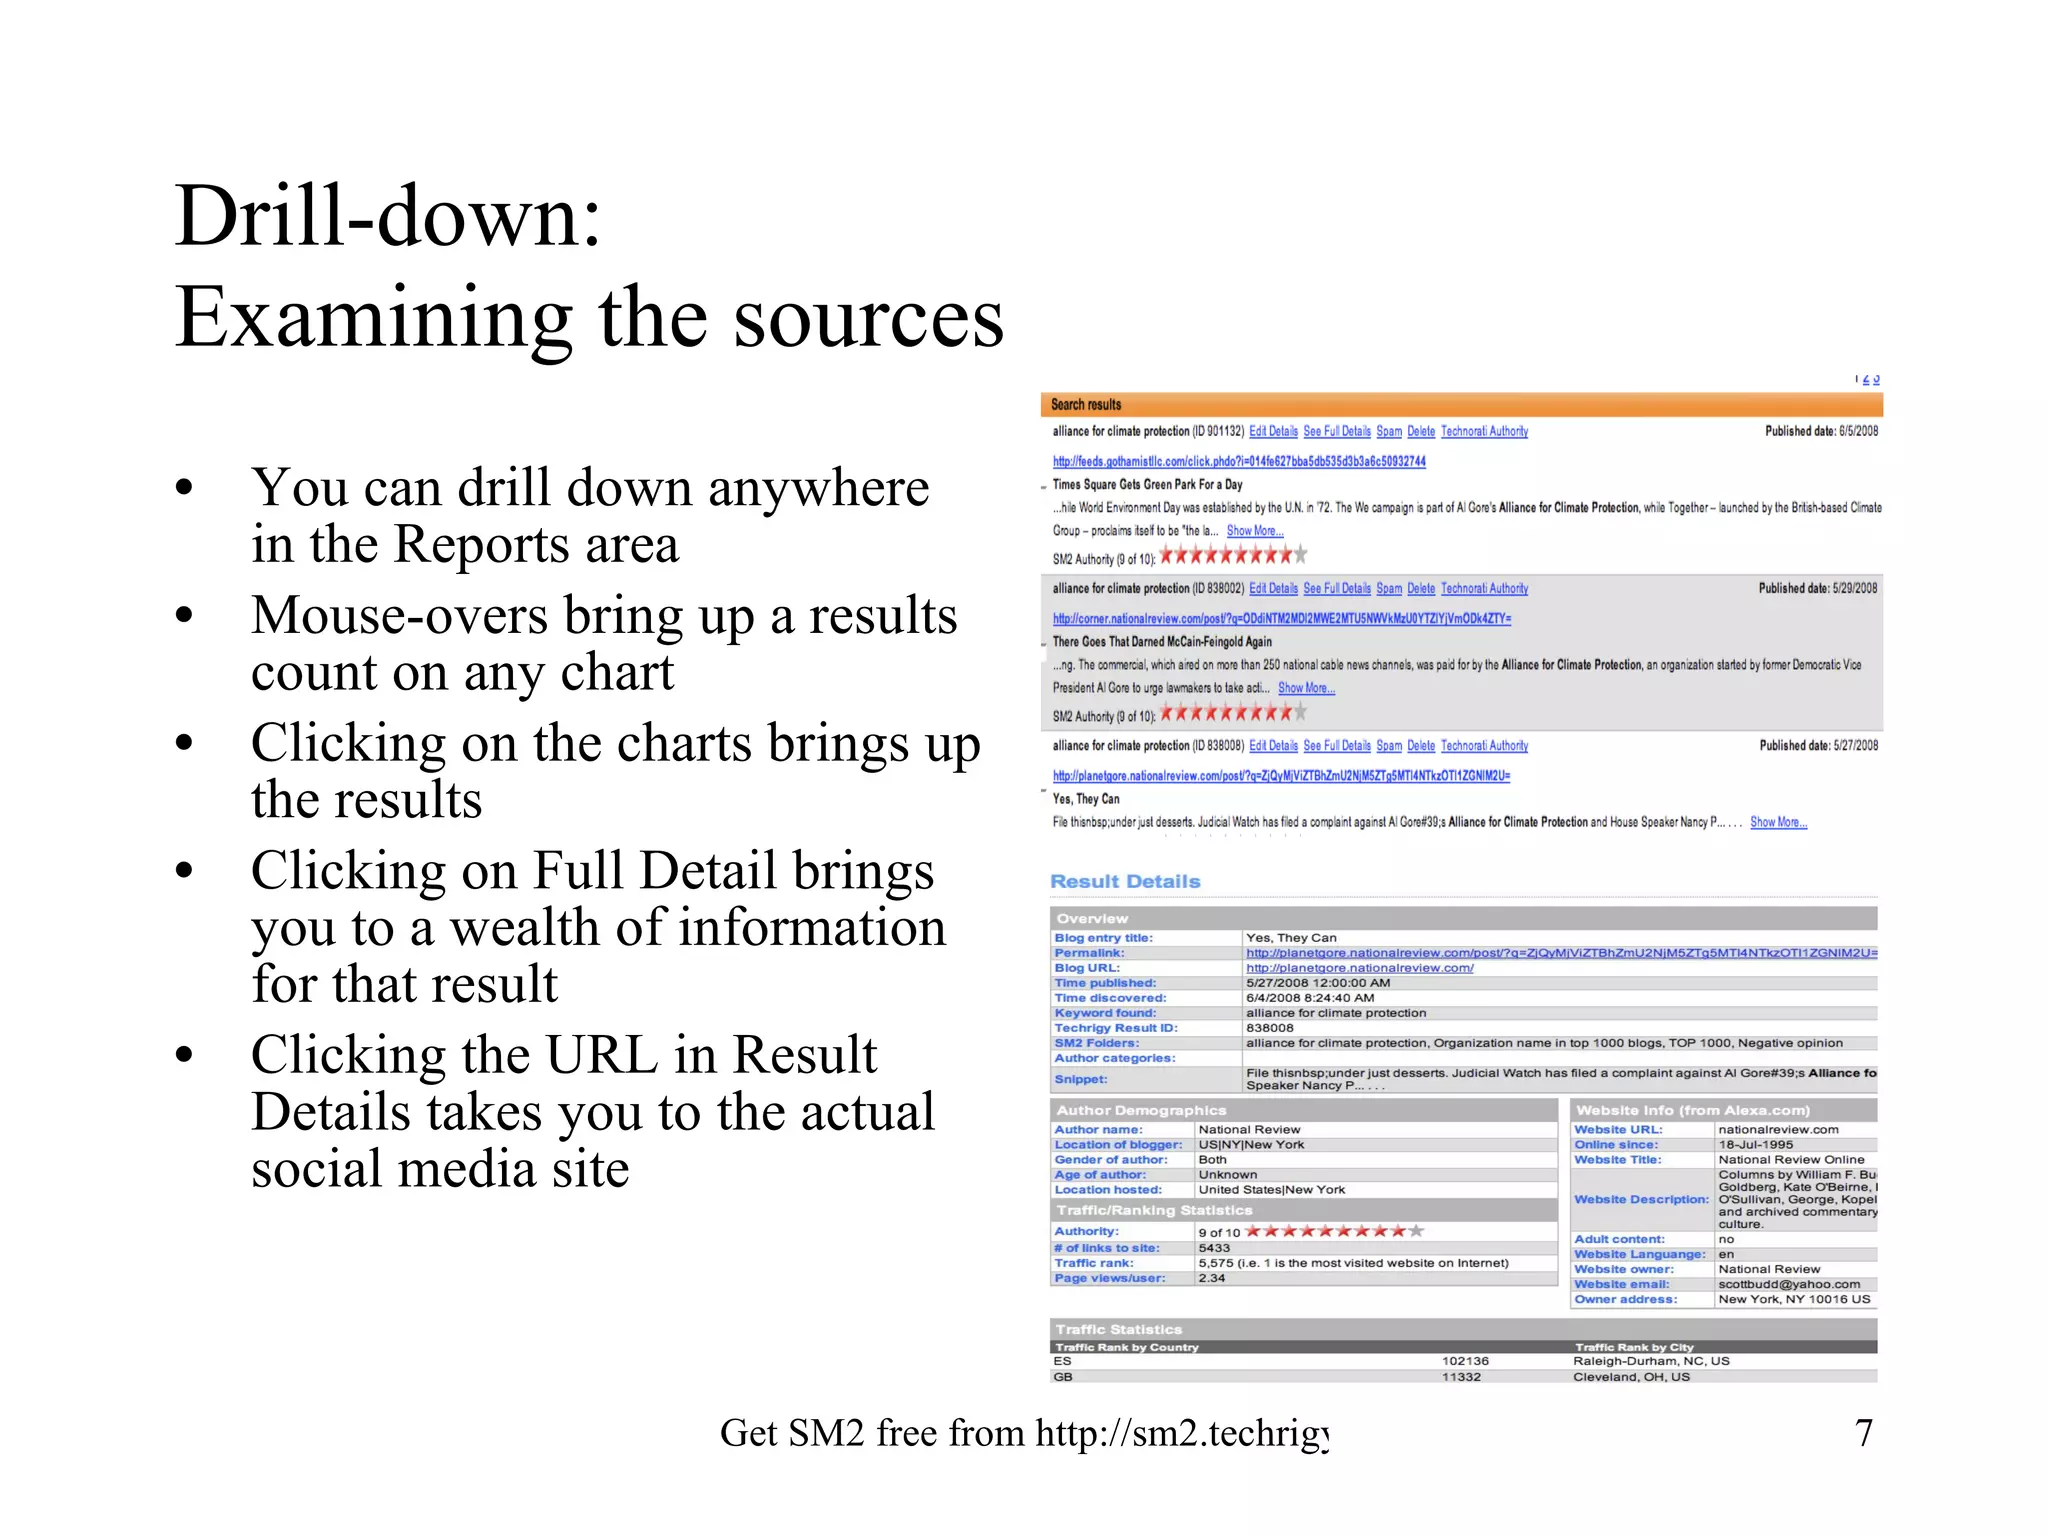
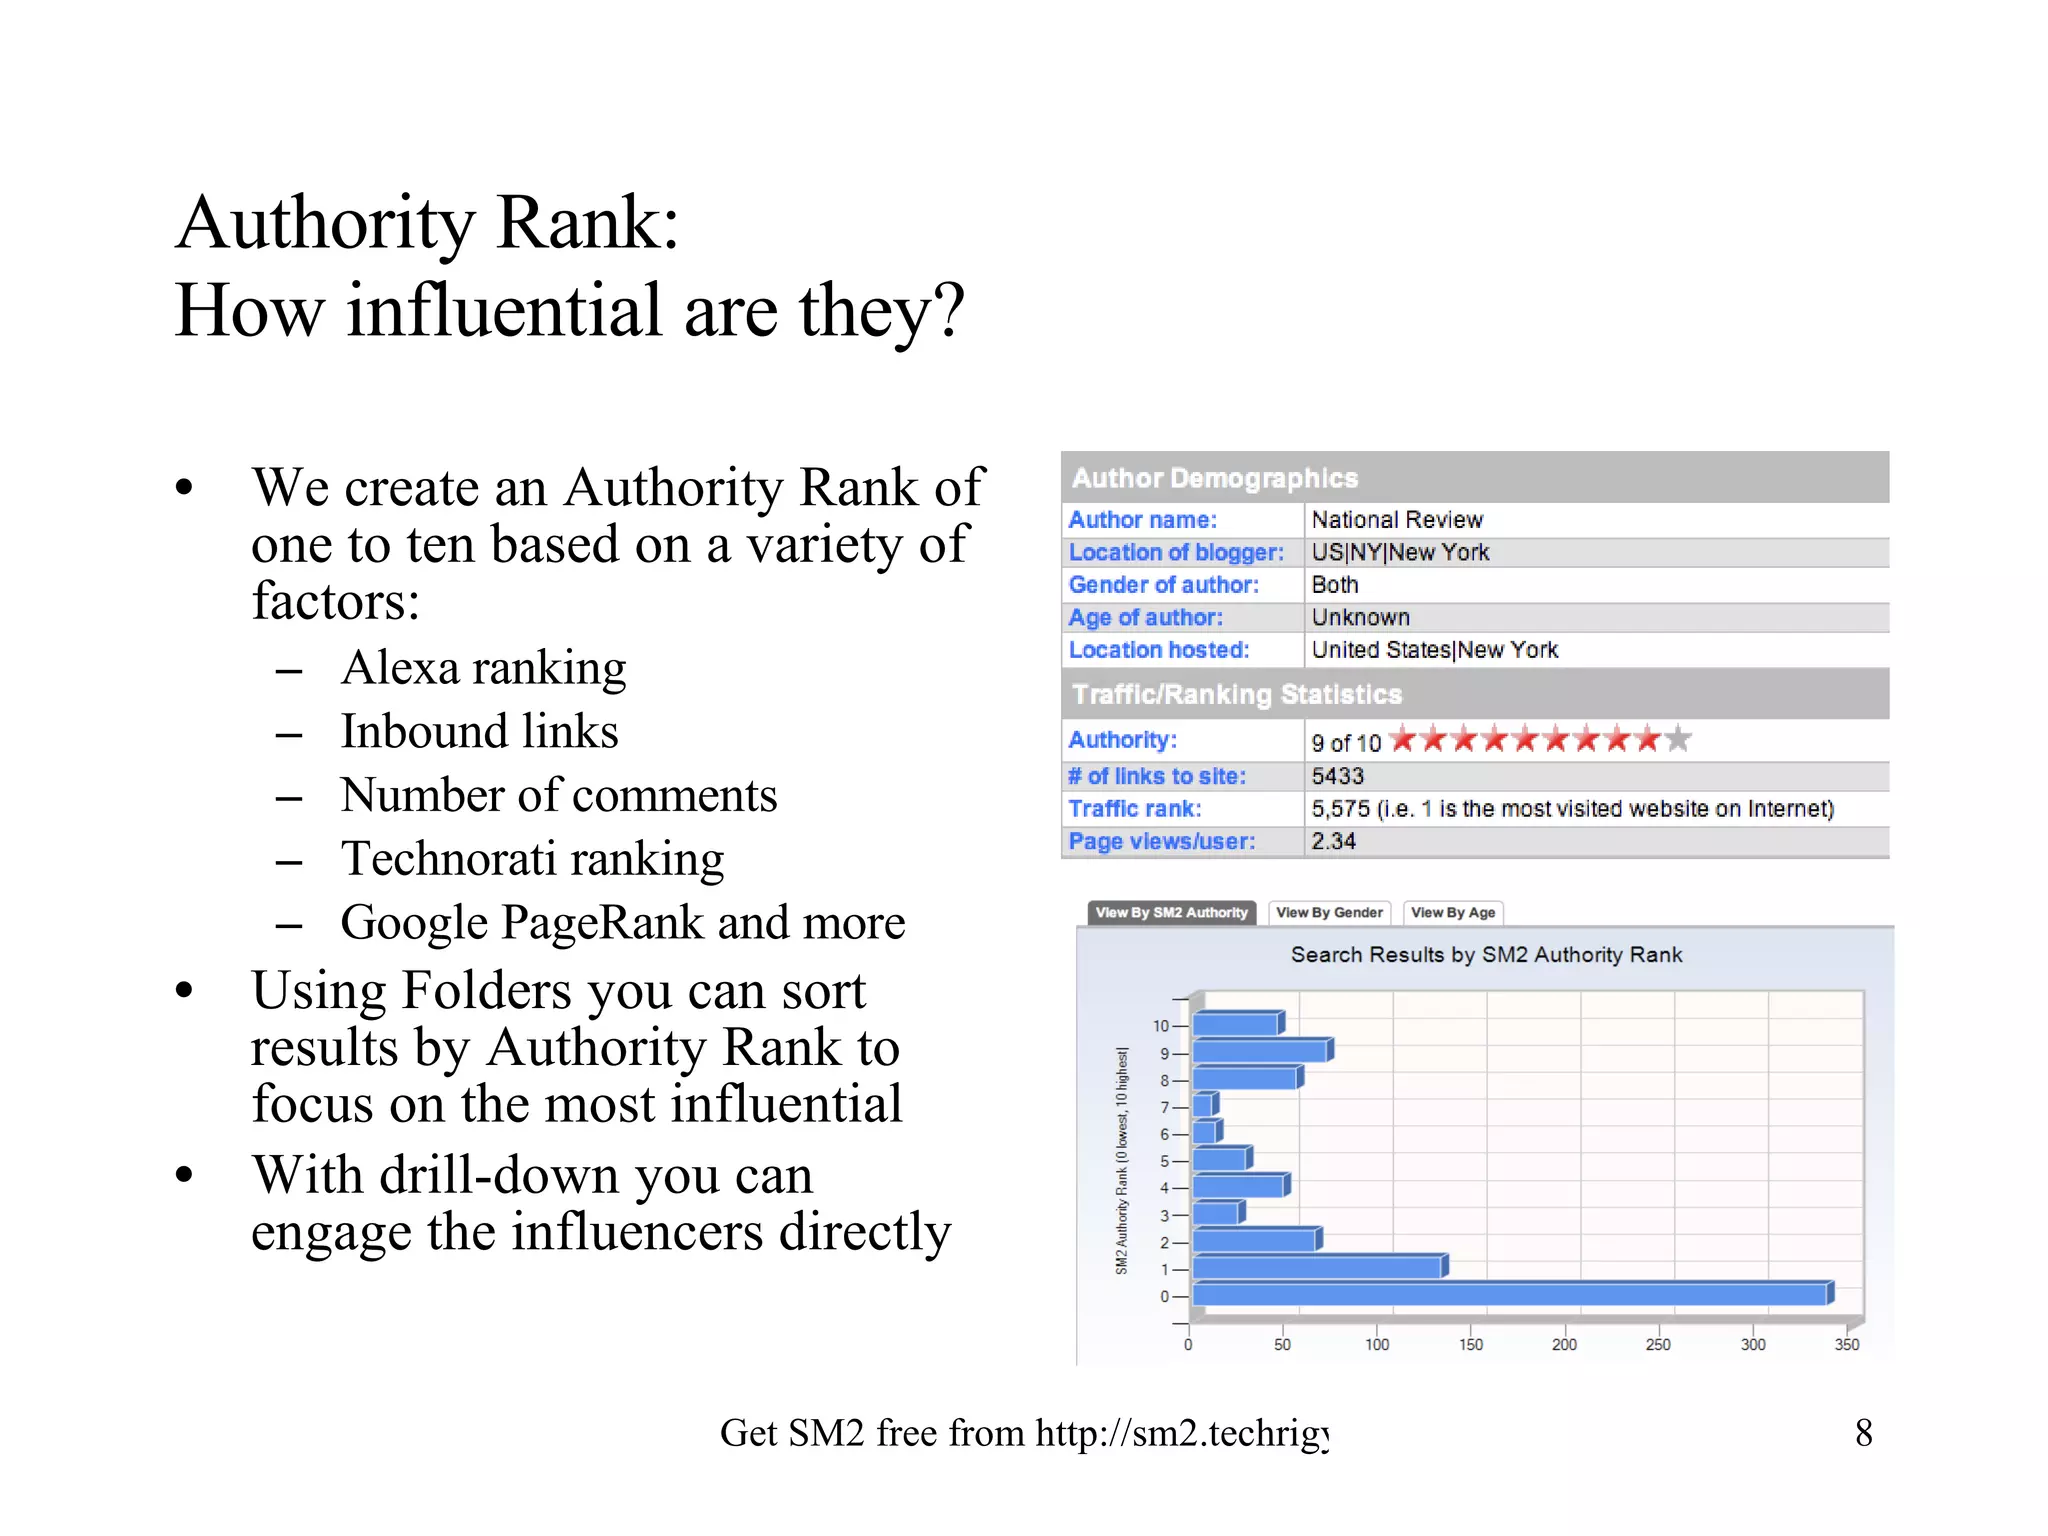
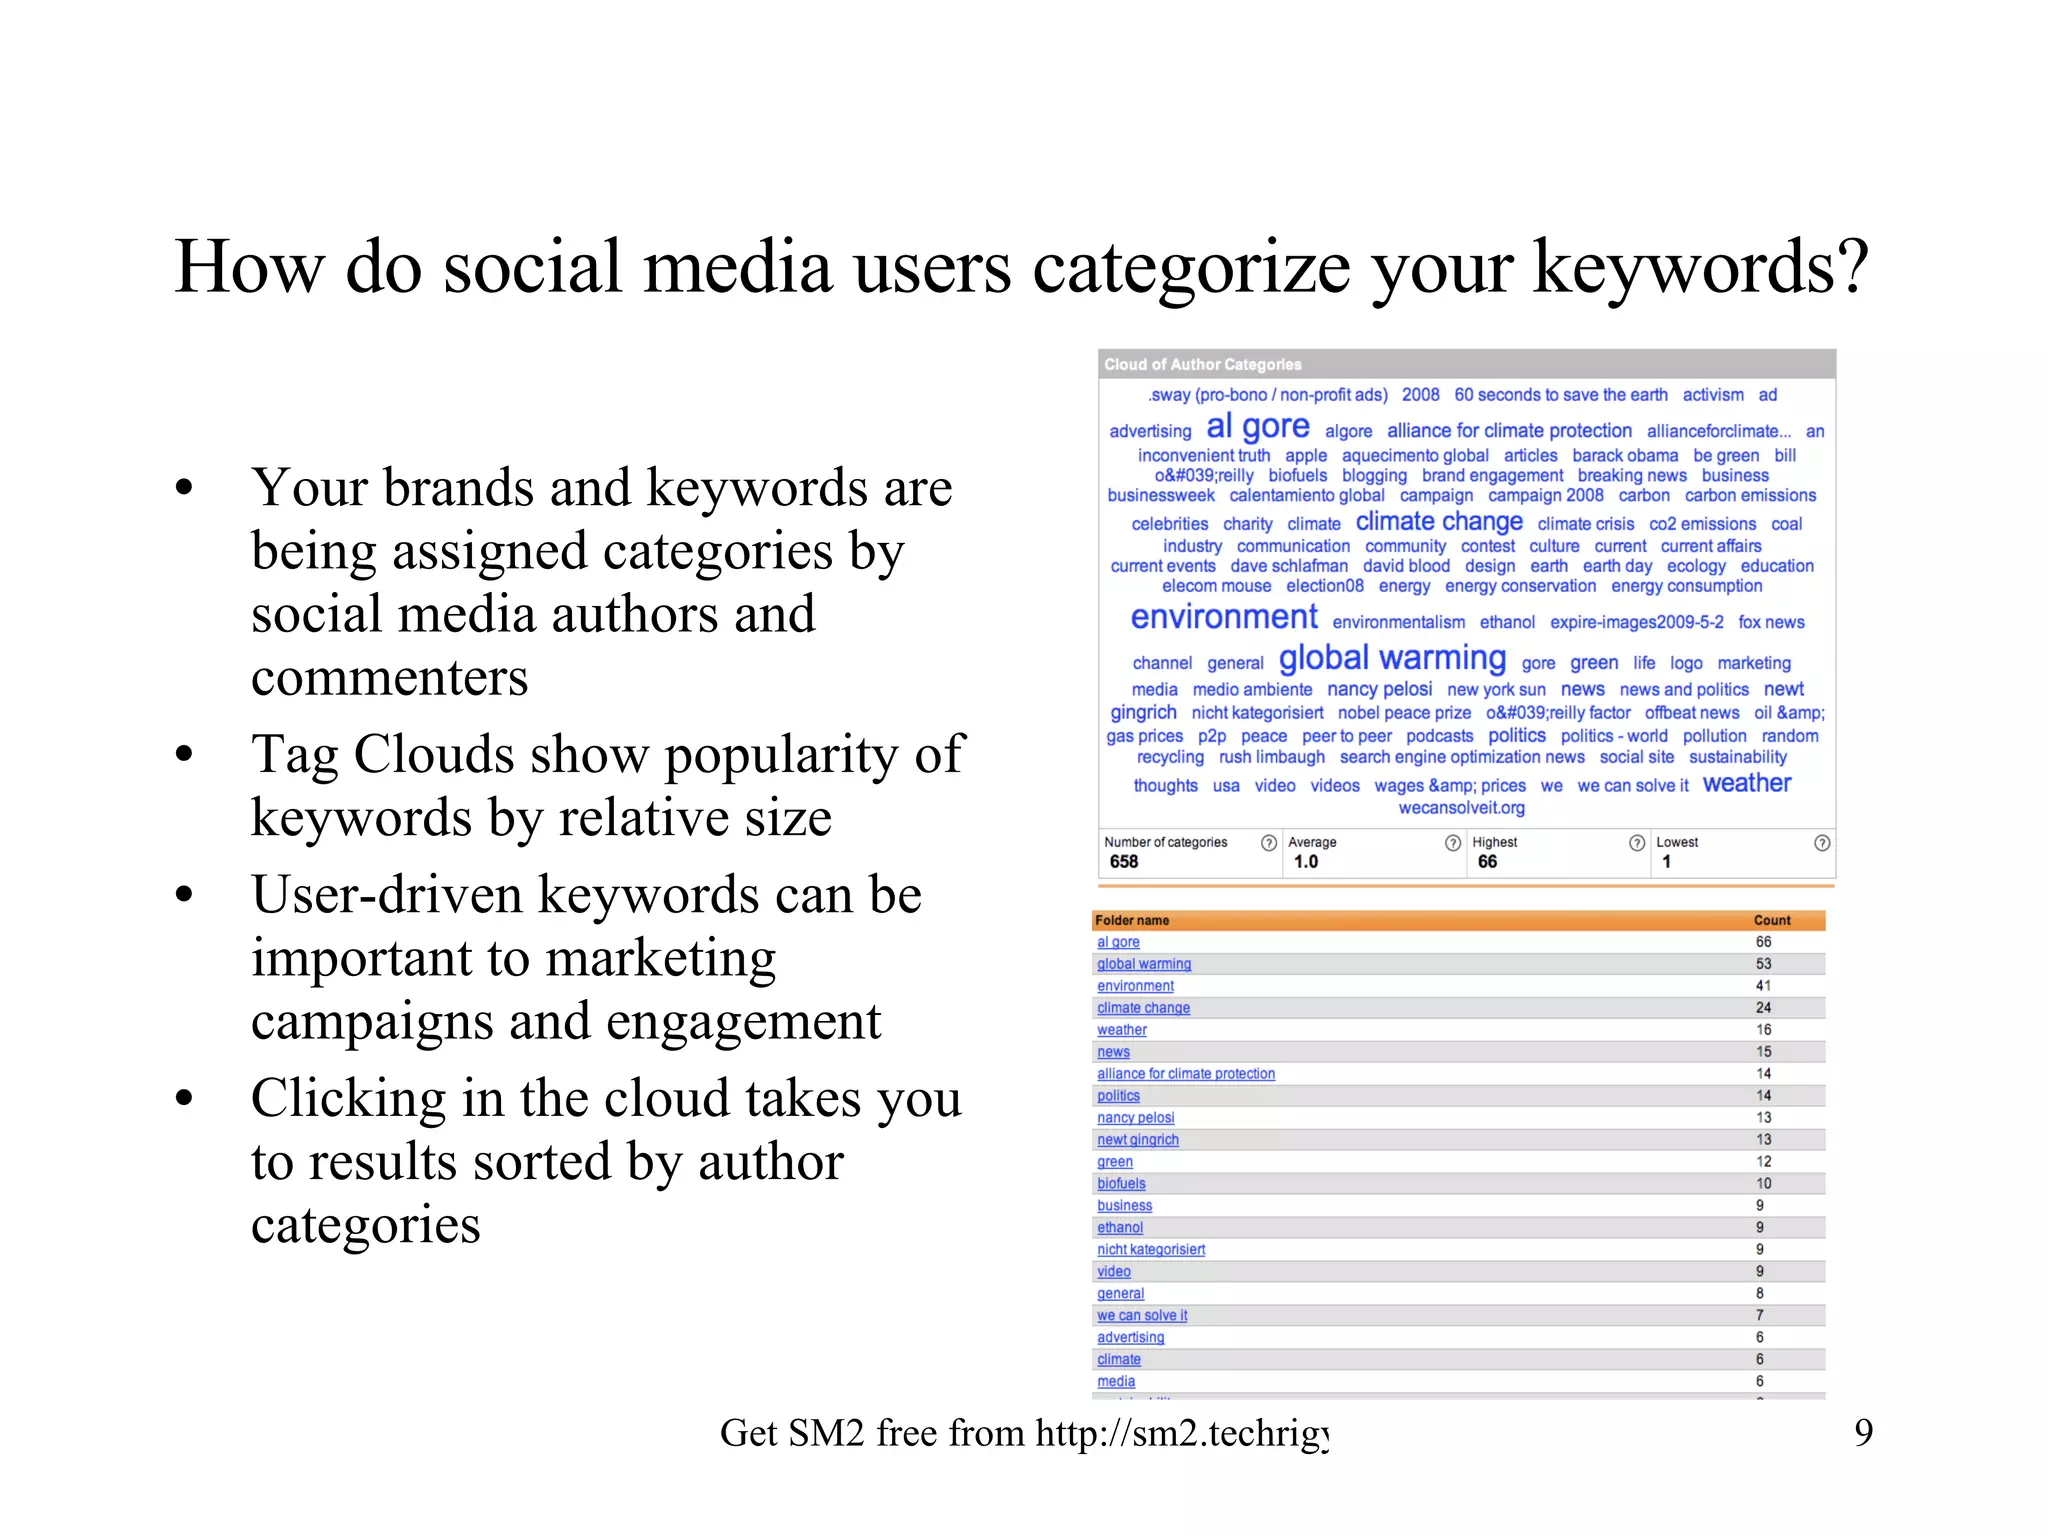
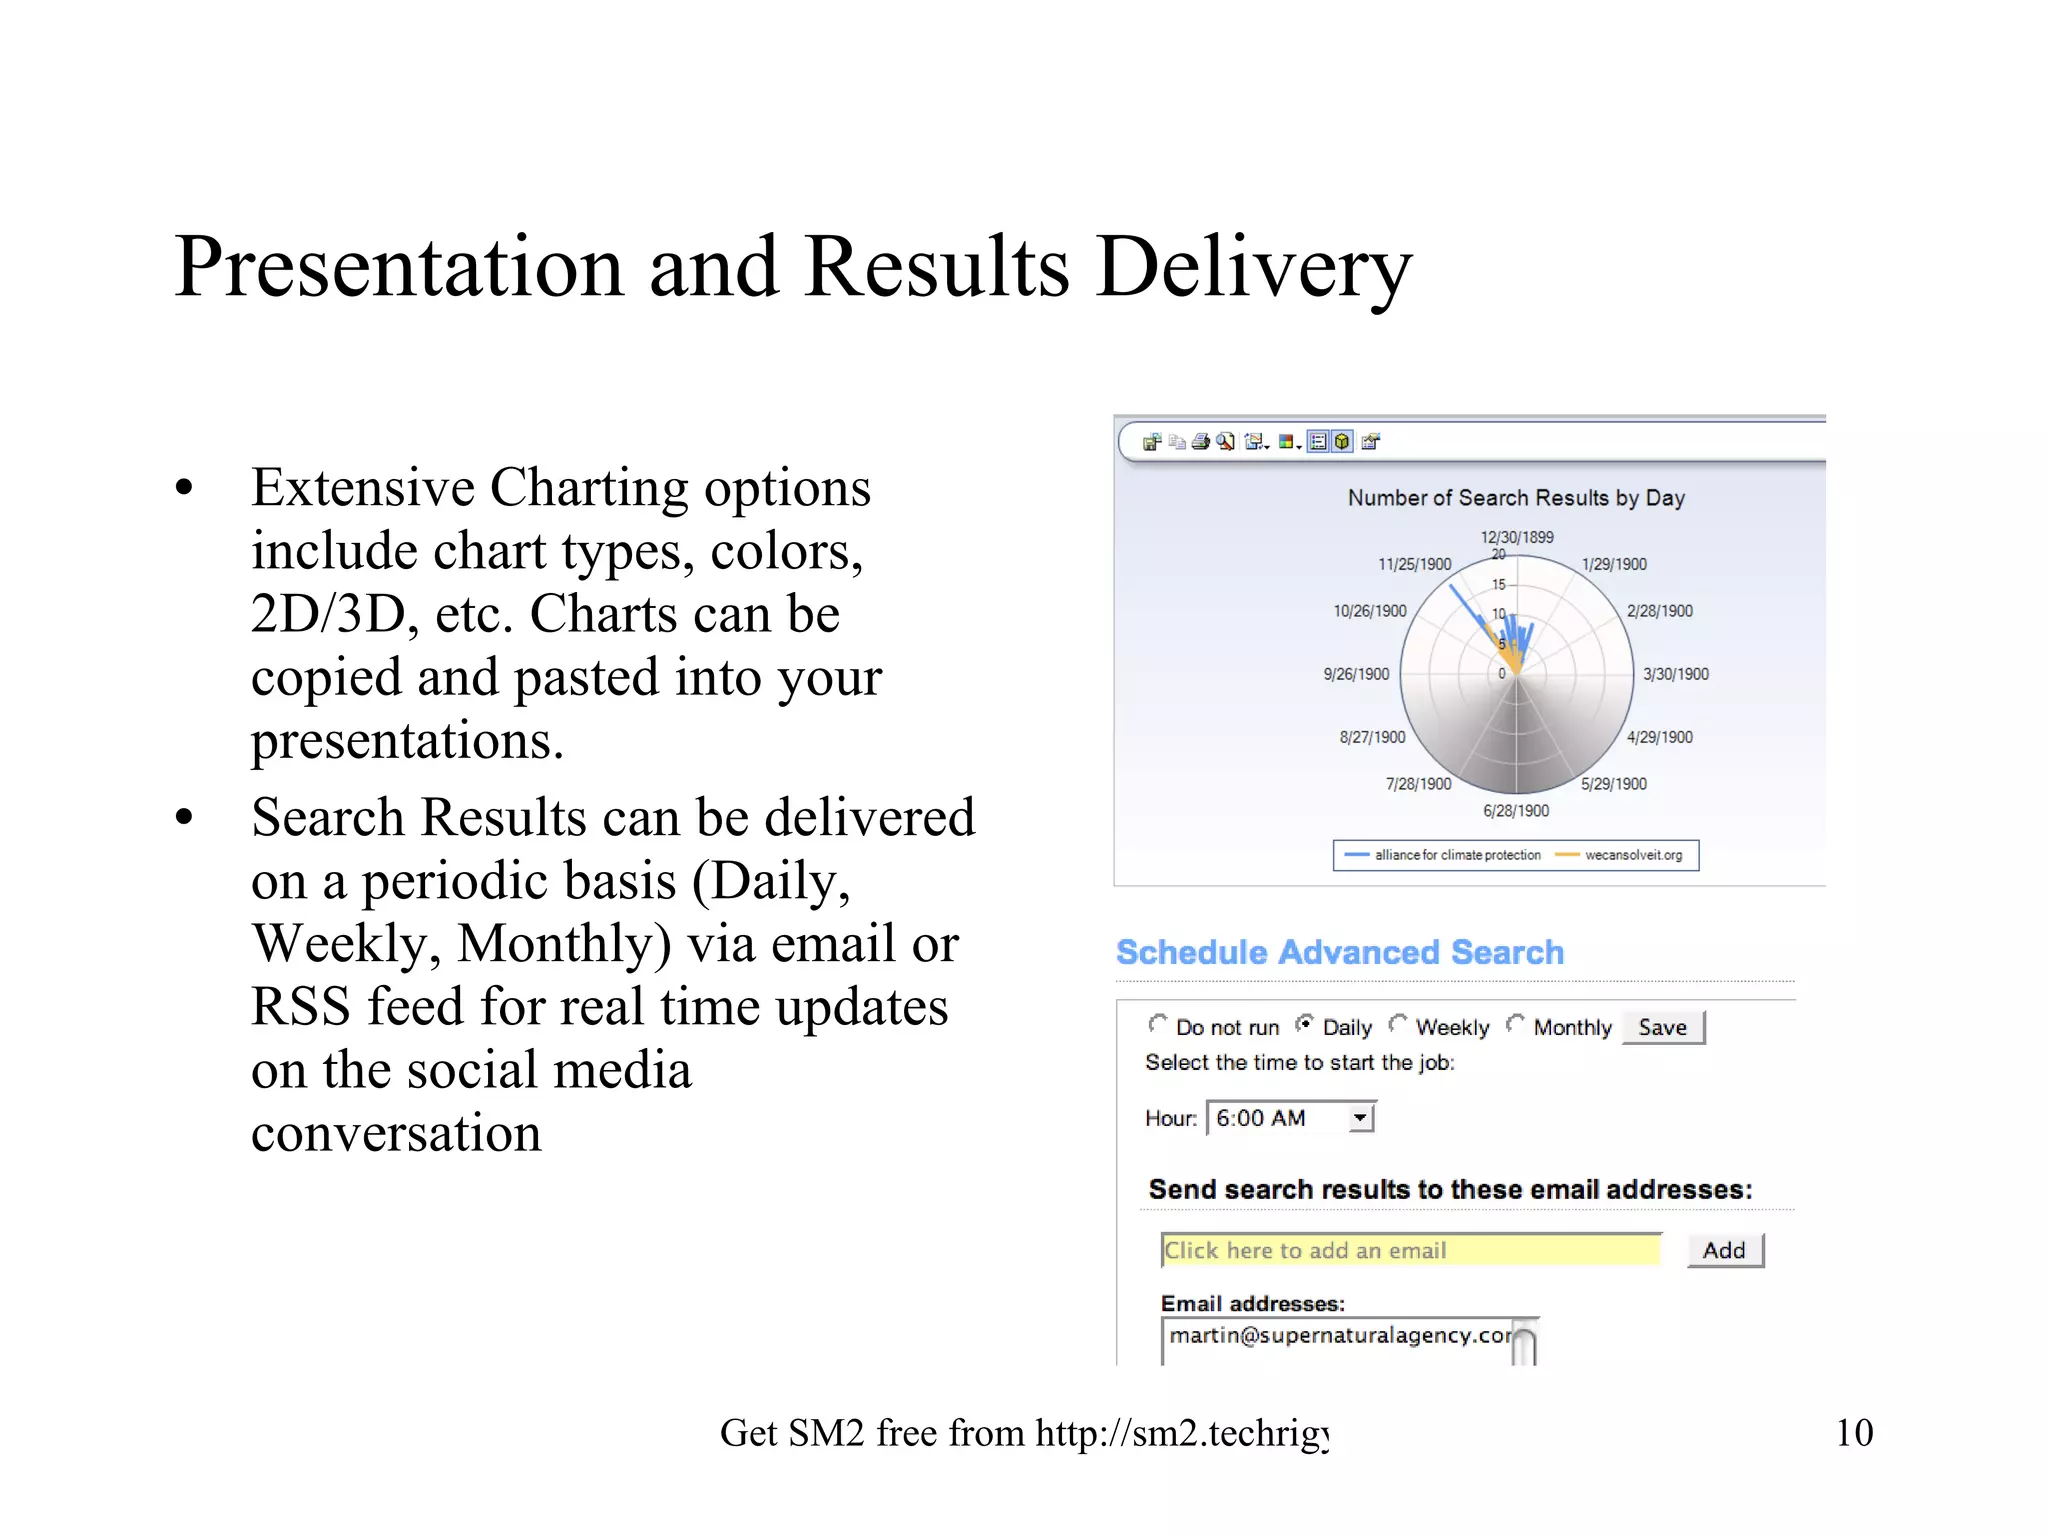
Using SM2’s Analysis Tools A Guide to Presenting Social Media Monitoring Results Prepared by Techrigy Inc.
Using This Guide This guide uses an example from an actual SM2 search The format of the analysis may be copied or adapted for your use Charts and images are screen captures from SM2 from Techrigy
Search Example: WeCanSolveIt.org The Alliance for Climate Change, Al Gore’s organization launched a global awareness and call to action campaign called We Can Solve It with a logo that is stylized version of the word ‘we’. The keyword set up was simple and used the following: Organizations: WeCanSolveIt.org, Alliance for Climate Change The words ‘Al Gore’ were not used because they would bring back too many unrelated results- we’re only interested in what social media is saying about the campaign itself We also avoided the terms ‘climate change’ and ‘global warming’ as they would return too many irrelevant results The search was run and brought back 772 results. The first result was dated 2/24/08, around the time the campaign was announced.
Dashboard View for the Big Picture Dashboard provides a quick overview of trends and volume Sentiment gives you indications of how people feel, in this case strongly positive Top 100/1000 blogs shows number of results in the most influential blogs Top Ten Folders shows number of results in categories set up in SM2 Top Ten Author Categories shows results organized by how authors tagged them
Sentiment: Positive or Negative? Sentiment in SM2 is intended to be an indicator, not an accurate measurement. Sentiment shows a trend of positive vs. negative We use language patterns to identify posts that might be related to positive or negative statements You can drill down to a post that has sentiment indicators, read it and mark it as accurate or not
Demographics:  Who they are, where they are, what they think Gender/Age. We determine gender and age based on user profiles when available Geo-location. Mapping is based on where the social media profile indicates. Clicking on a country gives more details. Anywhere in the analysis screens you can hover over and see number of results; click to drill down to details.
Drill-down:  Examining the sources You can drill down anywhere in the Reports area  Mouse-overs bring up a results count on any chart Clicking on the charts brings up the results Clicking on Full Detail brings you to a wealth of information for that result Clicking the URL in Result Details takes you to the actual social media site
Authority Rank:  How influential are they? We create an Authority Rank of one to ten based on a variety of factors: Alexa ranking Inbound links Number of comments Technorati ranking Google PageRank and more Using Folders you can sort results by Authority Rank to focus on the most influential With drill-down you can engage the influencers directly
How do social media users categorize your keywords? Your brands and keywords are being assigned categories by social media authors and commenters Tag Clouds show popularity of keywords by relative size User-driven keywords can be important to marketing campaigns and engagement Clicking in the cloud takes you to results sorted by author categories
Presentation and Results Delivery Extensive Charting options include chart types, colors, 2D/3D, etc. Charts can be copied and pasted into your presentations. Search Results can be delivered on a periodic basis (Daily, Weekly, Monthly) via email or RSS feed for real time updates on the social media conversation
Monitoring social media is the first step, engagement is the second… Start by  listening  to the conversation Then  join the conversation as a participant , not someone pitching something Energize your supporters  through engagement, sampling, access, etc. Support social media users  by providing tools like social networks, forums, blogs, etc. Embrace customers  by integrating their suggestions, resolving their complaints and generally engaging them in your product design/marketing processes
Social media is  not  a fad It is a new communication layer built upon the Internet According to a recent Universal McCann study, 50% of all US adults are using social media- meaning we’re far beyond the early adopter stage It will replace or augment many traditional means of outreach It is sensitive to nuance and very fast to respond/critique New media choices appear in the hundreds of thousands daily: New blogs, Twitter-type services, social network pages As both a challenge and an opportunity, it cannot be ignored.
SM2:  Providing Visibility Into Social Media Want to know more? Call us at 585-586-0160 Email us at info@techrigy.com Visit us at  www.techrigy.com Join us at http://conversation.techrigy.com

Sm2 Analysis Guide

  • 1.
    Using SM2’s AnalysisTools A Guide to Presenting Social Media Monitoring Results Prepared by Techrigy Inc.
  • 2.
    Using This GuideThis guide uses an example from an actual SM2 search The format of the analysis may be copied or adapted for your use Charts and images are screen captures from SM2 from Techrigy
  • 3.
    Search Example: WeCanSolveIt.orgThe Alliance for Climate Change, Al Gore’s organization launched a global awareness and call to action campaign called We Can Solve It with a logo that is stylized version of the word ‘we’. The keyword set up was simple and used the following: Organizations: WeCanSolveIt.org, Alliance for Climate Change The words ‘Al Gore’ were not used because they would bring back too many unrelated results- we’re only interested in what social media is saying about the campaign itself We also avoided the terms ‘climate change’ and ‘global warming’ as they would return too many irrelevant results The search was run and brought back 772 results. The first result was dated 2/24/08, around the time the campaign was announced.
  • 4.
    Dashboard View forthe Big Picture Dashboard provides a quick overview of trends and volume Sentiment gives you indications of how people feel, in this case strongly positive Top 100/1000 blogs shows number of results in the most influential blogs Top Ten Folders shows number of results in categories set up in SM2 Top Ten Author Categories shows results organized by how authors tagged them
  • 5.
    Sentiment: Positive orNegative? Sentiment in SM2 is intended to be an indicator, not an accurate measurement. Sentiment shows a trend of positive vs. negative We use language patterns to identify posts that might be related to positive or negative statements You can drill down to a post that has sentiment indicators, read it and mark it as accurate or not
  • 6.
    Demographics: Whothey are, where they are, what they think Gender/Age. We determine gender and age based on user profiles when available Geo-location. Mapping is based on where the social media profile indicates. Clicking on a country gives more details. Anywhere in the analysis screens you can hover over and see number of results; click to drill down to details.
  • 7.
    Drill-down: Examiningthe sources You can drill down anywhere in the Reports area Mouse-overs bring up a results count on any chart Clicking on the charts brings up the results Clicking on Full Detail brings you to a wealth of information for that result Clicking the URL in Result Details takes you to the actual social media site
  • 8.
    Authority Rank: How influential are they? We create an Authority Rank of one to ten based on a variety of factors: Alexa ranking Inbound links Number of comments Technorati ranking Google PageRank and more Using Folders you can sort results by Authority Rank to focus on the most influential With drill-down you can engage the influencers directly
  • 9.
    How do socialmedia users categorize your keywords? Your brands and keywords are being assigned categories by social media authors and commenters Tag Clouds show popularity of keywords by relative size User-driven keywords can be important to marketing campaigns and engagement Clicking in the cloud takes you to results sorted by author categories
  • 10.
    Presentation and ResultsDelivery Extensive Charting options include chart types, colors, 2D/3D, etc. Charts can be copied and pasted into your presentations. Search Results can be delivered on a periodic basis (Daily, Weekly, Monthly) via email or RSS feed for real time updates on the social media conversation
  • 11.
    Monitoring social mediais the first step, engagement is the second… Start by listening to the conversation Then join the conversation as a participant , not someone pitching something Energize your supporters through engagement, sampling, access, etc. Support social media users by providing tools like social networks, forums, blogs, etc. Embrace customers by integrating their suggestions, resolving their complaints and generally engaging them in your product design/marketing processes
  • 12.
    Social media is not a fad It is a new communication layer built upon the Internet According to a recent Universal McCann study, 50% of all US adults are using social media- meaning we’re far beyond the early adopter stage It will replace or augment many traditional means of outreach It is sensitive to nuance and very fast to respond/critique New media choices appear in the hundreds of thousands daily: New blogs, Twitter-type services, social network pages As both a challenge and an opportunity, it cannot be ignored.
  • 13.
    SM2: ProvidingVisibility Into Social Media Want to know more? Call us at 585-586-0160 Email us at info@techrigy.com Visit us at www.techrigy.com Join us at http://conversation.techrigy.com