This document provides an overview of Six Sigma, including:
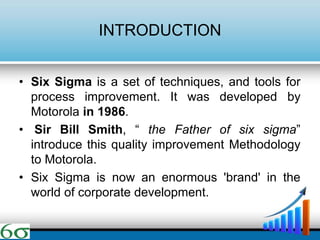
- Six Sigma is a set of techniques and tools aimed at process improvement and reducing defects. It was developed by Motorola in 1986.
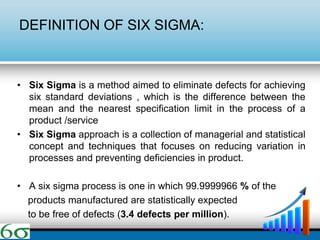
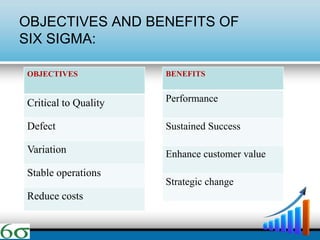
- The objectives of Six Sigma are to focus on critical quality factors, reducing defects and variation, achieving stable operations, and reducing costs. The benefits include improved performance, sustained success, enhanced customer value, and enabling strategic change.
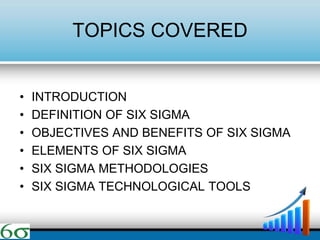
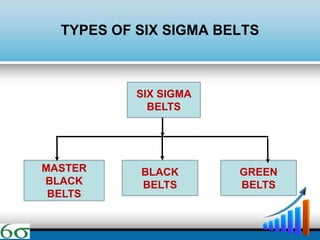
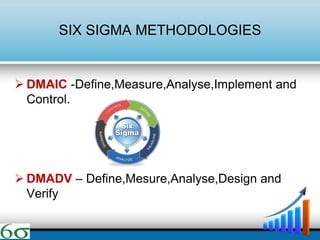
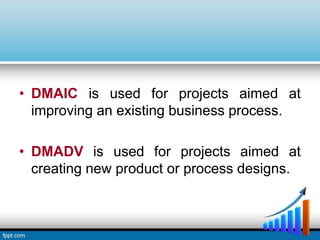
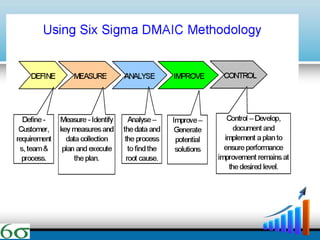
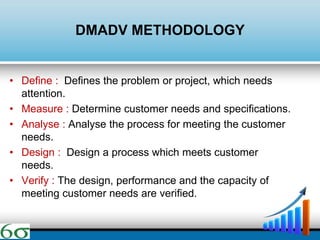
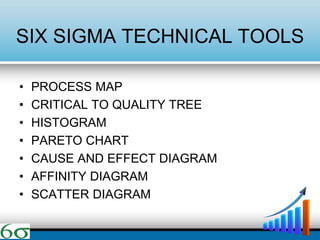
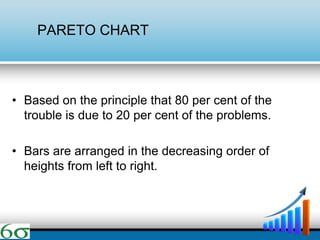
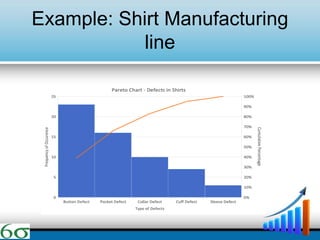
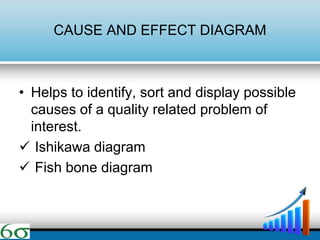
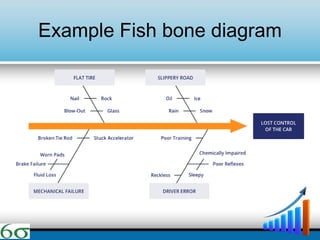
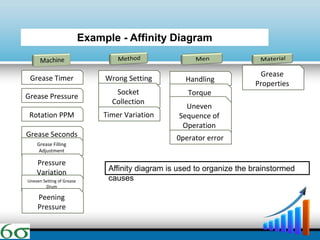
- The DMAIC and DMADV methodologies are explained as the primary approaches used in Six Sigma, along with the roles of various "belts". Technical tools like Pareto charts, cause-and-effect diagrams, and affinity diagrams are also summarized.