Download to read offline

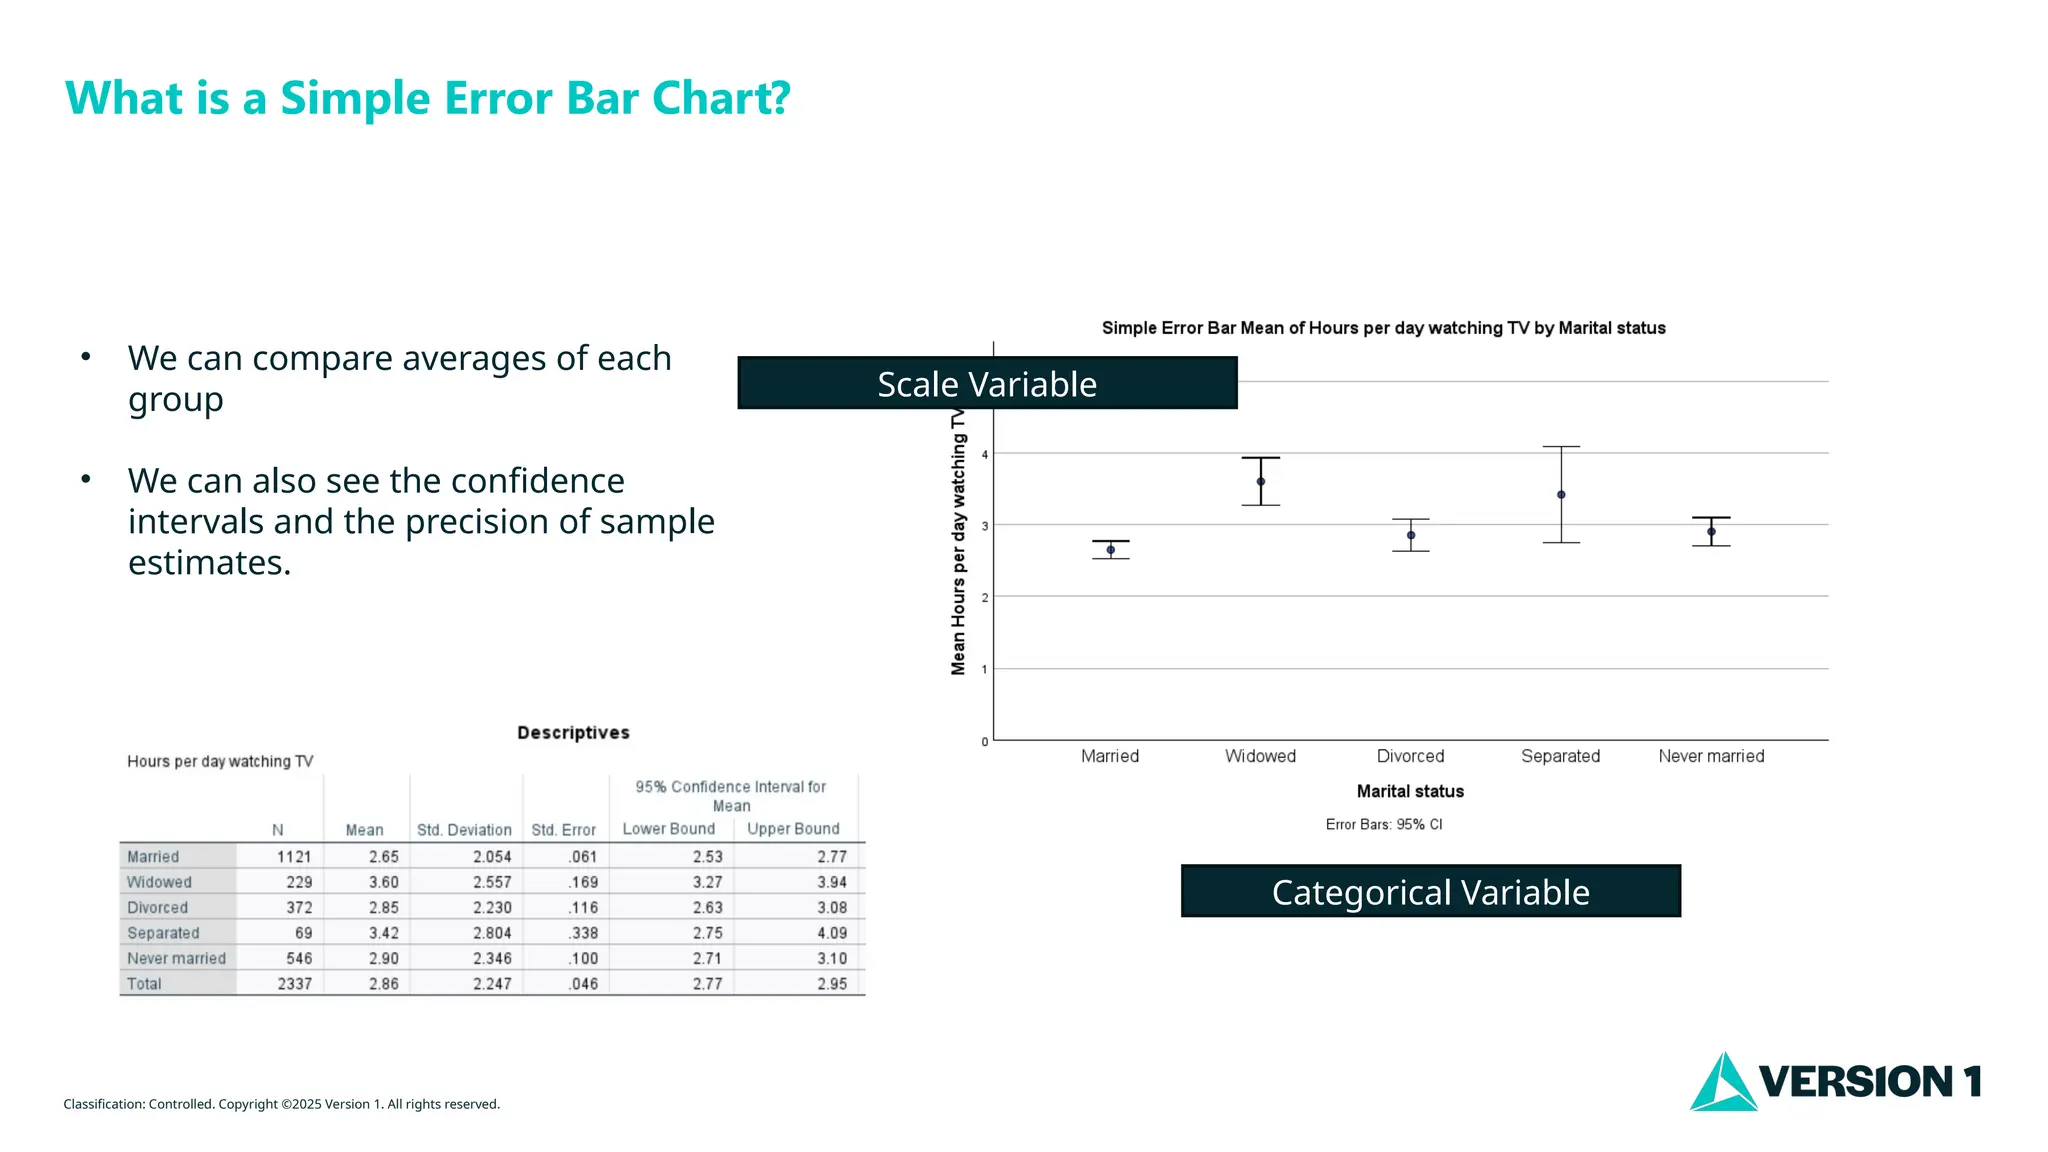
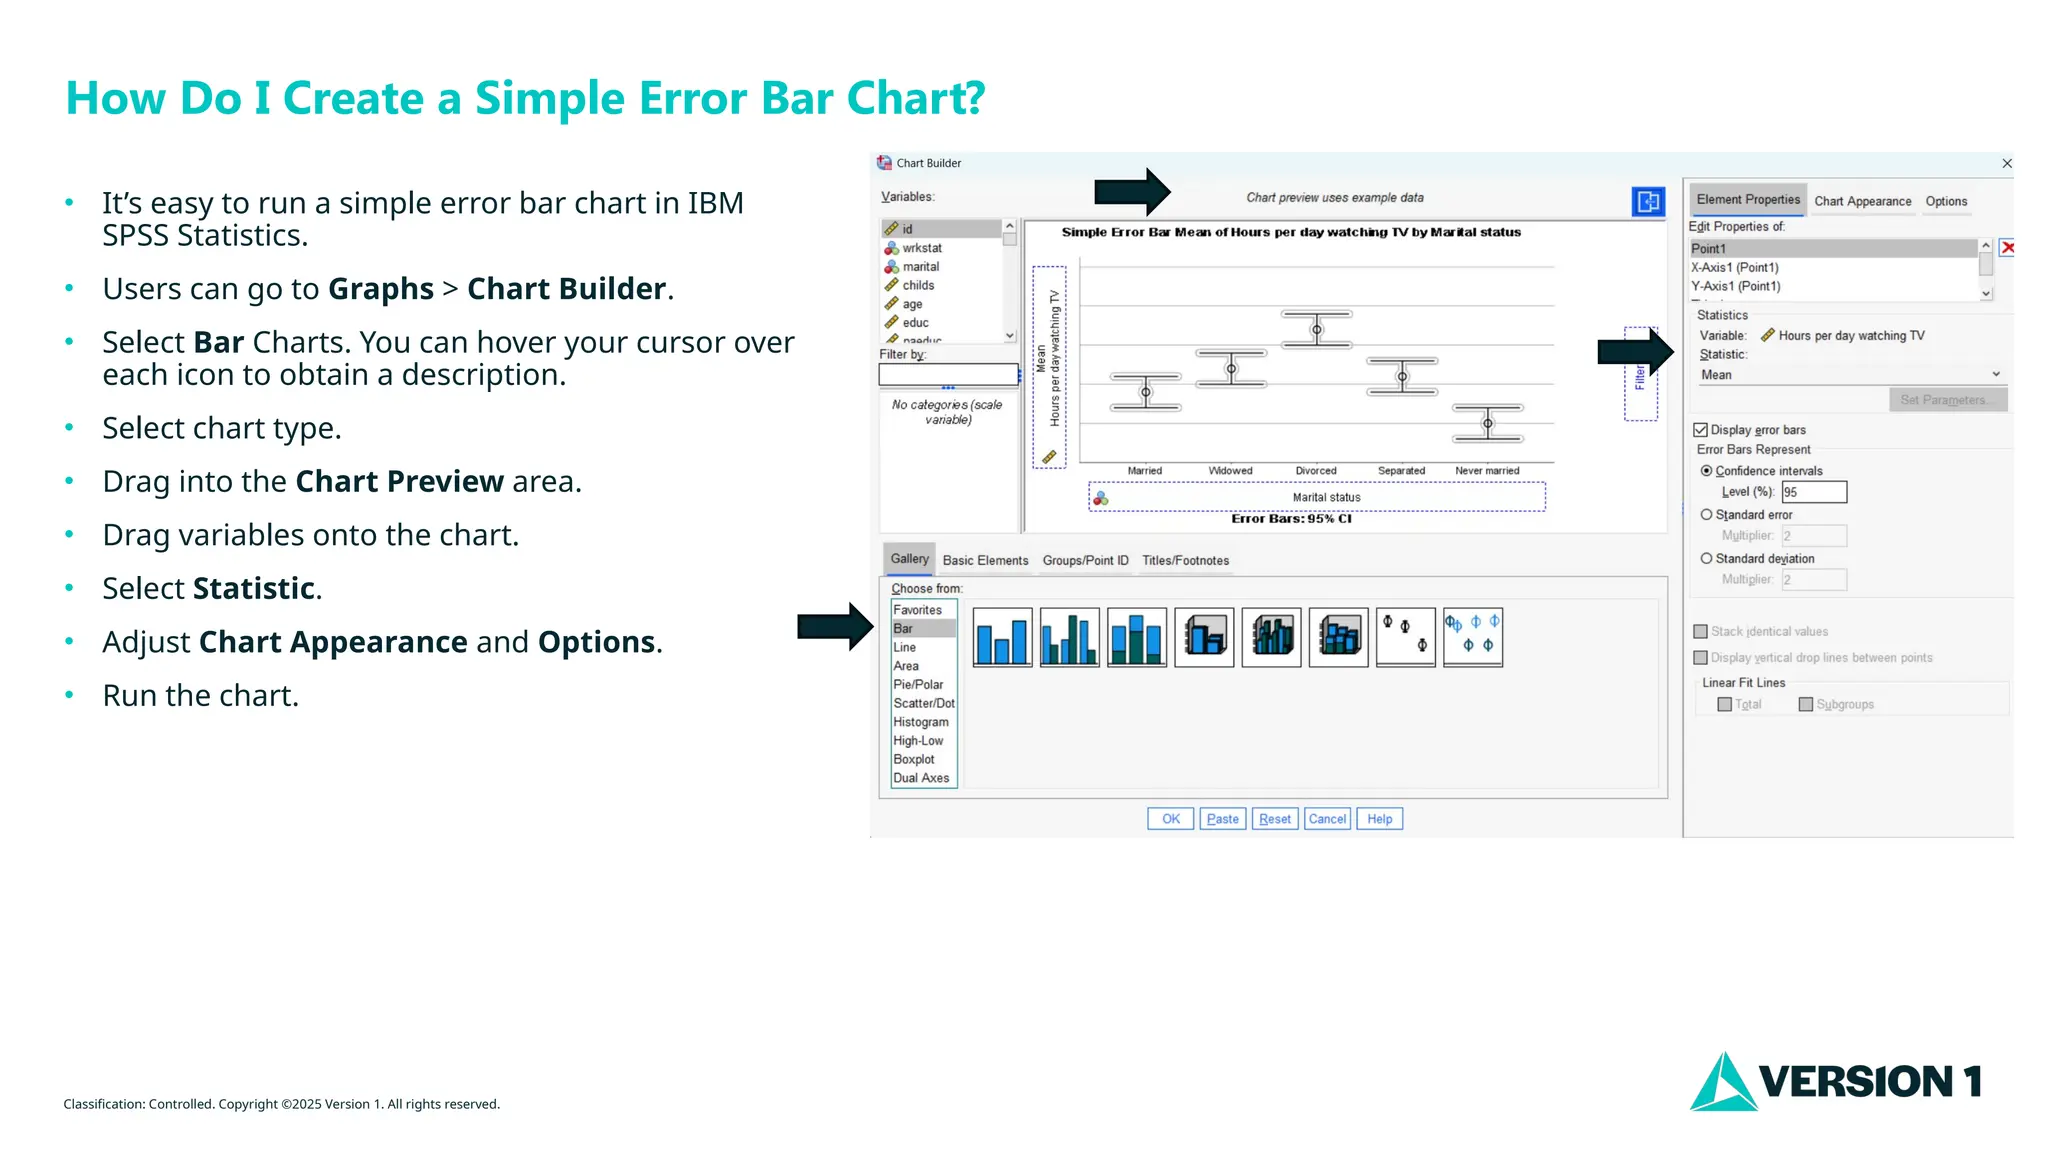

A simple error bar chart allows for comparison of group averages and visualizes confidence intervals and sample estimate precision. Users can create such charts easily using IBM SPSS Statistics by following a series of steps in the chart builder. The document provides specific instructions for creating and customizing the error bar charts.