Downloaded 37 times


![SharePoint 2010 Guidance
Book The Book
Developing Applications for SharePoint 2010 (includes the Help file [CHM], samples, and
Downloads
library source code)
•Introduction to Developing Applications with SharePoint 2010
•SharePoint Server-side Data Access – Part 1 of 3: Introduction
Media
•SharePoint Server-side Data Access – Part 2 of 3: Related Lists
•SharePoint Server-side Data Access – Part 3 of 3: Analyzing Generated CAML
Support Discussions for patterns & practices SharePoint Guidance
Training Hands-on labs
Community patterns & practices SharePoint Guidance Community Site
License Microsoft patterns & practices license September 2009
28 | SharePoint Saturday New York City 2011](https://image.slidesharecdn.com/sharepointsaturdaynyc-07-20111-110730214535-phpapp01/85/SharePoint-Saturday-NYC-Business-Intelligence-28-320.jpg)


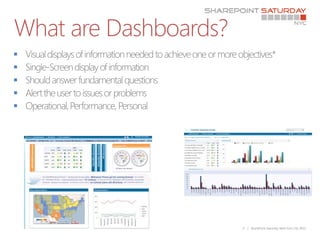
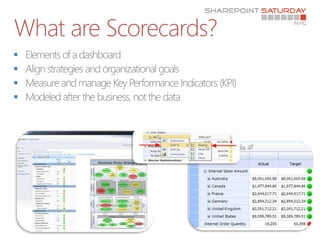
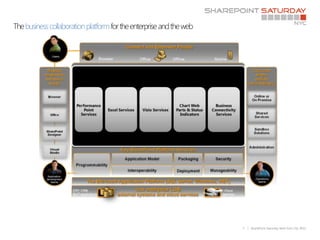
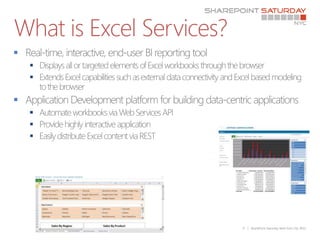
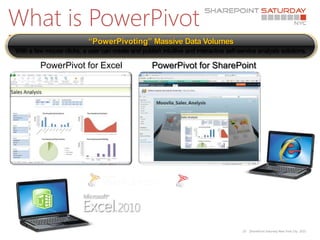
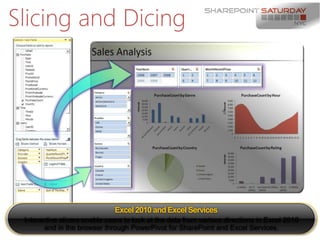
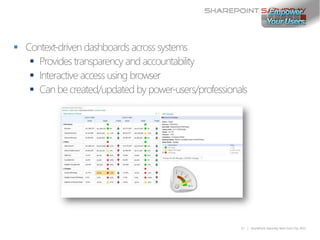
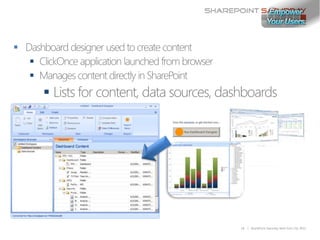
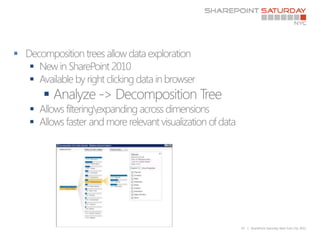
The document discusses the capabilities of SharePoint 2010 in creating business intelligence solutions and integrating various features such as dashboards, scorecards, and Excel Services. It highlights the advantages of PowerPivot for managing large data sets and provides an overview of visualization tools like Visio Services for real-time business insights. Additionally, it references resources for code and guidance on developing applications for SharePoint 2010.


