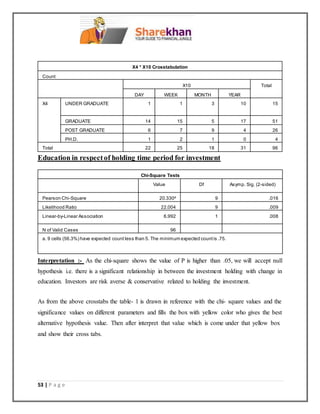
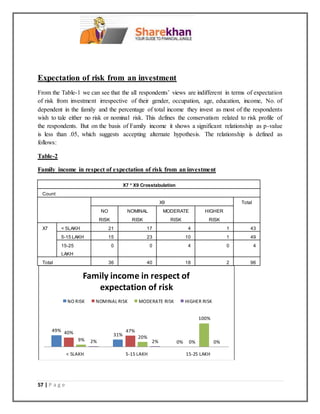
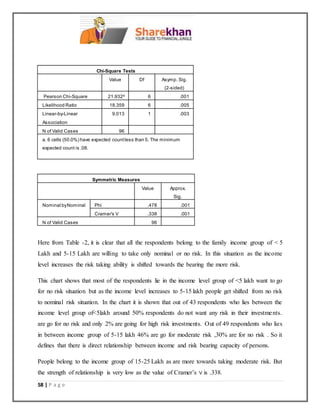
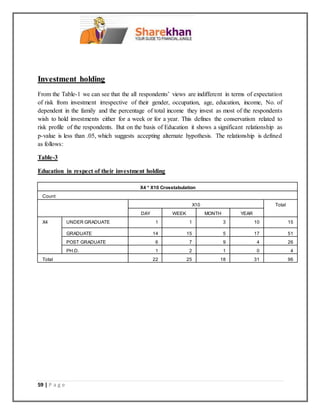
This document is a summer internship project report on analyzing investment patterns based on investors' risk profiles. It includes an introduction to the topic, definitions of key terms like risk, investment, and risk profiles. It also outlines the objectives, research methodology, data analysis and findings of the study conducted with Sharekhan Limited on how demographic and risk-related factors influence individuals' investment decisions and patterns.
A STUDY ON RISK RETURN ANALYSIS OF SELECTED STOCKSShrikumar Gowda
This document summarizes a study on analyzing the risk and return of selected stocks. The objectives are to analyze risk and return, measure financial performance, and suggest potential stocks. Various tools are used to measure risk through standard deviation and beta values, and financial performance through ratios. Key findings include sectors like IT performing better than others, with TCS being more stable. The study helps investors pick stocks based on their risk appetite. Suggestions include watching the benchmark index, investing in consistently performing stocks, avoiding volatile stocks, and choosing high beta stocks depending on market conditions.
Behavior of Indian Investor: A Market ResearchAkash Jauhari
The document summarizes research conducted on the behavior of Indian investors. Through surveys, the research examined how various individual, public, acquaintance, and fundamental factors influence investment decisions. Factor analysis identified 4 main factors that influence investors: 1) company fundamentals, 2) ethics and social initiatives of firms, 3) influence of acquaintances, and 4) influence of public information and sentiment. Cluster analysis grouped investors into 3 clusters based on their perspectives, with one cluster most influenced by fundamentals and another most influenced by a company's individual characteristics.
analysis of Investment option available in market Kalakar Chokro
Optima Money Managers Pvt Ltd is an Indian financial services firm that provides wealth management, financial planning, tax, and business advisory services to individuals and small businesses. It aims to help clients achieve their financial goals and mitigate risks through customized solutions. The company is managed by experienced professionals like CAs, CFPs, and MBAs. It prides itself on providing high-quality advice and service. For individuals, the company assists with goals like retirement planning, tax planning, and estate planning. For small businesses, it offers consulting, internal auditing, and cost management services.
A project report on portfolio managementProjects Kart
Portfolio management involves managing a group of investments to meet organizational goals and reduce risk. It includes deciding which investments to select and fund, and which to discontinue. The document discusses how portfolio management applies to managing software applications, products, and initiatives within an organization. It aims to maximize returns and diversify investments across different asset classes or types of projects.
Stocks represent ownership in a company and their value is determined by investor demand. There are different types of stocks including growth stocks, value stocks, large cap stocks and small cap stocks. A stock's price and potential returns are influenced by factors like the company's earnings, dividends, P/E ratio, performance, and intrinsic value. While stock prices fluctuate daily, they tend to increase over the long run as company earnings grow. Investing in stocks provides an opportunity to share in the profits of successful companies.
RISK AND RETURN OF SELECTED FMCG COMPANIES WITH SPECIAL REFERENCE TO KARVY ST...Bala Murugesh
The basis of the project is to identify the #RISK – #RETURN of selected FMCG Companies, Top 5 market capitalization company had been used for the study. Companies like ITC Limited, HUL Limited, Godrej Consumer Products Limited, Britannia Industries Limited & Dabur India Limited. This help to identify the total amount of the risk involved in Investment. The analysis used for the study is Descriptive statistics, Volatility (β), Compound annual growth rate (CAGR), Value at Risk(VaR), Correlation. Fast-moving consumer goods (FMCG) sector is the 4th largest sector in the Indian economy, Government has allowed 100 per cent Foreign Direct Investment (FDI) in food processing and single-brand retail and 51 per cent in multi-brand retail. Compound annual growth rate (CAGR) used to measure the return yielded for Y-O-Y (Year on Year), Volatility (β) and VaR (Value at Risk) is used to measure the risk of the stock. Correlation had been used to find out the relationship between NIFTY and the stocks this help to know the correlation between the stock. There is huge risk and return involved in equity find a good return stock and the risk-free stock is difficult this study will help the investor to find out a good stock.
This document is a project report submitted for a master's degree in business management. It discusses portfolio management and investment decisions. The introduction provides an overview of portfolio evaluation and different techniques for portfolio construction and analysis. The objectives are to help investors choose effective portfolios and identify the best portfolio of securities. The methodology section describes how primary and secondary data was collected for the project. The limitations include a reliance on secondary sources and constraints of time and data availability.
Full Project Report on SBI mutual funds.AKSHAY TYAGI
This document summarizes a student project on investor perceptions of mutual funds submitted for an MBA program. It includes declarations, acknowledgements, guide certificates, and outlines of the project contents. The student investigated investor preferences in mutual funds, including the types of products, options, and investment strategies preferred by investors in India. The project analyzed primary data collected through surveys to understand factors influencing investor decisions when purchasing mutual funds.
This document discusses portfolio management and various portfolio theories. It begins by defining a portfolio as a combination of different asset classes held over time. It notes that portfolios help diversify risk between systematic and unsystematic components. The document then covers modern portfolio theory proposed by Harry Markowitz, which established that risk is reduced by holding negatively correlated assets. It also discusses the capital asset pricing model developed by Sharpe, Mossin and Lintner, which relates asset returns to systematic risk measured by beta. The document provides examples of portfolio risk measurement using covariance, correlation, variance and standard deviation. It addresses criticisms of these portfolio theories and their assumptions.
The document is a project report submitted for an MBA program. It discusses investment options and investor attitudes towards investment in private life insurance companies in India. The report is divided into several chapters that cover the objectives of the study, research methodology, data analysis, findings, conclusions, and recommendations. It examines various investment avenues available in India including stocks, mutual funds, fixed deposits, gold, real estate, and insurance. The main goal of the research is to understand investor perceptions and preferences regarding public and private life insurance companies in India.
Investor behavior in the stock market – Rational and Irrational perspectivesRohit Bedi
This research involves the study of buying and selling behavior of the Indian investor from both rational and irrational perspectives. The research involves collection of primary data through a questionnaire. The questionnaire has general questions related to investors’ preferences regarding their investment decisions and questions related to the influence groups which affect their investment behavior.
investment options for retail investor when inflation s expected to isesowmya Sowmya
When inflation is expected to rise, retail investors should consider investments that protect the value of their money. Short-term options include savings accounts, money market funds, and bank fixed deposits of 6-12 months. Long-term options that provide tax benefits include post office savings schemes, the Public Provident Fund (PPF), and company fixed deposits. These investment options help retain purchasing power as inflation rises by providing stable returns and preserving capital value.
48407540 project-report-on-portfolio-management-mgt-727 (1)Ritesh Kumar Patro
This document provides an overview of portfolio management. It discusses key concepts like portfolio construction, types of assets, and the portfolio management process. The main points are:
1) Portfolio construction involves setting objectives, defining a policy, applying a strategy, selecting assets, and assessing performance. The main asset classes are cash, bonds, equities, derivatives, and property.
2) Portfolio management deals with security analysis, portfolio analysis, selection, revision, and evaluation. The goal is to maximize returns for a given level of risk through diversification.
3) Derivatives like futures and options derive their value from underlying assets and allow investors to take long or short positions to profit from price movements.
This document outlines the course Securities Analysis and Portfolio Management. The objectives of the course are to provide students with frameworks for evaluating investment avenues and managing funds. It will cover various financial instruments, markets, regulations, and portfolio management techniques. The course is divided into 6 units that will cover topics such as fixed income securities, security analysis methods, modern portfolio theories, and portfolio strategies. Students will learn to analyze investments and manage portfolios effectively.
18 years
Wife: 25 years
3. Expected income growth rate: 10%
4. Inflation rate: 7%
5. Life expectancy: 80 years
Calculation:
1. Current annual income: Rs. 6,00,000
2. Income after 18 years (when child becomes independent): Rs. 16,00,000 (considering 10% annual growth)
3. Income needed after 18 years adjusted for inflation: Rs. 35,00,000 (considering 7% annual inflation)
4. Number of years of income needed after child becomes independent: 62 years (80 years - 18 years)
5. Total income needed: Rs. 35,00,000
This document summarizes a research paper that examines factors affecting investment behavior among young professionals aged 25-35. It conducted a survey of 200 young investors in Lucknow, India to understand their preferences and decision-making processes. The key findings were:
1) The most important factors guiding investment decisions for young investors were safety of funds and diversification.
2) The majority invested for both growth and income, with others focusing on financial stability or tax savings.
3) Statistical analysis found investment behavior to be independent of age, gender, and income among young investors.
This document summarizes a study on investor preferences for various investment avenues in Dehradun District, India. The study found that most investors prefer bank deposits, followed by gold investments. A survey of 120 investors found that over half were aware of various investment options, with the most common reasons for investing in stocks being the potential for high returns and liquidity. The study concluded that there was no significant relationship between investors' sex, income level, and their awareness of investment options.
An equity analyst uses fundamental and technical analysis tools to identify undervalued or overvalued stocks and make informed investment decisions. Fundamental analysis evaluates a company's business model, demand, strengths, and financial metrics to determine a stock's intrinsic value, while technical analysis studies past price movements and volumes to identify short-term trading opportunities. Both approaches are commonly used but have limitations, so investment decisions require careful analysis of companies and market conditions.
Add a bit of flexibility to your portfolio by investing across sectors with ICICI Prudential Flexicap Fund. Aim for liquidity and consistency by investing in largecap companies and long-term growth potential with mid, and smallcap companies and work towards your wealth creation goals. NFO launches on 28th June 2021.
To know more, head to https://bit.ly/3xZP4qB
The document outlines several long-term investment plans available in India for periods of 10-15 years or more. The Public Provident Fund (PPF) account is described as the best long-term plan, as it offers security for 15 years with tax-free returns and the option to withdraw half the amount after 6 months. Investing in mutual funds through a Systematic Investment Plan provides risk and return, especially for long-term investors. Real estate is presented as a growing industry that can provide high annual returns through purchase, management and sale of properties. Other options discussed include investing in gold, post office savings schemes, initial public offerings, bonds and maintaining a diversified portfolio to reduce risk.
A study on empherical testing of capital asset pricing modelProjects Kart
This document is a project report submitted to the University of Mysore in partial fulfillment of an MBA degree. It examines the empirical testing of the Capital Asset Pricing Model (CAPM) conducted at Asit C. Mehta Investment Intermediates Ltd in Hassan, India between 2008-2010. The report includes an introduction to the topic, literature review, company and industry profiles, data collection and interpretation, findings, suggestions and conclusions. The student conducted the research under the guidance of their project guide.
Determinants that influence the individual investor behavior in Stock MarketAbhishek Shrivastava
This document provides a literature review on factors that influence individual investor behavior in the stock market. It summarizes several past studies that examined demographic factors like age, gender, income, and psychological factors. Internal factors like risk tolerance, goals, and external factors like information, recommendations also impact decisions. The literature identifies many determinants of behavior like herding, cognitive biases, past performance, dividends. In conclusion, investor characteristics and various economic, social, psychological influences shape their stock market participation and choices.
Make the most of every opportunity that comes your way with the ICICI Prudential Flexicap Fund. Maintain a flexible portfolio that invests across sectors and works towards a better future for you.
Know more at https://bit.ly/3hegzFX
Equity Research primarily means analyzing company's financials, perform ratio analysis, forecast the financial in excel (financial modeling) and explore scenarios with an objective of making BUY/SELL stock investment recommendation.
A Study of Behavioural Factors Affecting Individual Investment Decisionsijtsrd
Although finance has been studied for thousands of years, behavioral finance which considers the human behaviour in finance is a pretty new area. Behavioral finance theories, which might be based totally at the psychology, try to apprehend how feelings and cognitive mistakes impact man or woman traders' behaviour buyers referred to on this look at are referred to person traders .The primary goal of this have a look at is exploring the behavioral factors influencing person buyers' selections on the NSE and BSE Stock Exchange. Furthermore, the members of the family among these elements and funding overall performance also are tested. The have a look at begins with the present theories in behavioral finance, based totally on which, hypotheses are proposed. Then, those hypotheses are examined via the questionnaires dispensed to individual buyers on the Broking Firms, college students and professionals. The data collected from the Stock Broking firms, Students, Professionals through structured questionnaire were examined and data collected were analyzed using Cronbachs Alpha Reliability Test, based totally on which, hypotheses are proposed. The result indicates that there are 5 behavioral elements affecting the funding selections of person investors at the NSE and BSE Stock Exchange Herding, Market, Prospect, Overconfidence gamble's fallacy, and Anchoring ability bias. Most of these elements have mild impacts whereas Market element has high affect. This test also tries to discover the correlation among these behavioral factors and investment overall performance. Among the behavioral factors referred to above, best 3 elements are located to influence the Investment Performance Herding inclusive of shopping for and promoting choice of trading shares extent of buying and selling stocks velocity of herding , Prospect such as loss aversion, remorse aversion, and mental accounting , and Heuristic inclusive of overconfidence and gamble's fallacy . The heuristic behaviors are determined to have the highest advantageous impact at the investment overall performance while the herding behaviors are stated to persuade undoubtedly the investment overall performance on the lower degree. In assessment, the possibility behaviors provide the negative impact on the funding overall performance. Pawankumar S Hallale | Manjiri Gadekar "A Study of Behavioural Factors Affecting Individual Investment Decisions" Published in International Journal of Trend in Scientific Research and Development (ijtsrd), ISSN: 2456-6470, Volume-3 | Issue-6 , October 2019, URL: https://www.ijtsrd.com/papers/ijtsrd28100.pdf Paper URL: https://www.ijtsrd.com/management/business-economics/28100/a-study-of-behavioural-factors-affecting-individual-investment-decisions/pawankumar-s-hallale
Digitale markedsføringstrender i 2017. Hvordan vil artificial intelligence påvirke markedsføring? Hva er viktig å huske når vi jobber i digitale kanaler?
There are four main types of thrillers discussed in the document: action, psychological, horror, and crime. Action thrillers involve violence and physical challenges. Psychological thrillers center around characters who find themselves in dangerous situations they are unprepared for and must use mental resources rather than physical strength. Horror thrillers aim to frighten viewers and involve elements of the supernatural or serial killers. Crime thrillers fictionalize crimes and their detection, keeping viewers engaged as plots build to a climax.
This course is for 1st year master's degree students in digital signal processing, with about 12-15 students per group. The objectives are to improve English speaking skills and teach the basics of digital signal processing theory and equipment. Lectures will provide direction and topics for student reports. Online tests will monitor terminology knowledge. Classroom discussions will develop patterns for cross-checking reports. The course will use online tests on Moodle for assessment. It will include reading materials, tests, student reports, and cross-checking reports online. The online materials aim to help students study professional English better. The instructor has an existing Russian language digital signal processing course on Moodle and found some relevant English books. The plan is to blend face-
This document provides an overview of closed-circuit television (CCTV) cameras and video surveillance systems. It discusses the different types of CCTV cameras, including analog, digital, and network cameras. It explains how CCTV cameras work by sending video images and audio data to a monitor or storage device for live or recorded viewing. The purpose of CCTV systems is to act as a deterrent against unlawful activity and to document any crimes that occur through video recordings. Various CCTV camera technologies are also outlined such as bullet cameras, dome cameras, and pan tilt zoom cameras.
Estudio Demografía Empresarial febrero 2017INFORMA D&B
Durante los dos primeros meses del año, las cifras de demografía empresarial reflejaron la buena salud del capital invertido en constituciones (+22,72% respecto a 2016) y una reducción del número de concursos presentados (-7,92%). Mientras, la creación de sociedades disminuye (-8,86%) y las disoluciones aumentan (+15,68%).
Alex Troush - IEx Cheat Sheet. Guide to Win with IEx on your Day to Day JobElixir Club
This document provides an overview of useful commands and features in IEx, Elixir's interactive shell:
1. It describes how to start IEx with "iex" or "iex -S mix" to start in a project context.
2. It explains the Ctrl-C, Ctrl-G, and Ctrl-\ commands for interrupting, switching jobs, and exiting IEx.
3. It notes that the .iex.exs file can be used to configure the IEx shell on start up.
4. It lists some IEx helpers like h, v, IEx.pry, r, and respawn for getting help, viewing history, debugging,
Este documento contiene información sobre cableado estructurado y ejercicios relacionados con direcciones IP, tablas de rutas, y fragmentación de paquetes IP. Se pide al estudiante que complete tablas con datos de ipconfig, que analice campos como TTL en cabeceras IP, y que realice pings modificando tablas de rutas.
Este documento describe los pasos para realizar una búsqueda en la base de datos Pubmed para encontrar artículos de revisión publicados en los últimos quince años en español sobre la prevención de la obesidad y el sobrepeso en niños y adolescentes. Primero, se accede a Pubmed a través de la biblioteca universitaria y se traducen los términos de búsqueda al inglés utilizando Decs. Luego, se introduce la consulta en Pubmed aplicando filtros como idioma, tipo de artículo y fecha para reducir los resultados a 4 art
This dissertation examines the impact of foreign direct investment (FDI) on India's unorganized retail sector, using the agro products industry as a case study. The student conducted this research under the guidance of faculty at Integral University to earn a Bachelor's degree in Business Administration. The report includes an introduction on FDI policies in India's retail sector, a literature review, research methodology, data analysis, findings, and conclusions. The key finding is that while large foreign retailers bringing new technologies and supply chain expertise could benefit consumers, they also pose challenges for local kirana stores in terms of competition and convenience. The report examines how foreign entrants might balance these impacts as they seek to gain a foothold in India's retail
The insignia of a bride; the insignia that reminds the groom of his responsibilities and duties. Exquisite bridal rings at designsbyknr.com are designed to define the relationship of the couples in love.
O documento lista 21 sites que oferecem exercícios gratuitos de inglês para estudantes. Ele explica que exercícios são fundamentais para aprender inglês e que esses sites fornecem materiais valiosos para ajudar nos estudos de forma gratuita e flexível.
Sharekhan is the retail broking arm of SSKI Group, which has over 80 years of experience in stock broking, and offers online trading, investment advisory, and other equity services. Sharekhan has over 1005 centers across India and over 545,000 clients, making it one of the top three branded retail brokers. The company aims to educate investors and empower them to make better investment decisions through quality advice and superior services.
INVESTMENT PATTERN ON THE BASIS OF RISK PROFILE OF INVESTORSgoreankush1
The document discusses investment patterns based on risk profiles of investors. It defines investment and risk, and describes different types of risk including systematic and unsystematic risk. It outlines factors that determine an investor's risk tolerance like investment goals, timeframe, liquidity needs, age, income and experience. Based on these factors, it categorizes investors into different risk profile styles from conservative to aggressive. The executive summary provides an overview of how individuals invest based on their capacity to bear risk and the relationship between investment patterns and risk tolerance. It describes the objectives and methodology of a study conducted to analyze these relationships.
Portfolio evaluation and investment decision finance reportStudent
This document is a project report submitted by Chirag Mehta to the Aditya Institute of Management Studies and Research in partial fulfillment of an MMS degree. The report focuses on portfolio evaluation and investment decisions. It includes an abstract, table of contents, introduction, literature review, analysis, findings, and conclusion. The project was conducted under the guidance of Professor Srinjay Sengupta and aims to help investors identify effective portfolios and understand the role of securities in investment decisions.
The document is a study on factors influencing investors' decisions regarding portfolio investments in Mumbai. It includes an introduction discussing objectives of the study, portfolio, risk, investment criteria, common errors in investment management and qualities for successful management. The methodology section describes the scope, objectives, sampling method and data analysis. Key points made in the introduction are that an investment portfolio requires balancing return, risk, liquidity and other factors. Risk is divided into systematic and unsystematic types. Common errors investors make include inadequate comprehension of risk-return and untimely investment decisions. Qualities for success include patience, flexibility and contrary thinking.
This document is a research report on saving and investment awareness among middle-class people in India. It was submitted by Saurabh Suresh Surve to Brihan Maharashtra College of Commerce in Pune under the supervision of Dr. J.R. Lanjekar. The report includes an introduction on savings and investment, objectives of the study, research methodology used which was a survey of 40 individuals, and outlines for findings, conclusion and bibliography sections. The objective was to analyze saving and investment patterns and behaviors among middle-class investors in India.
Return and risk, systematic investment plan of mutual fundamulya bachu
This document provides a project report on return and risk of systematic investment plans (SIPs) of mutual funds. The report was submitted by B. Amulya to partial fulfillment of an MBA degree. It includes sections on the introduction, theoretical background of mutual funds, Karvy Stock Broking Limited (the organization studied), concepts related to return, risk and SIPs, findings, conclusions and suggestions. The project analyzed growth schemes offered via SIPs by various fund houses to understand performance over 1, 3 and 5 years. The scope was limited to the Indian mutual fund industry and data was collected from secondary sources like fact sheets and websites.
This document appears to be a dissertation submitted by Sangeeta Pandey to Uttarakhand Graphic Era Hill University for a Bachelor of Commerce (Honors) degree. The dissertation is titled "Comparative Analysis of Banks and Mutual Fund Interest Rates" and was conducted under the supervision of Mr. Ramanuj Tewari. The dissertation includes an introduction to mutual funds and banks, objectives of the research, research methodology, interpretation of findings, limitations, conclusions, and references. It aims to evaluate and compare the performance and interest rates of mutual funds versus domestic bank term deposits.
This document provides an overview of investment options in India and discusses the need for investment planning. It summarizes various investment options like stocks, bonds, real estate, gold, and mutual funds. It states that an investor should evaluate investments based on parameters like safety, liquidity, returns, entry/exit barriers, and tax efficiency. The document then discusses the introduction to investments, need and importance of studying investments, scope of the study, objectives of the study, methodology, limitations of the study, and provides a profile of ICICI Bank.
A Study on Investment Pattern of Investors on Different ProductsProjects Kart
A study on investment pattern of investors on different products in India using the questionnaires to understand how salaried employees investment pattern and preferences towards different products. Read more on www.projectskart.com for information. An investment refers to the commitment of funds at present, in anticipation of some positive rate of return in future. Today the spectrum of investment is indeed wide. An investment is confronted with array of investment avenues. Among all investment, investment in equity is in best high proportion. This is because the history of stock market is booming and bursts overnight millionaires, an instant pauper.
This document appears to be a student's project report submitted in partial fulfillment of an MBA degree. It includes sections on the certificate, student declaration, acknowledgements, table of contents, and an introduction. The introduction provides background on mutual funds in India, outlines the statement of problem regarding assessing investors' perception of mutual funds, and describes the scope and objectives of the research project. The research methodology section indicates the project will use secondary data sources to examine awareness, investor behavior, and perceptions of mutual funds in India.
Project report for summer internship | Risk Management and investment behavio...ManjeetSingh558
Project report for summer internship | Risk Management and investment behaviour at sharekhan ltd. by MM
Looking for help check this report, please edit data yourself and keep it up to date, and also re upload after your report to help other.
FINAL MMS PROJECT - INVESTOR'S BEHAVIOR TOWARDS INVESTMENT AVENUES ( MANGESH...Mangesh Sonawane
This document is a student project report on investor behavior towards different investment avenues in India. It includes an executive summary that gives an overview of various investment options available in India and factors that influence investor decisions. The objective of the project is to understand and analyze individual investors' preferences, risk tolerance levels, sources of information, investment horizons and objectives. It aims to study how demographic factors like age impact risk tolerance and provide suitable investment recommendations. The report contains chapters on industry profile, literature review, research methodology, data analysis and findings.
Risk management techniques used in portfolio managementSudip Kaushal
By this report you can find out the techniques of risk management, how performance of the fund is measured. relation between Risk and Return. Employees perception about 2018's stock market.
This document is a summer training research project report submitted by Aditi Singh to fulfill the requirements of a Master of Business Administration degree. The report investigates the investment patterns of defense employees in Lucknow, India. It includes an acknowledgment, declaration, introduction that provides the rationale and objectives of the study. It also covers industry profiles on investments, characteristics of investments, objectives of investments, the investment process, and various investment avenues like stocks and shares.
a study on retail investors perception towards mutual fund investmentniranjan k
This document is a project report submitted by Niranjana K to Mangalore University in partial fulfillment of the requirements for a Master's Degree in Business Administration. The report studies retail investors' perceptions towards mutual fund investment. It contains chapters on the introduction and background of the topic, research methodology, a profile of mutual funds, data analysis and interpretation of survey results, findings, suggestions and conclusions. The introduction discusses why people invest, different investment avenues like direct equity, equity and debt mutual funds, and the role of mutual funds in shaping the Indian economy.
Fixed Deposits and Mutual funds- Final Research ProjectDivyansh Kaushik
This research paper speaks about the changing perception of the investors from fixed deposits to mutual funds. The paper was done to see the benefits of both these investment ways and finding out the best and the most popular among the students and people.
A STUDY OF INVESTORS AWARENESS ON DIGIALIZATION OF MUTUAL FUNDSshweta rani
The document discusses the financial services sector, which includes companies that provide services like banking, investment funds, insurance, and real estate. It notes that financial stocks are popular investments that perform well in low interest rate environments. The section also introduces mutual funds as a way for investors to pool their savings and have their money professionally managed in a diversified portfolio.
A survey of investors for analyzing the various aspects of fixed deposit mark...123satyendra
This document provides an industry internship project report submitted by Satyendra Singh to St. Kabir Institute of Professional Studies in partial fulfillment of a Post Graduate Diploma in Management program. The report analyzes various aspects of the fixed deposit market for Mahindra & Mahindra Financial Services Ltd. in Amreli, Gujarat, India. It includes an introduction, overview of Mahindra & Mahindra and MMFSL, literature review, research methodology, data analysis and interpretation, findings and recommendations. The objectives are to analyze awareness of MMFSL FDs, the role of demographics on FD preferences, relative preference for investment instruments, and response to MMFSL FDs.
Similar to Sharekhanlimited 140315092431-phpapp01 (repaired) (20)
Specific ServPoints should be tailored for restaurants in all food service segments. Your ServPoints should be the centerpiece of brand delivery training (guest service) and align with your brand position and marketing initiatives, especially in high-labor-cost conditions.
408-784-7371
Foodservice Consulting + Design
Sethurathnam Ravi: A Legacy in Finance and LeadershipAnjana Josie
Sethurathnam Ravi, also known as S Ravi, is a distinguished Chartered Accountant and former Chairman of the Bombay Stock Exchange (BSE). As the Founder and Managing Partner of Ravi Rajan & Co. LLP, he has made significant contributions to the fields of finance, banking, and corporate governance. His extensive career includes directorships in over 45 major organizations, including LIC, BHEL, and ONGC. With a passion for financial consulting and social issues, S Ravi continues to influence the industry and inspire future leaders.
Originally presented at XP2024 Bolzano
While agile has entered the post-mainstream age, possibly losing its mojo along the way, the rise of remote working is dealing a more severe blow than its industrialization.
In this talk we'll have a look to the cumulative effect of the constraints of a remote working environment and of the common countermeasures.
Integrity in leadership builds trust by ensuring consistency between words an...Ram V Chary
Integrity in leadership builds trust by ensuring consistency between words and actions, making leaders reliable and credible. It also ensures ethical decision-making, which fosters a positive organizational culture and promotes long-term success. #RamVChary
Impact of Effective Performance Appraisal Systems on Employee Motivation and ...Dr. Nazrul Islam
Healthy economic development requires properly managing the banking industry of any
country. Along with state-owned banks, private banks play a critical role in the country's economy.
Managers in all types of banks now confront the same challenge: how to get the utmost output from
their employees. Therefore, Performance appraisal appears to be inevitable since it set the
standard for comparing actual performance to established objectives and recommending practical
solutions that help the organization achieve sustainable growth. Therefore, the purpose of this
research is to determine the effect of performance appraisal on employee motivation and retention.
Public Speaking Tips to Help You Be A Strong Leader.pdfPinta Partners
In the realm of effective leadership, a multitude of skills come into play, but one stands out as both crucial and challenging: public speaking.
Public speaking transcends mere eloquence; it serves as the medium through which leaders articulate their vision, inspire action, and foster engagement. For leaders, refining public speaking skills is essential, elevating their ability to influence, persuade, and lead with resolute conviction. Here are some key tips to consider: https://joellandau.com/the-public-speaking-tips-to-help-you-be-a-stronger-leader/
A presentation on mastering key management concepts across projects, products, programs, and portfolios. Whether you're an aspiring manager or looking to enhance your skills, this session will provide you with the knowledge and tools to succeed in various management roles. Learn about the distinct lifecycles, methodologies, and essential skillsets needed to thrive in today's dynamic business environment.
12 steps to transform your organization into the agile org you deservePierre E. NEIS
During an organizational transformation, the shift is from the previous state to an improved one. In the realm of agility, I emphasize the significance of identifying polarities. This approach helps establish a clear understanding of your objectives. I have outlined 12 incremental actions to delineate your organizational strategy.
Ganpati Kumar Choudhary Indian Ethos PPT.pptx, The Dilemma of Green Energy Corporation
Green Energy Corporation, a leading renewable energy company, faces a dilemma: balancing profitability and sustainability. Pressure to scale rapidly has led to ethical concerns, as the company's commitment to sustainable practices is tested by the need to satisfy shareholders and maintain a competitive edge.
Employment PracticesRegulation and Multinational CorporationsRoopaTemkar
Employment PracticesRegulation and Multinational Corporations
Strategic decision making within MNCs constrained or determined by the implementation of laws and codes of practice and by pressure from political actors. Managers in MNCs have to make choices that are shaped by gvmt. intervention and the local economy.
1. A
SUMMER INTERNSHIP PROJECT ON
INVESTMENT PATTERN ON THE BASIS OF RISK PROFILE OF
INVESTORS
SUBMITTED IN PARTIAL FULFILLMENT OF THE REQUIREMENTS FOR THE TWO
YEAR FULL TIME POST GRADUATE DIPLOMA IN MANAGEMENT
PREPARED BY:- UNDER THE GUIDANCE OF :-
VIJAY MANNEWAR 1) Dr. SHALINI SINGH
Roll Number: - 14002 I.T.S-IM
Batch :- 2012-14 2) MR. AMIT SHARMA
BRANCH HEAD
(SHAREKHAN LTD.)
ITS-INSTITUTE OF MANAGEMENT
46, KNOWLEDGE PARK-III, GREATER NOIDA
PH.:- 0120-2331073, 2331000, E-mail: itsim@edu.in
2. 2 | P a g e
CERTIFICATE:-
This is to certify that “Vijay Mannewar” a student of Post graduate diploma in management,
Batch (2012-14) of ITS-INSTITUTE OF MANAGEMENT, Roll No. 14002 has undertaken the
Summer Internship Project under my guideance for the Project Title “Investment Pattern on the
basis of Risk Profile of Investors”. This Project Report is prepared in partial fulfillment for the
Post graduate diploma in management.
To the best of my knowledge, this research work is original and no part of this report has been
submitted by the student earlier to any other institution / university.
Date:-…………………… Faculty Mentor’s Name: …………
(Signature)
3. 3 | P a g e
ACKNOWLEDGEMENT
The satisfaction of the successful completion of any task wouldn’t be complete without the
expression of gratitude to the people who made it possible.
I express my gratitude to Mr. Amit Sharma (Branch head) SHAREKHAN LTD, for his support
and guidance during the survey.
I am very thankful to Dr. Shalini Singh, Faculty, ITS- INSTITUTE OF MANAGEMENT, for
the guidance and interest evinced throughout the preparation of this project.
I also extend my heartfelt gratitude and thanks to Prof. Shekhar Ghosh, General Director, ITS-
INSTITUTE OF MANAGEMENT.
I take this opportunity, also to express my love and sincere thanks to my family members and
friends for their support and advice during various stage of work.
I also extend my gratitude to the respondents of my survey for their kind co-operation.
But last not the least I thank God almighty for giving me the support for the completion of the
task.
4. 4 | P a g e
DECLARATION
I Vijay Mannewar Student of ITS- Institute of Management Greater Noida Batch 2012-14
declare that every part of the project report on “Investment Pattern on the basis of Risk profile
of Investors (A Research report of Sharekhan ltd) ” that I have submitted is original . The
information has been collected from genuine & authentic sources.
The project work is done under the supervision of Dr.Shalini Singh. The work has been submitted
in the partial fulfillment of the required degree PGDM.
Date of Submission of Project: _____________
Place of Submission of Project: _____________
Vijay Mannewar
Faculty’s Comments:
5. 5 | P a g e
TABLE OF CONTENT
CHAPTERS CONTENTS PAGE NUMBERS
1 Executive summary 6-7
2 Introduction of topic 8-12
3 Introduction of Company 13-33
4 Objectives of the study 34-35
5 Research methodology 36-39
6 Data analysis & interpretation 40-72
7 Findings & conclusions 73-74
8 References 75
9 Appendix 76-77
7. 7 | P a g e
EXECUTIVE SUMMARY
People invest their money for generating good returns. But in this investment some kind of risk is
involved. All investors have different attitudes towards risk. When it comes to investing, it is
important to consider your risk profile or tolerance carefully, including how comfortable you are
with the possibility of losing money, or that returns on your investments. The risk profile of
investors depends upon their demographic structures or characteristics.
The project deals with the analyzing the investment pattern on the basis of risk profile of investors
at Sharekhan Limited and what are the risk factors that influence the type of investment made by
individuals . As we all know that every person who wants to gain better returns in future they
must have to invest their money in stock market or anywhere else. This study describes the
investment pattern use by different persons while doing investment in stock market keeping
different risk in mind.
The main reason to choose this research is to find out the investment pattern behavior in respect
of their risk bearing capacity and this research helps the company to target the investors according
to their risk ability. The research process chosen by me is qualitative and quantitative research.
Questionnaires in part help me a lot in finding the actual position of the market under the survey
method.
.A sample size of about 96 respondents which includes individual investors as well as corporate
investors was taken for purpose from various parts of Delhi and N.C.R . After the survey was
completed, the data was first stored and then analyzed on the chosen parameters. This analyzed
data was later on converted into graphs. Such as pie chart, bar graphs, etc this was to make result
easily comprehensible by any one going through the report. Later on, all this information was
compiled in the form of a presentable and highly comprehensible report.
After analyzing the data, the problem which has been identified that most of the investors are ready
to bear risk in expectation of higher returns. There is a strong relationship in investment pattern
8. 8 | P a g e
and risk bearing capacity of investors while doing investment. For analyzing the data we used chi-
square and phi-Cramer V test in SPSS V 19.0 and use MS Excel 2007 for making graphs.
9. 9 | P a g e
INVESTMENT PATTERN ON THE BASIS OF RISK PROFILE OF INVESTORS
WHAT IS RISK?
The word ‘risk’ has a definite financial meaning. It refers to possibility of incurring a loss in a
financial transaction. In a broad sense, investment is considered to involve limited risk and is
confined to those avenues where the principal is safe. ‘Speculation’ is considered as an
involvement of funds of high risk.
TYPES OF RISK
1. SYSTEMATIC RISK
2. UNSYSTEMATIC RISK
SYSTEMATIC RISK
Systematic risk refers to that portion of the total variability of the return caused by common factor
affecting the prices of all securities alike through economic, political and social factors.
UNSYSTEMATIC RISK
Unsystematic risk refers to that portion of the total variability of the return caused due to unique
factors, relating that firm or industry, through such factors as management failure, labour strikes,
raw material scarcity etc.
WHAT IS INVESTMENT?
Investment is the purchase of an asset or item with the hope that it will generate income or
appreciate in the future and be sold at the higher price.
10. 10 | P a g e
INVESTMENT RISKPROFILE
All investors have differing attitudes towards risk. When it comes to investing, it is important to
consider your risk profile or tolerance carefully, including how comfortable you are with the
possibility of losing money, or that returns on your investments could vary widely from year to year.
Understanding your personal risk tolerance will help you choose an appropriate asset allocation - the
following points can help you to determine an investment mix that's appropriate for your needs.
INVESTMENT EXPERIENCE
How would you describe your investment experience and understanding of financial markets?
Just started investing in the last year
You understand the basics of investing
You have been investing on your own for several years and are reasonably confident of your
knowledge of financial markets
Your knowledge of financial markets is well above average and you make investment
decisions confidently
RISK TOLERANCE
To establish investment strategies that suit your profile of risk and will be comfortable with, you
need to consider the possibility that the value of your investment may decline even though this
may be temporary. Are you prepared to accept the possibility of a negative return at any time in
exchange for potentially higher long term returns? What percentage of your money would you be
prepared to invest in higher-risk investments?
Which of the following is important to you:
Avoiding any short-term losses
Receiving regular income from investments
Long-term growth in the value of investments
11. 11 | P a g e
Protection against inflation
In October 1987 the stock market fell more than 20% in one day. If you owned an investment
that fell by 20% in a short time what would you do or what did you do in 1987:Sell all of the
remaining investment (Conservative)
Sell a portion of the remaining investment (Conservative to Balanced)
Hold the investment and sell nothing (Balanced or Aggressive)
Buy more of the investment (Aggressive)
INVESTMENT GOALS AND OBJECTIVES
Why are you investing? Is it for something in the near future (new car, or down payment on a
home) or something farther off (a young child's education or your own retirement)? If your
investing goals are short term you want your money to be there - with interest - when you need it.
Therefore you will need to focus on relatively short term investments like term deposits or a cash
management trust. If on the other hand, you are investing for the long term, you may be able to
afford to take some risk in pursuit of a higher return. Shares, property, and growth orientated
managed which historically have provided higher returns than fixed interest or cash over time, may
be more appropriate.
INVESTMENT TIMEFRAME
When do you expect to need to access all or part of your investments:
Less than 1 year (immediate access)
Less than 2 years (short term)
2 to 5 years (short to mid-term)
6 to 10 Years (mid to long term)
Over 10 Years (long term)
LIQUIDITY / CASH REQUIREMENTS
How much money do you need to keep available for emergencies such as house repairs, a
12. 12 | P a g e
dental emergency or serious car repairs? These emergencies can be a serious setback if you
are not prepared. The amount of your emergency fund will depend on your current lifestyle
and expenses. As a general rule you should have about 3 months of income set aside to
meet emergencies without needing to rely on credit cards. A cash management trustthat
pays high interest can be a good place to keep emergency funds.
Age and Income
Your age and your income - particularly the stability of your income - are important factors to
consider when determining your investment profile. If you are young you can afford to take a
longer term view and any short-term losses may have minimal effect. If your income or
employment is unstable you will need to take this in to account when setting your investment
goals.
Risk Profile Investment Style
Conservative Your primary investment goal is capital protection. You require
stable growth and/or a high level of income, and access to your
investment within 3 years.
Cautious Your primary investment goal is capital protection. Investors in
this risk profile require fairly stable growth and/or a moderate level
of income. Your investment term is 3 years or more.
Moderate Your primary investment goal is capital growth. You can tolerate
some fluctuations in the value of your investment in the
anticipation of a higher return. You don't require an income and
you are prepared to invest for 5 years or more.
Moderatley
aggressive
Your primary investment goal is capital growth. Investors in this
risk profile can tolerate a fair level of fluctuations in the value of
you investment in anticipation of possible higher returns. You don't
require an income and you are prepared to invest for 5 to 10 years.
13. 13 | P a g e
Aggressive Your primary investment goal is long-term capital growth. You
can tolerate substantial fluctuations in the value of your
investment in the short-term in anticipation of the highest
possible return over a period of 10 years or more.
14. 14 | P a g e
SHAREKHAN LIMITED
INTRODUCTION
Sharekhan is one of the leading retail broking House of SSKI Group which was running
successfully since 1922 in the country. It is the retail broking arm of the Mumbai-based SSKI
Group, which has over eight decades of experience in the stock broking business. Sharekhan offers
its customers a wide range of equity related services including trade execution on BSE, NSE,
Derivatives, depository services, online trading, investment advisory, Mutual Fund Advisory etc.
The firm’s online trading and investment site - www.sharekhan.com - was launched on Feb
8, 2000. The site gives access to superior content and transaction facility to retail customers across
the country. Known for its jargon-free, investor friendly language and high quality research, the
site has a registered base of over two lakh customers. The number of trading members currently
stands More than 8 Lacs. While online trading currently accounts for just over 8 per cent of the
daily trading in stocks in India, Sharekhan alone accounts for 32 per cent of the volumes traded
online.
The content-rich and research oriented portal has stood out among its contemporaries
because of its steadfast dedication to offering customers best-of-breed technology and superior
market information. The objective has been to let customers make informed decisions and to
simplify the process of investing in stocks.
On April 17, 2002 Sharekhan launched Speed Trade, a net-based executable application
that emulates the broker terminals along with host of other information relevant to the Day Traders.
This was for the first time that a net-based trading station of this caliber was offered to the traders.
In the last six months Speed Trade has become a de factostandard for the Day Trading community
over the net.
15. 15 | P a g e
On October 01, 2007 Sharekhan again launched his another integrated Software based
product Trade Tiger, a net-based executable application that emulates the broker terminals along
with host of other information relevant to the Day Traders. It has another quality which differs it
from other that it has the combined terminal for EQUITY and COMMODITIES both.
Share khan’s ground network includes over 1005 centers in 410 cities in India, of which
210 are fully-owned branches. Sharekhan has always believed in investing in technology to build
its business. The company has used some of the best-known names in the IT industry, like Sun
Microsystems, Oracle, Microsoft, Cambridge Technologies, Nexgenix, Vignette, Verisign
Financial Technologies India Ltd, Spider Software Pvt Ltd. to build its trading engine and content.
Previously the Morakiya family holds a majority stake in the company but now a world famous
brand CITI GROUP has taken a majority stake in the company. HSBC, Intel & Carlyle are the
other investors.
With a legacy of more than 80 years in the stock markets, the SSKI group ventured into
institutional broking and corporate finance 18 years ago. Presently SSKI is one of the leading
players in institutional broking and corporate finance activities. SSKI holds a sizeable portion of
the market in each of these segments. SSKI’s institutional broking arm accounts for 7% of the
market for Foreign Institutional portfolio investment and 5% of all Domestic Institutional portfolio
investment in the country. It has 60 institutional clients spread over India, Far East, UK and US.
Foreign Institutional Investors generate about 65% of the organization’s revenue, with a daily
turnover of over US$ 4 million. The Corporate Finance section has a list of very prestigious clients
and has many ‘firsts’ to its credit, in terms of the size of deal, sector tapped etc. The group has
placed over US$ 1 billion in private equity deals. Some of the clients include BPL Cellular
Holding, Gujarat Pipavav, Essar, Hutchison, Planetasia, and Shopper’s Stop.
16. 16 | P a g e
Sharekhan business
1. Brokering business.
2. White feathering house production.
17. 17 | P a g e
Vision
To be the best retail broking brand in the retail business of the stock market.
Mission
To educate and empower the individual investor to make better investment decisions through
quality advices and superior services.
Stock exchange Mumbai
Share khan is the retail broking arm of SSKI, an organization with more then eight
decade of trust and credibility in the stock market.
18. 18 | P a g e
Amongst pioneers of investment research in the Indian market.
In 1984 venture into institutional broking and the corporate finance.
Leading domestic player in the Indian institutional business.
Over US$5 billion of private equity deal.
SSKI group companies
SSKI investor services ltd (Sharekhan)
S.S. Kantilal Isharlal securities
SSKI corporate finance.
SSKI - Corporate Structure
80 years of taming Bulls & Bears
20. 20 | P a g e
SHAREKHAN PROFILE
SHAREKHAN RETAIL BROKING
Among the top three (3) branded retail services providers (Rs 856 crs average daily volume.
NO. 2 player in online business
Large network of branded broking outlets in the country servicing around 5, 45, 000
Clients
MANAGEMENT TEAM
Tarun P. Shah Mr. Jaideep Arora Shankar Vailaya
BOARD OF DIRECTORS
21. 21 | P a g e
BENEFITS
Free Depository A/c
Secure Order by Voice Tool Dial-n-Trade.
Automated Portfolio to keep track of the value of your actual purchases.
24x7 Voice Tool access to your trading account.
Personalized Price and Account Alerts delivered instantly to your Cell Phone & E-mail
address.
Special Personal Inbox for order and trade confirmations.
On-line Customer Service via Web Chat.
Anytime Ordering.
NSDL Account
Instant Cash Tranferation.
Multiple Bank Option.
Enjoy Automated Portfolio.
Buy or sell even single share.
Branch - Head Office
A-206, Phoenix House, 2nd Floor, Senapati Bapat Marg, Lower Parel, Mumbai- 400 013.
Telephone No: 67482000
Email: myaccount@sharekhan.com
22. 22 | P a g e
KEY OFFICIALS DESIGNATION
1. Mr. Shripal Morakhia Chairman
2. Mr. Tarun Shah CEO
3. Mr. Kaliyan Raman Online Sales Head
4. Mr. Jason Pandey and DP Head
Mr. Pradeep
5. Mr. Hemendra Aggarwal Cluster Head
6. Mr Amit pal Singh and Regional Sales Manager
Mr. Maneet Rastogi
23. 23 | P a g e
PRODUCTS OF SHAREKHAN
CLASSIC ACCOUNT
This account allows the client to trade through the website www.sharekhan.com and is suitable for
the retail investor who is risk-averse and hence prefers to invest in stocks or who do not trade too
frequently.
It allows investor to buy and sell stocks online along with the following features like multiple
watch lists, Integrated Banking, De-mat and Digital contracts, Real-time portfolio tracking with
price alerts and Instant money transfer.
FEATURES
Online trading account for investing in Equity and Derivatives via www.sharekhan.com
Live Terminal and Single terminal for NSE Cash, NSE F&O, BSE & Mutual Funds (online
and offline).
Integration of On-line trading, Saving Bank and De-mat Accounts.
Instant cash transfer facility against purchase & sale of shares.
Competative transaction charges.
Instant order and trade confirmation by E-mail.
Streaming Quotes (Cash & Derivatives).
Personlized market watch.
Single screen interface for Cash and derivatives and more.
Provision to enter price trigger and view the same online in market watch.
TRADE TIGER
TRADE TIGER is an internet-based software application which is the combination of
24. 24 | P a g e
EQUITY & COMMODITIES, that enables you to buy and sell share and well as commodities
item instantly. It is ideal for every client of SHAREKHAN LTD.
FEATURES
Integration of EQUITY & COMMODITIES MARKET.
Instant order Execution and Confirmation.
Single screen trading terminal for NSE Cash, NSE F&O & BSE & Commodities.
Technical Studies.
Multiple Charting.
Real-time streaming quotes, tic-by-tic charts.
Market summary (Cost traded scrip, highest value etc.)
Hot keys similar to broker’s terminal.
Alerts and reminders.
Back-up facility to place trades on Direct Phone lines.
Live market debts.
DIAL-N-TRADE
Along with enabling access for your trade online, the CLASSIC and TRADE TIGER
ACCOUNT also gives you our Dial-n-trade services. With this service, all you have to do is dial
our dedicated phone lines which are 1800-22-7500, 3970-7500.
PORTFOLIO MANAGEMENT SERVICES
Sharekhan is also having Portfolio Management Services for Exclusive clients.
25. 25 | P a g e
1. PROPRIME - Research& Fundamental Analysis.
Ideal for investors looking at steady and superior returns with low to medium risk appetite. This
portfolio consists of a blend of quality blue-chip and growth stocks ensuring a balanced portfolio
with relatively medium risk profile. The portfolio will mostly have large capitalization stocks
based on sectors & themes that have medium to long term growth potential.
2. PROTECH - Technical Analysis.
Protech uses the knowledge of technical analysis and the power of derivatives market to identify
trading opportunities in the market. The Protech lines of products are designed around various
risk/reward/ volatility profiles for different kinds of investment needs.
THRIFTY NIFTY: Nifty futures are bought and sold on the basis of an automated trading
system that generates calls to go long/short. The exposure never exceeds value of portfolio
i.e. there is no leveraging; but being short in Nifty allows you to earn even in falling
markets and there by generates linear
BETA PORTFOLIO: Positional trading opportunities are identified in the futures
segment based on technical analysis. Inflection points in the momentum cycles are
identified to go long/short on stock/index futures with 1-2 month time horizon. The idea is
to generate the best possible returns in the medium term irrespective of the direction of the
market without really leveraging beyond the portfolio value. Risk protection is done based
on stop losses on daily closing prices.
STAR NIFTY: Trailing Stops Momentum trading techniques are used to spot short term
momentum of 5-10 days in stocks and stocks/index futures. Trailing stop loss method of
risk management or profit protection is used to lower the portfolio volatility and maximize
returns. Trading opportunities are explored both on the long and the short side as the market
demands to get the best of both upwards & downward trends.
3. PROARBITRAGE - Exploit price analysis
26. 26 | P a g e
- ONLINE IPO'S AND MUTUAL FUNDS ADVISORY IS AVAILABLE.
PROCESS OF ACCOUNT OPPENING
LEAD MANAGEMENT SYSTEM (LMS) / REFERENCES
CONTACT
TELEPHONE AND PRESONAL VISIT
APPOINTMENT
DEMONSTRATION
AGREE DISAGREE (CLOSE)
DOCUMANTATION
FILLING THE FORM
27. 27 | P a g e
SUBMISSION THE FORM
LOGIN OF THE FORM
SENDING THE ACCOUNT OPENING KIT TO THE CUSTOMER FOR TRADING
CHARGE STRUCTURE
1)- PRE PAID OR AMC A/C: -
Advance Amount which will be fully adjsted against your brokerage you paid in One year.
Following Schemes Are Available: - Brokerage will be chagred -
1) - 750/- Scheme:- 0.05 / 0.50 %
2) - 1000/- Scheme 0.045 / 0.45 %
3) – 2,000/- Scheme: - 0.035 / 0.40 %
4) – 6,000/- Scheme: - 0.025 / 0.25 %
5) – 18,000/- Scheme: - 0.020 / 0.20 %
6) – 30,000/- Scheme: - 0.015 / 0.18 %
7) – 60,000/- Scheme: - 0.010 / 0.15 %
8) – 1,00,000/- Scheme: - 0.0075 / 0.10 %
Minimum Margine of Rs. 25000/- is Required for Account Opening.
Annual Maintanance Charges will NIL for 1st year and Rs. 400/- from 2nd year.
28. 28 | P a g e
- EXPOSURE : 4 TIMES (ON MARGINE MONEY)
- EXPOSURE : 10 TIMES (ON MAX TRADING)
- ONLINE IPO'S AND MUTUAL FUNDS ADVISORY IS AVAILABLE.
We are having tie-up with Eleven banks for online fund transfering i.e. HDFC, ICICI, IDBI,
CITI, Union Bank of India, Oriental Bank of Commerce, INDUSIND, AXIS, Centurian
Bank of Punjab, Bank of India and Yes Bank.
Company Provide 4-6 E-mail to there customers per day.
Online Trade in Share
Sharekhan customers can online trade through there computers, through internet during the market
timings.
Online Fund Transfer
We have tie up with Eleven Banks for online fund transferring i.e. HDFC, IDBI, CITI, UBI, OBC,
INDSLANDAND and UTI BANK, Yes bank, Bank of India for Online Money Transfer.
Research based investment advice
Investment and trading services
Trading and seminars
Technology based investment tools
Integrated demat facility
CUSTOMER CAN TRADE IN
o Equities
30. 30 | P a g e
SWOT ANALYSIS OF SHAREKHAN
(My observation)
STRENGTHS
1. Big client base
2. In-house research house
3. online as well as offline trading
4. Online IPO/ MF services
5. Share shops
6. Transparent
7. User friendly tie ups with 10 banks
8. Excellent order execution speed and reliability
WEAKNESS
1. Lack of awareness among customer
2. Less focus on customer retention
3. Less Exposure
OPPORTUNITIES
1. Diversification
2. Product modification
3. Improve Web based trading
4. Provide competitive brokerage
5. Concentrate on PMS
6. Focus on Institutional investors
7. Concentrate on HNI’s (high net worth investor)
31. 31 | P a g e
THREATS
1. Aggressive promotional strategies by close competitor like Religare, Angel Broking and India
bulls.
2. More and more players are venturing into this domain, which can further reduce the earning of
Share Khan.
3. Stock market is very volatile, risk involves is very high.
32. 32 | P a g e
LITERATURE REVIEW
A number of academic studies have provided evidence of demographic and non demographic
characteristics related to the financial risk tolerance of individuals. The most common variables
researched by academics to determine their relationship with financial risk tolerance are gender,
age, marital status, number of dependents, income, wealth, education and financial knowledge.
We report the main findings as well as a number of less-researched variables. Gender differences
have been widely examined, with a large number of studies reporting higher financial risk
tolerance for males (Grable, 2000; Grable and Joo, 2000; Bemasek and Shwiff, 2001; Chaulk,
Johnson, and Bulcroft, 2003; Yook and Everett, 2003; Grable, Lytton, and O'Neill, 2004; Hallahan,
Faff, and McKenzie, 2004; Yao, Hanna, and Lindamood, 2004; Fan and Xiao, 2006; Van de Venter
and Michayluk, 2007; Gilliam, Chatterjee, and Zhu,2010).
Studies have also argued that financial risk tolerance decreases with age (Xiao,
Alhabeeb, Hong, and Haynes, 2000; Chaulk, Johnson, and Bulcroft, 2003; Hallahan, Faff, and
McKenzie, 2004; Yao, Hanna, and Lindamood, 2004; Fan and Xiao, 2006; Van de Venter and
Michayluk, 2007; Faff, Hallahan, and McKenzie, 2009). Furthermore, a nonlinear aspect to age
has been observed (Hallahan, Faff, and McKenzie, 2004; Grable, Lytton, O'Neill, Joo, and Klock,
2006; Faff, Hallahan, and Mckenzie, 2009). The primary explanation for the observation of a
significantly negative coefficient for age and the nonlinear relationship has been attributed to the
time horizon to recover losses that is lower with age and the higher reliance on investment funds
as individuals’ age.
Marital status has been widely studied, especially because of its interaction with age
and gender. Financial risk tolerance is higher for single individuals (Grable and Joo, 2004;
Hallahan, Faff, and McKenzie, 2004; Yao, Hanna, and Lindamood, 2004; Fan and Xiao,2006).
The main justification for this result is that single individuals do not hold the same responsibilities
as those that are married and thus the single individuals are willing to accept more financial risk.
For example, Chaulk, Johnson, and Bulcroft (2003) propose that married individuals tend to have
a lower financial risk tolerance because of a greater need for wealth protection. When gender and
33. 33 | P a g e
marital status are incorporated together, Jianakoplos and Bemasek (1998) and Bemasek and Shwiff
(2001) find that single men tend to be more risk tolerant than single women. A negative
relationship between financial risk tolerance and the number of dependents is identified by Chaulk,
Johnson, and Bulcroft (2003) and Hallahan, Faff, and McKenzie (2004), with Faff, Hallahan, and
McKenzie (2009) proposing a statistically significant nonlinear linkage. This negative relationship
has been identified with marital status and may exist because of the added responsibilities and
more conservative outlook to risk when dependents are considered.
Higher financial risk tolerance is reported for individuals in high income and wealth
categories (Grable, 2000; Chaulk, Johnson, and Bulcroft, 2003; Yook and Everett, 2003; Chang,
DeVaney, and Chiremba, 2004; Grable and Joo, 2004; Grable, Lytton, and O'Neill, 2004;
Hallahan, Faff, and McKenzie, 2004; Yao, Hanna, and Lindamood, 2004; Fan and Xiao, 2006). In
addition, Grable and Joo (1999) indicate a significantly positive relationship between financial risk
tolerance and an individual's level of financial solvency.
A positive relationship has been identified between financial risk tolerance and education (Grable,
2000; Chang, DeVaney, and Chiremba, 2004; Grable and Joo, 2004; Hallahan, Faff, and
McKenzie, 2004; Yao, Hanna, and Lindamood, 2004; Fan and Xiao, 2006). Hallahan, Faff, and
Mckenzie (2004) also observe high positive correlations between income, wealth, and education,
suggesting that financial risk tolerance could be a function of income and wealth rather than
education.
Financial or investment knowledge has a positive relationship with financial risk tolerance (Grable,
2000; Grable and Joo, 2000, Grable and Joo, 2004; Van de Venter and Michayluk, 2007).
However, Davey (2004) challenges the view that educating individual investors about financial
markets and instruments will necessarily increase their financial risk tolerance.
Although the financial education of an advisor's clients is considered best practice, it will most
likely not have any direct influence on the risk preference of an individual as even the most
knowledgeable and educated could potentially have a low financial risk tolerance.
34. 34 | P a g e
When advising clients about investment decisions, financial advisors have to consider both their
financial goals and financial risk tolerance. In many cases these two could conflict, leading
advisors to recommend that individuals take on more risk than they are comfortable with to meet
their financial goals. Bemasek and Shwiff (2001) report that individuals generally tend to increase
the level of risk of their retirement savings after they have consulted a financial advisor.
Furthermore, this increase was found to be statistically significant for both the respondent and the
spouse or partner consulting a financial advisor, possibly suggesting the existence of a relationship
between gender and marital status as well.
In contrast to the earlier finding. Van de Venter and Michayluk (2007) find no statistically
significant effect on financial risk tolerance when a financial advisor is consulted. When
examining whether a financial advisor has any impact on investment behavior. Hung and Yoong
(2009) conclude that unless financial guidance is actively sought by the individual, consulting a
financial advisor has no impact on investment behavior. This finding highlights the difficulty when
interpreting survey questions that encompass financial advisors, and whether their advice is
undertaken.
Finally, Grable (2000) reports that individuals with positive economic expectations have higher
financial risk tolerance scores than those with less positive expectations, with Van de Venter and
Michayluk (2007) also finding evidence that financial risk tolerance is positively related to both
future expectations and previous investment performance. These previous findings identify many
factors that might influence risk tolerance on their own or in combination with others.
36. 36 | P a g e
OBJECTIVES OF THE STUDY
1. To understand the risk profile of investors.
2. To study risk bearing capacity on the basis of gender, education, occupation, age, family
income and number of dependents.
38. 38 | P a g e
RESEARCH METHODOLOGY
Research methodology is way to systematically solve the research problem. Research, in common
terms refers to a search for knowledge. Research methodology consists of different steps that are
generally adopted by a researcher to study the research problem along with the logic behind them.
RESEARCH DESIGN:
Research design is the plan, structure and strategy of investigation conceived so as to
obtain answers to research question.
There are two types of research design. One is exploratory research and other is
descriptive research
EXPLORATORY RESEARCH:
We studied the company report, talked to the customers and employee of the company. We
identified that inspite of providing various opportunities customers may not be aware of
derivative and commodity products.
DESCRIPTIVE RESEARCH
Survey method was adopted for this research
DATA SOURCES:
The study is mainly based on the data collection from primary as well as secondary sources.
Primary data: Data collected for specific purposes in the form of questionnaire
Secondary data: Data existing in the form of Books, Internet, Catalogues etc.
39. 39 | P a g e
SAMPLING DESIGN:
Definition of population: All the customers of share khan.
Sampling procedure: A non probability sampling technique i.e. convenient sampling procedure
was adopted.
Sampling size: A sample of 96 customers was selected from the target population for the study.
RESEARCH METHODOLOGY:
Research design : descriptive in nature.
Data source : data collected from primary and secondary sources.
Primary data : primary data is collected from the respondent through
these structured questionnaires.
SAMPLING DESIGN:
Sample size : 96
Sampling procedure : Convenience sampling
Statistical tool : Percentage method, mean, chi-square test.
STATISCAL TOOLS:
For the purpose of analysis, Mean and percentage methods are used for the calculation and
the result was interpreted. This test was used to minimize the error of the data collected.
40. 40 | P a g e
STATISTICAL TOOLS USED:
Sample tools are used for analyze purpose, they are follows:
1. Cross tab method
2. Chi square test
3. Phi and Cramer V test
Null hypothesis (HO) states: the two attributes are independent of each other.
Alternative hypothesis (HI) states:the two attributes are dependent of each other.
41. 41 | P a g e
1. To understand the risk profile of investors
Q9. What do you expect when you invest ?
CHART-1
Interpretation:- This chart-1 shows, out of 96 respondents 40 people are ready to bear nominal
risk and 36 people don’t want to take any risk. This shows that around 79% respondents are
conservative in terms of taking risk and only 21% respondents are ready to bear risk and out of
these 21 % only 3% are ready for high risk situation.
NO RISK NOMINAL RISK
MODERATE
RISK
HIGHER RISK
Series1 36 40 18 2
0
5
10
15
20
25
30
35
40
45
AxisTitle
RISK
42. 42 | P a g e
Q10 . How long do you normally hold investment?
CHART -2
Interpretation:- As per Chart-2,most of the respondents invest for a longer time period i.e. around
32% and rest of the respondents have very less variability regarding holding of investment as all
other respondents are equally interested in daily, weekly or monthly holding of investment i.e.
around 20% go for each kind of investment holding.
FOR A DAY FOR A WEEK FOR A MONTH FOR A YEAR
Series1 22 25 18 31
0
5
10
15
20
25
30
35
AxisTitle
TIME PERIOD
43. 43 | P a g e
Q11. If your investments were to fall in value by 15 per cent over a one-year period,
you will
Chart -3
.
Interpretation:- Chart-3 is giving the overview regarding respondents reaction related to their
investment, if market falls in value. We can see here the respondents /investors are neither very
conservative nor aggressive in market condition i.e. only 15% investors are willing to withdraw
all money or invest more money in such situation. Most of the respondents are aware & ready for
such condition. They want to be in the market in expectation of money of market.
WITHDRAW
ALL MONEY
FROM
SHARE
MARKET
TAKE OUT
SOME
MONEY
AND MOVE
IT TO SAFER
INVESTM…
WAIT UNTIL
MARKET
RECOVERS
THE LOSS
AND THEN
CONSIDER…
STICK TO
THE
INVESTMEN
T
INVEST
MORE
MONEY IN
THE SAME
INVESTMEN
T AS IT IS…
Series1 13 21 26 23 13
0
5
10
15
20
25
30
AxisTitle
INVESTMENT FALL BY 15%
44. 44 | P a g e
Q12. You are ready for limited losses inexpectation of higher long-term returns?
Chart-4
Interpretation:- Chart-4 is about that whether investors are ready to bear limited loss in
expectation of high returns we find that only around 30% investors are not agree for this but around
70% are considering the idea i.e. most of the respondents are aware about the ups & downs of
stock market & ready for risks involved in it in expectation of getting higher returns.
STRONGLY
DISAGREE
DISAGREE
NEITHER
AGREE OR
DISAGREE
AGREE
STRONGLY
AGREE
Series1 14 16 24 36 6
0
5
10
15
20
25
30
35
40
AxisTitle
LIMITED LOSSES IN EXPECTATION OF
HIGHER RETURNS
45. 45 | P a g e
Q.13. I am willing to experience the ups and downs of the market for the potential of
greater returns.
Chart-5
Interpretation:- Chart-5 is about that whether investors are ready to experience ups and downs
of market we find that only around 16% investors are not agree for this but around 84% are
considering the idea i.e. most of the respondents are aware about the ups & downs of stock market
& want to experience that.
STRONGLY
DISAGREE
DISAGREE
NEITHER
AGREE OR
DISAGREE
AGREE
STRONGLY
AGREE
Series1 5 11 39 35 6
0
5
10
15
20
25
30
35
40
45
AxisTitle
EXPERIENCE UPS AND DOWNS OF
MARKET
46. 46 | P a g e
Q14. My main concern is security; keeping money safe is more important than earning
high returns.
Chart-6
Interpretation:- This chart -6 shows the investors are aware about the highs and lows of security
market and want to experience that also they are quite positive towards market as they expect after
a low market will recover & give them higher return still the safety is major concern of investors.
Out of total 96 respondents only less than 10% disagree with the fact.
STRONGLY
DISAGREE
DISAGREE
NEITHER
AGREE OR
DISAGREE
AGREE
STRONGLY
AGREE
Series1 2 4 24 32 34
0
5
10
15
20
25
30
35
40
AxisTitle
MAIN CONCERN IS SAFETY
47. 47 | P a g e
Q15. I am fairly experienced in investment.
Chart-7
INTERPRETATION:- As we can see in the chart-7, most of the respondents i.e. around 50%
are not sure about their investment capabilities. They are not very sure that their expectation of
decision is fair enough. Here I want to mention that the market is so volatile in India that very
less investors find themselves fairly enough experienced & don’t bear losses.
STRONGLY
DISAGREE
DISAGREE
NEITHER
AGREE OR
DISAGREE
AGREE
STRONGLY
AGREE
Series1 4 15 43 29 5
0
5
10
15
20
25
30
35
40
45
50
AxisTitle
FAIRLY EXPERIENCED IN INVESTMENT
48. 48 | P a g e
Q16. I am very secure related to my future income (such as from salary, pension or other
investments)?
Chart-8
Interpretation:- Chart-8 shows that most of people involve in security market are quite secured
related to their future income. We can also understand the statement that the people who have fair
enough income resources, comes in security investment as they consider all the pros. & cons. Of
the market they know that the market is good place to get better returns but it also contain risk so
losses bearable only in the case of secured future returns.
STRONGLY
DISAGREE
DISAGREE
NEITHER
AGREE OR
DISAGREE
AGREE
STRONGLY
AGREE
Series1 2 4 15 23 52
0
10
20
30
40
50
60
AxisTitle
SECURE RELATED TO FUTURE INCOME
49. 49 | P a g e
2. To study risk bearing capacityon the basis of gender, education,
occupation, age, family income and number of dependents
To fulfill this objective I used cross tabs & chi-square test
The results are compiled in a sheet which shows the significance value & chi- square values of all
the cross tabs. Here I am providing 2 null hypothesis & 2 alternative hypothesis conditions as
sample.
Sample- Null Hypothesis
Gender in respectof expectationfrom an investment
X1 * X9 Crosstabulation
Count
X9 Total
NO RISK NOMINAL RISK MODERATE
RISK
HIGHER RISK
X1 MALE 27 29 13 2 71
FEMALE 9 11 5 0 25
Total 36 40 18 2 96
Chi-Square Tests
Value Df Asymp. Sig. (2-sided)
Pearson Chi-Square .797a
3 .850
Likelihood Ratio 1.299 3 .729
Linear-by-Linear Association .011 1 .917
N of Valid Cases 96
a. 3 cells (37.5%) have expected countless than 5. The minimum expected countis .52.
Interpretation: - As the chi-square shows the value of P is higher than .05, we will accept null
hypothesis i.e. there is no significant relationship in between the expectation from investment with
change in gender. Males and females are equally risk averse & conservative related to taking risk
in stock market.
51. 51 | P a g e
Gender in respectof holding time of investment
X1 * X10 Crosstabulation
Count
X10 Total
DAY WEEK MONTH YEAR
X1 MALE 15 19 13 24 71
FEMALE 7 6 5 7 25
Total 22 25 18 31 96
Chi-Square Tests
Value Df Asymp. Sig. (2-sided)
Pearson Chi-Square .656a
3 .883
Likelihood Ratio .647 3 .886
Linear-by-Linear Association .384 1 .536
N of Valid Cases 96
a. 1 cells (12.5%) have expected countless than 5. The minimum expected countis 4.69.
Interpretation :- As the chi-square shows the value of P is higher than .05, we will accept null
hypothesis i.e. there is no significant relationship in between the investment holding with change
in gender. Males and females are equally risk averse & conservative in holding the investment.
52. 52 | P a g e
Sample- Alternate Hypothesis
Family income in respectof risk bearing capacity
X7 * X9 Crosstabulation
Count
X9 Total
NO
RISK
NOMINAL
RISK
MODERATE
RISK
HIGHER
RISK
X7 < 5LAKH 21 17 4 1 43
5-15 LAKH 15 23 10 1 49
15-25
LAKH
0 0 4 0 4
Total 36 40 18 2 96
Chi-Square Tests
Value df Asymp. Sig. (2-sided)
Pearson Chi-Square 21.932a
6 .001
Likelihood Ratio 18.359 6 .005
Linear-by-Linear Association 9.013 1 .003
N of Valid Cases 96
a. 6 cells (50.0%) have expected countless than 5. The minimum expected countis .08.
Interpretation :-As the chi-square shows the value of P is higher than .05, we will accept
alternative hypothesis i.e. there is a significant relationship in between the expectation from
investment with change in family income. Investors are balanced & aggressive related to taking
risk in stock market.
53. 53 | P a g e
Education in respectof holding time period for investment
Chi-Square Tests
Value Df Asymp. Sig. (2-sided)
Pearson Chi-Square 20.330a
9 .016
Likelihood Ratio 22.004 9 .009
Linear-by-Linear Association 6.992 1 .008
N of Valid Cases 96
a. 9 cells (56.3%) have expected count less than 5. The minimum expected countis .75.
Interpretation :- As the chi-square shows the value of P is higher than .05, we will accept null
hypothesis i.e. there is a significant relationship in between the investment holding with change in
education. Investors are risk averse & conservative related to holding the investment.
As from the above crosstabs the table- 1 is drawn in reference with the chi- square values and the
significance values on different parameters and fills the box with yellow color who gives the best
alternative hypothesis value. Then after interpret that value which is come under that yellow box
and show their cross tabs.
X4 * X10 Crosstabulation
Count
X10 Total
DAY WEEK MONTH YEAR
X4 UNDER GRADUATE 1 1 3 10 15
GRADUATE 14 15 5 17 51
POST GRADUATE 6 7 9 4 26
PH.D. 1 2 1 0 4
Total 22 25 18 31 96
54. 54 | P a g e
TABLE-1
S.No. QUESTIONS GENDER OCCUPATION AGE EDUCATION
Pearson
chi-square
Significa
nce
Pearson
chi-
square
Signific
ance
Pearson
chi-
square
signifi
cance
Pearson
chi-
square
Significance
1 What do you expect
when you invest?
0.797 0.85 9.131 0.425 8.871 0.449 8.854 0.451
2 How long do you
normally hold
investments?
0.656 0.883 5.669 0.773 4.203 0.898 20.330 0.016
3 If your investments
were to fall in value by
15 per cent over a one-
year period, you will
6.934 0.139 13.707 0.32 16.943 0.152 11.253 0.507
4 You are ready
for limitedlosses in
expectation of higher
long-term returns?
6.266 0.18 17.361 0.137 9.682 0.644 28.133 0.005
5 I am willing to
experience the ups and
downs of the market
for the potential of
greaterreturns.
3.639 0.457 7.389 0.831 14.934 0.245 10.855 0.541
6 My main concern is
security; keeping
money safe is more
important than earning
high returns.
2.453 0.653 13.083 0.363 9.164 0.689 9.537 0.657
7 I am fairly experienced
in investment.
0.570 0.966 7.997 0.785 16.547 0.167 11.665 0.473
8 I am very secure
relatedto my
future income (such as
from salary, pension or
otherinvestments)?
2.561 0.634 9.092 0.695 5.942 0.919 3.830 0.986
55. 55 | P a g e
S.No. QUESTIONS INCOME No. of
dependents in
Family
FAMILY INCOME PERCENTAGE OF
TOTAL INVESTMENT
Pearson
chi-square
Significa
nce
Pearson
chi-
square
Signific
ance
Pearson
chi-
square
signifi
cance
Pearson
chi-
square
Significance
1 What do you expect
when you invest?
12.718 0.176 10.880 0.539 21.932 0.001 11.360 0.078
2 How long do you
normally hold
investments?
7.112 0.625 10.015 0.615 5.675 0.461 10.966 0.089
3 If your investments
were to fall in value by
15 per cent over a one-
year period, you will
11.086 0.522 12.448 0.713 7.197 0.516 7.471 0.487
4 You are ready
for limitedlosses in
expectation of higher
long-term returns?
21.667 0.041 26.948 0.042 21.371 0.006 15.920 0.044
5 I am willing to
experience the ups and
downs of the market
for the potential of
greaterreturns.
9.029 0.7 16.915 0.391 5.955 0.652 2.999 0.934
6 My main concern is
security; keeping
money safe is more
important than earning
high returns.
10.156 0.602 23.013 0.113 4.279 0.831 10.899 0.207
7 I am fairly experienced
in investment.
9.603 0.651 22.605 0.125 5.714 0.679 7.066 0.529
56. 56 | P a g e
8 I am very secure
relatedto my
future income (such as
from salary, pension or
otherinvestments)?
7.621 0.814 22.073 0.141 6.356 0.607 3.412 0.906
57. 57 | P a g e
Expectation of risk from an investment
From the Table-1 we can see that the all respondents’ views are indifferent in terms of expectation
of risk from investment irrespective of their gender, occupation, age, education, income, No. of
dependent in the family and the percentage of total income they invest as most of the respondents
wish to tale either no risk or nominal risk. This defines the conservatism related to risk profile of
the respondents. But on the basis of Family income it shows a significant relationship as p-value
is less than .05, which suggests accepting alternate hypothesis. The relationship is defined as
follows:
Table-2
Family income in respect of expectation of risk from an investment
X7 * X9 Crosstabulation
Count
X9 Total
NO
RISK
NOMINAL
RISK
MODERATE
RISK
HIGHER
RISK
X7 < 5LAKH 21 17 4 1 43
5-15 LAKH 15 23 10 1 49
15-25
LAKH
0 0 4 0 4
Total 36 40 18 2 96
49%
31%
0%
40% 47%
0%9%
20%
100%
2% 2% 0%
< 5LAKH 5-15 LAKH 15-25 LAKH
Family income in respect of
expectation of risk
NO RISK NOMINAL RISK MODERATE RISK HIGHER RISK
58. 58 | P a g e
Chi-Square Tests
Value Df Asymp. Sig.
(2-sided)
Pearson Chi-Square 21.932a
6 .001
Likelihood Ratio 18.359 6 .005
Linear-by-Linear
Association
9.013 1 .003
N of Valid Cases 96
a. 6 cells (50.0%) have expected countless than 5. The minimum
expected count is .08.
Symmetric Measures
Value Approx.
Sig.
Nominal byNominal Phi .478 .001
Cramer's V .338 .001
N of Valid Cases 96
Here from Table -2, it is clear that all the respondents belong to the family income group of < 5
Lakh and 5-15 Lakh are willing to take only nominal or no risk. In this situation as the income
level increases the risk taking ability is shifted towards the bearing the more risk.
This chart shows that most of the respondents lie in the income level group of <5 lakh want to go
for no risk situation but as the income level increases to 5-15 lakh people get shifted from no risk
to nominal risk situation. In the chart it is shown that out of 43 respondents who lies between the
income level group of<5lakh around 50% respondents do not want any risk in their investments.
are go for no risk and only 2% are going for high risk investments. Out of 49 respondents who lies
in between income group of 5-15 lakh 46% are go for moderate risk ,30% are for no risk . So it
defines that there is direct relationship between income and risk bearing capacity of persons.
People belong to the income group of 15-25 Lakh as are more towards taking moderate risk. But
the strength of relationship is very low as the value of Cramer’s V is .338.
59. 59 | P a g e
Investment holding
From the Table-1 we can see that the all respondents’ views are indifferent in terms of expectation
of risk from investment irrespective of their gender, occupation, age, education, income, No. of
dependent in the family and the percentage of total income they invest as most of the respondents
wish to hold investments either for a week or for a year. This defines the conservatism related to
risk profile of the respondents. But on the basis of Education it shows a significant relationship as
p-value is less than .05, which suggests accepting alternate hypothesis. The relationship is defined
as follows:
Table-3
Education in respect of their investment holding
X4 * X10 Crosstabulation
Count
X10 Total
DAY WEEK MONTH YEAR
X4 UNDER GRADUATE 1 1 3 10 15
GRADUATE 14 15 5 17 51
POST GRADUATE 6 7 9 4 26
PH.D. 1 2 1 0 4
Total 22 25 18 31 96
60. 60 | P a g e
Chi-Square Tests
Value Df Asymp. Sig. (2-sided)
Pearson Chi-Square 20.330a
9 .016
Likelihood Ratio 22.004 9 .009
Linear-by-Linear Association 6.992 1 .008
N of Valid Cases 96
a. 9 cells (56.3%) have expected countless than 5. The minimum expected countis .75.
Symmetric Measures
Value Approx. Sig.
Nominal byNominal Phi .460 .016
Cramer's V .266 .016
N of Valid Cases 96
Here from Table -3, it is clear that all the respondents belong to the education group of graduates
are willing to hold investments for a week or for a year.
This chart shows that most of the respondents lie in the education level group of graduate wants to
go for week or a year trading but as the education level increases to post graduates people get
diversify their investment holding period. In the chart it is shown that out of 51 respondents who
lies between the education level group of graduates around 33% respondents go for a year based
7%
27%
23% 25%
7%
29%
27%
50%
20%
10%
35%
25%
67%
33%
15%
0%
0%
10%
20%
30%
40%
50%
60%
70%
UNDER GRADUATE GRADUATE POST GRADUATE PH.D.
Education in respect of investment holdings
DAY
WEEK
MONTH
YEAR
61. 61 | P a g e
investment holding. And only 7% are going for a day investment holding. Out of 26 respondents
who lies in between education group of post graduates 35% are go for month investment holding,
15% are for year investment holding. So it defines that there is direct relationship between
education and investment holding tenure.
People belong to the education group of graduates are more towards the holding investment for a
week or a year . But the strength of relationship is very low as the value of Cramer’s V is .266.
62. 62 | P a g e
Limited losses in expectation of higher long term returns
From the Table-1 we can see that the all respondents’ views are indifferent in terms of bearing
limited losses in the expectation of higher long term returns irrespective of their gender,
occupation, age, education, income, No. of dependent in the family and the percentage of total
income they invest as most of the respondents wish to tale either agree or neither agree or disagree
in respect of bearing losses in expectation of higher long term returns. This defines the balanced
approach related to risk profile of the respondents. But on the basis of Education it shows a
significant relationship as p-value is less than .05, which suggests accepting alternate hypothesis.
The relationship is defined as follows:
Table-4 ( Education in respect of bearing limited losses in expectation of higher long term
returns)
X4 * X12 Crosstabulation
Count
X12 Total
STRONGLY
DISAGREE
DISAGRE
E
NEITHER
AGREE NOR
DISAGREE
AGREE STRONGLY
AGREE
X4 UNDER
GRADUATE
3 7 2 1 2 15
GRADUATE 8 8 17 17 1 51
POST GRADUATE 3 1 4 15 3 26
PH.D. 0 0 1 3 0 4
Total 14 16 24 36 6 96
63. 63 | P a g e
Chi-Square Tests
Value df Asymp. Sig.
(2-sided)
Pearson Chi-Square 28.133a
12 .005
Likelihood Ratio 29.565 12 .003
Linear-by-Linear
Association
10.020 1 .002
N of Valid Cases 96
a. 13 cells (65.0%) have expected count less than 5. The minimum
expected count is .25.
Symmetric Measures
Value Approx.
Sig.
Nominal byNominal Phi .541 .005
Cramer's V .313 .005
N of Valid Cases 96
Here from Table -4, it is clear that all the respondents belong to the education group of graduate
are willing to take limited losses in expectation of higher returns.
20%
16%
12%
0%
47%
16%
4%
0%
13%
33%
15%
25%
7%
33%
58%
75%
13%
2%
12%
0%
0%
10%
20%
30%
40%
50%
60%
70%
80%
UNDER GRADUATE GRADUATE POST GRADUATE PH.D.
STRONGLY
DISAGREE
DISAGREE
NEITHER AGREE
NOR DISAGREE
AGREE
STRONGLY
AGREE
Education in respectof bearinglimitedlosses
in expectationofhigherlong term returns
64. 64 | P a g e
This chart shows that most of the respondents lie in the education level group of graduate and
under graduates wants to bear limited losses in expectation of higher returns but as the education
level decreases to under graduates’ people is more concern about bearing limited losses in
expectation of higher returns. In the chart it is shown that out of 51 respondents who lies between
the education level group of graduates around 33% respondents are agree with bearing limited
losses in expectation of higher returns . And only 13% are not agree with it. Out of 26 respondents
who lies in between education group of post graduates 58% are agree, 12% are strongly agree with
it. So it defines that there is direct relationship between education and bearing limited losses in
expectation of higher returns.
People belong to the education group of graduates as are more towards in taking the limited losses
in expectation of higher returns. But the strength of relationship is very low as the value of
Cramer’s V is .313.
65. 65 | P a g e
Income in respect of limited losses in expectation of higher long term
return’s
From the Table-1 we can see that the all respondents’ views are indifferent in terms of bearing
limited losses in the expectation of higher long term returns irrespective of their gender,
occupation, age, education, income, No. of dependent in the family and the percentage of total
income they invest as most of the respondents wish to tale either agree or neither agree or disagree
in respect of bearing losses in expectation of higher long term returns. This defines the balanced
approach related to risk profile of the respondents. But on the basis of income it shows a significant
relationship as p-value is less than .05, which suggests accepting alternate hypothesis. The
relationship is defined as follows:
Table -5 Income in respect of limited losses in expectation of higher long term return’s
X5 * X12 Crosstabulation
Count
X12 Total
STRONGLY
DISAGREE
DISAGRE
E
NEITHER
AGREE NOR
DISAGREE
AGREE STRONGLY
AGREE
X5 < 3 LAKH 4 7 10 13 2 36
3-5 LAKH 7 9 10 13 2 41
5-10 LAKH 3 0 4 10 1 18
10-20
LAKH
0 0 0 0 1 1
Total 14 16 24 36 6 96
66. 66 | P a g e
Chi-Square Tests
Value Df Asymp. Sig. (2-sided)
Pearson Chi-Square 21.667a
12 .041
Likelihood Ratio 14.983 12 .242
Linear-by-Linear Association .978 1 .323
N of Valid Cases 96
a. 11 cells (55.0%) have expected count less than 5. The minimum expected countis .06.
Symmetric Measures
Value Approx.
Sig.
Nominal byNominal Phi .475 .041
Cramer's V .274 .041
N of Valid Cases 96
Here from Table -5, it is clear that all the respondents belong to the income group of <3 lakh and
3-5 lakh are willing to take limited losses in expectation of higher returns.
11%
17% 17%
0%
19% 22%
0% 0%
28% 24% 22%
0%
36%
32%
56%
0%
6% 5% 6%
100%
0%
20%
40%
60%
80%
100%
120%
< 3 LAKH 3-5 LAKH 5-10 LAKH 10-20 LAKH
STRONGLY
DISAGREE
DISAGREE
NEITHER
AGREE NOR
DISAGREE
AGREE
STRONGLY
AGREE
Income in respectof limitedlossesinexpectationof higherlong
term return’s
67. 67 | P a g e
This chart shows that most of the respondents lie in the income level group of <3 lakh are agree
for taking limited losses in expectation of higher returns but as the income level increases to 10-
20 lakh more people get shifted towards agree for taking limited losses in expectation of higher
returns. In the chart it is shown that out of 41 respondents who lies between the income level group
of 3-5lakh around 32% respondents are agree in taking limited losses in expectation of higher
returns. and only 2% are strongly agree with it.But if the income increases to 10-20 lakh most of
the persons are move towards strongly agree situation. So it defines that there is direct relationship
between income and limited losses in expectation of higher returns.
People belong to the income group of <3 lakh and 3-5 lakh as are more towards in taking the
limited losses in expectation of higher returns. But the strength of relationship is very low as the
value of Cramer’s V is .274.
TABLE-6 (No. of dependents in family in respectof limited losses inexpectation of
higher long term return’s)
X6 * X12 Crosstabulation
Count
X12 Total
STRONGLY
DISAGREE
DISAGRE
E
NEITHER
AGREE NOR
DISAGREE
AGREE STRONGLY
AGREE
X6 NO
DEPENDENT
1 0 0 3 1 5
1-2 5 3 1 3 1 13
3-4 5 7 18 19 2 51
5-7 3 4 5 11 1 24
>7 0 2 0 0 1 3
Total 14 16 24 36 6 96
68. 68 | P a g e
Chi-Square Tests
Value Df Asymp. Sig. (2-sided)
Pearson Chi-Square 26.948a
16 .042
Likelihood Ratio 25.934 16 .055
Linear-by-Linear Association .233 1 .629
N of Valid Cases 96
a. 19 cells (76.0%) have expected count less than 5. The minimum expected countis .19.
Symmetric Measures
Value Approx. Sig.
Nominal byNominal Phi .530 .042
Cramer's V .265 .042
N of Valid Cases 96
Here from Table -6, it is clear that all the respondents belong to the no. of dependents group of
3-4 and 5-7 members are willing to take limited losses in expectation of higher returns.
20%
38%
10%
13%
0%0%
23%
14%
17%
67%
0%
8%
35%
21%
0%
60%
23%
37%
46%
0%
20%
8%
4% 4%
33%
0%
10%
20%
30%
40%
50%
60%
70%
NO DEPENDENT 1 to2 3 to4 5 to7 >7
STRONGLY
DISAGREE
DISAGREE
NEITHER AGREE
NOR DISAGREE
AGREE
STRONGLY
AGREE
No. of dependentsinfamilyinrespectoflimitedlossesin
expectationofhigher longterm return’s
69. 69 | P a g e
This chart shows that most of the respondents lie in the No. of dependents level group of 3-4 are
agree for taking limited losses in expectation of higher returns but as the No. of dependents level
increases to >7 more people get shifted towards disagree for taking limited losses in expectation
of higher returns. In the chart it is shown that out of 51 respondents who lies between the No. of
dependents level group of 3-4 around 37% respondents are agree in taking limited losses in
expectation of higher returns. and only 4% are strongly agree with it. But if the No. of dependents
increases to >7 most of the persons are move towards disagree situation. So it defines that there is
direct relationship between income and limited losses in expectation of higher returns.
People belong to the income group of 3 -4 and 5-7 members as are more towards in taking the
limited losses in expectation of higher returns. But the strength of relationship is very low as the
value of Cramer’s V is .265.
70. 70 | P a g e
Family income in respect of limited losses in expectation of higher
long term return’s
From the Table-1 we can see that the all respondents’ views are indifferent in terms of bearing
limited losses in the expectation of higher long term returns irrespective of their gender,
occupation, age, education, income, No. of dependent in the family and the percentage of total
income they invest as most of the respondents wish to tale either agree or neither agree or disagree
in respect of bearing losses in expectation of higher long term returns. This defines the balanced
approach related to risk profile of the respondents. But on the basis of family income it shows a
significant relationship as p-value is less than .05, which suggests accepting alternate hypothesis.
The relationship is defined as follows:
TABLE-7 ( Family income in respect of limited losses in expectation of higher long term
return’s)
X7 * X12 Crosstabulation
Count
X12 Total
STRONGLY
DISAGREE
DISAGRE
E
NEITHER
AGREE NOR
DISAGREE
AGREE STRONGLY
AGREE
X7 < 5LAKH 6 11 12 12 2 43
5-15 LAKH 8 4 12 23 2 49
15-25
LAKH
0 1 0 1 2 4
Total 14 16 24 36 6 96
71. 71 | P a g e
Chi-Square Tests
Value Df Asymp. Sig. (2-sided)
Pearson Chi-Square 21.371a
8 .006
Likelihood Ratio 15.805 8 .045
Linear-by-Linear Association 3.687 1 .055
N of Valid Cases 96
a. 7 cells (46.7%) have expected countless than 5. The minimum expected countis .25.
Symmetric Measures
Value Approx. Sig.
Nominal byNominal Phi .472 .006
Cramer's V .334 .006
N of Valid Cases 96
14%
16%
0%
26%
8%
25%
28%
24%
0%
28%
47%
25%
5% 4%
50%
0%
10%
20%
30%
40%
50%
60%
< 5LAKH 5-15 LAKH 15-25 LAKH
Family income in respect of limitedlossesinexpectationof higher
long termreturn’s
STRONGLY DISAGREE
DISAGREE
NEITHER AGREE NOR
DISAGREE
AGREE
STRONGLY AGREE
72. 72 | P a g e
Here from Table -7, it is clear that all the respondents belong to the family income group of < 5
Lakh and 5-15 Lakh are willing to take limited losses in expectation of higher returns.
This chart shows that most of the respondents lie in the family income group of 5-15 lakh are agree
for taking limited losses in expectation of higher returns but as the family income level increases
to 15-25 lakh no. of people are decreases towards disagree for taking limited losses in expectation
of higher returns. In the chart it is shown that out of 49 respondents who lies between the family
income level group of 5-15 lakh around 47% respondents are agree in taking limited losses in
expectation of higher returns. and only 16% are strongly disagree with it. But if the family income
increases to 15-25 lakh no. of the persons are decreased in disagree situation. So it defines that
there is direct relationship between income and limited losses in expectation of higher returns.
People belong to the income group of <5 lakh and 5-15 lakh as are more towards in taking the
limited losses in expectation of higher returns. But the strength of relationship is very low as the
value of Cramer’s V is .334.
73. 73 | P a g e
Percentage of total investment in respect of limited losses in
expectation of long term return’s
From the Table-1 we can see that the all respondents’ views are indifferent in terms of bearing
limited losses in the expectation of higher long term returns irrespective of their gender,
occupation, age, education, income, No. of dependent in the family and the percentage of total
income they invest as most of the respondents wish to take either agree or neither agree or disagree
in respect of bearing losses in expectation of higher long term returns. This defines the balanced
approach related to risk profile of the respondents. But on the basis of percentage of total
investment it shows a significant relationship as p-value is less than .05, which suggests accepting
alternate hypothesis. The relationship is defined as follows:
TABLE -8 (Percentage of total investment in respect of limited losses in expectation of
long term return’s)
X8 * X12 Crosstabulation
Count
X12 Total
STRONGLY
DISAGREE
DISAGRE
E
NEITHER
AGREE NOR
DISAGREE
AGREE STRONGLY
AGREE
X8 BELOW
20%
6 11 20 14 2 53
20%-40% 8 5 4 21 4 42
40%-60% 0 0 0 1 0 1
Total 14 16 24 36 6 96
74. 74 | P a g e
Chi-Square Tests
Value df Asymp. Sig. (2-sided)
Pearson Chi-Square 15.920a
8 .044
Likelihood Ratio 17.029 8 .030
Linear-by-Linear Association 1.860 1 .173
N of Valid Cases 96
a. 7 cells (46.7%) have expected countless than 5. The minimum expected countis .06.
Symmetric Measures
Value Approx. Sig.
Nominal byNominal Phi .407 .044
Cramer's V .288 .044
N of Valid Cases 96
Here from Table -8, it is clear that all the respondents belong to the percentage of total income in
investment group of < 20% and 20%-40% are willing to take limited losses in expectation of higher
returns.
This chart shows that most of the respondents lie in the percentage of total investment group of
below 20% are neither agree or disagree for taking limited losses in expectation of higher returns
but as the percentage of total investment level increases to 40%-60% no. of people are increases
11%
19%
0%
21%
12%
0%
38%
10%
0%
26%
50%
100%
4%
10%
0%
0%
20%
40%
60%
80%
100%
120%
BELOW 20% 20%-40% 40%-60%
Percentageof total investmentinrespectof limitedlosses in
expectationof long termreturn’s
STRONGLY
DISAGREE
DISAGREE
NEITHER AGREE
NOR DISAGREE
AGREE
STRONGLY
AGREE
75. 75 | P a g e
towards agree for taking limited losses in expectation of higher returns. In the chart it is shown
that out of 52 respondents who lies between percentage of total investment level group of below
20% around 38%respondents are neither agree or disagree in taking limited losses in expectation
of higher returns and only 26% are agree with it. But if the percentage of total investment increases
to 40%-60% no. of the persons is increased in agree situation. So it defines that there is direct
relationship between income and limited losses in expectation of higher returns.
People belong to the income group of <20% and 20%-40% as are more towards in taking the
limited losses in expectation of higher returns. But the strength of relationship is very low as the
value of Cramer’s V is .288.
.
77. 77 | P a g e
Most of the respondents are ready to take either no risk or nominal risk while doing the
investment.
Most of the respondents are generally go for longer time horizon.
There is a situation of investment fall by 15% then most of the respondents are neither
conservative nor aggressive.
Most of the respondents are agree to take limited losses in expectation of higher returns.
Most of the respondents are give their opinion in the favor of experiencing the ups and
downs of the market.
Most of the respondents are agreeing with this there main concern is safety.
Most of the respondents are said that they are not sure about fairly experienced in
investment.
Most of the respondents are in favors of they are very much concern with security related
to future income.
This study shows most of the respondents either go for conservative risk profile or balanced
risk profile.
This study helps in describing the risk profile of investors.
This study describes the strong relationship between demographic data in respect of
different parameters.
78. 78 | P a g e
BIBLOGRAPHY:-
www.google.com
www.wikipedia.com
www.ebscohost.com
www.sharekhan.com
Financial derivatives and risk management by L.C.GUPTA
79. 79 | P a g e
QUETIONAIRE
Investment Pattern on the basis of Risk profile of Investors
I am a final year student currently pursuing my Post Graduate Diploma in Management (PGDM)
at I.T.S-Institute of Management, Greater Noida. I am conducting a research study on “An analysis
on investor behavior on various investment avenues”. This research (project) is taken as a partial
requirement for the completion of my PGDM. I seek your kind assistance in completing the
attached questionnaire which would take few minutes from your valuable time. Your responses
will be treated as Strictly Confidential.
PersonalInformation
1. Gender
a) Male b) Female
2. Occupation
i) Business ii) Service iii) Students iv) House wife
3. Age
i) 20-30 ii) 30-40 iii) 40-50 iv) Above 50
4. Education
i) Under Graduate ii) Graduate iii) Post Graduate iv) Ph. D.
5. Income
a) < 3 Lakh b) 3-5 Lakh c) 5-10 lakh d) 10-20 Lakh e) > 20 Lakh
6. No. of dependents in Family
a) No dependent b) 1-2 c) 3-4 d) 5-7 e) >7
7. Family Income
a) <5 Lakh b) 5-15 lakh c) 15-25 Lakh d) > 25 Lakh
8. How much percentage of total income he/she invests?
a) Below 20% b) 20 % - 40 % c) 40 % - 60% d) > 60 %
The risk-profile questionnaire
1. What do you expect when you invest?
a) no risk
b) nominal risk
c) moderate risk
d) higher risk
2. How long do you normally hold investments?
a) For a day
b) For a week
c) For a month
d) For a year
80. 80 | P a g e
3. If your investments were to fall in value by 15 per cent over a one-year period, you will
a) withdraw all money from share market
b) Take out some money and move it to a safer investment.
c) Wait until market recovers the loss and then consider other investments.
d) Stick to the investment.
e) Invest more money in the same investment as it is 15 per cent cheaper
4. You are ready for limited losses in expectation of higher long-term returns?
a) Strongly disagree
b) Disagree
c) Neither agree nor disagree
d) Agree
e) strongly agree
5. I am willing to experience the ups and downs of the market for the potential of greater
returns.
a) Strongly disagree
b) Disagree
c) Neither agree nor disagree
d) Agree
e) Strongly agree
6. My main concern is security; keeping money safe is more important than earning high
returns.
a) Strongly disagree.
b) Disagree.
c) Neither agree nor disagree.
d) Agree.
e) Strongly agree.
7. I am fairly experienced in investment.
a) Strongly disagree.
b) Disagree.
c) Neither agree nor disagree.
d) Agree.
e) Strongly agree.
8. I am very secure related to my future income (such as from salary, pension or other
investments)?
a) Strongly disagree.
b) Disagree.
c) Neither agree nor disagree.
d) Agree.
e) Strongly agree.