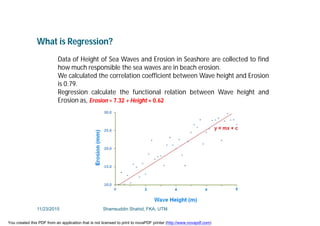
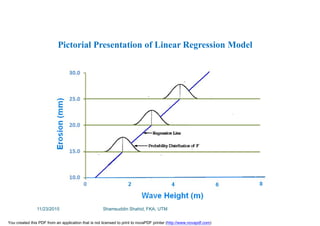
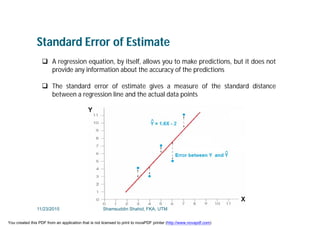
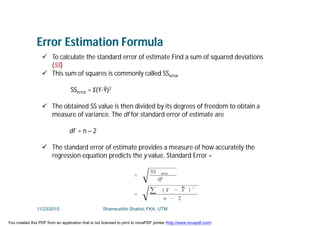
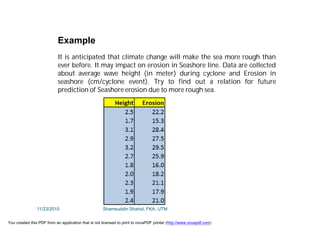
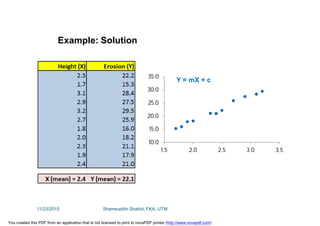
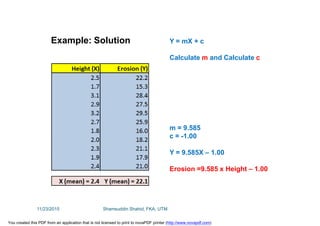
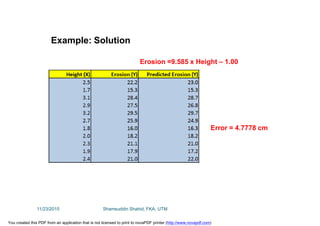
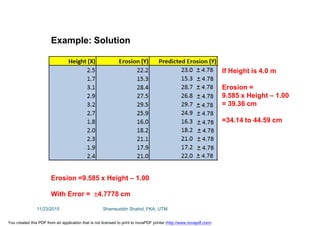
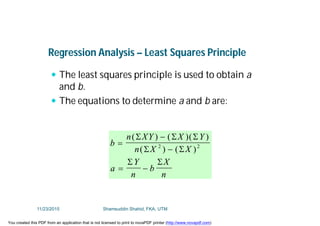
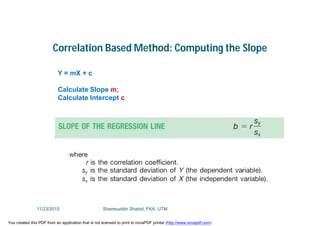
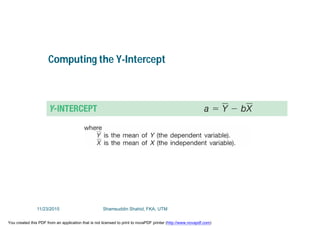
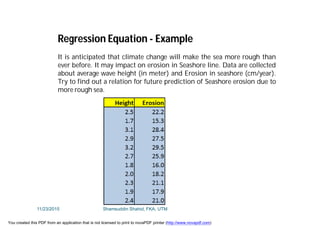
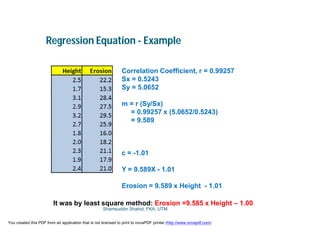
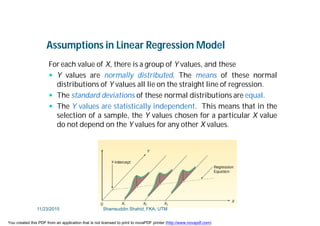
SlideShare a Scribd company logo
1 of 47
Download to read offline
MAL1303: STATISTICAL
HYDROLOGY
Regression Analysis
Dr. Shamsuddin Shahid
Associate Professor
Department of Hydraulics and Hydrology
Faculty of Civil Engineering
Room No.: M46-332;
Phone: 07-5531624; Mobile: 0182051586
Email: sshahid@utm.my
11/23/2015 Shamsuddin Shahid, FKA, UTM
You created this PDF from an application that is not licensed to print to novaPDF printer (http://www.novapdf.com)
Regression
Questions:
 Two variables are associated with one another. If one
variable is changed, then how much the other one
change?
 How can we mathematically formalize the functional
relationship between two variables?
Answer:
Regression Analysis
Definition: Regression is a statistical technique that is used to
determine the functional relationship between two variables.
Regression gives an equation that best describes the relationship
between two variables.
11/23/2015 Shamsuddin Shahid, FKA, UTM
You created this PDF from an application that is not licensed to print to novaPDF printer (http://www.novapdf.com)
Research Questions: Are two variables related?
Example questions in hydrology:
 “Is there any relation between rainfall and river discharge?”
 “Is there any relation between low river flow and river water
quality?”
 “Is there any relation between elevation and rainfall?”
 “Is there any relation between rainfall intensity and landslides?
Test the relationship: Correlation
If you change the questions from “Is” to “How” or “What”, e.g.
“How rainfall and River Discharge is Related?”
To nee to go for: Regression Analysis
11/23/2015 Shamsuddin Shahid, FKA, UTM
You created this PDF from an application that is not licensed to print to novaPDF printer (http://www.novapdf.com)
Simple Regression
 The dependent variable is the variable for which we
want to make a prediction and independent variable is
the variable that is used to predict.
 Simple regression analysis is a statistical tool that gives
us the ability to estimate the mathematical relationship
between a dependent variable (usually called y) and an
independent variable (usually called x).
 Regression can be Linear or Non-linear forms, but
simple linear regression models are the most common
in hydrology.
11/23/2015 Shamsuddin Shahid, FKA, UTM
You created this PDF from an application that is not licensed to print to novaPDF printer (http://www.novapdf.com)
The goal is to find a functional relation between the response
variable y and the predictor variable x.
y = f (x)
Another primary goal of quantitative analysis is to use current
information about a phenomenon to predict its future behavior.
Regression: Main Goals
11/23/2015 Shamsuddin Shahid, FKA, UTM
You created this PDF from an application that is not licensed to print to novaPDF printer (http://www.novapdf.com)
What is Regression?
Data of Height of Sea Waves and Erosion in Seashore are collected to find
how much responsible the sea waves are in beach erosion.
We calculated the correlation coefficient between Wave height and Erosion
is 0.79.
Regression calculate the functional relation between Wave height and
Erosion as, Erosion = 7.32 + Height × 0.62
11/23/2015 Shamsuddin Shahid, FKA, UTM
You created this PDF from an application that is not licensed to print to novaPDF printer (http://www.novapdf.com)
Pictorial Presentation of Linear Regression Model
11/23/2015 Shamsuddin Shahid, FKA, UTM
You created this PDF from an application that is not licensed to print to novaPDF printer (http://www.novapdf.com)
Regression analysis serves Three major purposes:
1.Description
2.Control
3.Prediction
Uses of Regression Analysis
11/23/2015 Shamsuddin Shahid, FKA, UTM
You created this PDF from an application that is not licensed to print to novaPDF printer (http://www.novapdf.com)
Difference between Correlation and Regression
 Correlation quantifies the degree to which two variables are related.
Correlation does not find functional relation. We simply compute a
correlation coefficient that tells us how much one variable tends to
change when the other one does.
 With correlation we don't have to think about cause and effect. We
simply quantify how well two variables relate to each other. With
regression, we do have to think about cause and effect as the regression
line is determined as the best way to predict Y from X.
 With correlation, it doesn't matter which of the two variables we call "X"
and which you call "Y". We get the same correlation coefficient if you
swap the two. With linear regression, the decision of which variable you
call "X" and which you call "Y" matters a lot, as you'll get a different best-
fit line if we swap the two. The line that best predicts Y from X is not the
same as the line that predicts X from Y.
11/23/2015 Shamsuddin Shahid, FKA, UTM
You created this PDF from an application that is not licensed to print to novaPDF printer (http://www.novapdf.com)
Linear and Non-linear Regression
 In Linear Regression, the model function is a linear combination of
parameters. Such as y = mx + c, i.e the mode can be represent a
straight line.
 In Non-linear Regression, the parameters appears as a non-linear
combination of parameter. Such y = x3 + 5e-3
11/23/2015 Shamsuddin Shahid, FKA, UTM
You created this PDF from an application that is not licensed to print to novaPDF printer (http://www.novapdf.com)
Construction of Regression Models
 Selection of independent variables
 Functional form of regression relation
 Scope of model
– Least square and correlation based
11/23/2015 Shamsuddin Shahid, FKA, UTM
You created this PDF from an application that is not licensed to print to novaPDF printer (http://www.novapdf.com)
Linear Regression – General Principle
A linear relationship between two
variables x and y can be expressed
by the equation,
y = mx + c
Where,
y is the dependent variable
x is independent variable
m and c are constants
In the general linear equation,
 The value of m is called the slope. The slope determines how much the
y variable will change when x is increased or decreased by one point
 The value of c in the general equation is called the Y-intercept. It
determines the value of y when x=0
11/23/2015 Shamsuddin Shahid, FKA, UTM
You created this PDF from an application that is not licensed to print to novaPDF printer (http://www.novapdf.com)
Least Squares Regression Principle
Shamsuddin Shahid, FKA, UTM
You created this PDF from an application that is not licensed to print to novaPDF printer (http://www.novapdf.com)
The Least Squares Solution
 For each value of x in the data, this equation will determine the point on the
line that gives the best prediction of y
 The problem is to find the specific values for m and c that will make this line
the best fitting. Least squares estimate of m
Where:
SP is the sum of products
SSx is the sum of squares for the X scores and
m =
SP
SSx
11/23/2015 Shamsuddin Shahid, FKA, UTM
You created this PDF from an application that is not licensed to print to novaPDF printer (http://www.novapdf.com)
Example of Regression Analysis
11/23/2015 Shamsuddin Shahid, FKA, UTM
You created this PDF from an application that is not licensed to print to novaPDF printer (http://www.novapdf.com)
Standard Error of Estimate
 A regression equation, by itself, allows you to make predictions, but it does not
provide any information about the accuracy of the predictions
 The standard error of estimate gives a measure of the standard distance
between a regression line and the actual data points
11/23/2015 Shamsuddin Shahid, FKA, UTM
You created this PDF from an application that is not licensed to print to novaPDF printer (http://www.novapdf.com)
Error Estimation Formula
 To calculate the standard error of estimate Find a sum of squared deviations
(SS)
 This sum of squares is commonly called SSerror
SSerror = Σ(Y-Ŷ)2
 The obtained SS value is then divided by its degrees of freedom to obtain a
measure of variance. The df for standard error of estimate are
df = n – 2
 The standard error of estimate provides a measure of how accurately the
regression equation predicts the y value, Standard Error =
11/23/2015 Shamsuddin Shahid, FKA, UTM
You created this PDF from an application that is not licensed to print to novaPDF printer (http://www.novapdf.com)
Error Estimation Example
11/23/2015 Shamsuddin Shahid, FKA, UTM
You created this PDF from an application that is not licensed to print to novaPDF printer (http://www.novapdf.com)
• The relationship between the variables is linear.
• Both variables must be at least interval scale.
• The least squares criterion is used to determine the equation.
Assumptions
11/23/2015 Shamsuddin Shahid, FKA, UTM
You created this PDF from an application that is not licensed to print to novaPDF printer (http://www.novapdf.com)
Example
It is anticipated that climate change will make the sea more rough than
ever before. It may impact on erosion in Seashore line. Data are collected
about average wave height (in meter) during cyclone and Erosion in
seashore (cm/cyclone event). Try to find out a relation for future
prediction of Seashore erosion due to more rough sea.
11/23/2015 Shamsuddin Shahid, FKA, UTM
You created this PDF from an application that is not licensed to print to novaPDF printer (http://www.novapdf.com)
Example: Solution
10.0
15.0
20.0
25.0
30.0
35.0
1.5 2.0 2.5 3.0 3.5
Y = mX + c
11/23/2015 Shamsuddin Shahid, FKA, UTM
You created this PDF from an application that is not licensed to print to novaPDF printer (http://www.novapdf.com)
Example: Solution Y = mX + c
Calculate m and Calculate c
m = 9.585
c = -1.00
Y = 9.585X – 1.00
Erosion =9.585 x Height – 1.00
11/23/2015 Shamsuddin Shahid, FKA, UTM
You created this PDF from an application that is not licensed to print to novaPDF printer (http://www.novapdf.com)
Example: Solution
Erosion =9.585 x Height – 1.00
Error = 4.7778 cm
11/23/2015 Shamsuddin Shahid, FKA, UTM
You created this PDF from an application that is not licensed to print to novaPDF printer (http://www.novapdf.com)
Example: Solution
Erosion =9.585 x Height – 1.00
With Error = 4.7778 cm
If Height is 4.0 m
Erosion =
9.585 x Height – 1.00
= 39.36 cm
=34.14 to 44.59 cm
11/23/2015 Shamsuddin Shahid, FKA, UTM
You created this PDF from an application that is not licensed to print to novaPDF printer (http://www.novapdf.com)
Regression Analysis – Least Squares Principle
 The least squares principle is used to obtain a
and b.
 The equations to determine a and b are:
b
n XY X Y
n X X
a
Y
n
b
X
n



 
( ) ( )( )
( ) ( )
  
 
 
2 2
11/23/2015 Shamsuddin Shahid, FKA, UTM
You created this PDF from an application that is not licensed to print to novaPDF printer (http://www.novapdf.com)
Correlation Based Method: Computing the Slope
Y = mX + c
Calculate Slope m;
Calculate Intercept c
11/23/2015 Shamsuddin Shahid, FKA, UTM
You created this PDF from an application that is not licensed to print to novaPDF printer (http://www.novapdf.com)
Computing the Y-Intercept
11/23/2015 Shamsuddin Shahid, FKA, UTM
You created this PDF from an application that is not licensed to print to novaPDF printer (http://www.novapdf.com)
Illustration of the Least Squares Regression Principle
Shamsuddin Shahid, FKA, UTM
You created this PDF from an application that is not licensed to print to novaPDF printer (http://www.novapdf.com)
It is anticipated that climate change will make the sea more rough than
ever before. It may impact on erosion in Seashore line. Data are collected
about average wave height (in meter) and Erosion in seashore (cm/year).
Try to find out a relation for future prediction of Seashore erosion due to
more rough sea.
Regression Equation - Example
11/23/2015 Shamsuddin Shahid, FKA, UTM
You created this PDF from an application that is not licensed to print to novaPDF printer (http://www.novapdf.com)
Regression Equation - Example
Correlation Coefficient, r = 0.99257
Sx = 0.5243
Sy = 5.0652
m = r (Sy/Sx)
= 0.99257 x (5.0652/0.5243)
= 9.589
c = -1.01
Y = 9.589X - 1.01
Erosion = 9.589 x Height - 1.01
It was by least square method: Erosion =9.585 x Height – 1.00
Shamsuddin Shahid, FKA, UTM
You created this PDF from an application that is not licensed to print to novaPDF printer (http://www.novapdf.com)
Assumptions in Linear Regression Model
For each value of X, there is a group of Y values, and these
 Y values are normally distributed. The means of these normal
distributions of Y values all lie on the straight line of regression.
 The standard deviations of these normal distributions are equal.
 The Y values are statistically independent. This means that in the
selection of a sample, the Y values chosen for a particular X value
do not depend on the Y values for any other X values.
11/23/2015 Shamsuddin Shahid, FKA, UTM
You created this PDF from an application that is not licensed to print to novaPDF printer (http://www.novapdf.com)
Confidence Interval Estimates of Y
A confidence interval reports the mean value of Y for a given X.
11/23/2015 Shamsuddin Shahid, FKA, UTM
You created this PDF from an application that is not licensed to print to novaPDF printer (http://www.novapdf.com)
Confidence Interval Estimates of Y
Erosion = 9.585 x Height – 1.00
If Height is 4.0 m
Erosion = 9.585 x 4.0 – 1.00
= 39.36 cm
11/23/2015 Shamsuddin Shahid, FKA, UTM
You created this PDF from an application that is not licensed to print to novaPDF printer (http://www.novapdf.com)
Confidence Interval Estimates of Y
Erosion = 9.585 x Height – 1.00
If Height is 2.5 m
Erosion = 9.585 x Height – 1.00
= 23.0 cm
Degree of Freedom, df = n-2 = 11-2 = 9
t(0.05; 9) = 2.262
Serr = 4.7778
Y(predicted) = 23.0
Confidence Interval = 23.0 ± 3.32
11/23/2015 Shamsuddin Shahid, FKA, UTM
You created this PDF from an application that is not licensed to print to novaPDF printer (http://www.novapdf.com)
Confidence Interval Estimates of Y
11/23/2015 Shamsuddin Shahid, FKA, UTM
You created this PDF from an application that is not licensed to print to novaPDF printer (http://www.novapdf.com)
Confidence Interval of Y
11/23/2015 Shamsuddin Shahid, FKA, UTM
You created this PDF from an application that is not licensed to print to novaPDF printer (http://www.novapdf.com)
Prediction Interval Estimates of Y
A prediction interval reports the range of values of Y for a
particular value of X.
11/23/2015 Shamsuddin Shahid, FKA, UTM
You created this PDF from an application that is not licensed to print to novaPDF printer (http://www.novapdf.com)
Prediction Interval Estimates of Y
Erosion = 9.585 x Height – 1.00
If Height is 4.0 m
Erosion = 9.585 x Height – 1.00
= 39.365 cm
Degree of Freedom, df = n-2 = 11-2 = 9
t(0.05; 11) = 2.262
Serr = 4.7778
Y(predicted) at 4.0 m height = 22.26
Prediction Interval = 39.365 ± 15.37
11/23/2015 Shamsuddin Shahid, FKA, UTM
You created this PDF from an application that is not licensed to print to novaPDF printer (http://www.novapdf.com)
Confidence Interval and Confidence Interval of Y
11/23/2015 Shamsuddin Shahid, FKA, UTM
You created this PDF from an application that is not licensed to print to novaPDF printer (http://www.novapdf.com)
Transforming Data
 The coefficient of correlation describes the strength of
the linear relationship between two variables. It could be
that two variables are closely related, but there
relationship may not be linear.
 Be cautious when you are interpreting the coefficient of
correlation. A value of r may indicate there is no linear
relationship, but it could be there is a relationship of
some other nonlinear or curvilinear form.
11/23/2015 Shamsuddin Shahid, FKA, UTM
You created this PDF from an application that is not licensed to print to novaPDF printer (http://www.novapdf.com)
Non-linear Data
 The correlation between the
Rainfall and River Dischare is
0.782. This is a fairly strong
inverse relationship.
 However, when we plot the
data on a scatter diagram the
relationship does not appear
to be linear; it does not seem
to follow a straight line.
11/23/2015 Shamsuddin Shahid, FKA, UTM
You created this PDF from an application that is not licensed to print to novaPDF printer (http://www.novapdf.com)
Transforming Data
 What can we do to explore other (nonlinear) relationships?
 One possibility is to transform one of the variables. For
example, instead of using Y as the dependent variable, we
might use its log, reciprocal, square, or square root.
 Another possibility is to transform both of the variable in the
same way.
 There are many other transformations, but log, reciprocal,
square, or square root are the most common.
11/23/2015 Shamsuddin Shahid, FKA, UTM
You created this PDF from an application that is not licensed to print to novaPDF printer (http://www.novapdf.com)
Transforming Data
11/23/2015 Shamsuddin Shahid, FKA, UTM
You created this PDF from an application that is not licensed to print to novaPDF printer (http://www.novapdf.com)
After log transformation of River Discharge Data we
got the regression equation as:
Transforming Data
11/23/2015 Shamsuddin Shahid, FKA, UTM
You created this PDF from an application that is not licensed to print to novaPDF printer (http://www.novapdf.com)
• The value 6.4372 is the log to the base 10 of winnings.
• The antilog of 6.4372 is 2.736
• Therefore, when rainfall is 70mm, discharge is 2.736 cumec.
Transforming Data
Prediction of River Discharge from Rainfall. What is
discharge when rainfall is 70 mm?
11/23/2015 Shamsuddin Shahid, FKA, UTM
You created this PDF from an application that is not licensed to print to novaPDF printer (http://www.novapdf.com)
Interpretation of Regression Equation
Y = mX + c
What does m mean?
What does c mean?
Let we got a regression equation:
Y = 10.2 X + 21.9
How will you interpret it?
11/23/2015 Shamsuddin Shahid, FKA, UTM
You created this PDF from an application that is not licensed to print to novaPDF printer (http://www.novapdf.com)
How will you interpret the following regression equation:
Y = 10.2 X + 21.9
Y = 10.2 X – 21.9
Y = 21.9 – 10.2 X
Interpretation of Regression Equation
11/23/2015 Shamsuddin Shahid, FKA, UTM
You created this PDF from an application that is not licensed to print to novaPDF printer (http://www.novapdf.com)

More Related Content

What's hot

Rapidly variying flow
Rapidly variying flowRapidly variying flow
Rapidly variying flowMilan Sheta
 
Flood forecasting presentation final
Flood forecasting presentation finalFlood forecasting presentation final
Flood forecasting presentation finalAbir Mohammad
 
Hydrology introduction ( catchment area)
Hydrology introduction ( catchment area)Hydrology introduction ( catchment area)
Hydrology introduction ( catchment area)Latif Hyder Wadho
 
energy dissipator in hydraulic structure
energy dissipator  in  hydraulic structure energy dissipator  in  hydraulic structure
energy dissipator in hydraulic structure Kiran Jadhav
 
Chapter 8 hydraulic jump
Chapter 8 hydraulic jumpChapter 8 hydraulic jump
Chapter 8 hydraulic jumpBinu Karki
 
Transboundary waters and water conflicts - current perspectives for the manag...
Transboundary waters and water conflicts - current perspectives for the manag...Transboundary waters and water conflicts - current perspectives for the manag...
Transboundary waters and water conflicts - current perspectives for the manag...Isabela Espíndola
 
Velocity measurement using current meter
Velocity measurement using current meterVelocity measurement using current meter
Velocity measurement using current meterMuhammad Bilal
 
Shahid Lecture-1- MKAG1273
Shahid Lecture-1- MKAG1273Shahid Lecture-1- MKAG1273
Shahid Lecture-1- MKAG1273nchakori
 
Flood risk assessment: Introduction and examples.
Flood risk assessment: Introduction and examples.Flood risk assessment: Introduction and examples.
Flood risk assessment: Introduction and examples.Ahmed Saleh, Ph.D
 
Flood frequency analysis
Flood frequency analysisFlood frequency analysis
Flood frequency analysisSanjan Banerjee
 
Flood frequency analyses
Flood frequency analysesFlood frequency analyses
Flood frequency analysesvivek gami
 
RAINFALL RUNOFF MODELLING USING HEC-HMS
RAINFALL RUNOFF MODELLING                USING HEC-HMSRAINFALL RUNOFF MODELLING                USING HEC-HMS
RAINFALL RUNOFF MODELLING USING HEC-HMSPushp Aggarwal
 
Climate change impact assessment on hydrology on river basins
Climate change impact assessment on hydrology on river basinsClimate change impact assessment on hydrology on river basins
Climate change impact assessment on hydrology on river basinsAbhiram Kanigolla
 
Water hammer in pipe_AMIT
Water hammer in pipe_AMITWater hammer in pipe_AMIT
Water hammer in pipe_AMITAmit Sharma
 
Reservoir capacity, Reservoir sedimentation and control
Reservoir capacity, Reservoir sedimentation  and controlReservoir capacity, Reservoir sedimentation  and control
Reservoir capacity, Reservoir sedimentation and controldeep shah
 
Floodmanagementstrategies
FloodmanagementstrategiesFloodmanagementstrategies
FloodmanagementstrategiesWill Williams
 

What's hot (20)

Rapidly variying flow
Rapidly variying flowRapidly variying flow
Rapidly variying flow
 
Flood forecasting presentation final
Flood forecasting presentation finalFlood forecasting presentation final
Flood forecasting presentation final
 
Presentation aboout flood routing
Presentation aboout flood routingPresentation aboout flood routing
Presentation aboout flood routing
 
Flood management m4
Flood management m4Flood management m4
Flood management m4
 
Hydrology introduction ( catchment area)
Hydrology introduction ( catchment area)Hydrology introduction ( catchment area)
Hydrology introduction ( catchment area)
 
energy dissipator in hydraulic structure
energy dissipator  in  hydraulic structure energy dissipator  in  hydraulic structure
energy dissipator in hydraulic structure
 
Chapter 8 hydraulic jump
Chapter 8 hydraulic jumpChapter 8 hydraulic jump
Chapter 8 hydraulic jump
 
Transboundary waters and water conflicts - current perspectives for the manag...
Transboundary waters and water conflicts - current perspectives for the manag...Transboundary waters and water conflicts - current perspectives for the manag...
Transboundary waters and water conflicts - current perspectives for the manag...
 
Velocity measurement using current meter
Velocity measurement using current meterVelocity measurement using current meter
Velocity measurement using current meter
 
Shahid Lecture-1- MKAG1273
Shahid Lecture-1- MKAG1273Shahid Lecture-1- MKAG1273
Shahid Lecture-1- MKAG1273
 
Flood risk assessment: Introduction and examples.
Flood risk assessment: Introduction and examples.Flood risk assessment: Introduction and examples.
Flood risk assessment: Introduction and examples.
 
Flood frequency analysis
Flood frequency analysisFlood frequency analysis
Flood frequency analysis
 
Precipitation and rain gauges
Precipitation and rain gaugesPrecipitation and rain gauges
Precipitation and rain gauges
 
Flood frequency analyses
Flood frequency analysesFlood frequency analyses
Flood frequency analyses
 
HYDRAULIC JUMP
HYDRAULIC JUMPHYDRAULIC JUMP
HYDRAULIC JUMP
 
RAINFALL RUNOFF MODELLING USING HEC-HMS
RAINFALL RUNOFF MODELLING                USING HEC-HMSRAINFALL RUNOFF MODELLING                USING HEC-HMS
RAINFALL RUNOFF MODELLING USING HEC-HMS
 
Climate change impact assessment on hydrology on river basins
Climate change impact assessment on hydrology on river basinsClimate change impact assessment on hydrology on river basins
Climate change impact assessment on hydrology on river basins
 
Water hammer in pipe_AMIT
Water hammer in pipe_AMITWater hammer in pipe_AMIT
Water hammer in pipe_AMIT
 
Reservoir capacity, Reservoir sedimentation and control
Reservoir capacity, Reservoir sedimentation  and controlReservoir capacity, Reservoir sedimentation  and control
Reservoir capacity, Reservoir sedimentation and control
 
Floodmanagementstrategies
FloodmanagementstrategiesFloodmanagementstrategies
Floodmanagementstrategies
 

Viewers also liked (16)

Tomé
ToméTomé
Tomé
 
São tomé e príncipe
São tomé e príncipeSão tomé e príncipe
São tomé e príncipe
 
Trabalho geografia
Trabalho geografiaTrabalho geografia
Trabalho geografia
 
Nep!!!!
Nep!!!!Nep!!!!
Nep!!!!
 
S. Tomé - 2012
S. Tomé  - 2012S. Tomé  - 2012
S. Tomé - 2012
 
Maria eduarda thais 501
Maria eduarda thais 501Maria eduarda thais 501
Maria eduarda thais 501
 
nep sao tome e principe
nep sao tome e principenep sao tome e principe
nep sao tome e principe
 
São tomé e príncipe
São tomé e príncipeSão tomé e príncipe
São tomé e príncipe
 
Língua e Música de S. Tomé e Príncipe
Língua e Música de S. Tomé e PríncipeLíngua e Música de S. Tomé e Príncipe
Língua e Música de S. Tomé e Príncipe
 
Sao Tomé é Príncipe, un paraíso ignoto
Sao Tomé é Príncipe, un paraíso ignotoSao Tomé é Príncipe, un paraíso ignoto
Sao Tomé é Príncipe, un paraíso ignoto
 
São tomé e príncipe
São tomé e príncipeSão tomé e príncipe
São tomé e príncipe
 
São tomé e príncipe
São tomé e príncipeSão tomé e príncipe
São tomé e príncipe
 
Julia terminar
Julia  terminarJulia  terminar
Julia terminar
 
S. Tomé e Príncipe
S. Tomé e PríncipeS. Tomé e Príncipe
S. Tomé e Príncipe
 
São tomé e príncipe
São tomé e príncipeSão tomé e príncipe
São tomé e príncipe
 
São tomé e Príncipe
São tomé e PríncipeSão tomé e Príncipe
São tomé e Príncipe
 

Similar to MAL1303: Regression Analysis for Predicting Seashore Erosion

Shahid Lecture-8- MKAG1273
Shahid Lecture-8- MKAG1273Shahid Lecture-8- MKAG1273
Shahid Lecture-8- MKAG1273nchakori
 
Shahid Lecture-5- MKAG1273
Shahid Lecture-5- MKAG1273Shahid Lecture-5- MKAG1273
Shahid Lecture-5- MKAG1273nchakori
 
Shahid Lecture-7- MKAG1273
Shahid Lecture-7- MKAG1273Shahid Lecture-7- MKAG1273
Shahid Lecture-7- MKAG1273nchakori
 
Shahid Lecture-12- MKAG1273
Shahid Lecture-12- MKAG1273Shahid Lecture-12- MKAG1273
Shahid Lecture-12- MKAG1273nchakori
 
Shahid Lecture-13-MKAG1273
Shahid Lecture-13-MKAG1273Shahid Lecture-13-MKAG1273
Shahid Lecture-13-MKAG1273nchakori
 
Shahid Lecture-2- MKAG1273
Shahid Lecture-2- MKAG1273Shahid Lecture-2- MKAG1273
Shahid Lecture-2- MKAG1273nchakori
 
Shahid Lecture-4-MKAG1273
Shahid Lecture-4-MKAG1273Shahid Lecture-4-MKAG1273
Shahid Lecture-4-MKAG1273nchakori
 
Decision Science_2.docx
Decision Science_2.docxDecision Science_2.docx
Decision Science_2.docxAkshat470463
 
Forecasting Municipal Solid Waste Generation Using a Multiple Linear Regressi...
Forecasting Municipal Solid Waste Generation Using a Multiple Linear Regressi...Forecasting Municipal Solid Waste Generation Using a Multiple Linear Regressi...
Forecasting Municipal Solid Waste Generation Using a Multiple Linear Regressi...IRJET Journal
 
Correlation analysis
Correlation analysisCorrelation analysis
Correlation analysisAwais Salman
 
Simple regressionand correlation (2).pdf
Simple regressionand correlation (2).pdfSimple regressionand correlation (2).pdf
Simple regressionand correlation (2).pdfyadavrahulrahul799
 
REPORTby Assignment 1 Asssignment 1Submission dat e 30.docx
REPORTby Assignment 1 Asssignment 1Submission dat e  30.docxREPORTby Assignment 1 Asssignment 1Submission dat e  30.docx
REPORTby Assignment 1 Asssignment 1Submission dat e 30.docxsodhi3
 
How regression analysis can be applied in business
How regression analysis can be applied in businessHow regression analysis can be applied in business
How regression analysis can be applied in businessImrul Quies
 
Evaluation Of A Correlation Analysis Essay
Evaluation Of A Correlation Analysis EssayEvaluation Of A Correlation Analysis Essay
Evaluation Of A Correlation Analysis EssayCrystal Alvarez
 
Course Title: Introduction to Machine Learning, Chapter 2- Supervised Learning
Course Title: Introduction to Machine Learning,  Chapter 2- Supervised LearningCourse Title: Introduction to Machine Learning,  Chapter 2- Supervised Learning
Course Title: Introduction to Machine Learning, Chapter 2- Supervised LearningShumet Tadesse
 
Quantitative Risk Assessment - Road Development Perspective
Quantitative Risk Assessment - Road Development PerspectiveQuantitative Risk Assessment - Road Development Perspective
Quantitative Risk Assessment - Road Development PerspectiveSUBIR KUMAR PODDER
 

Similar to MAL1303: Regression Analysis for Predicting Seashore Erosion (20)

Shahid Lecture-8- MKAG1273
Shahid Lecture-8- MKAG1273Shahid Lecture-8- MKAG1273
Shahid Lecture-8- MKAG1273
 
Shahid Lecture-5- MKAG1273
Shahid Lecture-5- MKAG1273Shahid Lecture-5- MKAG1273
Shahid Lecture-5- MKAG1273
 
Shahid Lecture-7- MKAG1273
Shahid Lecture-7- MKAG1273Shahid Lecture-7- MKAG1273
Shahid Lecture-7- MKAG1273
 
Shahid Lecture-12- MKAG1273
Shahid Lecture-12- MKAG1273Shahid Lecture-12- MKAG1273
Shahid Lecture-12- MKAG1273
 
Shahid Lecture-13-MKAG1273
Shahid Lecture-13-MKAG1273Shahid Lecture-13-MKAG1273
Shahid Lecture-13-MKAG1273
 
Shahid Lecture-2- MKAG1273
Shahid Lecture-2- MKAG1273Shahid Lecture-2- MKAG1273
Shahid Lecture-2- MKAG1273
 
Shahid Lecture-4-MKAG1273
Shahid Lecture-4-MKAG1273Shahid Lecture-4-MKAG1273
Shahid Lecture-4-MKAG1273
 
ai.pptx
ai.pptxai.pptx
ai.pptx
 
Correlation and regression in r
Correlation and regression in rCorrelation and regression in r
Correlation and regression in r
 
Decision Science_2.docx
Decision Science_2.docxDecision Science_2.docx
Decision Science_2.docx
 
Forecasting Municipal Solid Waste Generation Using a Multiple Linear Regressi...
Forecasting Municipal Solid Waste Generation Using a Multiple Linear Regressi...Forecasting Municipal Solid Waste Generation Using a Multiple Linear Regressi...
Forecasting Municipal Solid Waste Generation Using a Multiple Linear Regressi...
 
Correlation analysis
Correlation analysisCorrelation analysis
Correlation analysis
 
Simple regressionand correlation (2).pdf
Simple regressionand correlation (2).pdfSimple regressionand correlation (2).pdf
Simple regressionand correlation (2).pdf
 
REPORTby Assignment 1 Asssignment 1Submission dat e 30.docx
REPORTby Assignment 1 Asssignment 1Submission dat e  30.docxREPORTby Assignment 1 Asssignment 1Submission dat e  30.docx
REPORTby Assignment 1 Asssignment 1Submission dat e 30.docx
 
How regression analysis can be applied in business
How regression analysis can be applied in businessHow regression analysis can be applied in business
How regression analysis can be applied in business
 
Answers
AnswersAnswers
Answers
 
Evaluation Of A Correlation Analysis Essay
Evaluation Of A Correlation Analysis EssayEvaluation Of A Correlation Analysis Essay
Evaluation Of A Correlation Analysis Essay
 
Course Title: Introduction to Machine Learning, Chapter 2- Supervised Learning
Course Title: Introduction to Machine Learning,  Chapter 2- Supervised LearningCourse Title: Introduction to Machine Learning,  Chapter 2- Supervised Learning
Course Title: Introduction to Machine Learning, Chapter 2- Supervised Learning
 
Quantitative Risk Assessment - Road Development Perspective
Quantitative Risk Assessment - Road Development PerspectiveQuantitative Risk Assessment - Road Development Perspective
Quantitative Risk Assessment - Road Development Perspective
 
Qt unit i
Qt unit   iQt unit   i
Qt unit i
 

Recently uploaded

CCS355 Neural Network & Deep Learning UNIT III notes and Question bank .pdf
CCS355 Neural Network & Deep Learning UNIT III notes and Question bank .pdfCCS355 Neural Network & Deep Learning UNIT III notes and Question bank .pdf
CCS355 Neural Network & Deep Learning UNIT III notes and Question bank .pdfAsst.prof M.Gokilavani
 
VIP Call Girls Service Hitech City Hyderabad Call +91-8250192130
VIP Call Girls Service Hitech City Hyderabad Call +91-8250192130VIP Call Girls Service Hitech City Hyderabad Call +91-8250192130
VIP Call Girls Service Hitech City Hyderabad Call +91-8250192130Suhani Kapoor
 
College Call Girls Nashik Nehal 7001305949 Independent Escort Service Nashik
College Call Girls Nashik Nehal 7001305949 Independent Escort Service NashikCollege Call Girls Nashik Nehal 7001305949 Independent Escort Service Nashik
College Call Girls Nashik Nehal 7001305949 Independent Escort Service NashikCall Girls in Nagpur High Profile
 
Microscopic Analysis of Ceramic Materials.pptx
Microscopic Analysis of Ceramic Materials.pptxMicroscopic Analysis of Ceramic Materials.pptx
Microscopic Analysis of Ceramic Materials.pptxpurnimasatapathy1234
 
Biology for Computer Engineers Course Handout.pptx
Biology for Computer Engineers Course Handout.pptxBiology for Computer Engineers Course Handout.pptx
Biology for Computer Engineers Course Handout.pptxDeepakSakkari2
 
HARMONY IN THE NATURE AND EXISTENCE - Unit-IV
HARMONY IN THE NATURE AND EXISTENCE - Unit-IVHARMONY IN THE NATURE AND EXISTENCE - Unit-IV
HARMONY IN THE NATURE AND EXISTENCE - Unit-IVRajaP95
 
(MEERA) Dapodi Call Girls Just Call 7001035870 [ Cash on Delivery ] Pune Escorts
(MEERA) Dapodi Call Girls Just Call 7001035870 [ Cash on Delivery ] Pune Escorts(MEERA) Dapodi Call Girls Just Call 7001035870 [ Cash on Delivery ] Pune Escorts
(MEERA) Dapodi Call Girls Just Call 7001035870 [ Cash on Delivery ] Pune Escortsranjana rawat
 
Sheet Pile Wall Design and Construction: A Practical Guide for Civil Engineer...
Sheet Pile Wall Design and Construction: A Practical Guide for Civil Engineer...Sheet Pile Wall Design and Construction: A Practical Guide for Civil Engineer...
Sheet Pile Wall Design and Construction: A Practical Guide for Civil Engineer...Dr.Costas Sachpazis
 
Artificial-Intelligence-in-Electronics (K).pptx
Artificial-Intelligence-in-Electronics (K).pptxArtificial-Intelligence-in-Electronics (K).pptx
Artificial-Intelligence-in-Electronics (K).pptxbritheesh05
 
Internship report on mechanical engineering
Internship report on mechanical engineeringInternship report on mechanical engineering
Internship report on mechanical engineeringmalavadedarshan25
 
Heart Disease Prediction using machine learning.pptx
Heart Disease Prediction using machine learning.pptxHeart Disease Prediction using machine learning.pptx
Heart Disease Prediction using machine learning.pptxPoojaBan
 
CCS355 Neural Network & Deep Learning Unit II Notes with Question bank .pdf
CCS355 Neural Network & Deep Learning Unit II Notes with Question bank .pdfCCS355 Neural Network & Deep Learning Unit II Notes with Question bank .pdf
CCS355 Neural Network & Deep Learning Unit II Notes with Question bank .pdfAsst.prof M.Gokilavani
 
Call Girls Narol 7397865700 Independent Call Girls
Call Girls Narol 7397865700 Independent Call GirlsCall Girls Narol 7397865700 Independent Call Girls
Call Girls Narol 7397865700 Independent Call Girlsssuser7cb4ff
 
(ANVI) Koregaon Park Call Girls Just Call 7001035870 [ Cash on Delivery ] Pun...
(ANVI) Koregaon Park Call Girls Just Call 7001035870 [ Cash on Delivery ] Pun...(ANVI) Koregaon Park Call Girls Just Call 7001035870 [ Cash on Delivery ] Pun...
(ANVI) Koregaon Park Call Girls Just Call 7001035870 [ Cash on Delivery ] Pun...ranjana rawat
 
What are the advantages and disadvantages of membrane structures.pptx
What are the advantages and disadvantages of membrane structures.pptxWhat are the advantages and disadvantages of membrane structures.pptx
What are the advantages and disadvantages of membrane structures.pptxwendy cai
 
Introduction to Microprocesso programming and interfacing.pptx
Introduction to Microprocesso programming and interfacing.pptxIntroduction to Microprocesso programming and interfacing.pptx
Introduction to Microprocesso programming and interfacing.pptxvipinkmenon1
 
Study on Air-Water & Water-Water Heat Exchange in a Finned Tube Exchanger
Study on Air-Water & Water-Water Heat Exchange in a Finned Tube ExchangerStudy on Air-Water & Water-Water Heat Exchange in a Finned Tube Exchanger
Study on Air-Water & Water-Water Heat Exchange in a Finned Tube ExchangerAnamika Sarkar
 
Model Call Girl in Narela Delhi reach out to us at 🔝8264348440🔝
Model Call Girl in Narela Delhi reach out to us at 🔝8264348440🔝Model Call Girl in Narela Delhi reach out to us at 🔝8264348440🔝
Model Call Girl in Narela Delhi reach out to us at 🔝8264348440🔝soniya singh
 

Recently uploaded (20)

CCS355 Neural Network & Deep Learning UNIT III notes and Question bank .pdf
CCS355 Neural Network & Deep Learning UNIT III notes and Question bank .pdfCCS355 Neural Network & Deep Learning UNIT III notes and Question bank .pdf
CCS355 Neural Network & Deep Learning UNIT III notes and Question bank .pdf
 
VIP Call Girls Service Hitech City Hyderabad Call +91-8250192130
VIP Call Girls Service Hitech City Hyderabad Call +91-8250192130VIP Call Girls Service Hitech City Hyderabad Call +91-8250192130
VIP Call Girls Service Hitech City Hyderabad Call +91-8250192130
 
College Call Girls Nashik Nehal 7001305949 Independent Escort Service Nashik
College Call Girls Nashik Nehal 7001305949 Independent Escort Service NashikCollege Call Girls Nashik Nehal 7001305949 Independent Escort Service Nashik
College Call Girls Nashik Nehal 7001305949 Independent Escort Service Nashik
 
Microscopic Analysis of Ceramic Materials.pptx
Microscopic Analysis of Ceramic Materials.pptxMicroscopic Analysis of Ceramic Materials.pptx
Microscopic Analysis of Ceramic Materials.pptx
 
Biology for Computer Engineers Course Handout.pptx
Biology for Computer Engineers Course Handout.pptxBiology for Computer Engineers Course Handout.pptx
Biology for Computer Engineers Course Handout.pptx
 
HARMONY IN THE NATURE AND EXISTENCE - Unit-IV
HARMONY IN THE NATURE AND EXISTENCE - Unit-IVHARMONY IN THE NATURE AND EXISTENCE - Unit-IV
HARMONY IN THE NATURE AND EXISTENCE - Unit-IV
 
(MEERA) Dapodi Call Girls Just Call 7001035870 [ Cash on Delivery ] Pune Escorts
(MEERA) Dapodi Call Girls Just Call 7001035870 [ Cash on Delivery ] Pune Escorts(MEERA) Dapodi Call Girls Just Call 7001035870 [ Cash on Delivery ] Pune Escorts
(MEERA) Dapodi Call Girls Just Call 7001035870 [ Cash on Delivery ] Pune Escorts
 
Sheet Pile Wall Design and Construction: A Practical Guide for Civil Engineer...
Sheet Pile Wall Design and Construction: A Practical Guide for Civil Engineer...Sheet Pile Wall Design and Construction: A Practical Guide for Civil Engineer...
Sheet Pile Wall Design and Construction: A Practical Guide for Civil Engineer...
 
Artificial-Intelligence-in-Electronics (K).pptx
Artificial-Intelligence-in-Electronics (K).pptxArtificial-Intelligence-in-Electronics (K).pptx
Artificial-Intelligence-in-Electronics (K).pptx
 
Internship report on mechanical engineering
Internship report on mechanical engineeringInternship report on mechanical engineering
Internship report on mechanical engineering
 
Heart Disease Prediction using machine learning.pptx
Heart Disease Prediction using machine learning.pptxHeart Disease Prediction using machine learning.pptx
Heart Disease Prediction using machine learning.pptx
 
CCS355 Neural Network & Deep Learning Unit II Notes with Question bank .pdf
CCS355 Neural Network & Deep Learning Unit II Notes with Question bank .pdfCCS355 Neural Network & Deep Learning Unit II Notes with Question bank .pdf
CCS355 Neural Network & Deep Learning Unit II Notes with Question bank .pdf
 
Call Girls Narol 7397865700 Independent Call Girls
Call Girls Narol 7397865700 Independent Call GirlsCall Girls Narol 7397865700 Independent Call Girls
Call Girls Narol 7397865700 Independent Call Girls
 
young call girls in Rajiv Chowk🔝 9953056974 🔝 Delhi escort Service
young call girls in Rajiv Chowk🔝 9953056974 🔝 Delhi escort Serviceyoung call girls in Rajiv Chowk🔝 9953056974 🔝 Delhi escort Service
young call girls in Rajiv Chowk🔝 9953056974 🔝 Delhi escort Service
 
(ANVI) Koregaon Park Call Girls Just Call 7001035870 [ Cash on Delivery ] Pun...
(ANVI) Koregaon Park Call Girls Just Call 7001035870 [ Cash on Delivery ] Pun...(ANVI) Koregaon Park Call Girls Just Call 7001035870 [ Cash on Delivery ] Pun...
(ANVI) Koregaon Park Call Girls Just Call 7001035870 [ Cash on Delivery ] Pun...
 
🔝9953056974🔝!!-YOUNG call girls in Rajendra Nagar Escort rvice Shot 2000 nigh...
🔝9953056974🔝!!-YOUNG call girls in Rajendra Nagar Escort rvice Shot 2000 nigh...🔝9953056974🔝!!-YOUNG call girls in Rajendra Nagar Escort rvice Shot 2000 nigh...
🔝9953056974🔝!!-YOUNG call girls in Rajendra Nagar Escort rvice Shot 2000 nigh...
 
What are the advantages and disadvantages of membrane structures.pptx
What are the advantages and disadvantages of membrane structures.pptxWhat are the advantages and disadvantages of membrane structures.pptx
What are the advantages and disadvantages of membrane structures.pptx
 
Introduction to Microprocesso programming and interfacing.pptx
Introduction to Microprocesso programming and interfacing.pptxIntroduction to Microprocesso programming and interfacing.pptx
Introduction to Microprocesso programming and interfacing.pptx
 
Study on Air-Water & Water-Water Heat Exchange in a Finned Tube Exchanger
Study on Air-Water & Water-Water Heat Exchange in a Finned Tube ExchangerStudy on Air-Water & Water-Water Heat Exchange in a Finned Tube Exchanger
Study on Air-Water & Water-Water Heat Exchange in a Finned Tube Exchanger
 
Model Call Girl in Narela Delhi reach out to us at 🔝8264348440🔝
Model Call Girl in Narela Delhi reach out to us at 🔝8264348440🔝Model Call Girl in Narela Delhi reach out to us at 🔝8264348440🔝
Model Call Girl in Narela Delhi reach out to us at 🔝8264348440🔝
 

MAL1303: Regression Analysis for Predicting Seashore Erosion

  • 1. MAL1303: STATISTICAL HYDROLOGY Regression Analysis Dr. Shamsuddin Shahid Associate Professor Department of Hydraulics and Hydrology Faculty of Civil Engineering Room No.: M46-332; Phone: 07-5531624; Mobile: 0182051586 Email: sshahid@utm.my 11/23/2015 Shamsuddin Shahid, FKA, UTM You created this PDF from an application that is not licensed to print to novaPDF printer (http://www.novapdf.com)
  • 2. Regression Questions:  Two variables are associated with one another. If one variable is changed, then how much the other one change?  How can we mathematically formalize the functional relationship between two variables? Answer: Regression Analysis Definition: Regression is a statistical technique that is used to determine the functional relationship between two variables. Regression gives an equation that best describes the relationship between two variables. 11/23/2015 Shamsuddin Shahid, FKA, UTM You created this PDF from an application that is not licensed to print to novaPDF printer (http://www.novapdf.com)
  • 3. Research Questions: Are two variables related? Example questions in hydrology:  “Is there any relation between rainfall and river discharge?”  “Is there any relation between low river flow and river water quality?”  “Is there any relation between elevation and rainfall?”  “Is there any relation between rainfall intensity and landslides? Test the relationship: Correlation If you change the questions from “Is” to “How” or “What”, e.g. “How rainfall and River Discharge is Related?” To nee to go for: Regression Analysis 11/23/2015 Shamsuddin Shahid, FKA, UTM You created this PDF from an application that is not licensed to print to novaPDF printer (http://www.novapdf.com)
  • 4. Simple Regression  The dependent variable is the variable for which we want to make a prediction and independent variable is the variable that is used to predict.  Simple regression analysis is a statistical tool that gives us the ability to estimate the mathematical relationship between a dependent variable (usually called y) and an independent variable (usually called x).  Regression can be Linear or Non-linear forms, but simple linear regression models are the most common in hydrology. 11/23/2015 Shamsuddin Shahid, FKA, UTM You created this PDF from an application that is not licensed to print to novaPDF printer (http://www.novapdf.com)
  • 5. The goal is to find a functional relation between the response variable y and the predictor variable x. y = f (x) Another primary goal of quantitative analysis is to use current information about a phenomenon to predict its future behavior. Regression: Main Goals 11/23/2015 Shamsuddin Shahid, FKA, UTM You created this PDF from an application that is not licensed to print to novaPDF printer (http://www.novapdf.com)
  • 6. What is Regression? Data of Height of Sea Waves and Erosion in Seashore are collected to find how much responsible the sea waves are in beach erosion. We calculated the correlation coefficient between Wave height and Erosion is 0.79. Regression calculate the functional relation between Wave height and Erosion as, Erosion = 7.32 + Height × 0.62 11/23/2015 Shamsuddin Shahid, FKA, UTM You created this PDF from an application that is not licensed to print to novaPDF printer (http://www.novapdf.com)
  • 7. Pictorial Presentation of Linear Regression Model 11/23/2015 Shamsuddin Shahid, FKA, UTM You created this PDF from an application that is not licensed to print to novaPDF printer (http://www.novapdf.com)
  • 8. Regression analysis serves Three major purposes: 1.Description 2.Control 3.Prediction Uses of Regression Analysis 11/23/2015 Shamsuddin Shahid, FKA, UTM You created this PDF from an application that is not licensed to print to novaPDF printer (http://www.novapdf.com)
  • 9. Difference between Correlation and Regression  Correlation quantifies the degree to which two variables are related. Correlation does not find functional relation. We simply compute a correlation coefficient that tells us how much one variable tends to change when the other one does.  With correlation we don't have to think about cause and effect. We simply quantify how well two variables relate to each other. With regression, we do have to think about cause and effect as the regression line is determined as the best way to predict Y from X.  With correlation, it doesn't matter which of the two variables we call "X" and which you call "Y". We get the same correlation coefficient if you swap the two. With linear regression, the decision of which variable you call "X" and which you call "Y" matters a lot, as you'll get a different best- fit line if we swap the two. The line that best predicts Y from X is not the same as the line that predicts X from Y. 11/23/2015 Shamsuddin Shahid, FKA, UTM You created this PDF from an application that is not licensed to print to novaPDF printer (http://www.novapdf.com)
  • 10. Linear and Non-linear Regression  In Linear Regression, the model function is a linear combination of parameters. Such as y = mx + c, i.e the mode can be represent a straight line.  In Non-linear Regression, the parameters appears as a non-linear combination of parameter. Such y = x3 + 5e-3 11/23/2015 Shamsuddin Shahid, FKA, UTM You created this PDF from an application that is not licensed to print to novaPDF printer (http://www.novapdf.com)
  • 11. Construction of Regression Models  Selection of independent variables  Functional form of regression relation  Scope of model – Least square and correlation based 11/23/2015 Shamsuddin Shahid, FKA, UTM You created this PDF from an application that is not licensed to print to novaPDF printer (http://www.novapdf.com)
  • 12. Linear Regression – General Principle A linear relationship between two variables x and y can be expressed by the equation, y = mx + c Where, y is the dependent variable x is independent variable m and c are constants In the general linear equation,  The value of m is called the slope. The slope determines how much the y variable will change when x is increased or decreased by one point  The value of c in the general equation is called the Y-intercept. It determines the value of y when x=0 11/23/2015 Shamsuddin Shahid, FKA, UTM You created this PDF from an application that is not licensed to print to novaPDF printer (http://www.novapdf.com)
  • 13. Least Squares Regression Principle Shamsuddin Shahid, FKA, UTM You created this PDF from an application that is not licensed to print to novaPDF printer (http://www.novapdf.com)
  • 14. The Least Squares Solution  For each value of x in the data, this equation will determine the point on the line that gives the best prediction of y  The problem is to find the specific values for m and c that will make this line the best fitting. Least squares estimate of m Where: SP is the sum of products SSx is the sum of squares for the X scores and m = SP SSx 11/23/2015 Shamsuddin Shahid, FKA, UTM You created this PDF from an application that is not licensed to print to novaPDF printer (http://www.novapdf.com)
  • 15. Example of Regression Analysis 11/23/2015 Shamsuddin Shahid, FKA, UTM You created this PDF from an application that is not licensed to print to novaPDF printer (http://www.novapdf.com)
  • 16. Standard Error of Estimate  A regression equation, by itself, allows you to make predictions, but it does not provide any information about the accuracy of the predictions  The standard error of estimate gives a measure of the standard distance between a regression line and the actual data points 11/23/2015 Shamsuddin Shahid, FKA, UTM You created this PDF from an application that is not licensed to print to novaPDF printer (http://www.novapdf.com)
  • 17. Error Estimation Formula  To calculate the standard error of estimate Find a sum of squared deviations (SS)  This sum of squares is commonly called SSerror SSerror = Σ(Y-Ŷ)2  The obtained SS value is then divided by its degrees of freedom to obtain a measure of variance. The df for standard error of estimate are df = n – 2  The standard error of estimate provides a measure of how accurately the regression equation predicts the y value, Standard Error = 11/23/2015 Shamsuddin Shahid, FKA, UTM You created this PDF from an application that is not licensed to print to novaPDF printer (http://www.novapdf.com)
  • 18. Error Estimation Example 11/23/2015 Shamsuddin Shahid, FKA, UTM You created this PDF from an application that is not licensed to print to novaPDF printer (http://www.novapdf.com)
  • 19. • The relationship between the variables is linear. • Both variables must be at least interval scale. • The least squares criterion is used to determine the equation. Assumptions 11/23/2015 Shamsuddin Shahid, FKA, UTM You created this PDF from an application that is not licensed to print to novaPDF printer (http://www.novapdf.com)
  • 20. Example It is anticipated that climate change will make the sea more rough than ever before. It may impact on erosion in Seashore line. Data are collected about average wave height (in meter) during cyclone and Erosion in seashore (cm/cyclone event). Try to find out a relation for future prediction of Seashore erosion due to more rough sea. 11/23/2015 Shamsuddin Shahid, FKA, UTM You created this PDF from an application that is not licensed to print to novaPDF printer (http://www.novapdf.com)
  • 21. Example: Solution 10.0 15.0 20.0 25.0 30.0 35.0 1.5 2.0 2.5 3.0 3.5 Y = mX + c 11/23/2015 Shamsuddin Shahid, FKA, UTM You created this PDF from an application that is not licensed to print to novaPDF printer (http://www.novapdf.com)
  • 22. Example: Solution Y = mX + c Calculate m and Calculate c m = 9.585 c = -1.00 Y = 9.585X – 1.00 Erosion =9.585 x Height – 1.00 11/23/2015 Shamsuddin Shahid, FKA, UTM You created this PDF from an application that is not licensed to print to novaPDF printer (http://www.novapdf.com)
  • 23. Example: Solution Erosion =9.585 x Height – 1.00 Error = 4.7778 cm 11/23/2015 Shamsuddin Shahid, FKA, UTM You created this PDF from an application that is not licensed to print to novaPDF printer (http://www.novapdf.com)
  • 24. Example: Solution Erosion =9.585 x Height – 1.00 With Error = 4.7778 cm If Height is 4.0 m Erosion = 9.585 x Height – 1.00 = 39.36 cm =34.14 to 44.59 cm 11/23/2015 Shamsuddin Shahid, FKA, UTM You created this PDF from an application that is not licensed to print to novaPDF printer (http://www.novapdf.com)
  • 25. Regression Analysis – Least Squares Principle  The least squares principle is used to obtain a and b.  The equations to determine a and b are: b n XY X Y n X X a Y n b X n      ( ) ( )( ) ( ) ( )        2 2 11/23/2015 Shamsuddin Shahid, FKA, UTM You created this PDF from an application that is not licensed to print to novaPDF printer (http://www.novapdf.com)
  • 26. Correlation Based Method: Computing the Slope Y = mX + c Calculate Slope m; Calculate Intercept c 11/23/2015 Shamsuddin Shahid, FKA, UTM You created this PDF from an application that is not licensed to print to novaPDF printer (http://www.novapdf.com)
  • 27. Computing the Y-Intercept 11/23/2015 Shamsuddin Shahid, FKA, UTM You created this PDF from an application that is not licensed to print to novaPDF printer (http://www.novapdf.com)
  • 28. Illustration of the Least Squares Regression Principle Shamsuddin Shahid, FKA, UTM You created this PDF from an application that is not licensed to print to novaPDF printer (http://www.novapdf.com)
  • 29. It is anticipated that climate change will make the sea more rough than ever before. It may impact on erosion in Seashore line. Data are collected about average wave height (in meter) and Erosion in seashore (cm/year). Try to find out a relation for future prediction of Seashore erosion due to more rough sea. Regression Equation - Example 11/23/2015 Shamsuddin Shahid, FKA, UTM You created this PDF from an application that is not licensed to print to novaPDF printer (http://www.novapdf.com)
  • 30. Regression Equation - Example Correlation Coefficient, r = 0.99257 Sx = 0.5243 Sy = 5.0652 m = r (Sy/Sx) = 0.99257 x (5.0652/0.5243) = 9.589 c = -1.01 Y = 9.589X - 1.01 Erosion = 9.589 x Height - 1.01 It was by least square method: Erosion =9.585 x Height – 1.00 Shamsuddin Shahid, FKA, UTM You created this PDF from an application that is not licensed to print to novaPDF printer (http://www.novapdf.com)
  • 31. Assumptions in Linear Regression Model For each value of X, there is a group of Y values, and these  Y values are normally distributed. The means of these normal distributions of Y values all lie on the straight line of regression.  The standard deviations of these normal distributions are equal.  The Y values are statistically independent. This means that in the selection of a sample, the Y values chosen for a particular X value do not depend on the Y values for any other X values. 11/23/2015 Shamsuddin Shahid, FKA, UTM You created this PDF from an application that is not licensed to print to novaPDF printer (http://www.novapdf.com)
  • 32. Confidence Interval Estimates of Y A confidence interval reports the mean value of Y for a given X. 11/23/2015 Shamsuddin Shahid, FKA, UTM You created this PDF from an application that is not licensed to print to novaPDF printer (http://www.novapdf.com)
  • 33. Confidence Interval Estimates of Y Erosion = 9.585 x Height – 1.00 If Height is 4.0 m Erosion = 9.585 x 4.0 – 1.00 = 39.36 cm 11/23/2015 Shamsuddin Shahid, FKA, UTM You created this PDF from an application that is not licensed to print to novaPDF printer (http://www.novapdf.com)
  • 34. Confidence Interval Estimates of Y Erosion = 9.585 x Height – 1.00 If Height is 2.5 m Erosion = 9.585 x Height – 1.00 = 23.0 cm Degree of Freedom, df = n-2 = 11-2 = 9 t(0.05; 9) = 2.262 Serr = 4.7778 Y(predicted) = 23.0 Confidence Interval = 23.0 ± 3.32 11/23/2015 Shamsuddin Shahid, FKA, UTM You created this PDF from an application that is not licensed to print to novaPDF printer (http://www.novapdf.com)
  • 35. Confidence Interval Estimates of Y 11/23/2015 Shamsuddin Shahid, FKA, UTM You created this PDF from an application that is not licensed to print to novaPDF printer (http://www.novapdf.com)
  • 36. Confidence Interval of Y 11/23/2015 Shamsuddin Shahid, FKA, UTM You created this PDF from an application that is not licensed to print to novaPDF printer (http://www.novapdf.com)
  • 37. Prediction Interval Estimates of Y A prediction interval reports the range of values of Y for a particular value of X. 11/23/2015 Shamsuddin Shahid, FKA, UTM You created this PDF from an application that is not licensed to print to novaPDF printer (http://www.novapdf.com)
  • 38. Prediction Interval Estimates of Y Erosion = 9.585 x Height – 1.00 If Height is 4.0 m Erosion = 9.585 x Height – 1.00 = 39.365 cm Degree of Freedom, df = n-2 = 11-2 = 9 t(0.05; 11) = 2.262 Serr = 4.7778 Y(predicted) at 4.0 m height = 22.26 Prediction Interval = 39.365 ± 15.37 11/23/2015 Shamsuddin Shahid, FKA, UTM You created this PDF from an application that is not licensed to print to novaPDF printer (http://www.novapdf.com)
  • 39. Confidence Interval and Confidence Interval of Y 11/23/2015 Shamsuddin Shahid, FKA, UTM You created this PDF from an application that is not licensed to print to novaPDF printer (http://www.novapdf.com)
  • 40. Transforming Data  The coefficient of correlation describes the strength of the linear relationship between two variables. It could be that two variables are closely related, but there relationship may not be linear.  Be cautious when you are interpreting the coefficient of correlation. A value of r may indicate there is no linear relationship, but it could be there is a relationship of some other nonlinear or curvilinear form. 11/23/2015 Shamsuddin Shahid, FKA, UTM You created this PDF from an application that is not licensed to print to novaPDF printer (http://www.novapdf.com)
  • 41. Non-linear Data  The correlation between the Rainfall and River Dischare is 0.782. This is a fairly strong inverse relationship.  However, when we plot the data on a scatter diagram the relationship does not appear to be linear; it does not seem to follow a straight line. 11/23/2015 Shamsuddin Shahid, FKA, UTM You created this PDF from an application that is not licensed to print to novaPDF printer (http://www.novapdf.com)
  • 42. Transforming Data  What can we do to explore other (nonlinear) relationships?  One possibility is to transform one of the variables. For example, instead of using Y as the dependent variable, we might use its log, reciprocal, square, or square root.  Another possibility is to transform both of the variable in the same way.  There are many other transformations, but log, reciprocal, square, or square root are the most common. 11/23/2015 Shamsuddin Shahid, FKA, UTM You created this PDF from an application that is not licensed to print to novaPDF printer (http://www.novapdf.com)
  • 43. Transforming Data 11/23/2015 Shamsuddin Shahid, FKA, UTM You created this PDF from an application that is not licensed to print to novaPDF printer (http://www.novapdf.com)
  • 44. After log transformation of River Discharge Data we got the regression equation as: Transforming Data 11/23/2015 Shamsuddin Shahid, FKA, UTM You created this PDF from an application that is not licensed to print to novaPDF printer (http://www.novapdf.com)
  • 45. • The value 6.4372 is the log to the base 10 of winnings. • The antilog of 6.4372 is 2.736 • Therefore, when rainfall is 70mm, discharge is 2.736 cumec. Transforming Data Prediction of River Discharge from Rainfall. What is discharge when rainfall is 70 mm? 11/23/2015 Shamsuddin Shahid, FKA, UTM You created this PDF from an application that is not licensed to print to novaPDF printer (http://www.novapdf.com)
  • 46. Interpretation of Regression Equation Y = mX + c What does m mean? What does c mean? Let we got a regression equation: Y = 10.2 X + 21.9 How will you interpret it? 11/23/2015 Shamsuddin Shahid, FKA, UTM You created this PDF from an application that is not licensed to print to novaPDF printer (http://www.novapdf.com)
  • 47. How will you interpret the following regression equation: Y = 10.2 X + 21.9 Y = 10.2 X – 21.9 Y = 21.9 – 10.2 X Interpretation of Regression Equation 11/23/2015 Shamsuddin Shahid, FKA, UTM You created this PDF from an application that is not licensed to print to novaPDF printer (http://www.novapdf.com)