Download as PDF, PPTX


![Exercise
Suppose you have a dataset with 10 observations and two variables, X
(independent variable) and Y (dependent variable). You have built a linear
regression model and obtained the following predictions (Ŷ ) and actual
values (Y):
Y=[10,15,20,25,30,35,40,45,50,55] Ŷ =[12,18,22,28,33,37,41,47,51,56]
Compute the following regression evaluation metrics:
1 MAE
2 MSE
3 RMSE
4 R2
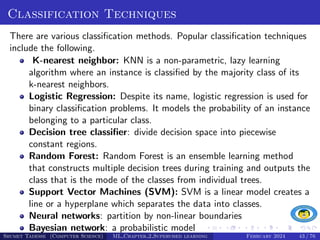
What is the primary characteristic of MAE?
A Emphasizes larger errors
B Sensitive to outliers
C Uses squared differences
D Provides a percentage measure
Shumet Tadesse (Computer Science) ML Chapter 2 Supervised learning February 2024 38 / 76](https://image.slidesharecdn.com/mlchapter2-240411082800-504a927a/85/Course-Title-Introduction-to-Machine-Learning-Chapter-2-Supervised-Learning-38-320.jpg)


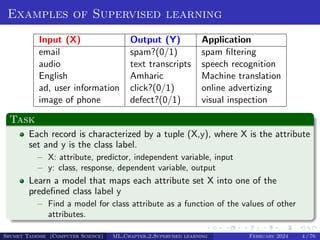
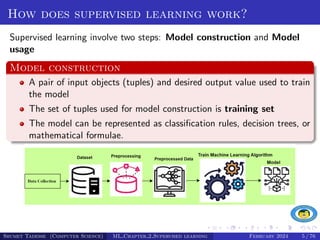
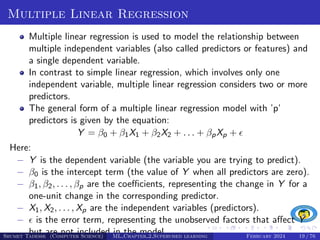
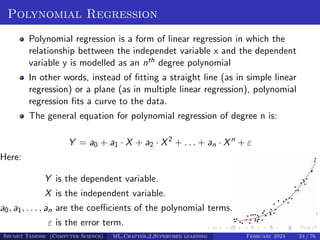
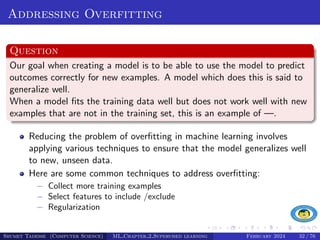
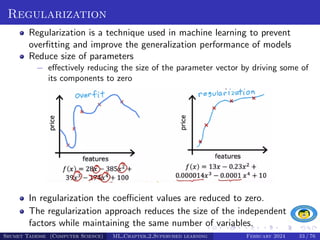
This document provides an overview of supervised learning in machine learning, explaining its definition, goals, and the distinction between labeled and unlabeled data. It covers methods such as regression (both linear and multiple), classification, and introduces concepts of model construction and overfitting. Various examples and exercises are included to illustrate the practical application of these concepts in predicting outcomes based on input data.