Download to read offline

![Håkan Nordlander [email_address] Reference group of stakeholders](https://image.slidesharecdn.com/session70bolind-111102055859-phpapp02/85/Session-70-Bo-Lind-3-320.jpg)


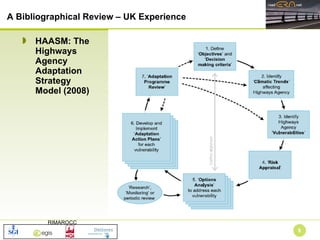
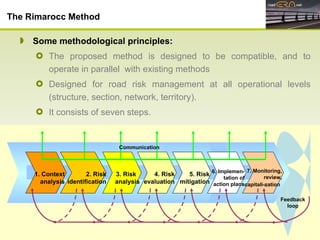
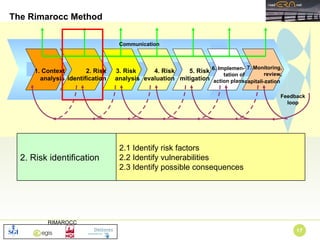
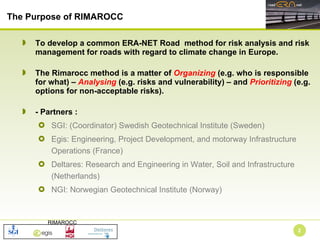
![The climate events are weighted according to their importance for the road sector and the amount of change is marked by a relative scale from significant increase, ++, to significant decrease --. (2.1) Climate Scenarios and Climate Change Impacts Regional models + local expertise No statistical evidence of trends, but , but likely to be happening today 50 km (difficult tu use smaller grids) Resolution of 25 km – 12 km will soon be available Likely Qualitative Intensity: likely (+) Frequency: North likely South ? Max. intensity in [mm/h] and [mm/24h] Extreme rainfall events (heavy showers and long rain periods) 4 Available data / models Time Horizon (when will it happen ?) Geographical resolution (grid size / resolution for which it can be used) Certainty of predictions: likely, very likely, (virtually) certain Availability of predictions: qualitative, quantitative or impossible Amount of change compared to 1961-1990 period (++, +, +/-, -, --) Critical climate parameter Unwanted climate event Weight](https://image.slidesharecdn.com/session70bolind-111102055859-phpapp02/85/Session-70-Bo-Lind-19-320.jpg)
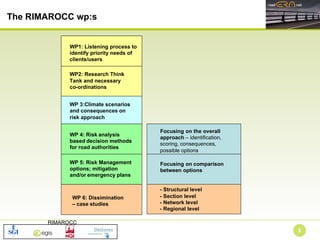
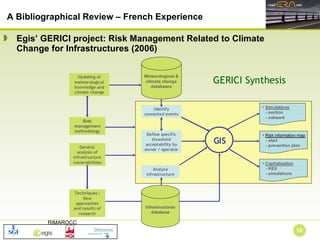
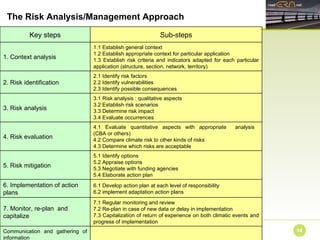
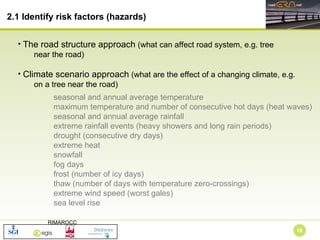
![[h1] New Column: point zero. Dimensioning events that has uccurred. Yves has presented material before?? [h2] Point Zero in table below Global IPCC models Already observed (figures available) Main signal perceptible for 250 km grid, but can be refined locally, except specific case of cities (higher T°C) and coastal areas (lower T°C) V. Certain in Europe V. Certain Very likely Quantitative Quantitative Quantitative ++ XXI Cent.: Taver. Global: 1,8 to 4,0 °C (best estim. /scen.). South + Continent. > Nor. ++ Even more for estremes ++ 5 to 30 days Average max. [T°C on 24h] Maximum [T°C] Heat wave duration [number of consecutive days], [hw/year] Maximum temperature and number of consecutive hot days (heat waves) 3 IPCC scenarios ( post-IPCC scenarios) Already observed (ice cap melting not within a century) Global but not uniform (may vary according to sea basins) > 0.2m is virtually certain in 2100 Quantitative Qualitative if considering ice cap melting ++ XXI Cent.: (0,2 to 0,6m) No ice cap melting (IPCC assumption) Rise [m] Sea level rise (+ waves and storm surges) 4 L VL South - --* South VL L North ++ +/- North Global IPCC models Already observed. Main signal perceptible for 250 km grid, but can be refined locally Wint. Sum. Quantitative Wint. Sum. Average amount [mm/ 3 months] Annual, seasonal and periods ( ”wet spells”) average rainfall 4 Available data [h1] [h2] / models Time Horizon (when will it happen ?) Geographical resolution (grid size / resolution for which it can be used) Certainty of predictions: likely, very likely, (virtually) certain Availability of predictions: qualitative, quantitative or impossible Amount of change compared to 1961-1990 period (++, +, +/-, -, --) Critical climate parameter Unwanted climate event Weight](https://image.slidesharecdn.com/session70bolind-111102055859-phpapp02/85/Session-70-Bo-Lind-20-320.jpg)
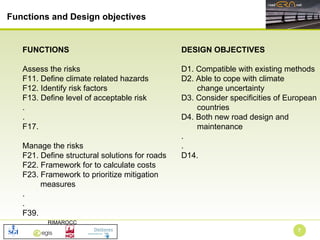
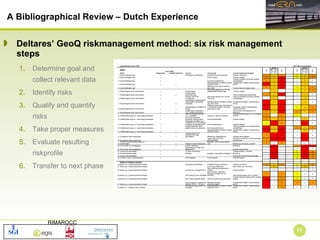
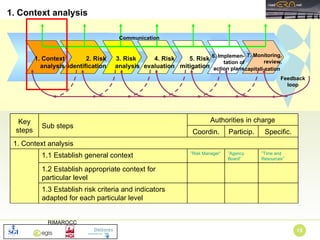
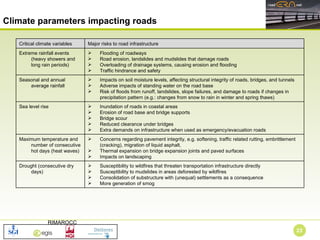
![Has begun + North. and Cont. Eur. - South. Certain in North. Eur. Qualitative + or – depending on the regions Thaw days [number of days with 0°C crossings] Thaw and frost (number of days with temperature zero-crossings) 2 Has begun Ditto Ditto Whole Eur. Whole Eur. Whole Eur. Likely Certain Certain Quantitative Quantitative Quantitative + ++ -- Minimum [T°C] Average [min. T°C on 24h] Frost duration [number of days/year] Frost index [frost penetration into the soil] Frost (number of icy days, Tmax< 0°C and frost days, T drops below 0°C ) 2 Has begun Extr. North Eur Whole Eur Likely Certain Qualitative Quantitative Int: + Freq: - Duration: -- Max. snowfall in 24h [m/day] Snow duration at the ground [nb of days] Snowfall 2 Has begun South. Eur and Med. More uncertain in N Eur. Very Likely Quantitative ++ over South. Eur. Drought duration [number of consecutive days], [d/year] Drought (consecutive dry days) 2 Available data / models Time Horizon (when will it happen ?) Geographical resolution (grid size / resolution for which it can be used) Certainty of predictions: likely, very likely, (virtually) certain Availability of predictions: qualitative, quantitative or impossible Amount of change compared to 1961-1990 period (++, +, +/-, -, --) Critical climate parameter Unwanted climate event Weight](https://image.slidesharecdn.com/session70bolind-111102055859-phpapp02/85/Session-70-Bo-Lind-21-320.jpg)
![Climate Scenarios and Climate Change Impacts Available data / models Time Horizon (when will it happen ?) Geographical resolution (grid size / resolution for which it can be used) Certainty of predictions: likely, very likely, (virtually) certain Availability of predictions: qualitative, quantitative or impossible Amount of change compared to 1961-1990 period (++, +, +/-, -, --) Critical climate parameter Unwanted climate event Weight Observed locally (less pollution) Unknown Not yet possible (local effects – vertical resolution) ? Fog days [number of days with fog] Fog days 1 Global IPCC models Not yet recorded (Vince storm not representative) 500-1000 km grid (North shift of the storm tracks) Likely in North Poor (unknown) in South. Qualitative + in North-O Europe ? elsewhere Max. speed [km/h] Extreme wind speed (worst gales) : extra tropical or convective systems induced 2](https://image.slidesharecdn.com/session70bolind-111102055859-phpapp02/85/Session-70-Bo-Lind-22-320.jpg)
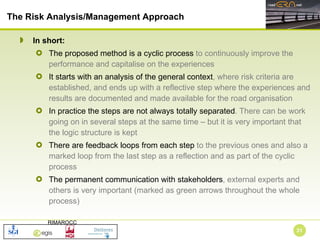

The document summarizes the RIMAROCC project, which aims to develop a common risk analysis and management method for roads in Europe with regard to climate change. It describes the context, objectives, work packages and steps of the proposed RIMAROCC method, which involves identifying risks and vulnerabilities, analyzing risks, evaluating risks, mitigating risks, and monitoring outcomes. Key steps include establishing the context, identifying risks and vulnerabilities, analyzing risks, evaluating risks both qualitatively and quantitatively, mitigating risks through options appraisal and action planning, and monitoring results.


