SlideShare a Scribd company logo
1 of 43
1
Geologic Controls on Liquefaction Processes at the Bottineau
Quicksand Site
Brody B. Awalt
Dept. of Geosciences
Minot State University
Spring 2014
ABSTRACT
This study investigated the relationship between the geologic setting and the
development of “quicksand” near Bottineau ND. The site is located south of Highway 5,
3.8 km east of Bottineau and 2 km south of the Turtle Mountains. “Quicksand” is any
saturated, unconsolidated material that exhibits liquefaction when under stress. A manual
auger was used to sample subsurface materials. Core locations were laid out along a N-S
transect across the site to create a cross-sectional diagram. Sediment samples were
obtained for laboratory analysis, and two stratigraphic units were identified during
coring. Four wells were installed in two well nests to document site hydrology. Three
wells were installed within the lower unit and one was installed in the upper unit. The
lower-most unit, is a massive, unoxidized, firm, over-compacted diamicton (with
compressive strength from 2.25 to 4.5 kg/cm2), with oxidized joints and thin
discontinuous sand and silt layers. The joints represent fractures generated by soft
sediment deformation during deposition of the unit. The surface unit at the site consists of
an oxidized-to-reduced stratified unit with lower compressive strength (0.2-2.0 kg/cm2).
The lower unit is a basal lodgement till assigned to the Coleharbor Formation. The silt
layer near the base of the upper unit may represent deposition in a pond or Glacial Lake
Souris. The upper unit is a melt-out supra-glacial till or colluvial unit, also assigned to the
Coleharbor Formation. Based on hydrologic evidence, it appears that the lower unit is
acting as an aquilude generating a perched water table at the base of the upper unit. As
water moves through the subsurface it encounters an uplifted wall of the lower unit
impeding lateral flow, forcing the water to the surface generating “quicksand.” Further
research needs to be done to confirm this.
2
INTRODUCTION
This project examined the sedimentology and stratigraphy of an area identified as
quicksand near Bottineau, North Dakota (Figure 1), in order to identify processes that
created this unusual landscape. The study area, referred to informally as the Bottineau
Quicksand Site in this report, is located just south of the Turtle Mountains in Bottineau
County (Figure 2). Locals have known and been curious about what led to the formation
of quicksand in the area for a long time. There is a local story about a horse getting stuck
in the quicksand and needing to be pulled out by a truck (pers. comm., McKay, Sep.
2013). This project examined whether the liquefaction is the result of local geology.
Background
Regional Geology
The Bottineau Quicksand Site lies approximately 3.8 km east of Bottineau on the
south side of ND highway 5 (Figure 2). Bottineau County, located in north-central North
Dakota, is underlain by the Pleistocene Coleharbor Group. This unit varies in thickness,
from approximately 61 to 76 m thick in the west, 15 m to 30 m thick in the central area of
the county, and 61 to 91 m thick over the Turtle Mountains (Bluemle 1985).
Most of Bottineau County is composed of glaciated plains, with relatively flat,
rolling hill topography (Bluemle 1985). Glacial Lake Souris occupied the central part of
Bottineau County, and this region is overlain by thin lake or lake-shore sediments and
wave-planed glacial sediment (Bluemle 1985). In some portions of the county these
sediments have been reworked by wind into dunes and sand sheets (Bluemle 1985).
3
Primarily low-relief collapsed glacial topography is displayed in western Bottineau
County. The Turtle Mountains in the northeastern part of the county are composed of
high-relief collapsed glacial and ice-thrust topography (Bluemle 1985).The generalized
surficial geology of Bottineau and Rolette Counties is shown in Figure 4. According to
Bluemle (1985), “the glacial-drift deposits include materials such as sand and gravel, as
well as relatively impermeable silt, glacial till, and lacustrine clay.”
Regional Hydrology
After precipitation drops on the Earth's surface, part is evaporated to the
atmosphere, some moves off into streams, and the rest moves into the ground. Surplus
water within the soil eventually infiltrates downward below the ground water table into
the saturated zone. “Ground water moves under the effect of gravity and pressure from
areas of recharge to areas of discharge” (Randich and Kuznair 1984). The speed of
ground-water within a material is controlled by the hydraulic conductivity of the material
and by the hydraulic gradient. Gravel, well-sorted sand, and fractured rocks can have
high hydraulic conductivity, and if saturated can be aquifers (Randich and Kuznair 1984).
“Cemented deposits and fine-grained materials such as silt, clay, and shale usually have a
low hydraulic conductivity and restrict ground-water movement” (Randich and Kuznair
1984).
The water level in an aquifer can fluctuate in reaction to fluctuations in the rate of
recharge to the aquifer and discharge from the aquifer. These fluctuations can represent a
change in the total volume of water stowed in the aquifer (Randich and Kuznair 1984).
“However, in confined aquifers, changes in atmospheric pressure or surface load also
cause water-level fluctuations” (Randich and Kuznair 1984). In the study area, aquifers
4
present at land surface are recharged during spring, summer, and early fall by
precipitation moving downward towards the ground water table (Randich and Kuznair
1984).
“Liquefaction is the process by which saturated, unconsolidated sediments are
transformed into a substance that acts like a liquid” (GEO 2014). If a soil is saturated, a
state that often occurs if the soil is within the water table, then water resides in gaps
between soil grains (pore spaces). In an increase of pressure, the water will flow toward
zones of lower pressure (usually upward, toward the surface). The UWCE (2014) Web
site says that if pressure is quickly applied and is great enough, or quickly repetitive as
with earthquake shaking, pressure will build enough that contact forces keeping grains in
contact no longer can hold the grains together. They then move away from each other.
Sediment then will behave as a liquid. Wherever quicksand processes take place, mounds
of sediment are also found. The mounds of sediment are where most of the quicksand is
located.
The study area is well known for its natural springs and flowing artesian wells. “A
flowing artesian well occurs when the natural pressure of an aquifer is great enough to
cause water to rise to the surface” (USGSWSS 2014). The purpose of this study was to
find out what geological features in this area play a role in development of quicksand.
METHODS
Field Methods
Sampling was done in a line from NE to SW (Figure 5) using an auger-type hand
coring unit (Figure 6). Three holes were sampled, one (B5) at the SW edge of the study
area, another (B1) approximately half way between B5 and B4, and the third (B4) at the
5
northeastern-most part of the study area (Figure 5). Holes B5 and B1 were cored to 3.65
m and B4 was only cored to 2.74 m because of the high water table in that area. Core
samples were obtained at 10-cm intervals. After each 10-cm interval, the sample was
removed from the auger and placed into a Ziploc bag. Bags were labeled with their
corresponding core names and depths of extraction. Samples were taken back to the
Minot State University geology lab to be described and analyzed.
Two sets of nested wells were installed (Figure 7). Wells were designated B1, B2,
B3, and B4. B1 and B4 were installed in the holes left from the coring process. Core
sampling and well installation occurred on different days. Well depths were B1-3.6 m,
B2-2.7 m, B3-1.5 m, B4-2.7 m. Wells at B1 and B2 were nested together at varying
depths and B3 was nested with B4 in order to obtain hydraulic gradients. Well B1 was
placed at 3.6 m, the coring unit’s maximum depth. Wells consisted of 3.81 cm (1.5 in)
inner diameter PVC pipe with a sealed bottom and perforations in the lower 25 cm
(Figure 8). Perforations were installed with a cordless drill. Wells were placed in after
cores had been extracted. Thirty centimeters of sand were poured into each hole in order
to cover the lower 25 cm and perforations. Clay (kitty litter) next was added to each hole
in order to create a seal against any surface water percolating downward. Fill dirt finally
was dropped in around the PVC to fill up the rest of the hole to the surface level.
Due to freezing temperatures, water level readings were taken only when
possible. Data from those readings were entered in an Excel spreadsheet and
subsequently plotted (Figure 9).
Laboratory Methods
6
Detailed descriptions of soil morphology and parent material were completed for
each core. Soil descriptions were done in the field. They were typed up in the office and
stratigraphic boundaries observed in the field were modified based on laboratory results.
Density readings were obtained from a pocket penetrometer to provide a measure of
compressive strength. Readings were taken by slowly inserting the small piston into the
soil sample until the calibration mark was level with the soil (Figure 10). As the piston
was inserted into the sample the handle pushed the white ring on the scale and a reading
was obtained from the lower side of the ring closest to the tip of the instrument. Soil
compaction was read in kg/cm2 using the low side of the ring. Stratigraphic sections were
prepared from morphologic description and particle-size data.
Methods used for particle size analysis were developed by Bouyoucos (1927,
1951, and 1961).
Gravel Separation
Approximately 60 g of sample were submersed in water for 24 hours in a 250 ml
or 500 ml beaker. After 24 hours samples were set on a magnetic stir plate for five
minutes. Then the samples were poured through a 2 mm sieve to remove any gravel-sized
particles. Both greater than 2 mm and less than 2 mm fractions were dried, weighed, and
their weights were recorded. Only the less than 2 mm fraction was used for hydrometer
analysis.
Hydrometer Analysis
The less than 2 mm size fraction was captured in a 500 mL beaker. After beakers
had been filled with sample, 100 ml of 50 g/L sodium hexametaphosphate solution was
added to each. The mixture in each beaker was stirred with a spoon until all particles
7
were suspended. Particles that remained on the spoon were rinsed back into the beaker
with distilled water, and any particles that adhered to the sides of the beakers were rinsed
back into the suspension. The beakers were covered with watch glasses. Samples were
soaked overnight to allow the sodium hexametaphosphate solution to fully deflocculate
any clay particles.
Each sample was then washed into a stainless steel mixing cup with distilled
water and mixed for five minutes with a commercial drink mixing machine (Hamilton
Beach model number SA-10). Samples were washed with distilled water from the mixing
cup into a hydrometer jar. Hydrometer jars were filled with distilled water to the 1000 ml
mark and placed into a hydrometer bath at a constant temperature of 20 °C. A hydrometer
jar containing 100 ml of 50g/L sodium hexametaphosphate solution was filled with
distilled water to the 1000 ml mark, placed into the hydrometer bath and as a control to
subtract out the mass of added sodium hexametaphosphate in the samples. Once control
sample temperature was verified to be 20 °C, density was recorded using a bouycous
hydrometer.
A rubber stopper was placed into the opening of the hydrometer jar, and the jar
was rapidly and repeatedly rotated 180 degrees for one minute in order to ensure that all
particles were suspended. The jar was then placed back into the bath, a timer was started,
and the rubber stopper was removed. At a time of six hours and 52 minutes, a hydrometer
reading was taken. This reading was taken after all sand and silt-sized particles had
settled out of suspension, leaving only the clay-sized particles in suspension. This reading
was used to determine the clay-sized fraction of the sample.
8
Sand and Silt Percent by Weight
The contents of each hydrometer jar were poured through a number 230 sieve to
collect the sand-sized particles. These particles were washed from the sieve into a clean
beaker. Each beaker was cleaned, dried, and weighed. The beakers were placed into a
drying oven at 80 °C until contents were dry. The beakers containing the dry sand were
then weighed. This weight minus the weight of the clean, dry beaker was used as the
method of determining the sand-sized fraction of each sample. The silt-sized fraction of
the sample was determined by subtracting the sand percent by weight from the six hour
and 52 minute reading.
The dry sand from each sample was poured into a stack of sieves that separated
the sand into 0.5 phi intervals from -1.00 phi to 4.00 phi. This stack of sieves was placed
into a Ro-Tap sieve shaker and run for approximately 12 minutes. The material from each
sieve was removed, weighed, and the weight recorded (Table 8 and 9). The separate size
fractions were combined in Ziploc bags and cataloged for possible future study, but were
not analyzed as part of this study.
Moisture Correction Factor
For each sample a ceramic crucible was weighed. Approximately 10 grams of
each sample was split off using a sample splitter and poured into a crucible. The weight
of the crucible plus that of the sample was recorded. Samples were placed into a drying
oven at 105 °C for 24 hours in order to evaporate any hygroscopic water. Samples were
removed from the oven and placed into a desiccator and allowed to cool. Once cool, each
crucible was weighed again. The moisture correction factor (MCF) was calculated by the
following formula:
9
MCF = 1- Weight of air dry soil – weight of oven dry soil
Weight of oven dry soil
The MCF was multiplied by the initial 60.00 g of material to determine the corrected total
initial sample weight for each sample. This was the weight used in all calculations
involving the total sample.
RESULTS
Site Hydrology
Results of the well readings are shown in Figure 9. Due to the high water table
and the cold winter, water level data was not obtained from January through April 2014
because of the wells being frozen.
Penetrometer Readings
Results of penetrometer readings are presented in Table 1. Measurements are in
kg/cm².
Gravel Separation
Results of the gravel separation are presented in Tables 2 and 3. Although
particles with a diameter greater than 2 mm had been removed for particle size analysis,
their mass was recorded in order to determine the sample fraction of this size as a means
to potentially aid in differentiating stratigraphic units at the site.
Moisture Correction Factor
Results for the MCF are presented in Tables 4 and 5. Obtaining the MCF and
subsequently the corrected mass of the sample prevented skewed results in further
analyses. The mass of the hygroscopic water that was tightly held by polar clay particles
was determined by the difference between mass of the oven-dried sample and that of the
10
air-dried sample, which was found by dividing the mass of the air-dried sample by the
mass of the oven-dried sample.
Particle Size Analysis
Percentages of sand, silt, and clay are indicated in Tables 6 and 7. The percent
sand of each sample was determined by comparing the weight percentage of the corrected
total sample weight, and it is shown in Tables 8 and 9. The clay weight was obtained by
the 6 hr and 52 min hydrometer reading and the silt weight was obtained by subtracting
the clay and sand weight from the corrected sample weight. Sand weights for each 0.5 phi
size interval are shown in Tables 10 and 11.
Stratigraphic Units
The Bottineau quicksand site was split into two distinct stratigraphic units based
upon physical descriptions of the sediments and particle size analysis.
Stratigraphic Unit One
Strat unit one contained the material from 120 cm to the base of the core in B1. In
core B4 Strat unit I contained the material from 160 cm to the base of the core. The
material was bluish to greenish-gray and showed silt to medium sand lamina. It contained
medium to fine cobbles and very obvious fractures that were observable in the auger
samples.
Stratigraphic Unit Two
Strat unit two (surface to 120 cm depth) ranged in thickness from 120 cm in B1 to
100 cm thick in B4. The sediment was predominately gray to grayish brown, showed
mottles within the samples, and was stratified. It contained pebbles ranging from fine to 5
11
cm in diameter. This unit contained a relatively small amount of silt and relatively large
percentage of sands and clays (Figures 11 and 12).
DISCUSSION
During field sampling two stratigraphic layers were observed, and this was
confirmed by further analysis. The lower-most unit, Strat Unit I, was massive, over-
compacted, and very dense. It had obvious joints or fractures and discontinuous sand
lenses. Strat Unit II was stratified and less dense. It lacked the joints that were present in
Strat Unit I. Strat Unit I was interpreted to be a lodgement till deposited beneath a glacier.
Strat Unit II was interpreted to be a supra-glacial melt out till, sediment on the surface of
the glacier that collapsed as the ice melted (Figure 13). There also may be younger slope
wash material within Strat Unit II.
Figure 14 represents the stratigraphy of the site based on field observations. Strat
Unit I is over lain by Strat Unit II, a supra-glacial till. Both wells B1 and B2 extended
into Strat Unit I, while well B4 extended only into the upper part of Strat Unit I. Well B3
extended only into Strat Unit II.
Figure 15 represents distribution of glacial ice over Bottineau County 12,500
years ago. This is when Strat Unit I apparently was deposited beneath the glacial ice.
Figure 16 represents the distribution of glacial ice over Bottineau County 11,000 years
ago. According to Figure 16, quicksand site must have been located under stagnant ice
where supra-glacial meltout till would have been deposited. This is when Strat Unit II is
believed to have been deposited.
Hydrometer analysis for B1 (Figure 13) suggests that sand and silt stringers did
not have a major impact on that area. According to the hydrometer analysis in sample B4
12
depths 140-160 cm, there was a spike in the percentage of silt (62%). This suggests
possible deposition in a pond or near-shore glacial Lake Souris.
Figure 17 suggests that ground water does follow the topography of the land
surface. Data for this image were obtained from the North Dakota State Water
Commission Web site (NDSWC 2014). Precipitation falling on the Turtle Mountains
infiltrates the soil and travels vertically until it reaches the ground water table and then
begins to travel horizontally toward the studied quicksand site. These factors suggest that
somewhere between the site and the Turtle Mountains, the water moves on top of Strat
Unit I and continues to travel horizontally within Strat Unit II, but remains on top of Strat
Unit I. Strat Unit I may have been fractured and displaced in some areas due to the heavy
glacier causing shearing of Strat Unit I 12,500 years ago. As the water reaches the south
side of the quicksand site, where it is believed that it encounters Strat Unit I and can no
longer travel horizontally, thus being forced upwards towards the surface and creating the
mounds of sediment and quicksand processes observed (Figure 18).
For wells B4 and B3, the vertical hydraulic gradient is 1.2, which indicates a very
large downwards gradient and most likely a perched water table.
CONCLUSION
Although it is not possible to be 100% certain that it is local geologic conditions
generating quicksand at this site, the results do strongly suggest that past basal
deformation processes at the landscape scale have contributed to liquefaction processes at
the site. The horizontal flow off of the Turtle Mountains and the abundance of flowing
artesian wells in the area add to the evidence that water is being forced upward to land
surface.
13
AKNOWLEDGMENTS
I would like to thank Dr. Krieg for helping me with my senior research project.
Mr. McKay, the land owner next to our study site. Dr. Crackel and Dr. Royer for all the
help in senior seminar. Dr. Kilroy for helping with the hydrology side of the study.
14
REFERENCES
Allred J., Barry. 2000. Survey of Fractured Glacial Till Geotechnical Characteristics:
Hydraulic Conductivity, Consolidation, and Shear Strength. Vol 100:1-11p
Bluemle JP. 1985. Geology of Bottineau County, North Dakota. North Dakota
Geological Survey Bulletin 78 Part 1. North Dakota State Water Commission
County Groundwater Studies 35 Part I
Bouyoucos GJ. 1927. The hydrometer method for the Mechanical Analysis of Soils. Soil
Science 26, 233 – 238.
Bouyoucos GJ. 1951. A Recalibration of the Hydrometer Method for Making Mechanical
Analysis of Soils. Agronomy Journal 43, 435 – 438.
Bouyoucos GJ. 1962. Hydrometer Method Improved for Making Particle Size Analyses
of Soils. Agronomy Journal 54, 464 – 465.
Randich PG, Kuznair RL. 1984. Geology of Bottineau County, North Dakota. North
Dakota Geological Survey Bulletin 78. Part III. North Dakota State Water
Commission County Groundwater Studies 35 Part III..
[GEOL] Geology Home Page. http://geology.com/usgs/liquefaction/ [updated 2014]
Accessed 2014 Jan 30.
[GWM] Ground Water Movement
http://www.co.portage.wi.us/groundwater/undrstnd/gwmove.htm Accessed 2014
Jan 30.
[NDSWC] North Dakota State Water Commission
http://www.swc.state.nd.us/4dlink9/4dcgi/GetSubCategoryRecord/Map%20and%
20Data%20Resources/MapServices [updated 2011] Accessed 2014 Jan 30.
[UWCE] University of Washington Civil Engineering Home Page
http://www.ce.washington.edu/~liquefaction/html/what/what1.html [updated
2000] Accessed 2014 Jan 30.
15
[USGS]United States Geologic Survey Water Science School home page.
http://ga.water.usgs.gov/edu/gwartesian.html [updated 2014] Accessed 2014 Jan
30.
Figure 1. Bottineau County indicated by the hash marks. The town of Bottineau
is indicated by the blue square and the city of Minot is indicated by the red dot.
Figure modified from Bluemle (1985).
16
Figure 2. Bottineau is indicated by the maroon dot. The study site is indicated by
the red pin. The Turtle Mountains are the darker shade of green and the
Canadian border is represented by the yellow line. Figure taken from Google
Earth (2014).
17
Figure 3. The red line is an approximate outline of the study area. Modified
image from Google Earth (2014).
18
Figure 4. Generalized surficial geology of Bottineau County. Figure modified from
Bluemle (1985).
19
Figure 5. The top right overlay shows the approximate area where the samples (B4, B2,
and B5) and wells (B1, B2, B3, and B4) were located. Modified image from Google
Earth (2014).
20
Figure 6. Auger coring unit used to extract cores and place wells.
21
Figure 7. Locations of nested wells B1 through B4. Modified image from Google Earth
(2014).
22
Figure 8. Piezometer perforations. Figure taken from
http://www.equipcoservices.com/sales/solinst/601.html
23
Figure 9. Water level readings measured in cm. 0 is ground level. Between 03 November
2014 and 14 December 2014.
-325
-300
-275
-250
-225
-200
-175
-150
-125
-100
-75
-50
-25
0
25
Nov/3/13 Nov/17/13 Nov/31/13 Dec/14/13
WaterLevel(cm)
WellReadings
B1 B2 B3 B4
24
Figure 10. Pocket penetrometer measured in kg/cm². Figure taken from
http://www.amazon.com/E-280-Pocket-Penetrometer/dp/B004NEG5B
25
Figure 11. Chart showing accumulative percentages of sand, silt, and clay as depth
increases, across Strat Units I and II.
26
Figure 12. Chart showing cummulative percentages of silt, sand, and clay as depth
increases, across Strat Units I and II.
27
Figure 13. Diagram showing deposition of lodgement and supra-glacial meltout till.
Figure modified from British Society for Geomorphology (2012).
28
Figure 14. This diagram shows Strat Unit I on the south side of the quicksand site at
a shallower depth then Strat Unit I on the north side of the quicksand site, indicating
relative depth of wells B1, B2, B3, and B4.
29
Figure 15. The extent or maximum of the Wisconsin glacier around 12,000 years ago.
This is when we believe Strat Unit I was deposited. The red dot is an approximate
location of our study site. Figure modified from Bluemle (1985).
30
Figure 16. This image represents a slight retreat in the glacier approximately 11,000
years ago. This time frame is when it is believed Strat Unit II was deposited. The red dot
is an approximate location of the study site. Figure modified from Bluemle (1985).
31
Figure 17. Cross section view of area north of studied quicksand site which is
located at bottom left. Pentiometric surface is indicated by the blue line. Figure
modified from Google Earth (2014).
32
Figure 18. Schematic-section of may occur beneath land surface. Blue triangles
represent average water levels.
33
Compaction Readings
B1-Soil
Compaction
Value
B4-Soil
Compaction
Value
Depth(cm) kg/cm² kg/cm²
0-20 0.20 0.00
20-40 0.23 0.00
40-60 1.25 0.50
60-80 1.75 0.75
80-100 2.00 1.25
100-120 2.00 1.50
120-140 2.25 1.50
140-160 2.50 1.50
160-180 3.00 1.75
180-200 3.00 1.75
200-220 3.25
220-240 3.25
240-260 3.25
260-280 3.75
280-300 3.75
300-320 4.50
320-340 4.50
Table 1. B1 and B4 compaction levels measured in kg/cm².
34
Weight of Gravel-B1
Sample
Corrected
Weight (g)
Gravel
Weight
(g)
0-20 60.27 2.96
20-40 66.80 2.39
40-60 66.99 2.8
60-80 66.79 2.23
80-100 64.40 2.15
100-120 61.63 2.75
120-140 61.02 1.82
140-160 62.68 1.62
160-180 62.15 2.13
180-200 64.93 2.52
200-220 64.60 3.43
220-240 65.14 1.83
240-260 62.97 2.73
260-280 58.93 2.05
280-300 61.16 2.09
300-320 60.48 2.52
320-340 63.19 2.01
Table 2. B1 Weight of gravel in grams per sample in core from sample B1.
35
Weight of Grave-B4
Sample
Corrected
Weight (g)
Gravel
Weight
(g)
0-20 49.95 14.75
20-40 49.79 5.51
40-60 49.77 3.69
60-80 49.40 1.21
80-100 49.58 11.49
100-120 45.88 2.34
120-140 49.00 3.85
140-160 47.66 0.01
160-180 45.44 1.22
180-200 47.98 1.96
Table 3. B4 Weight of gravel in grams per sample from core B4
36
Soil Moisture Correction Factor for Sample Core B1
Sample
Crucible
Weight
(g)
Crucible
Plus
Air Dry
Soil
Weight (g)
Air Dry
Soil
Weight (g)
Crucible
Plus
Oven Dry
Soil
Weight (g)
Oven Dry
Soil
Weight (g) MCF
Original
Weight
(g)
Corrected
Weight (g)
0-20 20.04 30.78 10.74 30.73 10.69 0.9953 60.55 60.27
20-40 19.32 29.89 10.57 29.87 10.55 0.9981 66.93 66.80
40-60 20.11 31.31 11.20 31.31 11.20 1.0000 66.99 66.99
60-80 21.10 32.06 10.96 32.06 10.96 1.0000 66.79 66.79
80-100 20.42 30.78 10.36 30.78 10.36 1.0000 64.40 64.40
100-120 20.32 30.39 10.07 30.39 10.07 1.0000 61.63 61.63
120-140 19.74 29.98 10.24 29.98 10.24 1.0000 61.02 61.02
140-160 19.27 29.77 10.50 29.77 10.50 1.0000 62.68 62.68
160-180 22.34 33.27 10.93 33.28 10.94 1.0009 62.09 62.15
180-200 20.48 30.09 9.61 30.09 9.61 1.0000 64.93 64.93
200-220 20.26 31.22 10.96 31.08 10.82 0.9872 65.44 64.60
220-240 20.49 30.97 10.48 30.96 10.47 0.9990 65.20 65.14
240-260 19.69 29.82 10.13 29.80 10.11 0.9980 63.09 62.97
260-280 19.79 29.96 10.17 29.88 10.09 0.9921 59.40 58.93
280-300 19.69 28.70 9.01 28.65 8.96 0.9945 61.50 61.16
300-320 20.78 31.60 10.82 31.58 10.80 0.9982 60.59 60.48
320-340 21.04 31.82 10.78 31.80 10.76 0.9981 63.31 63.19
Table 4. Moisture correction factor and corrected weight for sample B1.
37
Soil Moisture Correction Factor for Sample Core B4
Sample
Crucible
Weight
(g)
Crucible
Plus
Air Dry
Soil
Weight (g)
Air Dry
Soil
Weight (g)
Crucible
Plus
Oven Dry
Soil
Weight (g)
Oven Dry
Soil
Weight (g) MCF
Original
Weight
(g)
Corrected
Weight (g)
0-20 19.99 30.29 10.30 30.28 10.29 0.9990 70.74 49.95
20-40 21.58 31.41 9.83 31.37 9.79 0.9959 70.71 49.80
40-60 19.62 30.55 10.93 30.50 10.88 0.9954 65.92 49.77
60-80 19.87 29.06 9.19 28.95 9.08 0.9880 62.84 49.40
80-100 20.66 31.54 10.88 31.45 10.79 0.9917 63.41 49.59
100-120 19.02 29.47 10.45 28.61 9.59 0.9177 60.37 45.89
120-140 20.63 31.15 10.52 30.94 10.31 0.9800 60.14 49.00
140-160 21.64 31.26 9.62 30.81 9.17 0.9532 63.70 47.66
160-180 21.25 32.78 11.53 31.73 10.48 0.9089 69.48 45.45
180-200 19.17 29.59 10.42 29.17 10.00 0.9597 59.98 47.98
Table 5. Moisture correction factor and corrected weights for sample B4.
38
Hydrometer Texture Analysis for Sample Core B1
Sample (cm)
Corrected
Weight (g)
6 hour 52
Minute
Reading
(g/L)
Blank
Solution
(g/L)
Corrected
6 hour 52
Minute
Reading
(g/L)
Sand
Fraction
Weight
(g)
Percent
Sand
Percent
Silt
Percent
Clay
0-20 60.27 40 4 36 20.03 33 7 60
20-40 66.80 30 4 26 23.86 36 25 39
40-60 66.99 31 4 27 20.28 30 29 40
60-80 66.79 31 4 27 21.06 32 28 40
80-100 64.40 30 4 26 19.73 31 29 40
100-120 61.63 29 4 25 19.65 32 28 41
120-140 61.02 29 4 25 18.69 31 28 41
140-160 62.68 29 4 25 20.07 32 28 40
160-180 62.15 30 4 26 19.82 32 26 42
180-200 64.93 28.5 4 24.5 20.99 32 30 38
200-220 64.60 28 4 24 19.46 30 33 37
220-240 65.14 26 4 22 21 32 34 34
240-260 62.97 25 4 21 20.5 33 34 33
260-280 58.93 22 4 18 19.16 33 37 31
280-300 61.16 22 4 18 20.48 33 37 29
300-320 60.48 23 4 19 20.01 33 35 31
320-340 63.19 25 4 21 20.12 32 35 33
Table 6. Particle size analysis of B1 showing percent sand, silt, and clay in core samples
from B1.
39
Hydrometer Texture Analysis for Sample Core B4
Sample
(cm)
Corrected
Weight (g)
6 hour 52
Minute
Reading
(g/L)
Blank
Solution
(g/L)
Corrected
6 hour 52
Minute
Reading
(g/L)
Sand
Fraction
Weight
(g)
Percent
Sand
Percent
Silt
Percent
Clay
0-20 49.95 19 3 16 30.67 61 7 32
20-40 49.80 25 3 22 27.17 55 1 44
40-60 49.77 26 3 23 21.69 44 10 46
60-80 49.40 21 3 18 20.04 41 23 36
80-100 49.59 16 3 13 28.86 58 16 26
100-120 45.89 21 3 18 23.57 51 9 39
120-140 49.00 17.5 3 14.5 20.75 42 28 30
140-160 47.66 21 4 17 1.21 3 62 36
160-180 45.45 15.5 4 11.5 25.86 57 18 25
180-200 47.98 20 4 16 20.63 43 24 33
Table 7. Particle size analysis of B4 showing percent sand, silt, and clay in core samples
from B4.
40
Percent Sand by Weight for Core Sample B1
Sample
Beaker
Weight
(g)
Sample
Plus
Beaker
Weight (g)
Sand
Weight (g)
Corrected
Total Sample
Weight (g)
Percent
Sand
0-20 110.34 130.37 20.03 60.55 33.08
20-40 112.19 136.05 23.86 66.93 35.65
40-60 114.09 134.37 20.28 66.99 30.27
60-80 113.11 134.17 21.06 66.79 31.53
80-100 113.16 132.89 19.73 64.40 30.64
100-120 106.16 125.81 19.65 61.63 31.88
120-140 110.34 129.03 18.69 61.02 30.63
140-160 112.19 132.26 20.07 62.68 32.02
160-180 114.09 133.91 19.82 62.09 31.92
180-200 113.11 134.1 20.99 64.93 32.33
200-220 113.16 132.62 19.46 65.44 29.74
220-240 106.16 127.16 21 65.20 32.21
240-260 113.11 133.61 20.5 63.09 32.49
260-280 113.16 132.32 19.16 59.40 32.26
280-300 112.19 132.67 20.48 61.50 33.30
300-320 114.09 134.1 20.01 60.59 33.03
320-340 110.34 130.46 20.12 63.31 31.78
Table 8. Percent sand by mass for sample B1.
41
Percent Sand by Weight for Core Sample B4
Sample
Beaker
Weight
(g)
Sample
Plus
Beaker
Weight (g)
Sand
Weight (g)
Corrected
Total Sample
Weight (g)
Percent
Sand
0-20 111.98 142.57 30.59 49.95 61.24
20-40 113.22 140.39 27.17 49.80 54.56
40-60 114.03 135.72 21.69 49.77 43.58
60-80 111.13 131.17 20.04 49.40 40.57
80-100 114.71 143.57 28.86 49.59 58.20
100-120 106.16 129.73 23.57 45.89 51.37
120-140 112.19 132.94 20.75 49.00 42.35
140-160 106.16 107.37 1.21 47.66 2.54
160-180 114.03 139.89 25.86 45.45 56.90
180-200 111.13 131.76 20.63 47.98 42.99
Table 9. Percent sand by mass for sample B4.
42
B1 Sieve size (Phi)
10 14 18 25 35 45 60 80 120 170 230 Pan Total
Sample Weight (g)
0-20 0 0.5 0.8 0.8 1.2 1.5 2.2 2.1 3.2 2.7 3.3 0.9 19.2
20-40 0 0.3 0.6 1 1.7 2.3 3.5 2.9 3.9 2.6 3 1.3 23.1
40-60 0 0.3 0.7 0.7 1.1 2.2 2.2 3.3 2.8 3.4 3.4 1.3 21.4
60-80 0 0.5 0.7 0.8 1.1 1.5 2.2 2.2 3.5 3.1 3.8 1.3 20.7
80-100 0 0.5 0.5 0.8 1.1 1.4 2 2 3.3 2.8 3.7 1.1 19.2
100-120 0 0.3 0.6 0.7 1.1 1.4 2 2 3.3 2.9 3.6 0.7 18.6
120-140 0 0.3 0.5 0.7 1 1.4 2 2 3.3 2.9 3.4 0.7 18.2
140-160 0 0.5 0.5 0.6 1 1.3 2 2 3.3 2.9 3.7 1.8 19.6
160-180 0 0.5 0.6 0.7 1 1.3 2 2 3.5 3 3.7 1.3 19.6
180-200 0 0.3 0.6 0.8 1.2 1.4 2.1 2.1 3.6 3 3.9 1.4 20.4
200-220 0 0.3 0.5 0.7 1 1.3 2 2 3.3 2.8 3.5 0.8 18.2
220-240 0 0.4 0.6 0.8 1.1 1.4 2 2.1 3.6 3.2 3.9 1.3 20.4
240-260 0 0.5 0.6 0.7 1 1.3 2 2 3.4 3 3.8 1.9 20.2
260-280 0 0.4 0.6 0.7 0.9 1.3 1.9 1.9 3.3 2.8 3.5 1.2 18.5
280-300 0 0.5 0.6 0.6 1 1.3 2 2 3.4 2.9 3.7 1.7 19.7
300-320 0 0.4 0.6 0.8 1.1 1.4 2 2 3.3 2.9 3.7 1.8 20
320-340 0 0.5 0.7 0.9 1.1 1.4 2.1 2.1 3.4 3 3.8 1.1 20.1
Table 10. Sand mass of each 0.5 phi interval for core sample B1.
43
B4 Sieve size (Phi)
10 14 18 25 35 45 60 80 120 170 230 Pan Total
Sample Weight (g)
0-20 0 1 1.7 2.1 3 3.6 4.8 3.6 4.2 2.4 2.6 0.6 29.6
20-40 0 1 1.7 2.3 3.2 3.8 4 2.4 2.8 1.9 2.4 0.7 26.2
40-60 0 0.5 0.8 1 1.6 1.9 2.4 2.2 3.4 2.8 3.4 1.1 21.1
60-80 0 0.3 0.4 0.6 1 1.2 2 2 3.6 3 3.8 1.2 19.1
80-100 0 0.6 1.2 1.4 2 2.4 3 2.6 4.1 3.7 4.7 2.4 28.1
100-120 0 0.5 0.7 0.9 1.3 1.7 2.6 2.5 4.2 3.4 4.2 1.1 23.1
120-140 0 0.5 0.6 0.6 1 1.3 2 2 3.5 3.3 4.3 1.2 20.3
140-160 0 0 0 0 0 0 0 0 0.1 0.1 0.8 0.3 1.3
160-180 0 0.2 0.3 0.3 0.5 0.7 1.4 2.1 5.4 5.4 6.9 1.5 24.7
180-200 0 0.3 0.6 0.7 1.1 1.6 2.6 2.4 3.6 2.7 3.1 0.7 19.4
Table 11. Sand mass for each 0.5 phi interval for core sample B4.

More Related Content

What's hot

Introduction to geomorphology
Introduction to geomorphologyIntroduction to geomorphology
Introduction to geomorphologyMd. Nazir Hossain
 
Geomorpholgy: NATURE AND SCOPE
Geomorpholgy: NATURE AND SCOPEGeomorpholgy: NATURE AND SCOPE
Geomorpholgy: NATURE AND SCOPEApoorva Mathur
 
Sukrati pandit- National Institute of Technology- Warangal
Sukrati pandit- National Institute of Technology- WarangalSukrati pandit- National Institute of Technology- Warangal
Sukrati pandit- National Institute of Technology- WarangalSukrati Pandit
 
Geomorphology and landforms
Geomorphology and landformsGeomorphology and landforms
Geomorphology and landformsLusiwe Mhlanga
 
Geomorophology presentation
Geomorophology presentationGeomorophology presentation
Geomorophology presentationNigatu G-medhin
 
Fundamental concepts of geomorphology
Fundamental concepts of geomorphologyFundamental concepts of geomorphology
Fundamental concepts of geomorphologyvenkatesh venky
 
Principles of Stratigraphy with Geo time scale
Principles of Stratigraphy with Geo time scalePrinciples of Stratigraphy with Geo time scale
Principles of Stratigraphy with Geo time scaleUniversity Of Madras, Chennai
 
Geomorphological indicators of climate change zewde alemayehu tilahun
Geomorphological indicators of climate change zewde alemayehu tilahunGeomorphological indicators of climate change zewde alemayehu tilahun
Geomorphological indicators of climate change zewde alemayehu tilahunzewde alemayehu
 
Fundmetal concepts of geomorphology
Fundmetal concepts of geomorphologyFundmetal concepts of geomorphology
Fundmetal concepts of geomorphologyNikhil Sherekar
 
Geomorphology of landslide in bangladesh
Geomorphology of landslide in  bangladeshGeomorphology of landslide in  bangladesh
Geomorphology of landslide in bangladeshTarikIslam9
 
Geomorphic processes
Geomorphic processesGeomorphic processes
Geomorphic processesPramoda Raj
 
Introduction to Geomorphology
Introduction to Geomorphology Introduction to Geomorphology
Introduction to Geomorphology P.K. Mani
 
Brief introduction to petroleum upstream industries
Brief introduction to petroleum upstream industriesBrief introduction to petroleum upstream industries
Brief introduction to petroleum upstream industriesAlbert Wilson David
 
Geophysical Exploration
Geophysical ExplorationGeophysical Exploration
Geophysical ExplorationSohail Nawab
 
Geomorphology at a glance: Major landforms
Geomorphology at a glance: Major landformsGeomorphology at a glance: Major landforms
Geomorphology at a glance: Major landformsP.K. Mani
 
Engineering Geology Lecture 3
Engineering Geology Lecture 3Engineering Geology Lecture 3
Engineering Geology Lecture 3University of Gondar
 

What's hot (20)

Introduction to geomorphology
Introduction to geomorphologyIntroduction to geomorphology
Introduction to geomorphology
 
Geomorpholgy: NATURE AND SCOPE
Geomorpholgy: NATURE AND SCOPEGeomorpholgy: NATURE AND SCOPE
Geomorpholgy: NATURE AND SCOPE
 
Sukrati pandit- National Institute of Technology- Warangal
Sukrati pandit- National Institute of Technology- WarangalSukrati pandit- National Institute of Technology- Warangal
Sukrati pandit- National Institute of Technology- Warangal
 
Geomorphology and landforms
Geomorphology and landformsGeomorphology and landforms
Geomorphology and landforms
 
Geomorophology presentation
Geomorophology presentationGeomorophology presentation
Geomorophology presentation
 
GSA2015_SD_KW_Page1 (1) (1) (2)
GSA2015_SD_KW_Page1 (1) (1) (2)GSA2015_SD_KW_Page1 (1) (1) (2)
GSA2015_SD_KW_Page1 (1) (1) (2)
 
Fundamental concepts of geomorphology
Fundamental concepts of geomorphologyFundamental concepts of geomorphology
Fundamental concepts of geomorphology
 
Principles of Stratigraphy with Geo time scale
Principles of Stratigraphy with Geo time scalePrinciples of Stratigraphy with Geo time scale
Principles of Stratigraphy with Geo time scale
 
Engineering geology unit i
Engineering geology unit  iEngineering geology unit  i
Engineering geology unit i
 
Geomorphological indicators of climate change zewde alemayehu tilahun
Geomorphological indicators of climate change zewde alemayehu tilahunGeomorphological indicators of climate change zewde alemayehu tilahun
Geomorphological indicators of climate change zewde alemayehu tilahun
 
Fundmetal concepts of geomorphology
Fundmetal concepts of geomorphologyFundmetal concepts of geomorphology
Fundmetal concepts of geomorphology
 
Geomorphology of landslide in bangladesh
Geomorphology of landslide in  bangladeshGeomorphology of landslide in  bangladesh
Geomorphology of landslide in bangladesh
 
Geomorphic processes
Geomorphic processesGeomorphic processes
Geomorphic processes
 
2019 tg lithosphere3 geomorphic processes
2019 tg lithosphere3 geomorphic processes2019 tg lithosphere3 geomorphic processes
2019 tg lithosphere3 geomorphic processes
 
Introduction to Geomorphology
Introduction to Geomorphology Introduction to Geomorphology
Introduction to Geomorphology
 
Brief introduction to petroleum upstream industries
Brief introduction to petroleum upstream industriesBrief introduction to petroleum upstream industries
Brief introduction to petroleum upstream industries
 
Geophysical Exploration
Geophysical ExplorationGeophysical Exploration
Geophysical Exploration
 
Geomorphology at a glance: Major landforms
Geomorphology at a glance: Major landformsGeomorphology at a glance: Major landforms
Geomorphology at a glance: Major landforms
 
Earth sciences
Earth sciencesEarth sciences
Earth sciences
 
Engineering Geology Lecture 3
Engineering Geology Lecture 3Engineering Geology Lecture 3
Engineering Geology Lecture 3
 

Similar to Geologic Controls on Liquefaction Processes at the Bottineau Quicksand Site

Undergraduate Scholars Forum 2016
Undergraduate Scholars Forum 2016Undergraduate Scholars Forum 2016
Undergraduate Scholars Forum 2016Jonathan King
 
M.Sc. Thesis Published
M.Sc. Thesis PublishedM.Sc. Thesis Published
M.Sc. Thesis PublishedSiddharth Joshi
 
Geotechnical Investigation for Design and Construction of Civil Infrastructur...
Geotechnical Investigation for Design and Construction of Civil Infrastructur...Geotechnical Investigation for Design and Construction of Civil Infrastructur...
Geotechnical Investigation for Design and Construction of Civil Infrastructur...theijes
 
Modern water at low latitudes on Mars: Potential evidence from dune surfaces
Modern water at low latitudes on Mars: Potential evidence from dune surfacesModern water at low latitudes on Mars: Potential evidence from dune surfaces
Modern water at low latitudes on Mars: Potential evidence from dune surfacesSĂ©rgio Sacani
 
Chapter4groundwaterhydrology 130630055824-phpapp02
Chapter4groundwaterhydrology 130630055824-phpapp02Chapter4groundwaterhydrology 130630055824-phpapp02
Chapter4groundwaterhydrology 130630055824-phpapp02Cleophas Rwemera
 
Bv31291295
Bv31291295Bv31291295
Bv31291295IJMER
 
Basic petroleum geology [peter k. link] 1 exposiciĂłn
Basic petroleum geology [peter k. link] 1 exposiciĂłnBasic petroleum geology [peter k. link] 1 exposiciĂłn
Basic petroleum geology [peter k. link] 1 exposiciĂłnMery Tania Aponte Padilla
 
Chapter 4 groundwater hydrology
Chapter 4 groundwater hydrologyChapter 4 groundwater hydrology
Chapter 4 groundwater hydrologyMohammed Salahat
 
The ground under our feet
The ground under our feetThe ground under our feet
The ground under our feetantolini
 
Artificial Recharge to Alluvial Aquifer, Northeastern Nuba Mountains, Sudan.
Artificial Recharge to Alluvial Aquifer, Northeastern Nuba Mountains, Sudan.Artificial Recharge to Alluvial Aquifer, Northeastern Nuba Mountains, Sudan.
Artificial Recharge to Alluvial Aquifer, Northeastern Nuba Mountains, Sudan.IJRES Journal
 
Developing Conceptual Aquifer Geometry, Structural Geological Control and Pos...
Developing Conceptual Aquifer Geometry, Structural Geological Control and Pos...Developing Conceptual Aquifer Geometry, Structural Geological Control and Pos...
Developing Conceptual Aquifer Geometry, Structural Geological Control and Pos...iosrjce
 
Determinaton of soil erosion runoff using a developed laboratory rainfall sim...
Determinaton of soil erosion runoff using a developed laboratory rainfall sim...Determinaton of soil erosion runoff using a developed laboratory rainfall sim...
Determinaton of soil erosion runoff using a developed laboratory rainfall sim...Alexander Decker
 
ES 1010, Earth Science 1 Course Learning Outcomes for.docx
 ES 1010, Earth Science 1 Course Learning Outcomes for.docx ES 1010, Earth Science 1 Course Learning Outcomes for.docx
ES 1010, Earth Science 1 Course Learning Outcomes for.docxaryan532920
 
1009 2010 previous
1009 2010 previous1009 2010 previous
1009 2010 previousAngad Yadav
 
Greening of the Arctic: Climate change and circumpolar Arctic vegetation
Greening of the Arctic: Climate change and circumpolar Arctic vegetation Greening of the Arctic: Climate change and circumpolar Arctic vegetation
Greening of the Arctic: Climate change and circumpolar Arctic vegetation Edie Barbour
 
Spatial variation in surface runoff at catchment scale, the case study of adi...
Spatial variation in surface runoff at catchment scale, the case study of adi...Spatial variation in surface runoff at catchment scale, the case study of adi...
Spatial variation in surface runoff at catchment scale, the case study of adi...Alexander Decker
 
Landslide Investigation of Ikwette, Obudu Local Government Area of Cross Rive...
Landslide Investigation of Ikwette, Obudu Local Government Area of Cross Rive...Landslide Investigation of Ikwette, Obudu Local Government Area of Cross Rive...
Landslide Investigation of Ikwette, Obudu Local Government Area of Cross Rive...iosrjce
 
Thompson Turk - Introduction to Physical Geology.pdf
Thompson Turk - Introduction to Physical Geology.pdfThompson Turk - Introduction to Physical Geology.pdf
Thompson Turk - Introduction to Physical Geology.pdfgigiherlangga2
 
Pyke paper for asce lifelines conference 2021 22
Pyke paper for asce lifelines conference 2021 22Pyke paper for asce lifelines conference 2021 22
Pyke paper for asce lifelines conference 2021 22Robert Pyke
 

Similar to Geologic Controls on Liquefaction Processes at the Bottineau Quicksand Site (20)

Undergraduate Scholars Forum 2016
Undergraduate Scholars Forum 2016Undergraduate Scholars Forum 2016
Undergraduate Scholars Forum 2016
 
M.Sc. Thesis Published
M.Sc. Thesis PublishedM.Sc. Thesis Published
M.Sc. Thesis Published
 
ncomms11897
ncomms11897ncomms11897
ncomms11897
 
Geotechnical Investigation for Design and Construction of Civil Infrastructur...
Geotechnical Investigation for Design and Construction of Civil Infrastructur...Geotechnical Investigation for Design and Construction of Civil Infrastructur...
Geotechnical Investigation for Design and Construction of Civil Infrastructur...
 
Modern water at low latitudes on Mars: Potential evidence from dune surfaces
Modern water at low latitudes on Mars: Potential evidence from dune surfacesModern water at low latitudes on Mars: Potential evidence from dune surfaces
Modern water at low latitudes on Mars: Potential evidence from dune surfaces
 
Chapter4groundwaterhydrology 130630055824-phpapp02
Chapter4groundwaterhydrology 130630055824-phpapp02Chapter4groundwaterhydrology 130630055824-phpapp02
Chapter4groundwaterhydrology 130630055824-phpapp02
 
Bv31291295
Bv31291295Bv31291295
Bv31291295
 
Basic petroleum geology [peter k. link] 1 exposiciĂłn
Basic petroleum geology [peter k. link] 1 exposiciĂłnBasic petroleum geology [peter k. link] 1 exposiciĂłn
Basic petroleum geology [peter k. link] 1 exposiciĂłn
 
Chapter 4 groundwater hydrology
Chapter 4 groundwater hydrologyChapter 4 groundwater hydrology
Chapter 4 groundwater hydrology
 
The ground under our feet
The ground under our feetThe ground under our feet
The ground under our feet
 
Artificial Recharge to Alluvial Aquifer, Northeastern Nuba Mountains, Sudan.
Artificial Recharge to Alluvial Aquifer, Northeastern Nuba Mountains, Sudan.Artificial Recharge to Alluvial Aquifer, Northeastern Nuba Mountains, Sudan.
Artificial Recharge to Alluvial Aquifer, Northeastern Nuba Mountains, Sudan.
 
Developing Conceptual Aquifer Geometry, Structural Geological Control and Pos...
Developing Conceptual Aquifer Geometry, Structural Geological Control and Pos...Developing Conceptual Aquifer Geometry, Structural Geological Control and Pos...
Developing Conceptual Aquifer Geometry, Structural Geological Control and Pos...
 
Determinaton of soil erosion runoff using a developed laboratory rainfall sim...
Determinaton of soil erosion runoff using a developed laboratory rainfall sim...Determinaton of soil erosion runoff using a developed laboratory rainfall sim...
Determinaton of soil erosion runoff using a developed laboratory rainfall sim...
 
ES 1010, Earth Science 1 Course Learning Outcomes for.docx
 ES 1010, Earth Science 1 Course Learning Outcomes for.docx ES 1010, Earth Science 1 Course Learning Outcomes for.docx
ES 1010, Earth Science 1 Course Learning Outcomes for.docx
 
1009 2010 previous
1009 2010 previous1009 2010 previous
1009 2010 previous
 
Greening of the Arctic: Climate change and circumpolar Arctic vegetation
Greening of the Arctic: Climate change and circumpolar Arctic vegetation Greening of the Arctic: Climate change and circumpolar Arctic vegetation
Greening of the Arctic: Climate change and circumpolar Arctic vegetation
 
Spatial variation in surface runoff at catchment scale, the case study of adi...
Spatial variation in surface runoff at catchment scale, the case study of adi...Spatial variation in surface runoff at catchment scale, the case study of adi...
Spatial variation in surface runoff at catchment scale, the case study of adi...
 
Landslide Investigation of Ikwette, Obudu Local Government Area of Cross Rive...
Landslide Investigation of Ikwette, Obudu Local Government Area of Cross Rive...Landslide Investigation of Ikwette, Obudu Local Government Area of Cross Rive...
Landslide Investigation of Ikwette, Obudu Local Government Area of Cross Rive...
 
Thompson Turk - Introduction to Physical Geology.pdf
Thompson Turk - Introduction to Physical Geology.pdfThompson Turk - Introduction to Physical Geology.pdf
Thompson Turk - Introduction to Physical Geology.pdf
 
Pyke paper for asce lifelines conference 2021 22
Pyke paper for asce lifelines conference 2021 22Pyke paper for asce lifelines conference 2021 22
Pyke paper for asce lifelines conference 2021 22
 

Recently uploaded

Call Girls in Aiims Metro Delhi 💯Call Us 🔝9953322196🔝 💯Escort.
Call Girls in Aiims Metro Delhi 💯Call Us 🔝9953322196🔝 💯Escort.Call Girls in Aiims Metro Delhi 💯Call Us 🔝9953322196🔝 💯Escort.
Call Girls in Aiims Metro Delhi 💯Call Us 🔝9953322196🔝 💯Escort.aasikanpl
 
Call Girls in Munirka Delhi 💯Call Us 🔝9953322196🔝 💯Escort.
Call Girls in Munirka Delhi 💯Call Us 🔝9953322196🔝 💯Escort.Call Girls in Munirka Delhi 💯Call Us 🔝9953322196🔝 💯Escort.
Call Girls in Munirka Delhi 💯Call Us 🔝9953322196🔝 💯Escort.aasikanpl
 
LIGHT-PHENOMENA-BY-CABUALDIONALDOPANOGANCADIENTE-CONDEZA (1).pptx
LIGHT-PHENOMENA-BY-CABUALDIONALDOPANOGANCADIENTE-CONDEZA (1).pptxLIGHT-PHENOMENA-BY-CABUALDIONALDOPANOGANCADIENTE-CONDEZA (1).pptx
LIGHT-PHENOMENA-BY-CABUALDIONALDOPANOGANCADIENTE-CONDEZA (1).pptxmalonesandreagweneth
 
Bentham & Hooker's Classification. along with the merits and demerits of the ...
Bentham & Hooker's Classification. along with the merits and demerits of the ...Bentham & Hooker's Classification. along with the merits and demerits of the ...
Bentham & Hooker's Classification. along with the merits and demerits of the ...Nistarini College, Purulia (W.B) India
 
Welcome to GFDL for Take Your Child To Work Day
Welcome to GFDL for Take Your Child To Work DayWelcome to GFDL for Take Your Child To Work Day
Welcome to GFDL for Take Your Child To Work DayZachary Labe
 
‏‏VIRUS - 123455555555555555555555555555555555555555
‏‏VIRUS -  123455555555555555555555555555555555555555‏‏VIRUS -  123455555555555555555555555555555555555555
‏‏VIRUS - 123455555555555555555555555555555555555555kikilily0909
 
Transposable elements in prokaryotes.ppt
Transposable elements in prokaryotes.pptTransposable elements in prokaryotes.ppt
Transposable elements in prokaryotes.pptArshadWarsi13
 
TOPIC 8 Temperature and Heat.pdf physics
TOPIC 8 Temperature and Heat.pdf physicsTOPIC 8 Temperature and Heat.pdf physics
TOPIC 8 Temperature and Heat.pdf physicsssuserddc89b
 
Cytokinin, mechanism and its application.pptx
Cytokinin, mechanism and its application.pptxCytokinin, mechanism and its application.pptx
Cytokinin, mechanism and its application.pptxVarshiniMK
 
Call Girls in Hauz Khas Delhi 💯Call Us 🔝9953322196🔝 💯Escort.
Call Girls in Hauz Khas Delhi 💯Call Us 🔝9953322196🔝 💯Escort.Call Girls in Hauz Khas Delhi 💯Call Us 🔝9953322196🔝 💯Escort.
Call Girls in Hauz Khas Delhi 💯Call Us 🔝9953322196🔝 💯Escort.aasikanpl
 
RESPIRATORY ADAPTATIONS TO HYPOXIA IN HUMNAS.pptx
RESPIRATORY ADAPTATIONS TO HYPOXIA IN HUMNAS.pptxRESPIRATORY ADAPTATIONS TO HYPOXIA IN HUMNAS.pptx
RESPIRATORY ADAPTATIONS TO HYPOXIA IN HUMNAS.pptxFarihaAbdulRasheed
 
Forest laws, Indian forest laws, why they are important
Forest laws, Indian forest laws, why they are importantForest laws, Indian forest laws, why they are important
Forest laws, Indian forest laws, why they are importantadityabhardwaj282
 
Best Call Girls In Sector 29 Gurgaon❤️8860477959 EscorTs Service In 24/7 Delh...
Best Call Girls In Sector 29 Gurgaon❤️8860477959 EscorTs Service In 24/7 Delh...Best Call Girls In Sector 29 Gurgaon❤️8860477959 EscorTs Service In 24/7 Delh...
Best Call Girls In Sector 29 Gurgaon❤️8860477959 EscorTs Service In 24/7 Delh...lizamodels9
 
Heredity: Inheritance and Variation of Traits
Heredity: Inheritance and Variation of TraitsHeredity: Inheritance and Variation of Traits
Heredity: Inheritance and Variation of TraitsCharlene Llagas
 
Twin's paradox experiment is a meassurement of the extra dimensions.pptx
Twin's paradox experiment is a meassurement of the extra dimensions.pptxTwin's paradox experiment is a meassurement of the extra dimensions.pptx
Twin's paradox experiment is a meassurement of the extra dimensions.pptxEran Akiva Sinbar
 
Solution chemistry, Moral and Normal solutions
Solution chemistry, Moral and Normal solutionsSolution chemistry, Moral and Normal solutions
Solution chemistry, Moral and Normal solutionsHajira Mahmood
 
SOLUBLE PATTERN RECOGNITION RECEPTORS.pptx
SOLUBLE PATTERN RECOGNITION RECEPTORS.pptxSOLUBLE PATTERN RECOGNITION RECEPTORS.pptx
SOLUBLE PATTERN RECOGNITION RECEPTORS.pptxkessiyaTpeter
 
TOTAL CHOLESTEROL (lipid profile test).pptx
TOTAL CHOLESTEROL (lipid profile test).pptxTOTAL CHOLESTEROL (lipid profile test).pptx
TOTAL CHOLESTEROL (lipid profile test).pptxdharshini369nike
 
Call Girls in Mayapuri Delhi 💯Call Us 🔝9953322196🔝 💯Escort.
Call Girls in Mayapuri Delhi 💯Call Us 🔝9953322196🔝 💯Escort.Call Girls in Mayapuri Delhi 💯Call Us 🔝9953322196🔝 💯Escort.
Call Girls in Mayapuri Delhi 💯Call Us 🔝9953322196🔝 💯Escort.aasikanpl
 
Dashanga agada a formulation of Agada tantra dealt in 3 Rd year bams agada tanta
Dashanga agada a formulation of Agada tantra dealt in 3 Rd year bams agada tantaDashanga agada a formulation of Agada tantra dealt in 3 Rd year bams agada tanta
Dashanga agada a formulation of Agada tantra dealt in 3 Rd year bams agada tantaPraksha3
 

Recently uploaded (20)

Call Girls in Aiims Metro Delhi 💯Call Us 🔝9953322196🔝 💯Escort.
Call Girls in Aiims Metro Delhi 💯Call Us 🔝9953322196🔝 💯Escort.Call Girls in Aiims Metro Delhi 💯Call Us 🔝9953322196🔝 💯Escort.
Call Girls in Aiims Metro Delhi 💯Call Us 🔝9953322196🔝 💯Escort.
 
Call Girls in Munirka Delhi 💯Call Us 🔝9953322196🔝 💯Escort.
Call Girls in Munirka Delhi 💯Call Us 🔝9953322196🔝 💯Escort.Call Girls in Munirka Delhi 💯Call Us 🔝9953322196🔝 💯Escort.
Call Girls in Munirka Delhi 💯Call Us 🔝9953322196🔝 💯Escort.
 
LIGHT-PHENOMENA-BY-CABUALDIONALDOPANOGANCADIENTE-CONDEZA (1).pptx
LIGHT-PHENOMENA-BY-CABUALDIONALDOPANOGANCADIENTE-CONDEZA (1).pptxLIGHT-PHENOMENA-BY-CABUALDIONALDOPANOGANCADIENTE-CONDEZA (1).pptx
LIGHT-PHENOMENA-BY-CABUALDIONALDOPANOGANCADIENTE-CONDEZA (1).pptx
 
Bentham & Hooker's Classification. along with the merits and demerits of the ...
Bentham & Hooker's Classification. along with the merits and demerits of the ...Bentham & Hooker's Classification. along with the merits and demerits of the ...
Bentham & Hooker's Classification. along with the merits and demerits of the ...
 
Welcome to GFDL for Take Your Child To Work Day
Welcome to GFDL for Take Your Child To Work DayWelcome to GFDL for Take Your Child To Work Day
Welcome to GFDL for Take Your Child To Work Day
 
‏‏VIRUS - 123455555555555555555555555555555555555555
‏‏VIRUS -  123455555555555555555555555555555555555555‏‏VIRUS -  123455555555555555555555555555555555555555
‏‏VIRUS - 123455555555555555555555555555555555555555
 
Transposable elements in prokaryotes.ppt
Transposable elements in prokaryotes.pptTransposable elements in prokaryotes.ppt
Transposable elements in prokaryotes.ppt
 
TOPIC 8 Temperature and Heat.pdf physics
TOPIC 8 Temperature and Heat.pdf physicsTOPIC 8 Temperature and Heat.pdf physics
TOPIC 8 Temperature and Heat.pdf physics
 
Cytokinin, mechanism and its application.pptx
Cytokinin, mechanism and its application.pptxCytokinin, mechanism and its application.pptx
Cytokinin, mechanism and its application.pptx
 
Call Girls in Hauz Khas Delhi 💯Call Us 🔝9953322196🔝 💯Escort.
Call Girls in Hauz Khas Delhi 💯Call Us 🔝9953322196🔝 💯Escort.Call Girls in Hauz Khas Delhi 💯Call Us 🔝9953322196🔝 💯Escort.
Call Girls in Hauz Khas Delhi 💯Call Us 🔝9953322196🔝 💯Escort.
 
RESPIRATORY ADAPTATIONS TO HYPOXIA IN HUMNAS.pptx
RESPIRATORY ADAPTATIONS TO HYPOXIA IN HUMNAS.pptxRESPIRATORY ADAPTATIONS TO HYPOXIA IN HUMNAS.pptx
RESPIRATORY ADAPTATIONS TO HYPOXIA IN HUMNAS.pptx
 
Forest laws, Indian forest laws, why they are important
Forest laws, Indian forest laws, why they are importantForest laws, Indian forest laws, why they are important
Forest laws, Indian forest laws, why they are important
 
Best Call Girls In Sector 29 Gurgaon❤️8860477959 EscorTs Service In 24/7 Delh...
Best Call Girls In Sector 29 Gurgaon❤️8860477959 EscorTs Service In 24/7 Delh...Best Call Girls In Sector 29 Gurgaon❤️8860477959 EscorTs Service In 24/7 Delh...
Best Call Girls In Sector 29 Gurgaon❤️8860477959 EscorTs Service In 24/7 Delh...
 
Heredity: Inheritance and Variation of Traits
Heredity: Inheritance and Variation of TraitsHeredity: Inheritance and Variation of Traits
Heredity: Inheritance and Variation of Traits
 
Twin's paradox experiment is a meassurement of the extra dimensions.pptx
Twin's paradox experiment is a meassurement of the extra dimensions.pptxTwin's paradox experiment is a meassurement of the extra dimensions.pptx
Twin's paradox experiment is a meassurement of the extra dimensions.pptx
 
Solution chemistry, Moral and Normal solutions
Solution chemistry, Moral and Normal solutionsSolution chemistry, Moral and Normal solutions
Solution chemistry, Moral and Normal solutions
 
SOLUBLE PATTERN RECOGNITION RECEPTORS.pptx
SOLUBLE PATTERN RECOGNITION RECEPTORS.pptxSOLUBLE PATTERN RECOGNITION RECEPTORS.pptx
SOLUBLE PATTERN RECOGNITION RECEPTORS.pptx
 
TOTAL CHOLESTEROL (lipid profile test).pptx
TOTAL CHOLESTEROL (lipid profile test).pptxTOTAL CHOLESTEROL (lipid profile test).pptx
TOTAL CHOLESTEROL (lipid profile test).pptx
 
Call Girls in Mayapuri Delhi 💯Call Us 🔝9953322196🔝 💯Escort.
Call Girls in Mayapuri Delhi 💯Call Us 🔝9953322196🔝 💯Escort.Call Girls in Mayapuri Delhi 💯Call Us 🔝9953322196🔝 💯Escort.
Call Girls in Mayapuri Delhi 💯Call Us 🔝9953322196🔝 💯Escort.
 
Dashanga agada a formulation of Agada tantra dealt in 3 Rd year bams agada tanta
Dashanga agada a formulation of Agada tantra dealt in 3 Rd year bams agada tantaDashanga agada a formulation of Agada tantra dealt in 3 Rd year bams agada tanta
Dashanga agada a formulation of Agada tantra dealt in 3 Rd year bams agada tanta
 

Geologic Controls on Liquefaction Processes at the Bottineau Quicksand Site

  • 1. 1 Geologic Controls on Liquefaction Processes at the Bottineau Quicksand Site Brody B. Awalt Dept. of Geosciences Minot State University Spring 2014 ABSTRACT This study investigated the relationship between the geologic setting and the development of “quicksand” near Bottineau ND. The site is located south of Highway 5, 3.8 km east of Bottineau and 2 km south of the Turtle Mountains. “Quicksand” is any saturated, unconsolidated material that exhibits liquefaction when under stress. A manual auger was used to sample subsurface materials. Core locations were laid out along a N-S transect across the site to create a cross-sectional diagram. Sediment samples were obtained for laboratory analysis, and two stratigraphic units were identified during coring. Four wells were installed in two well nests to document site hydrology. Three wells were installed within the lower unit and one was installed in the upper unit. The lower-most unit, is a massive, unoxidized, firm, over-compacted diamicton (with compressive strength from 2.25 to 4.5 kg/cm2), with oxidized joints and thin discontinuous sand and silt layers. The joints represent fractures generated by soft sediment deformation during deposition of the unit. The surface unit at the site consists of an oxidized-to-reduced stratified unit with lower compressive strength (0.2-2.0 kg/cm2). The lower unit is a basal lodgement till assigned to the Coleharbor Formation. The silt layer near the base of the upper unit may represent deposition in a pond or Glacial Lake Souris. The upper unit is a melt-out supra-glacial till or colluvial unit, also assigned to the Coleharbor Formation. Based on hydrologic evidence, it appears that the lower unit is acting as an aquilude generating a perched water table at the base of the upper unit. As water moves through the subsurface it encounters an uplifted wall of the lower unit impeding lateral flow, forcing the water to the surface generating “quicksand.” Further research needs to be done to confirm this.
  • 2. 2 INTRODUCTION This project examined the sedimentology and stratigraphy of an area identified as quicksand near Bottineau, North Dakota (Figure 1), in order to identify processes that created this unusual landscape. The study area, referred to informally as the Bottineau Quicksand Site in this report, is located just south of the Turtle Mountains in Bottineau County (Figure 2). Locals have known and been curious about what led to the formation of quicksand in the area for a long time. There is a local story about a horse getting stuck in the quicksand and needing to be pulled out by a truck (pers. comm., McKay, Sep. 2013). This project examined whether the liquefaction is the result of local geology. Background Regional Geology The Bottineau Quicksand Site lies approximately 3.8 km east of Bottineau on the south side of ND highway 5 (Figure 2). Bottineau County, located in north-central North Dakota, is underlain by the Pleistocene Coleharbor Group. This unit varies in thickness, from approximately 61 to 76 m thick in the west, 15 m to 30 m thick in the central area of the county, and 61 to 91 m thick over the Turtle Mountains (Bluemle 1985). Most of Bottineau County is composed of glaciated plains, with relatively flat, rolling hill topography (Bluemle 1985). Glacial Lake Souris occupied the central part of Bottineau County, and this region is overlain by thin lake or lake-shore sediments and wave-planed glacial sediment (Bluemle 1985). In some portions of the county these sediments have been reworked by wind into dunes and sand sheets (Bluemle 1985).
  • 3. 3 Primarily low-relief collapsed glacial topography is displayed in western Bottineau County. The Turtle Mountains in the northeastern part of the county are composed of high-relief collapsed glacial and ice-thrust topography (Bluemle 1985).The generalized surficial geology of Bottineau and Rolette Counties is shown in Figure 4. According to Bluemle (1985), “the glacial-drift deposits include materials such as sand and gravel, as well as relatively impermeable silt, glacial till, and lacustrine clay.” Regional Hydrology After precipitation drops on the Earth's surface, part is evaporated to the atmosphere, some moves off into streams, and the rest moves into the ground. Surplus water within the soil eventually infiltrates downward below the ground water table into the saturated zone. “Ground water moves under the effect of gravity and pressure from areas of recharge to areas of discharge” (Randich and Kuznair 1984). The speed of ground-water within a material is controlled by the hydraulic conductivity of the material and by the hydraulic gradient. Gravel, well-sorted sand, and fractured rocks can have high hydraulic conductivity, and if saturated can be aquifers (Randich and Kuznair 1984). “Cemented deposits and fine-grained materials such as silt, clay, and shale usually have a low hydraulic conductivity and restrict ground-water movement” (Randich and Kuznair 1984). The water level in an aquifer can fluctuate in reaction to fluctuations in the rate of recharge to the aquifer and discharge from the aquifer. These fluctuations can represent a change in the total volume of water stowed in the aquifer (Randich and Kuznair 1984). “However, in confined aquifers, changes in atmospheric pressure or surface load also cause water-level fluctuations” (Randich and Kuznair 1984). In the study area, aquifers
  • 4. 4 present at land surface are recharged during spring, summer, and early fall by precipitation moving downward towards the ground water table (Randich and Kuznair 1984). “Liquefaction is the process by which saturated, unconsolidated sediments are transformed into a substance that acts like a liquid” (GEO 2014). If a soil is saturated, a state that often occurs if the soil is within the water table, then water resides in gaps between soil grains (pore spaces). In an increase of pressure, the water will flow toward zones of lower pressure (usually upward, toward the surface). The UWCE (2014) Web site says that if pressure is quickly applied and is great enough, or quickly repetitive as with earthquake shaking, pressure will build enough that contact forces keeping grains in contact no longer can hold the grains together. They then move away from each other. Sediment then will behave as a liquid. Wherever quicksand processes take place, mounds of sediment are also found. The mounds of sediment are where most of the quicksand is located. The study area is well known for its natural springs and flowing artesian wells. “A flowing artesian well occurs when the natural pressure of an aquifer is great enough to cause water to rise to the surface” (USGSWSS 2014). The purpose of this study was to find out what geological features in this area play a role in development of quicksand. METHODS Field Methods Sampling was done in a line from NE to SW (Figure 5) using an auger-type hand coring unit (Figure 6). Three holes were sampled, one (B5) at the SW edge of the study area, another (B1) approximately half way between B5 and B4, and the third (B4) at the
  • 5. 5 northeastern-most part of the study area (Figure 5). Holes B5 and B1 were cored to 3.65 m and B4 was only cored to 2.74 m because of the high water table in that area. Core samples were obtained at 10-cm intervals. After each 10-cm interval, the sample was removed from the auger and placed into a Ziploc bag. Bags were labeled with their corresponding core names and depths of extraction. Samples were taken back to the Minot State University geology lab to be described and analyzed. Two sets of nested wells were installed (Figure 7). Wells were designated B1, B2, B3, and B4. B1 and B4 were installed in the holes left from the coring process. Core sampling and well installation occurred on different days. Well depths were B1-3.6 m, B2-2.7 m, B3-1.5 m, B4-2.7 m. Wells at B1 and B2 were nested together at varying depths and B3 was nested with B4 in order to obtain hydraulic gradients. Well B1 was placed at 3.6 m, the coring unit’s maximum depth. Wells consisted of 3.81 cm (1.5 in) inner diameter PVC pipe with a sealed bottom and perforations in the lower 25 cm (Figure 8). Perforations were installed with a cordless drill. Wells were placed in after cores had been extracted. Thirty centimeters of sand were poured into each hole in order to cover the lower 25 cm and perforations. Clay (kitty litter) next was added to each hole in order to create a seal against any surface water percolating downward. Fill dirt finally was dropped in around the PVC to fill up the rest of the hole to the surface level. Due to freezing temperatures, water level readings were taken only when possible. Data from those readings were entered in an Excel spreadsheet and subsequently plotted (Figure 9). Laboratory Methods
  • 6. 6 Detailed descriptions of soil morphology and parent material were completed for each core. Soil descriptions were done in the field. They were typed up in the office and stratigraphic boundaries observed in the field were modified based on laboratory results. Density readings were obtained from a pocket penetrometer to provide a measure of compressive strength. Readings were taken by slowly inserting the small piston into the soil sample until the calibration mark was level with the soil (Figure 10). As the piston was inserted into the sample the handle pushed the white ring on the scale and a reading was obtained from the lower side of the ring closest to the tip of the instrument. Soil compaction was read in kg/cm2 using the low side of the ring. Stratigraphic sections were prepared from morphologic description and particle-size data. Methods used for particle size analysis were developed by Bouyoucos (1927, 1951, and 1961). Gravel Separation Approximately 60 g of sample were submersed in water for 24 hours in a 250 ml or 500 ml beaker. After 24 hours samples were set on a magnetic stir plate for five minutes. Then the samples were poured through a 2 mm sieve to remove any gravel-sized particles. Both greater than 2 mm and less than 2 mm fractions were dried, weighed, and their weights were recorded. Only the less than 2 mm fraction was used for hydrometer analysis. Hydrometer Analysis The less than 2 mm size fraction was captured in a 500 mL beaker. After beakers had been filled with sample, 100 ml of 50 g/L sodium hexametaphosphate solution was added to each. The mixture in each beaker was stirred with a spoon until all particles
  • 7. 7 were suspended. Particles that remained on the spoon were rinsed back into the beaker with distilled water, and any particles that adhered to the sides of the beakers were rinsed back into the suspension. The beakers were covered with watch glasses. Samples were soaked overnight to allow the sodium hexametaphosphate solution to fully deflocculate any clay particles. Each sample was then washed into a stainless steel mixing cup with distilled water and mixed for five minutes with a commercial drink mixing machine (Hamilton Beach model number SA-10). Samples were washed with distilled water from the mixing cup into a hydrometer jar. Hydrometer jars were filled with distilled water to the 1000 ml mark and placed into a hydrometer bath at a constant temperature of 20 °C. A hydrometer jar containing 100 ml of 50g/L sodium hexametaphosphate solution was filled with distilled water to the 1000 ml mark, placed into the hydrometer bath and as a control to subtract out the mass of added sodium hexametaphosphate in the samples. Once control sample temperature was verified to be 20 °C, density was recorded using a bouycous hydrometer. A rubber stopper was placed into the opening of the hydrometer jar, and the jar was rapidly and repeatedly rotated 180 degrees for one minute in order to ensure that all particles were suspended. The jar was then placed back into the bath, a timer was started, and the rubber stopper was removed. At a time of six hours and 52 minutes, a hydrometer reading was taken. This reading was taken after all sand and silt-sized particles had settled out of suspension, leaving only the clay-sized particles in suspension. This reading was used to determine the clay-sized fraction of the sample.
  • 8. 8 Sand and Silt Percent by Weight The contents of each hydrometer jar were poured through a number 230 sieve to collect the sand-sized particles. These particles were washed from the sieve into a clean beaker. Each beaker was cleaned, dried, and weighed. The beakers were placed into a drying oven at 80 °C until contents were dry. The beakers containing the dry sand were then weighed. This weight minus the weight of the clean, dry beaker was used as the method of determining the sand-sized fraction of each sample. The silt-sized fraction of the sample was determined by subtracting the sand percent by weight from the six hour and 52 minute reading. The dry sand from each sample was poured into a stack of sieves that separated the sand into 0.5 phi intervals from -1.00 phi to 4.00 phi. This stack of sieves was placed into a Ro-Tap sieve shaker and run for approximately 12 minutes. The material from each sieve was removed, weighed, and the weight recorded (Table 8 and 9). The separate size fractions were combined in Ziploc bags and cataloged for possible future study, but were not analyzed as part of this study. Moisture Correction Factor For each sample a ceramic crucible was weighed. Approximately 10 grams of each sample was split off using a sample splitter and poured into a crucible. The weight of the crucible plus that of the sample was recorded. Samples were placed into a drying oven at 105 °C for 24 hours in order to evaporate any hygroscopic water. Samples were removed from the oven and placed into a desiccator and allowed to cool. Once cool, each crucible was weighed again. The moisture correction factor (MCF) was calculated by the following formula:
  • 9. 9 MCF = 1- Weight of air dry soil – weight of oven dry soil Weight of oven dry soil The MCF was multiplied by the initial 60.00 g of material to determine the corrected total initial sample weight for each sample. This was the weight used in all calculations involving the total sample. RESULTS Site Hydrology Results of the well readings are shown in Figure 9. Due to the high water table and the cold winter, water level data was not obtained from January through April 2014 because of the wells being frozen. Penetrometer Readings Results of penetrometer readings are presented in Table 1. Measurements are in kg/cm². Gravel Separation Results of the gravel separation are presented in Tables 2 and 3. Although particles with a diameter greater than 2 mm had been removed for particle size analysis, their mass was recorded in order to determine the sample fraction of this size as a means to potentially aid in differentiating stratigraphic units at the site. Moisture Correction Factor Results for the MCF are presented in Tables 4 and 5. Obtaining the MCF and subsequently the corrected mass of the sample prevented skewed results in further analyses. The mass of the hygroscopic water that was tightly held by polar clay particles was determined by the difference between mass of the oven-dried sample and that of the
  • 10. 10 air-dried sample, which was found by dividing the mass of the air-dried sample by the mass of the oven-dried sample. Particle Size Analysis Percentages of sand, silt, and clay are indicated in Tables 6 and 7. The percent sand of each sample was determined by comparing the weight percentage of the corrected total sample weight, and it is shown in Tables 8 and 9. The clay weight was obtained by the 6 hr and 52 min hydrometer reading and the silt weight was obtained by subtracting the clay and sand weight from the corrected sample weight. Sand weights for each 0.5 phi size interval are shown in Tables 10 and 11. Stratigraphic Units The Bottineau quicksand site was split into two distinct stratigraphic units based upon physical descriptions of the sediments and particle size analysis. Stratigraphic Unit One Strat unit one contained the material from 120 cm to the base of the core in B1. In core B4 Strat unit I contained the material from 160 cm to the base of the core. The material was bluish to greenish-gray and showed silt to medium sand lamina. It contained medium to fine cobbles and very obvious fractures that were observable in the auger samples. Stratigraphic Unit Two Strat unit two (surface to 120 cm depth) ranged in thickness from 120 cm in B1 to 100 cm thick in B4. The sediment was predominately gray to grayish brown, showed mottles within the samples, and was stratified. It contained pebbles ranging from fine to 5
  • 11. 11 cm in diameter. This unit contained a relatively small amount of silt and relatively large percentage of sands and clays (Figures 11 and 12). DISCUSSION During field sampling two stratigraphic layers were observed, and this was confirmed by further analysis. The lower-most unit, Strat Unit I, was massive, over- compacted, and very dense. It had obvious joints or fractures and discontinuous sand lenses. Strat Unit II was stratified and less dense. It lacked the joints that were present in Strat Unit I. Strat Unit I was interpreted to be a lodgement till deposited beneath a glacier. Strat Unit II was interpreted to be a supra-glacial melt out till, sediment on the surface of the glacier that collapsed as the ice melted (Figure 13). There also may be younger slope wash material within Strat Unit II. Figure 14 represents the stratigraphy of the site based on field observations. Strat Unit I is over lain by Strat Unit II, a supra-glacial till. Both wells B1 and B2 extended into Strat Unit I, while well B4 extended only into the upper part of Strat Unit I. Well B3 extended only into Strat Unit II. Figure 15 represents distribution of glacial ice over Bottineau County 12,500 years ago. This is when Strat Unit I apparently was deposited beneath the glacial ice. Figure 16 represents the distribution of glacial ice over Bottineau County 11,000 years ago. According to Figure 16, quicksand site must have been located under stagnant ice where supra-glacial meltout till would have been deposited. This is when Strat Unit II is believed to have been deposited. Hydrometer analysis for B1 (Figure 13) suggests that sand and silt stringers did not have a major impact on that area. According to the hydrometer analysis in sample B4
  • 12. 12 depths 140-160 cm, there was a spike in the percentage of silt (62%). This suggests possible deposition in a pond or near-shore glacial Lake Souris. Figure 17 suggests that ground water does follow the topography of the land surface. Data for this image were obtained from the North Dakota State Water Commission Web site (NDSWC 2014). Precipitation falling on the Turtle Mountains infiltrates the soil and travels vertically until it reaches the ground water table and then begins to travel horizontally toward the studied quicksand site. These factors suggest that somewhere between the site and the Turtle Mountains, the water moves on top of Strat Unit I and continues to travel horizontally within Strat Unit II, but remains on top of Strat Unit I. Strat Unit I may have been fractured and displaced in some areas due to the heavy glacier causing shearing of Strat Unit I 12,500 years ago. As the water reaches the south side of the quicksand site, where it is believed that it encounters Strat Unit I and can no longer travel horizontally, thus being forced upwards towards the surface and creating the mounds of sediment and quicksand processes observed (Figure 18). For wells B4 and B3, the vertical hydraulic gradient is 1.2, which indicates a very large downwards gradient and most likely a perched water table. CONCLUSION Although it is not possible to be 100% certain that it is local geologic conditions generating quicksand at this site, the results do strongly suggest that past basal deformation processes at the landscape scale have contributed to liquefaction processes at the site. The horizontal flow off of the Turtle Mountains and the abundance of flowing artesian wells in the area add to the evidence that water is being forced upward to land surface.
  • 13. 13 AKNOWLEDGMENTS I would like to thank Dr. Krieg for helping me with my senior research project. Mr. McKay, the land owner next to our study site. Dr. Crackel and Dr. Royer for all the help in senior seminar. Dr. Kilroy for helping with the hydrology side of the study.
  • 14. 14 REFERENCES Allred J., Barry. 2000. Survey of Fractured Glacial Till Geotechnical Characteristics: Hydraulic Conductivity, Consolidation, and Shear Strength. Vol 100:1-11p Bluemle JP. 1985. Geology of Bottineau County, North Dakota. North Dakota Geological Survey Bulletin 78 Part 1. North Dakota State Water Commission County Groundwater Studies 35 Part I Bouyoucos GJ. 1927. The hydrometer method for the Mechanical Analysis of Soils. Soil Science 26, 233 – 238. Bouyoucos GJ. 1951. A Recalibration of the Hydrometer Method for Making Mechanical Analysis of Soils. Agronomy Journal 43, 435 – 438. Bouyoucos GJ. 1962. Hydrometer Method Improved for Making Particle Size Analyses of Soils. Agronomy Journal 54, 464 – 465. Randich PG, Kuznair RL. 1984. Geology of Bottineau County, North Dakota. North Dakota Geological Survey Bulletin 78. Part III. North Dakota State Water Commission County Groundwater Studies 35 Part III.. [GEOL] Geology Home Page. http://geology.com/usgs/liquefaction/ [updated 2014] Accessed 2014 Jan 30. [GWM] Ground Water Movement http://www.co.portage.wi.us/groundwater/undrstnd/gwmove.htm Accessed 2014 Jan 30. [NDSWC] North Dakota State Water Commission http://www.swc.state.nd.us/4dlink9/4dcgi/GetSubCategoryRecord/Map%20and% 20Data%20Resources/MapServices [updated 2011] Accessed 2014 Jan 30. [UWCE] University of Washington Civil Engineering Home Page http://www.ce.washington.edu/~liquefaction/html/what/what1.html [updated 2000] Accessed 2014 Jan 30.
  • 15. 15 [USGS]United States Geologic Survey Water Science School home page. http://ga.water.usgs.gov/edu/gwartesian.html [updated 2014] Accessed 2014 Jan 30. Figure 1. Bottineau County indicated by the hash marks. The town of Bottineau is indicated by the blue square and the city of Minot is indicated by the red dot. Figure modified from Bluemle (1985).
  • 16. 16 Figure 2. Bottineau is indicated by the maroon dot. The study site is indicated by the red pin. The Turtle Mountains are the darker shade of green and the Canadian border is represented by the yellow line. Figure taken from Google Earth (2014).
  • 17. 17 Figure 3. The red line is an approximate outline of the study area. Modified image from Google Earth (2014).
  • 18. 18 Figure 4. Generalized surficial geology of Bottineau County. Figure modified from Bluemle (1985).
  • 19. 19 Figure 5. The top right overlay shows the approximate area where the samples (B4, B2, and B5) and wells (B1, B2, B3, and B4) were located. Modified image from Google Earth (2014).
  • 20. 20 Figure 6. Auger coring unit used to extract cores and place wells.
  • 21. 21 Figure 7. Locations of nested wells B1 through B4. Modified image from Google Earth (2014).
  • 22. 22 Figure 8. Piezometer perforations. Figure taken from http://www.equipcoservices.com/sales/solinst/601.html
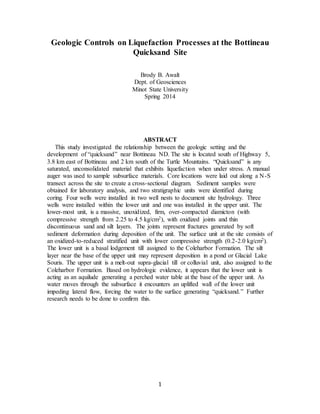
  • 23. 23 Figure 9. Water level readings measured in cm. 0 is ground level. Between 03 November 2014 and 14 December 2014. -325 -300 -275 -250 -225 -200 -175 -150 -125 -100 -75 -50 -25 0 25 Nov/3/13 Nov/17/13 Nov/31/13 Dec/14/13 WaterLevel(cm) WellReadings B1 B2 B3 B4
  • 24. 24 Figure 10. Pocket penetrometer measured in kg/cm². Figure taken from http://www.amazon.com/E-280-Pocket-Penetrometer/dp/B004NEG5B
  • 25. 25 Figure 11. Chart showing accumulative percentages of sand, silt, and clay as depth increases, across Strat Units I and II.
  • 26. 26 Figure 12. Chart showing cummulative percentages of silt, sand, and clay as depth increases, across Strat Units I and II.
  • 27. 27 Figure 13. Diagram showing deposition of lodgement and supra-glacial meltout till. Figure modified from British Society for Geomorphology (2012).
  • 28. 28 Figure 14. This diagram shows Strat Unit I on the south side of the quicksand site at a shallower depth then Strat Unit I on the north side of the quicksand site, indicating relative depth of wells B1, B2, B3, and B4.
  • 29. 29 Figure 15. The extent or maximum of the Wisconsin glacier around 12,000 years ago. This is when we believe Strat Unit I was deposited. The red dot is an approximate location of our study site. Figure modified from Bluemle (1985).
  • 30. 30 Figure 16. This image represents a slight retreat in the glacier approximately 11,000 years ago. This time frame is when it is believed Strat Unit II was deposited. The red dot is an approximate location of the study site. Figure modified from Bluemle (1985).
  • 31. 31 Figure 17. Cross section view of area north of studied quicksand site which is located at bottom left. Pentiometric surface is indicated by the blue line. Figure modified from Google Earth (2014).
  • 32. 32 Figure 18. Schematic-section of may occur beneath land surface. Blue triangles represent average water levels.
  • 33. 33 Compaction Readings B1-Soil Compaction Value B4-Soil Compaction Value Depth(cm) kg/cm² kg/cm² 0-20 0.20 0.00 20-40 0.23 0.00 40-60 1.25 0.50 60-80 1.75 0.75 80-100 2.00 1.25 100-120 2.00 1.50 120-140 2.25 1.50 140-160 2.50 1.50 160-180 3.00 1.75 180-200 3.00 1.75 200-220 3.25 220-240 3.25 240-260 3.25 260-280 3.75 280-300 3.75 300-320 4.50 320-340 4.50 Table 1. B1 and B4 compaction levels measured in kg/cm².
  • 34. 34 Weight of Gravel-B1 Sample Corrected Weight (g) Gravel Weight (g) 0-20 60.27 2.96 20-40 66.80 2.39 40-60 66.99 2.8 60-80 66.79 2.23 80-100 64.40 2.15 100-120 61.63 2.75 120-140 61.02 1.82 140-160 62.68 1.62 160-180 62.15 2.13 180-200 64.93 2.52 200-220 64.60 3.43 220-240 65.14 1.83 240-260 62.97 2.73 260-280 58.93 2.05 280-300 61.16 2.09 300-320 60.48 2.52 320-340 63.19 2.01 Table 2. B1 Weight of gravel in grams per sample in core from sample B1.
  • 35. 35 Weight of Grave-B4 Sample Corrected Weight (g) Gravel Weight (g) 0-20 49.95 14.75 20-40 49.79 5.51 40-60 49.77 3.69 60-80 49.40 1.21 80-100 49.58 11.49 100-120 45.88 2.34 120-140 49.00 3.85 140-160 47.66 0.01 160-180 45.44 1.22 180-200 47.98 1.96 Table 3. B4 Weight of gravel in grams per sample from core B4
  • 36. 36 Soil Moisture Correction Factor for Sample Core B1 Sample Crucible Weight (g) Crucible Plus Air Dry Soil Weight (g) Air Dry Soil Weight (g) Crucible Plus Oven Dry Soil Weight (g) Oven Dry Soil Weight (g) MCF Original Weight (g) Corrected Weight (g) 0-20 20.04 30.78 10.74 30.73 10.69 0.9953 60.55 60.27 20-40 19.32 29.89 10.57 29.87 10.55 0.9981 66.93 66.80 40-60 20.11 31.31 11.20 31.31 11.20 1.0000 66.99 66.99 60-80 21.10 32.06 10.96 32.06 10.96 1.0000 66.79 66.79 80-100 20.42 30.78 10.36 30.78 10.36 1.0000 64.40 64.40 100-120 20.32 30.39 10.07 30.39 10.07 1.0000 61.63 61.63 120-140 19.74 29.98 10.24 29.98 10.24 1.0000 61.02 61.02 140-160 19.27 29.77 10.50 29.77 10.50 1.0000 62.68 62.68 160-180 22.34 33.27 10.93 33.28 10.94 1.0009 62.09 62.15 180-200 20.48 30.09 9.61 30.09 9.61 1.0000 64.93 64.93 200-220 20.26 31.22 10.96 31.08 10.82 0.9872 65.44 64.60 220-240 20.49 30.97 10.48 30.96 10.47 0.9990 65.20 65.14 240-260 19.69 29.82 10.13 29.80 10.11 0.9980 63.09 62.97 260-280 19.79 29.96 10.17 29.88 10.09 0.9921 59.40 58.93 280-300 19.69 28.70 9.01 28.65 8.96 0.9945 61.50 61.16 300-320 20.78 31.60 10.82 31.58 10.80 0.9982 60.59 60.48 320-340 21.04 31.82 10.78 31.80 10.76 0.9981 63.31 63.19 Table 4. Moisture correction factor and corrected weight for sample B1.
  • 37. 37 Soil Moisture Correction Factor for Sample Core B4 Sample Crucible Weight (g) Crucible Plus Air Dry Soil Weight (g) Air Dry Soil Weight (g) Crucible Plus Oven Dry Soil Weight (g) Oven Dry Soil Weight (g) MCF Original Weight (g) Corrected Weight (g) 0-20 19.99 30.29 10.30 30.28 10.29 0.9990 70.74 49.95 20-40 21.58 31.41 9.83 31.37 9.79 0.9959 70.71 49.80 40-60 19.62 30.55 10.93 30.50 10.88 0.9954 65.92 49.77 60-80 19.87 29.06 9.19 28.95 9.08 0.9880 62.84 49.40 80-100 20.66 31.54 10.88 31.45 10.79 0.9917 63.41 49.59 100-120 19.02 29.47 10.45 28.61 9.59 0.9177 60.37 45.89 120-140 20.63 31.15 10.52 30.94 10.31 0.9800 60.14 49.00 140-160 21.64 31.26 9.62 30.81 9.17 0.9532 63.70 47.66 160-180 21.25 32.78 11.53 31.73 10.48 0.9089 69.48 45.45 180-200 19.17 29.59 10.42 29.17 10.00 0.9597 59.98 47.98 Table 5. Moisture correction factor and corrected weights for sample B4.
  • 38. 38 Hydrometer Texture Analysis for Sample Core B1 Sample (cm) Corrected Weight (g) 6 hour 52 Minute Reading (g/L) Blank Solution (g/L) Corrected 6 hour 52 Minute Reading (g/L) Sand Fraction Weight (g) Percent Sand Percent Silt Percent Clay 0-20 60.27 40 4 36 20.03 33 7 60 20-40 66.80 30 4 26 23.86 36 25 39 40-60 66.99 31 4 27 20.28 30 29 40 60-80 66.79 31 4 27 21.06 32 28 40 80-100 64.40 30 4 26 19.73 31 29 40 100-120 61.63 29 4 25 19.65 32 28 41 120-140 61.02 29 4 25 18.69 31 28 41 140-160 62.68 29 4 25 20.07 32 28 40 160-180 62.15 30 4 26 19.82 32 26 42 180-200 64.93 28.5 4 24.5 20.99 32 30 38 200-220 64.60 28 4 24 19.46 30 33 37 220-240 65.14 26 4 22 21 32 34 34 240-260 62.97 25 4 21 20.5 33 34 33 260-280 58.93 22 4 18 19.16 33 37 31 280-300 61.16 22 4 18 20.48 33 37 29 300-320 60.48 23 4 19 20.01 33 35 31 320-340 63.19 25 4 21 20.12 32 35 33 Table 6. Particle size analysis of B1 showing percent sand, silt, and clay in core samples from B1.
  • 39. 39 Hydrometer Texture Analysis for Sample Core B4 Sample (cm) Corrected Weight (g) 6 hour 52 Minute Reading (g/L) Blank Solution (g/L) Corrected 6 hour 52 Minute Reading (g/L) Sand Fraction Weight (g) Percent Sand Percent Silt Percent Clay 0-20 49.95 19 3 16 30.67 61 7 32 20-40 49.80 25 3 22 27.17 55 1 44 40-60 49.77 26 3 23 21.69 44 10 46 60-80 49.40 21 3 18 20.04 41 23 36 80-100 49.59 16 3 13 28.86 58 16 26 100-120 45.89 21 3 18 23.57 51 9 39 120-140 49.00 17.5 3 14.5 20.75 42 28 30 140-160 47.66 21 4 17 1.21 3 62 36 160-180 45.45 15.5 4 11.5 25.86 57 18 25 180-200 47.98 20 4 16 20.63 43 24 33 Table 7. Particle size analysis of B4 showing percent sand, silt, and clay in core samples from B4.
  • 40. 40 Percent Sand by Weight for Core Sample B1 Sample Beaker Weight (g) Sample Plus Beaker Weight (g) Sand Weight (g) Corrected Total Sample Weight (g) Percent Sand 0-20 110.34 130.37 20.03 60.55 33.08 20-40 112.19 136.05 23.86 66.93 35.65 40-60 114.09 134.37 20.28 66.99 30.27 60-80 113.11 134.17 21.06 66.79 31.53 80-100 113.16 132.89 19.73 64.40 30.64 100-120 106.16 125.81 19.65 61.63 31.88 120-140 110.34 129.03 18.69 61.02 30.63 140-160 112.19 132.26 20.07 62.68 32.02 160-180 114.09 133.91 19.82 62.09 31.92 180-200 113.11 134.1 20.99 64.93 32.33 200-220 113.16 132.62 19.46 65.44 29.74 220-240 106.16 127.16 21 65.20 32.21 240-260 113.11 133.61 20.5 63.09 32.49 260-280 113.16 132.32 19.16 59.40 32.26 280-300 112.19 132.67 20.48 61.50 33.30 300-320 114.09 134.1 20.01 60.59 33.03 320-340 110.34 130.46 20.12 63.31 31.78 Table 8. Percent sand by mass for sample B1.
  • 41. 41 Percent Sand by Weight for Core Sample B4 Sample Beaker Weight (g) Sample Plus Beaker Weight (g) Sand Weight (g) Corrected Total Sample Weight (g) Percent Sand 0-20 111.98 142.57 30.59 49.95 61.24 20-40 113.22 140.39 27.17 49.80 54.56 40-60 114.03 135.72 21.69 49.77 43.58 60-80 111.13 131.17 20.04 49.40 40.57 80-100 114.71 143.57 28.86 49.59 58.20 100-120 106.16 129.73 23.57 45.89 51.37 120-140 112.19 132.94 20.75 49.00 42.35 140-160 106.16 107.37 1.21 47.66 2.54 160-180 114.03 139.89 25.86 45.45 56.90 180-200 111.13 131.76 20.63 47.98 42.99 Table 9. Percent sand by mass for sample B4.
  • 42. 42 B1 Sieve size (Phi) 10 14 18 25 35 45 60 80 120 170 230 Pan Total Sample Weight (g) 0-20 0 0.5 0.8 0.8 1.2 1.5 2.2 2.1 3.2 2.7 3.3 0.9 19.2 20-40 0 0.3 0.6 1 1.7 2.3 3.5 2.9 3.9 2.6 3 1.3 23.1 40-60 0 0.3 0.7 0.7 1.1 2.2 2.2 3.3 2.8 3.4 3.4 1.3 21.4 60-80 0 0.5 0.7 0.8 1.1 1.5 2.2 2.2 3.5 3.1 3.8 1.3 20.7 80-100 0 0.5 0.5 0.8 1.1 1.4 2 2 3.3 2.8 3.7 1.1 19.2 100-120 0 0.3 0.6 0.7 1.1 1.4 2 2 3.3 2.9 3.6 0.7 18.6 120-140 0 0.3 0.5 0.7 1 1.4 2 2 3.3 2.9 3.4 0.7 18.2 140-160 0 0.5 0.5 0.6 1 1.3 2 2 3.3 2.9 3.7 1.8 19.6 160-180 0 0.5 0.6 0.7 1 1.3 2 2 3.5 3 3.7 1.3 19.6 180-200 0 0.3 0.6 0.8 1.2 1.4 2.1 2.1 3.6 3 3.9 1.4 20.4 200-220 0 0.3 0.5 0.7 1 1.3 2 2 3.3 2.8 3.5 0.8 18.2 220-240 0 0.4 0.6 0.8 1.1 1.4 2 2.1 3.6 3.2 3.9 1.3 20.4 240-260 0 0.5 0.6 0.7 1 1.3 2 2 3.4 3 3.8 1.9 20.2 260-280 0 0.4 0.6 0.7 0.9 1.3 1.9 1.9 3.3 2.8 3.5 1.2 18.5 280-300 0 0.5 0.6 0.6 1 1.3 2 2 3.4 2.9 3.7 1.7 19.7 300-320 0 0.4 0.6 0.8 1.1 1.4 2 2 3.3 2.9 3.7 1.8 20 320-340 0 0.5 0.7 0.9 1.1 1.4 2.1 2.1 3.4 3 3.8 1.1 20.1 Table 10. Sand mass of each 0.5 phi interval for core sample B1.
  • 43. 43 B4 Sieve size (Phi) 10 14 18 25 35 45 60 80 120 170 230 Pan Total Sample Weight (g) 0-20 0 1 1.7 2.1 3 3.6 4.8 3.6 4.2 2.4 2.6 0.6 29.6 20-40 0 1 1.7 2.3 3.2 3.8 4 2.4 2.8 1.9 2.4 0.7 26.2 40-60 0 0.5 0.8 1 1.6 1.9 2.4 2.2 3.4 2.8 3.4 1.1 21.1 60-80 0 0.3 0.4 0.6 1 1.2 2 2 3.6 3 3.8 1.2 19.1 80-100 0 0.6 1.2 1.4 2 2.4 3 2.6 4.1 3.7 4.7 2.4 28.1 100-120 0 0.5 0.7 0.9 1.3 1.7 2.6 2.5 4.2 3.4 4.2 1.1 23.1 120-140 0 0.5 0.6 0.6 1 1.3 2 2 3.5 3.3 4.3 1.2 20.3 140-160 0 0 0 0 0 0 0 0 0.1 0.1 0.8 0.3 1.3 160-180 0 0.2 0.3 0.3 0.5 0.7 1.4 2.1 5.4 5.4 6.9 1.5 24.7 180-200 0 0.3 0.6 0.7 1.1 1.6 2.6 2.4 3.6 2.7 3.1 0.7 19.4 Table 11. Sand mass for each 0.5 phi interval for core sample B4.