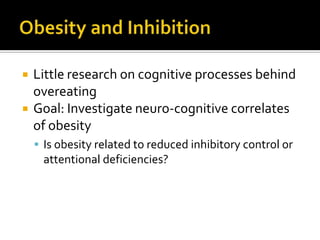
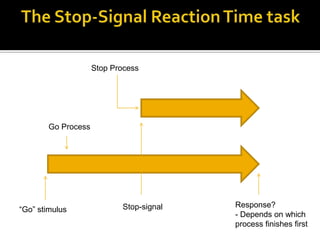
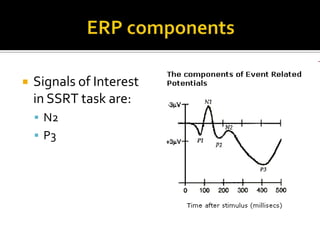
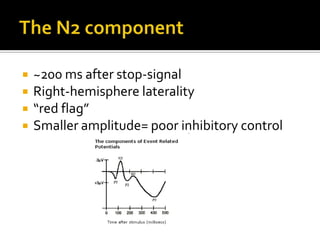
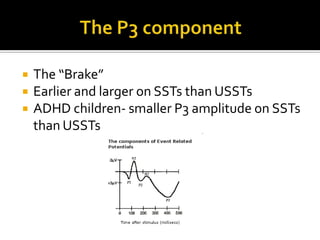
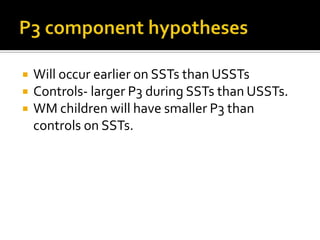
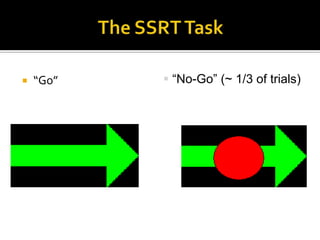
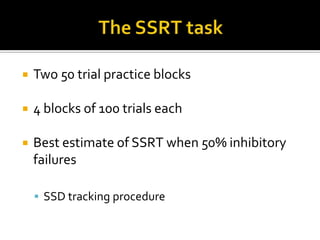
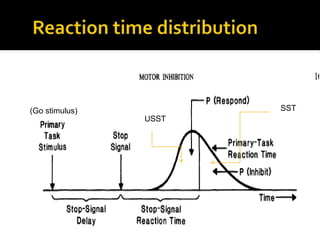
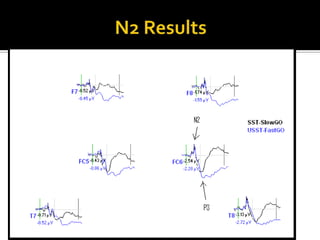
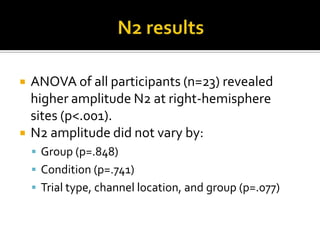
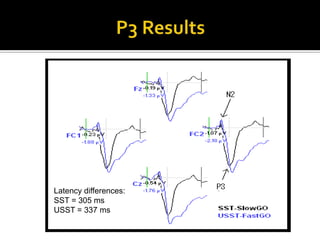
Electrophysiological Measures of Inhibitory Control in Childhood ObesityB y Robert HendersonUnder the direction of Dr. Robert Simons.
Obesity: A major problemAssociated with many health problemsOver 1/3 of US adults are obese> 30% of children above 85th percentile of BMI for ageDelaware ranked 19th in US for rates of childhood obesity
Obesity and Inhibition Little research on cognitive processes behind overeatingGoal: Investigate neuro-cognitive correlates of obesityIs obesity related to reduced inhibitory control or attentional deficiencies?
Research done so farOverweight children tend to respond more impulsively on a variety of tasksDieting associated with poor performance on cognitive tasksResearch on cognitive processes  more effective treatmentsNeurobehavioral Therapies/CCT
The Stop-Signal Reaction Time task	Stop ProcessGo ProcessResponse? Depends on which process finishes firstStop-signal“Go” stimulus
The Race Model2 assumptions:Go and stop processes are independentTime needed for processing stop-signal is constantRace between “go” and “stop” processesUnsuccessful Stop Trial (USST)- “go” processes finish first, responseSuccessful Stop Trial (SST)- “stop” processes finish first, no response
SSRT hypothesesSSRT is an estimation of the amount of time needed for the stop process to reach completionLonger SSRT= behavioral evidence of reduced inhibitory control1. Weight Management (WM) participants will have longer SSRTs than normal-weight controls2. WM participants with higher BMIs will have longer SSRTs.
Electrophysiological MethodsSSRT = global inhibitionEvent-related Potentials (ERPs) Description of underlying processes during the SSRT task
EEGEEG= ElectroencephalographyMeasures electrical activity of the brainMeasure with multiple electrodesNeed to eliminate background “noise”
What it looks like
ERPsEvent-Related PotentialsAllow mixed-trial analysisEEGs are time-locked to a stimulus and averaged over many trialsReflective of electrical charges associated with a given stimulusRepresent cognitive processes
ERP componentsSignals of Interest in SSRT task are:N2P3
The N2 component	~200 ms after stop-signalRight-hemisphere laterality“red flag” Smaller amplitude= poor inhibitory control
N2 component hypothesesControl children will have greater N2 amplitudes in right-hemisphere locationsWM children will have decreased N2 amplitudes compared to controls
The P3 componentThe “Brake”Earlier and larger on SSTs than USSTsADHD children- smaller P3 amplitude on SSTs than USSTs
P3 component hypothesesWill occur earlier on SSTs than USSTsControls- larger P3 during SSTs than USSTs. WM children will have smaller P3 than controls on SSTs.
ParticipantsWeight Management Group (21)Ages 7-17In a WM program at a local hospital Control Group (15)Ages 7-17From surrounding communityMatched
The SSRT Task“Go”  “No-Go” (~ 1/3 of trials)The SSRT taskTwo 50 trial practice blocks4 blocks of 100 trials eachBest estimate of SSRT when 50% inhibitory failuresSSD tracking procedure
Reaction time distribution	SST(Go stimulus)USST
Electrophysiological Recording32-channel shielded waveguard electrode capGel used as conducting agentImpedances <20 KΩ
Data Reduction & Analysis“stop” and “go” ERPs need to be separated “go” ERPs:“Fast-go” – quick response to go stimulus“Slow-go” – slow response to go stimulusDifference waves- ERPs to the stop-signalSST- slow-goUSST- fast-go
Quantifying ERP componentsAnalyze point at which waveform reaches minimum N2 amplitude and maximum P3 amplitude2 windows:P3: 250-400 msN2: 120-200 msBaseline correction:Subtract mean activity from 0-200 ms
Statistical AnalysisIndependent samples t-test of group SSRT differencesSimple correlations of age-adjusted BMI and SSRTs for WM participantsANOVA comparisons of N2 and P3 quantified scores
Behavioral ResultsNo significant different in SSRT between groups (p=.195)No correlation between age-adjusted BMI and SSRT values (p=.974)
ERP Results11 WM and 12 controlsDue to removal of unusable dataNo significant SSRT differences between WM and control participants remaining (p=.756)
N2 Results
N2 resultsANOVA of all participants (n=23) revealed higher amplitude N2 at right-hemisphere sites (p<.001). N2 amplitude did not vary by:Group (p=.848)Condition (p=.741)Trial type, channel location, and group (p=.077)
P3 ResultsLatency differences:SST = 305 msUSST = 337 ms
P3 resultsSST latency= 304.965 msUSST latency= 337.389 msSignificant latency difference (p<.005)No significant group difference on P3 latency for either trial typeNo group difference on amplitude (p=.515) or as a function of trial type (p=.714)
DiscussionSSRT Procedure worked as expectedTrend: slower SSRTs in WM than controlsN2 “flag” present in right-hemisphereNo group or amplitude differencesP3 earlier on SST than USSTNo group or amplitude differences
LimitationsSmall sample sizesRemoval of participants from ERP analysisRemoved WM participants had higher SSRTsOnly looked at general inhibitory control
Future ResearchSpecific inhibitory deficit to food stimuliIs it a cue-related deficit?Include :Food cuesPositive attention-grabbing cuesNeutral cues
ReferencesAlbrecht, B., Banaschewski, T., Brandeis, D., Heinrich, H., & Rothenberger, A. (2005). Response inhibition deficits in externalizing child psychiatric disorders: An ERP study with the Stop-task. Behavioral and Brain Functions, 9, 1-22Banaschewski, T. & Brandeis, D. (2007). Annotation: What electrical brain activity tells us about brain function that other techniques cannot tell us – a child psychiatric perspective. Journal of Child Psychology and Psychiatry. 48, 415-435. Band, G. P. H., Maurits, W. M., Logan, G. D. (2003). Horse-race model simulations of the stop-signal procedure. Acta Psychologica, 112, 105-142. Braet, C., Claus, L., Verbeken, S., & Vlierberghe, L. V. (2007). Impulsivity in overweight children. European Child & Adolescent Psychiatry. 16, 473-483. DeJong, R., Coles, M. H., Logan, G. D., & Gratton, G. (1990). In search of the point of no return: the control of response processes. Journal of Experimental Psychology: Human Perception and Performance. 16, 164-182.
References (continued)Kemps, E., Tiggemann, M., & Marshall, K. (2005). Relationship between dieting to lose weight and the functioning of the central executive. Appetite.45, 287-294.
Kok, A., Ramautar, J. R., Deruiter, M. B., Band, G. H., & Ridderinkhof, K. R. (2004). ERP components associated with successful and unsuccessful stopping in a stop-signal task. Psychophysiology. 41, 9-20.
Krompinger, J. (in prep) Towards a Comprehensive Electrophysiological Investigation of Cognitive Control In Depression

Senior Thesis Presentation Final

  • 1.
    Electrophysiological Measures ofInhibitory Control in Childhood ObesityB y Robert HendersonUnder the direction of Dr. Robert Simons.
  • 2.
    Obesity: A majorproblemAssociated with many health problemsOver 1/3 of US adults are obese> 30% of children above 85th percentile of BMI for ageDelaware ranked 19th in US for rates of childhood obesity
  • 3.
    Obesity and InhibitionLittle research on cognitive processes behind overeatingGoal: Investigate neuro-cognitive correlates of obesityIs obesity related to reduced inhibitory control or attentional deficiencies?
  • 4.
    Research done sofarOverweight children tend to respond more impulsively on a variety of tasksDieting associated with poor performance on cognitive tasksResearch on cognitive processes  more effective treatmentsNeurobehavioral Therapies/CCT
  • 5.
    The Stop-Signal ReactionTime task Stop ProcessGo ProcessResponse? Depends on which process finishes firstStop-signal“Go” stimulus
  • 6.
    The Race Model2assumptions:Go and stop processes are independentTime needed for processing stop-signal is constantRace between “go” and “stop” processesUnsuccessful Stop Trial (USST)- “go” processes finish first, responseSuccessful Stop Trial (SST)- “stop” processes finish first, no response
  • 7.
    SSRT hypothesesSSRT isan estimation of the amount of time needed for the stop process to reach completionLonger SSRT= behavioral evidence of reduced inhibitory control1. Weight Management (WM) participants will have longer SSRTs than normal-weight controls2. WM participants with higher BMIs will have longer SSRTs.
  • 8.
    Electrophysiological MethodsSSRT =global inhibitionEvent-related Potentials (ERPs) Description of underlying processes during the SSRT task
  • 9.
    EEGEEG= ElectroencephalographyMeasures electricalactivity of the brainMeasure with multiple electrodesNeed to eliminate background “noise”
  • 10.
  • 11.
    ERPsEvent-Related PotentialsAllow mixed-trialanalysisEEGs are time-locked to a stimulus and averaged over many trialsReflective of electrical charges associated with a given stimulusRepresent cognitive processes
  • 12.
    ERP componentsSignals ofInterest in SSRT task are:N2P3
  • 13.
    The N2 component ~200ms after stop-signalRight-hemisphere laterality“red flag” Smaller amplitude= poor inhibitory control
  • 14.
    N2 component hypothesesControlchildren will have greater N2 amplitudes in right-hemisphere locationsWM children will have decreased N2 amplitudes compared to controls
  • 15.
    The P3 componentThe“Brake”Earlier and larger on SSTs than USSTsADHD children- smaller P3 amplitude on SSTs than USSTs
  • 16.
    P3 component hypothesesWilloccur earlier on SSTs than USSTsControls- larger P3 during SSTs than USSTs. WM children will have smaller P3 than controls on SSTs.
  • 17.
    ParticipantsWeight Management Group(21)Ages 7-17In a WM program at a local hospital Control Group (15)Ages 7-17From surrounding communityMatched
  • 18.
    The SSRT Task“Go” “No-Go” (~ 1/3 of trials)The SSRT taskTwo 50 trial practice blocks4 blocks of 100 trials eachBest estimate of SSRT when 50% inhibitory failuresSSD tracking procedure
  • 19.
  • 20.
    Electrophysiological Recording32-channel shieldedwaveguard electrode capGel used as conducting agentImpedances <20 KΩ
  • 21.
    Data Reduction &Analysis“stop” and “go” ERPs need to be separated “go” ERPs:“Fast-go” – quick response to go stimulus“Slow-go” – slow response to go stimulusDifference waves- ERPs to the stop-signalSST- slow-goUSST- fast-go
  • 22.
    Quantifying ERP componentsAnalyzepoint at which waveform reaches minimum N2 amplitude and maximum P3 amplitude2 windows:P3: 250-400 msN2: 120-200 msBaseline correction:Subtract mean activity from 0-200 ms
  • 23.
    Statistical AnalysisIndependent samplest-test of group SSRT differencesSimple correlations of age-adjusted BMI and SSRTs for WM participantsANOVA comparisons of N2 and P3 quantified scores
  • 24.
    Behavioral ResultsNo significantdifferent in SSRT between groups (p=.195)No correlation between age-adjusted BMI and SSRT values (p=.974)
  • 25.
    ERP Results11 WMand 12 controlsDue to removal of unusable dataNo significant SSRT differences between WM and control participants remaining (p=.756)
  • 26.
  • 27.
    N2 resultsANOVA ofall participants (n=23) revealed higher amplitude N2 at right-hemisphere sites (p<.001). N2 amplitude did not vary by:Group (p=.848)Condition (p=.741)Trial type, channel location, and group (p=.077)
  • 28.
  • 29.
    P3 resultsSST latency=304.965 msUSST latency= 337.389 msSignificant latency difference (p<.005)No significant group difference on P3 latency for either trial typeNo group difference on amplitude (p=.515) or as a function of trial type (p=.714)
  • 30.
    DiscussionSSRT Procedure workedas expectedTrend: slower SSRTs in WM than controlsN2 “flag” present in right-hemisphereNo group or amplitude differencesP3 earlier on SST than USSTNo group or amplitude differences
  • 31.
    LimitationsSmall sample sizesRemovalof participants from ERP analysisRemoved WM participants had higher SSRTsOnly looked at general inhibitory control
  • 32.
    Future ResearchSpecific inhibitorydeficit to food stimuliIs it a cue-related deficit?Include :Food cuesPositive attention-grabbing cuesNeutral cues
  • 33.
    ReferencesAlbrecht, B., Banaschewski,T., Brandeis, D., Heinrich, H., & Rothenberger, A. (2005). Response inhibition deficits in externalizing child psychiatric disorders: An ERP study with the Stop-task. Behavioral and Brain Functions, 9, 1-22Banaschewski, T. & Brandeis, D. (2007). Annotation: What electrical brain activity tells us about brain function that other techniques cannot tell us – a child psychiatric perspective. Journal of Child Psychology and Psychiatry. 48, 415-435. Band, G. P. H., Maurits, W. M., Logan, G. D. (2003). Horse-race model simulations of the stop-signal procedure. Acta Psychologica, 112, 105-142. Braet, C., Claus, L., Verbeken, S., & Vlierberghe, L. V. (2007). Impulsivity in overweight children. European Child & Adolescent Psychiatry. 16, 473-483. DeJong, R., Coles, M. H., Logan, G. D., & Gratton, G. (1990). In search of the point of no return: the control of response processes. Journal of Experimental Psychology: Human Perception and Performance. 16, 164-182.
  • 34.
    References (continued)Kemps, E.,Tiggemann, M., & Marshall, K. (2005). Relationship between dieting to lose weight and the functioning of the central executive. Appetite.45, 287-294.
  • 35.
    Kok, A., Ramautar,J. R., Deruiter, M. B., Band, G. H., & Ridderinkhof, K. R. (2004). ERP components associated with successful and unsuccessful stopping in a stop-signal task. Psychophysiology. 41, 9-20.
  • 36.
    Krompinger, J. (inprep) Towards a Comprehensive Electrophysiological Investigation of Cognitive Control In Depression

Editor's Notes

  • #3 According to CDC Coronary heart disease, stroke, type 2 diabetes, hypertension, some types of cancers (Levi, Segal, &amp; Gadola, 2007)Adult population has become heavier overall- those who were heaviest in 1980 have gotten much heavierObesity rates may actually be higher, because BMI is based off of self-report of height and weight (Levi, et. al., 2007)The high prevalence of obesity in the US and its association with negative health consequence makes understanding the factors that put one at risk for obesity important
  • #5 Overweight boys were more impulsiveConcluded that there may be a subgroup of overweight children who act impulsively. Female college-students who were dieting had worse performance on cognitive tasks. Research on cognitive processes  more effective treatmentsExample: Cognitive Control Training (CCT)Improves working memory, decreases depression, increases attentional control (Siegle, Chinassi, &amp; Thase, 2007)Could it teach children to shift attention to allow more efficient inhibitory control?
  • #6 Interrupt ongoing actions in response to presentation of a “stop-signal”“Stop-Signal Reaction Time” taskInterrupt an ongoing responseStop-signal delay (SSD) variesLong SSD – harder to inhibitShorter SSD- easier to inhibitSSRT= an estimate of the amount of time needed for the stop process to reach completion after presentation of the stop signal.
  • #8 The SSRT is a measurement of the amount of time needed for the stop process to reach completion after presentation of the stop signal. More inhibitory failures or a longer SSRT during the stop task would indicate behavioral evidence of a reduced level of inhibitory control. It was hypothesized that individuals going through the weight management program would have a longer SSRT during the stop task compared to normal-weight controls. It was further hypothesized that WM participants with higher BMIs would have longer SSRTs.
  • #9 Very accurate timing resolution- allows us to identify the precise timing of processes that are believed to be occuring but does not tell us exactly where the process is occuring- can only guess at locationMake distinctions between precise stages involved in response-inhibition
  • #10 Measures the electrical activity of neurons that are firing throughout the brain, not useful in and of itself because of all of the random electrical activity. Instead we can calculate ERPs to eliminate the background noise from electrical activity that is not related to a given stimulus.
  • #12 Mixed-trial analysis- can look at different types of trials within the same recorded EEG. I’ll be going more into how we obtain ERPs later, this is just to give you a general idea of what they are and what they represent.
  • #14 The “red flag” that signals triggering of inhibitory processesSmaller N2 associated with decreased behavioral performance on SSRT task
  • #16 The “brake” that puts inhibition processes into effect
  • #18 Enrolled in treatment and intervention at the Pediatric Weight Management Clinic at A.I. DuPont Hospital for ChildrenControls matched for age, sex, socioeconomic status
  • #19 “Go”Arrows point to left or right on center of screenPress left button if to left, right if to right “No-Go” (~ 1/3 of trials)After arrow is presented, red stop signal appearsSubjects try to inhibit their response to the arrow.(don’t press a button)
  • #20 Two 50 trial practice block4 blocks of 100 trials eachBest estimate of SSRT when 50% inhibitory failuresSSD tracking procedure:Successful Inhibition? Next SSD 50 ms longer because harder to inhibit when the Stop-signal comes on later in timeUnsuccessful Inhibition? Next SSD 50 ms shorter because easier to inhibit when the stop-signal comes on later in timeBy varying the SSD in this manner, it is more likely to get a 50% rate of inhibitory failures.
  • #21 The Stop signal delay varies. The SSRT is an estimation of the time needed for the stop processes to reach completion. USST occur when the participant responds despite a stop-signalSST occurs when the participant witholds their response to the stop-signal The location of the cutoff point depends on the stop-signal delay and the Stop-signal reaction time.
  • #23 Why do we need difference waves? Because the ERPs from the “go” and “stop” signals overlap- need to get the ERP elicited by the stop-signal. Difference waves let us remove the contamination of the go ERPs and leave us with “pure” stop-signal ERPs. There are two types of “go” ERPs: “Fast-go” ERPs are characterized by a quick response to the go stimulus whereas “Slow-go” ERPs occur when participants respond slowly to the go stimulus. To determine the cut-off point for fast and slow go ERPs, accuracy on stop-signal trials was calculated and multiplied by the number of “go” trials (i.e., trials in which a stop-signal did not occur). Responses that occurred earlier than this point were labeled “fast-go” ERPs and responses that occurred after this point were labeled as “slow-go” ERPs. USST with fast go because on USST there must have been a fast response to the go processSST with slow go because if go process takes longer then you’re more likely to inhibit
  • #27 Removed people for not responding on enough trials and for having too many artifacts in their ERP data
  • #28 ANOVA of all participants (n=23) revealed higher amplitude N2 at right-hemisphere sites (p&lt;.001). N2 amplitude did not vary by:Group (p=.848)Condition (p=.741)Trial type, channel location, and group (p=.077)
  • #30 SST latency= 304.965 msUSST latency= 337.389 msSignificant latency difference (p&lt;.005)No significant group difference on P3 latency for either trial typeNo group difference on amplitude (p=.515) or as a function of trial type (p=.714)
  • #35 Albrecht, B., Banaschewski, T., Brandeis, D., Heinrich, H., &amp; Rothenberger, A. (2005). Response inhibition deficits in externalizing child psychiatric disorders: An ERP study with the Stop-task. Behavioral and Brain Functions, 9, 1-22Banaschewski, T. &amp; Brandeis, D. (2007). Annotation: What electrical brain activity tells us about brain function that other techniques cannot tell us – a child psychiatric perspective. Journal of Child Psychology and Psychiatry. 48, 415-435. Band, G. P. H., Maurits, W. M., Logan, G. D. (2003). Horse-race model simulations of the stop-signal procedure. Acta Psychologica, 112, 105-142. Braet, C., Claus, L., Verbeken, S., &amp; Vlierberghe, L. V. (2007). Impulsivity in overweight children. European Child &amp; Adolescent Psychiatry. 16, 473-483. DeJong, R., Coles, M. H., Logan, G. D., &amp; Gratton, G. (1990). In search of the point of no return: the control of response processes. Journal of Experimental Psychology: Human Perception and Performance. 16, 164-182. Kemps, E., Tiggemann, M., &amp; Marshall, K. (2005). Relationship between dieting to lose weight and the functioning of the central executive. Appetite.45, 287-294.Kok, A., Ramautar, J. R., Deruiter, M. B., Band, G. H., &amp; Ridderinkhof, K. R. (2004). ERP components associated with successful and unsuccessful stopping in a stop-signal task. Psychophysiology. 41, 9-20. Krompinger, J. (in prep) Towards a Comprehensive Electrophysiological Investigation of Cognitive Control In DepressionLevi, J. Segal, L. M., &amp; Gadola, E. (2007). F as in fat: How obesity policies are failing in America. Report from Trust for America’s Health.Liotti, M., Pliszka, S. R., Perez, R., Kothmann, D., Woldorff, M. G. (2005). Abnormal brain activity related to performance monitoring and error detection in children with ADHD. Cortex. 41, 377-388.Liotti, M., Pliszka, S. R., Higgins, K., Perez, R., &amp; Semrud-Clikeman, M. (2010). Evidence for specificity of ERP abnormalities during response inhibition inADHD children: A comparison with reading disorder children without ADHD Logan, G. D., &amp; Cowan, W. B. (1984). On the ability to inhibit thought and action: A theory of an act of control. Psychological Review, 91, 295-327.Ogden C. L., Carroll M. D., McDowell M. A., Flegal K. M. Obesity among adults in the United States – no change since 2003—2004. (2007). NCHS data brief no 1. Hyattsville, MD: National Center for Health Statistics.Ogden C.L., Carroll M.D., Flegal K. M. (2008) High Body Mass Index for Age among US Children and Adolescents, 2003—2006. JAMA, 299(20):2401—2405.Pliszka, S. R., Liotti, M., &amp; Woldorff, M. G. (2000). Inhibitory control in children with attention-deficit/hyperactivity disorder: Event-related potentials identify the processing component and timing of an impaired right-frontal response-inhibition mechanism. Biological Psychiatry, 48, 238-246.Siegle, G. J., Ghinassi, F. &amp; Thase, M. E. (2007). Neurobehavioral therapies in the 21st century: Summary of an emerging field and an extended example of cognitive control training for depression. Cognitive Therapy and Research. 31, 235–262. . Stanley, M. (in prep)