Downloaded 299 times


![CANDIDATE REGION EXTRACTION
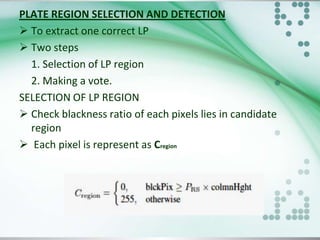
To find exact LP region from the image.
Process divide into four steps.
COUNT THE DRAWN LINES PER EACH ROW
No of horizontal lines in each rows are counted
Stored in a matrix variable : lines[a] ;a=0,1……m-1
Time consuming process.
DIVIDE THE IMAGE INTO MULTIGROUPS
To avoid delay, images convert to multiple groups
Stored value in a variable : groups
groups=height/C.
C=CRE Constant (10)](https://image.slidesharecdn.com/seminar-140309040532-phpapp01/85/Automatic-vehicle-license-plate-detection-using-VEDA-21-320.jpg)


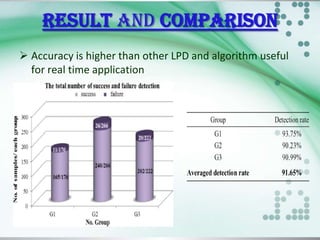


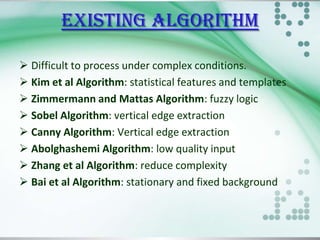
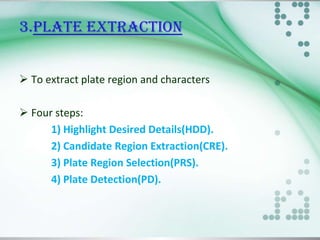
This document presents an automatic vehicle identification system using license plate detection. It proposes a new algorithm for license plate detection that uses edge detection and thresholding techniques. The algorithm has three main steps: license plate detection through edge extraction and thresholding, character segmentation, and character recognition. It was tested on images captured from a web camera and achieved an accuracy of 91.4% for real-time license plate detection, outperforming existing algorithms. The computation time of the new algorithm is 47.7 ms, which is 5-9 times faster than other existing methods.