Chapter 2 - Applying Quantitative Techniques
Section 12 - Systems and Quantitative Methods
Presented By :
This Content is Copyright Reserved Rights Copyright 2025@PTAIndia
Agenda
 Outline each step of the quantitative process
 Compare the use of trigger rules, filter rules and value
rules
 Contrast signal test results and select the most
appropriate
 Interpret trade measures, performance measures, and
accounting measures, including annualized return,
annualized volatility, total return, CAGR, maximum
drawdown, profit factor, and expected value
 Contrast the performance measures (Sharpe ratio,
Information ratio, Sortino ratio, and Calmar ratio)
This Content is Copyright Reserved Rights Copyright 2025@PTAIndia
Defining a Quantitative Strategy & The Full
Quantitative
Presented By :
This Content is Copyright Reserved Rights Copyright 2025@PTAIndia
Key Takeaways
📌 Understanding Quantitative Strategies
 A quantitative strategy uses mathematical and statistical models to make trading or
investment decisions.
 It is rule-based, systematic, and reduces emotional decision-making.
📌 The Full Quantitative Process
 Idea Generation: Identify a hypothesis or trading/investment idea.
 Data Collection & Cleaning: Obtain reliable financial data and preprocess it.
 Exploratory Data Analysis (EDA): Identify patterns, trends, and anomalies.
 Model Development: Build predictive models using statistical techniques or machine
learning.
This Content is Copyright Reserved Rights Copyright 2025@PTAIndia
Key Takeaways
📌 The Full Quantitative Process
 Backtesting: Test strategy performance on historical data.
 Risk Management: Implement controls like position sizing, stop-loss, and drawdown limits.
 Execution: Deploy the strategy in live markets with real capital.
 Monitoring & Optimization: Continuously refine based on market conditions.
📌 Challenges & Considerations
 Overfitting: Avoid excessive curve-fitting to historical data.
 Survivorship Bias: Ensure data includes delisted stocks.
 Slippage & Transaction Costs: Factor in real-world trading constraints.
 Market Regime Changes: Strategies may underperform in different market conditions.
This Content is Copyright Reserved Rights Copyright 2025@PTAIndia
Cheat Sheet
This Content is Copyright Reserved Rights Copyright 2025@PTAIndia
Step Key Actions Tools & Methods
Idea Generation
Identify market inefficiencies &
define hypotheses
Research papers, news, domain
knowledge
Data Collection
Gather price, volume, fundamentals,
alternative data
APIs (Yahoo Finance, Quandl)
EDA
Clean, visualize, and understand
data trends
Pandas, Matplotlib, Seaborn
Model Development
Apply statistical or ML models to find
patterns
Regression, Time Series, ML
models
Backtesting Simulate strategy on historical data Backtrader, Zipline, QuantConnect
Risk Management
Set stop-loss, max drawdown limits,
VaR analysis
Monte Carlo, Sharpe Ratio
Execution
Automate order placement with
execution logic
Algo trading platforms (IB, Alpaca)
Monitoring & Optimization
Track live performance and tweak
models
Logging, Model Retraining
Interpretation
 A good quantitative strategy should have a clear logic, be tested rigorously, and not rely
too much on parameter tuning.
 Backtesting performance ≠ future results, so robustness checks (e.g., walk-forward
analysis, Monte Carlo simulations) are essential.
 Risk-adjusted returns matter more than raw returns—metrics like the Sharpe Ratio,
Sortino Ratio, and Maximum Drawdown are crucial.
This Content is Copyright Reserved Rights Copyright 2025@PTAIndia
Case Study: Mean Reversion Strategy on S&P 500
📌 Objective
 Develop a mean-reversion trading strategy that buys S&P 500 stocks when they are
oversold and sells when they revert to the mean.
 Process
Step 1 : Idea Generation
 Stocks often revert to their mean after short-term deviations.
 Use RSI (Relative Strength Index) to identify oversold (RSI < 30) and overbought (RSI >
70) conditions.
Step 2 : Data Collection & Cleaning
 Download daily stock price data of S&P 500 constituents.
 Remove missing values and adjust for corporate actions.
This Content is Copyright Reserved Rights Copyright 2025@PTAIndia
Case Study: Mean Reversion Strategy on S&P 500
Step 3 : Exploratory Data Analysis (EDA)
 Check historical RSI patterns and price behavior after oversold conditions.
Step 4 : Model Development
 Define rules: Buy when RSI < 30, sell when RSI > 70.
 Set holding period to 5 days.
Step 5 : Backtesting
 Test performance from 2010-2023.
 Evaluate Sharpe Ratio and max drawdown.
This Content is Copyright Reserved Rights Copyright 2025@PTAIndia
Case Study: Mean Reversion Strategy on S&P 500
Step 6 : Risk Management
 Use stop-loss at -5%.
 Limit capital allocation per trade to 2% of the portfolio.
Step 7 : Execution & Monitoring
 Automate order execution via an API.
 Regularly update model with new data.
Results & Interpretation
 Strategy achieved CAGR of 12% with a Sharpe Ratio of 1.5.
 Worked well in sideways markets, struggled in strong trending markets.
 Improved performance by adding moving average confirmation.
This Content is Copyright Reserved Rights Copyright 2025@PTAIndia
Defining Your Rules
Presented By :
This Content is Copyright Reserved Rights Copyright 2025@PTAIndia
Key Takeaways
📌 Why Define Rules?
 Rules remove emotions from decision-making.
 Consistency leads to better performance tracking.
 Well-defined rules help in backtesting and optimization.
📌 Types of Trading Rules
 Entry Rules: When to buy or short an asset.
 Exit Rules: When to sell or cover a position.
 Risk Management Rules: Stop-loss, position sizing, drawdown limits.
 Execution Rules: How orders are placed (e.g., market, limit, VWAP).
This Content is Copyright Reserved Rights Copyright 2025@PTAIndia
Key Takeaways
📌 Essential Considerations
 Rules must be objective and measurable.
 Avoid excessive complexity (overfitting risk).
 Must be testable on historical data before deployment.
 Rules should align with strategy goals (e.g., trend-following vs. mean-reversion).
This Content is Copyright Reserved Rights Copyright 2025@PTAIndia
Cheat Sheet for Defining Rules
This Content is Copyright Reserved Rights Copyright 2025@PTAIndia
Category Example Rules Considerations
Entry Rules
"Buy when the 50-day MA crosses
above the 200-day MA."
Trend-following confirmation.
Exit Rules
"Sell when RSI > 70 or price drops
5% from entry."
Protects gains, avoids deep
pullbacks.
Risk Management
"Max risk per trade = 2% of
portfolio."
Avoids catastrophic losses.
Stop-Loss "Exit if price falls 8% from entry." Limits downside.
Take Profit "Sell at 15% gain or after 10 days." Locks in profits.
Execution
"Use limit orders 0.5% below market
price."
Reduces slippage and improves fills.
Interpretation
 Simple rules outperform overly complex ones because they adapt better to
changing markets.
 Rules should be systematically tested using different market conditions to ensure
robustness.
 Risk management rules are as important as entry/exit rules—protect capital first.
 Automating rules through algorithms minimizes human error and emotional bias.
This Content is Copyright Reserved Rights Copyright 2025@PTAIndia
Case Study: Trend-Following Rules on Nasdaq-100
📌 Objective
 Create a simple trend-following strategy using moving averages to capture large market
moves.
📌 Defined Rules
 Entry: Buy when the 50-day moving average crosses above the 200-day moving average
(Golden Cross).
 Exit: Sell when the 50-day moving average crosses below the 200-day moving average (Death
Cross).
 Risk Management:
 Stop-loss: 10% below entry price.
 Max drawdown: 15% portfolio loss before stopping trading.
 Execution: Use limit orders at the open price the next trading day.
This Content is Copyright Reserved Rights Copyright 2025@PTAIndia
Case Study: Trend-Following Rules on Nasdaq-100
📌 Backtesting Results (2005-2023)
 Annualized Return: 14.2%
 Max Drawdown: -18%
 Sharpe Ratio: 1.3
📌 Key Findings
✅ Captured long-term trends effectively.
❌ Underperformed in sideways/choppy markets.
🔄 Improvement: Added a volume filter to avoid false signals.
This Content is Copyright Reserved Rights Copyright 2025@PTAIndia
Signal Testing & Test Parameters
Presented By :
This Content is Copyright Reserved Rights Copyright 2025@PTAIndia
Key Takeaways
📌 What is Signal Testing?
 Signal testing is the process of evaluating whether a trading signal (e.g., from an
indicator or model) produces consistent, actionable, and profitable results.
 It involves backtesting signals over historical data to assess their reliability before
going live.
📌 Test Parameters
 Data Quality: Ensure clean, high-frequency data to reduce noise and bias.
 Time Period: Test over a range of market conditions (bullish, bearish, sideways)
and different timeframes (intraday, daily, weekly).
 Sample Size: Larger datasets give more reliable results, especially when testing
patterns.
This Content is Copyright Reserved Rights Copyright 2025@PTAIndia
Key Takeaways
📌 Test Parameters
 Out-of-Sample Testing: Split data into training (used for optimization) and testing
(used to evaluate performance).
 Risk Management: Include stop-loss, position sizing, and drawdown limits during
testing.
📌 Metrics to Evaluate Signals
 Profitability: Total returns and win rate.
 Risk-Adjusted Return: Sharpe ratio, Sortino ratio, etc.
 Drawdown: Maximum peak-to-valley loss during the test period.
 Consistency: Evaluate whether signals work across different market
environments. This Content is Copyright Reserved Rights Copyright 2025@PTAIndia
Cheat Sheet for Signal Testing & Test Parameters
This Content is Copyright Reserved Rights Copyright 2025@PTAIndia
Test Parameter Description Key Considerations
Time Period
The span of historical data used for
testing (e.g., 5 years).
Test during both bull & bear markets.
Sample Size
Number of data points (e.g., 1,000
trades or 10 years of data).
Larger sample reduces randomness.
Out-of-Sample Testing
Split data into training and testing
sets.
Avoid overfitting to historical data.
Risk Management
Rules for stop-loss, position sizing,
and maximum drawdown.
Ensure realistic trade execution.
Win Rate
Percentage of profitable trades out
of total trades.
Higher win rate ≠ better strategy.
Sharpe Ratio Measures return per unit of risk.
A Sharpe > 1 is usually considered
good.
Maximum Drawdown
The largest loss from peak to
trough.
Should be in line with risk tolerance.
Interpretation
 Overfitting Risk: Signal testing can lead to overfitting, where a strategy performs well on
historical data but fails in live markets due to too much reliance on noise or irrelevant factors.
Ensure robustness by out-of-sample testing.
 Risk-Adjusted Performance: Focus not only on returns but also on how much risk was
involved to achieve them. A strategy with high returns but high drawdowns may not be
sustainable.
 Win Rate vs. Profit Factor: A strategy with a low win rate but high risk-reward ratio can still
be profitable. It’s important to look at the Profit Factor (total profits divided by total losses)
alongside win rate.
 Simulating Real Trading Conditions: When testing, factor in transaction costs, slippage,
and liquidity. Unrealistic testing without these elements can lead to overoptimistic performance
projections.
This Content is Copyright Reserved Rights Copyright 2025@PTAIndia
Case Study: Signal Testing on RSI-based Strategy
📌 Objective
Test a Relative Strength Index (RSI)-based strategy for short-term mean reversion
on the S&P 500 ETF (SPY).
📌 Defined Rules for Signal
 Buy Signal: RSI < 30 (oversold condition).
 Sell Signal: RSI > 70 (overbought condition).
 Risk Management:
 Stop-loss at 5% below entry price.
 Position size: 2% of portfolio per trade.
 Maximum drawdown limit: 15% of the portfolio.
This Content is Copyright Reserved Rights Copyright 2025@PTAIndia
Case Study: Signal Testing on RSI-based Strategy
📌 Test Parameters
 Time Period: 10 years of SPY data (2013-2023).
 Sample Size: 2,500+ trades.
 Out-of-Sample Testing: Used 2013-2018 data for training, and 2019-2023 data for testing.
 Transaction Costs: Factored in $0.01 per share (typical for commission-free brokers).
 Risk-Adjusted Metrics: Focused on Sharpe ratio and maximum drawdown.
📌 Backtest Results
 Total Return: 60% (2013-2023).
 Win Rate: 54% (i.e., 54% of trades were profitable).
 Maximum Drawdown: -16% (max peak-to-valley loss).
 Sharpe Ratio: 1.1 (indicating decent risk-adjusted returns).
This Content is Copyright Reserved Rights Copyright 2025@PTAIndia
Case Study: Signal Testing on RSI-based Strategy
📌 Interpretation
 The strategy underperformed during trending markets (2017-2018), where the RSI signal was
frequently false due to persistent bullish momentum.
 The maximum drawdown was higher than expected (higher volatility) because the strategy didn’t
account for market trends. Adding a trend filter (e.g., 200-day moving average) improved
performance in the test.
 The strategy was profitable overall, but adjustments were needed to improve consistency in
various market regimes.
📌 Key Takeaways from Testing
✅ RSI-based mean reversion works well in sideways markets.
❌ Doesn’t perform well in strong trending markets (bull or bear).
🔄 Adding a trend filter (e.g., 200-day MA) helped mitigate false signals.
This Content is Copyright Reserved Rights Copyright 2025@PTAIndia
Defining Exits & Exit Rules
Presented By :
This Content is Copyright Reserved Rights Copyright 2025@PTAIndia
Key Takeaways
📌 Why Define Exit Rules?
 Exit rules are crucial for locking in profits and minimizing losses.
 A strategy is incomplete without a defined exit plan—when to sell is as important as
when to buy.
 Exit rules should be objective, clear, and testable to avoid emotional decision-making.
📌 Types of Exit Rules
 Profit-Taking (Take Profit): Define a target price or percentage gain to exit a position.
 Stop-Loss: Automatically exit a position if it moves against you by a predefined
amount.
 Time-Based Exit: Exit after a set amount of time (e.g., after 10 days).
This Content is Copyright Reserved Rights Copyright 2025@PTAIndia
Key Takeaways
📌 Types of Exit Rules
 Trailing Stop: A dynamic stop-loss that moves up with the price as it increases,
locking in profits as the price rises.
 Reversal or Signal-Based: Exit when a certain condition (like an indicator reversal) is
met (e.g., RSI crosses above 70).
📌 The Importance of Exits
 Exiting at the right time can maximize gains and minimize losses.
 Risk-to-reward ratio (e.g., 2:1) helps set realistic targets for exits. A high-risk exit may
not be worth the potential return.
This Content is Copyright Reserved Rights Copyright 2025@PTAIndia
Cheat Sheet for Defining Exit Rules
This Content is Copyright Reserved Rights Copyright 2025@PTAIndia
Exit Rule Type Example Considerations
Profit-Taking (Take Profit)
"Exit when price reaches a 10% gain
from entry."
Suitable for trend-following
strategies.
Stop-Loss
"Exit if the price falls 5% below entry
price."
Protects capital, reduces drawdown.
Trailing Stop
"Exit when price moves 5% below
the highest price achieved."
Locks in profits during strong moves.
Time-Based Exit "Exit after 10 trading days." Avoids overstay in weak trends.
Signal-Based "Exit when RSI crosses 70."
Useful for mean-reversion
strategies.
Exit on Reversal
"Exit if moving average crosses the
price from above."
Prevents holding through trend
reversals.
Interpretation
 Trade Management: Exits often determine the success or failure of a strategy. A tight
stop-loss may protect capital, but too tight a stop may cause premature exits during
normal market fluctuations.
 Risk-to-Reward Ratio: When defining exit rules, a typical ratio is 1:2 or 1:3 (risking
$1 to make $2 or $3). A strategy should have a higher reward than the potential risk
for long-term profitability.
 Adaptability: Exits may need to be adjusted based on market conditions. For
example, during high volatility, a wider stop-loss may be appropriate, while in stable
markets, a tighter stop-loss could suffice.
 Psychology: Exiting with a defined rule removes the emotional aspect of trading
(fear and greed), leading to more consistent results.
This Content is Copyright Reserved Rights Copyright 2025@PTAIndia
Case Study: Defining Exits in a Trend-Following Strategy
📌 Objective
Develop a trend-following strategy using moving averages and define clear exit rules to capture long-
term trends while protecting against large drawdowns.
📌 Strategy
 Entry Rules:
 Buy when the 50-day moving average crosses above the 200-day moving average (Golden
Cross).
 Sell when the 50-day moving average crosses below the 200-day moving average (Death Cross).
 Exit Rules:
 Profit-Taking: Exit when the position gains 15% from the entry point.
 Stop-Loss: Exit if the price falls 10% below entry.
This Content is Copyright Reserved Rights Copyright 2025@PTAIndia
Case Study: Defining Exits in a Trend-Following Strategy
📌 Strategy
 Exit Rules:
 Trailing Stop: Once the position reaches a 10% gain, set a trailing stop at 5% below the highest price
achieved.
 Time-Based Exit: Exit if the position has been held for 60 trading days.
 Risk Management:
 Limit portfolio exposure to 10% of total capital per trade.
📌 Test Parameters
 Data: 10 years of historical data on the S&P 500 Index (2013-2023).
 Sample Size: Over 250 trades.
 Out-of-Sample Testing: Used data from 2013-2018 for training, and 2019-2023 for testing.
 Transaction Costs: $0.01 per share, assuming commission-free trading.
This Content is Copyright Reserved Rights Copyright 2025@PTAIndia
Case Study: Defining Exits in a Trend-Following Strategy
📌 Backtest Results
 Total Return: 85% over 10 years.
 Win Rate: 63% (indicating a higher likelihood of profitable trades).
 Maximum Drawdown: -18% (within the acceptable risk threshold).
 Sharpe Ratio: 1.45 (strong risk-adjusted return).
📌 Interpretation
 The Profit-Taking rule helped lock in profits during significant rallies, while the Stop-Loss
rule limited downside during market corrections.
 The Trailing Stop was effective in locking in profits as the market moved in favor of the
trend, allowing the position to ride longer-term trends without risking too much on pullbacks.
This Content is Copyright Reserved Rights Copyright 2025@PTAIndia
Case Study: Defining Exits in a Trend-Following Strategy
📌 Interpretation
 The Time-Based Exit (after 60 days) was useful for avoiding overstaying in positions during
periods of consolidation, reducing exposure to sideways markets.
 The strategy performed well, especially in bullish markets, but the maximum drawdown was
larger than anticipated. A potential improvement could be adjusting the trailing stop to be
more sensitive to market reversals.
📌 Key Takeaways from Testing
 ✅ Profit-taking and trailing stops worked well in capturing trends.
 ❌ Maximum drawdown could be reduced by adjusting exit rules for volatile markets.
 🔄 Adding a volatility filter could improve exit timing in high-volatility environments.
This Content is Copyright Reserved Rights Copyright 2025@PTAIndia
Strategy Testing
Presented By :
This Content is Copyright Reserved Rights Copyright 2025@PTAIndia
Key Takeaways
📌 What is Strategy Testing?
 Strategy testing is the process of validating a trading or investment strategy using historical data to
assess its viability and performance before deploying it in live markets.
 This ensures that the strategy is robust, consistent, and aligned with your goals, reducing the risk of
unexpected outcomes.
📌 Steps in Strategy Testing
 Backtesting: Test your strategy on historical data to evaluate how it would have performed in the past.
 Out-of-Sample Testing: Split the data into training (used for optimization) and testing (used for
evaluation).
 Walk-Forward Testing: Continuously test the strategy on new, unseen data while re-optimizing at each
step.
 Paper Trading: Simulate the strategy in real-time with no actual capital on the line to ensure it performs
well in live conditions. This Content is Copyright Reserved Rights Copyright 2025@PTAIndia
Key Takeaways
📌 Key Metrics to Evaluate
 Total Return: The overall profit or loss generated by the strategy over a specific period.
 Win Rate: Percentage of trades that are profitable.
 Risk-Adjusted Return: Metrics like the Sharpe Ratio or Sortino Ratio to measure return relative to risk.
 Maximum Drawdown: The largest loss from peak to trough during the test period.
 Profit Factor: Total profit divided by total loss—higher values indicate better performance.
📌 Considerations for Robust Strategy Testing
 Data Quality: Ensure data used for testing is clean and adjusted for corporate actions like dividends and
stock splits.
 Transaction Costs: Include slippage, broker fees, and other costs that might affect execution.
 Overfitting Risk: Avoid tweaking parameters too much to match historical data—focus on robustness, not
perfection.
This Content is Copyright Reserved Rights Copyright 2025@PTAIndia
Cheat Sheet for Strategy Testing
This Content is Copyright Reserved Rights Copyright 2025@PTAIndia
Step Action Tools/Considerations
Backtesting
Test strategy on historical data
(typically 5-10 years).
Python (Backtrader, Zipline), R
(quantstrat)
Out-of-Sample Testing
Split data into training and testing
sets.
Use 70-80% for training, 20-30% for
testing.
Walk-Forward Testing
Test on rolling time windows (e.g., 6
months).
Simulate real-time optimization.
Paper Trading Simulate live trading with no risk.
Use platforms like TradingView,
ThinkOrSwim.
Transaction Costs Include slippage, commissions, etc.
Estimate based on broker’s fee
structure.
Risk Metrics
Evaluate with Sharpe Ratio,
Drawdown, and Win Rate.
Focus on consistency, not just
returns.
Interpretation
 Overfitting in Strategy Testing: The strategy might perform exceptionally well on historical data, but
that doesn’t guarantee future success. Be cautious about over-optimizing or fitting parameters that only
work on specific data sets.
 Robustness: A robust strategy performs well across different market conditions, asset classes, and time
periods. Don’t focus solely on past performance—consider how the strategy might perform in varied
conditions (e.g., bull, bear, and sideways markets).
 Risk-Adjusted Metrics: Pay attention to how much risk is taken to achieve returns. A strategy with a
high return but significant drawdowns might not be sustainable in the long run. Risk-adjusted return
metrics like the Sharpe Ratio are critical in this evaluation.
 Realism in Testing: Always incorporate transaction costs, slippage, and real-world market frictions in
your tests to ensure a realistic outlook for the strategy’s performance.
This Content is Copyright Reserved Rights Copyright 2025@PTAIndia
Case Study: Trend-Following Strategy Testing on SPY ETF
📌 Objective
Develop and test a simple moving average (SMA)-based trend-following strategy on the SPY ETF (S&P
500) to capture long-term market trends.
📌 Strategy
 Entry Rule: Buy when the 50-day moving average crosses above the 200-day moving average (Golden
Cross).
 Exit Rule: Sell when the 50-day moving average crosses below the 200-day moving average (Death
Cross).
 Risk Management:
 Stop-loss at 8% below the entry price.
 Max portfolio risk per trade: 5%.
 Timeframe: Test from 2013-2023.
This Content is Copyright Reserved Rights Copyright 2025@PTAIndia
Case Study: Trend-Following Strategy Testing on SPY ETF
📌 Testing Process
 Backtesting:
 Perform on the full historical dataset (2013-2023) of the SPY ETF.
 Total 2,500 trades simulated.
 Out-of-Sample Testing:
 Split data into 2013-2018 (training) and 2019-2023 (testing).
 Walk-Forward Testing:
 Conduct rolling tests over 6-month windows to account for market regime changes.
 Paper Trading:
 Simulate real-time execution with no capital at risk for 3 months in 2023.
This Content is Copyright Reserved Rights Copyright 2025@PTAIndia
Case Study: Trend-Following Strategy Testing on SPY ETF
📌 Backtest Results
 Total Return: 115% over 10 years.
 Win Rate: 68% (out of 2,500 trades, 68% were profitable).
 Maximum Drawdown: -12% (within acceptable range for trend-following).
 Sharpe Ratio: 1.45 (indicating strong risk-adjusted returns).
📌 Out-of-Sample Test Results
 Total Return: 10% (2019-2023).
 Drawdown: -9% (less than the backtest period).
 Sharpe Ratio: 1.35 (consistent with backtest).
This Content is Copyright Reserved Rights Copyright 2025@PTAIndia
Case Study: Trend-Following Strategy Testing on SPY ETF
📌 Walk-Forward Testing Results
 During the bullish period (2017-2021), the strategy outperformed.
 In sideways markets (2015, 2022), the strategy underperformed due to whipsaws.
 The strategy performed consistently with reasonable drawdowns, even during market
corrections.
📌 Interpretation
 The strategy’s total return was solid, with high consistency across the backtest and out-of-
sample periods.
 The maximum drawdown during the backtest was low, indicating good risk control, but the
strategy’s performance lagged during sideways markets. This is a common challenge for
trend-following strategies.
This Content is Copyright Reserved Rights Copyright 2025@PTAIndia
Case Study: Trend-Following Strategy Testing on SPY ETF
📌 Interpretation
 Walk-forward testing showed that the strategy was more robust during periods of strong
market trends but faced challenges in ranging markets (e.g., 2015 and 2022).
 The Sharpe Ratio was strong, indicating a good risk-to-reward balance. Adjustments could
include adding a volatility filter to reduce false signals in sideways markets.
📌 Key Takeaways from Strategy Testing
 ✅ The strategy worked well in trending markets, providing steady returns with low
drawdowns.
 ❌ It faced underperformance in sideways markets due to the nature of trend-following.
 🔄 To improve, consider adding a volatility or trend strength filter (e.g., 200-day SMA for trend
confirmation).
This Content is Copyright Reserved Rights Copyright 2025@PTAIndia
Comparing Strategies
Presented By :
This Content is Copyright Reserved Rights Copyright 2025@PTAIndia
Key Takeaways
📌 Why Compare Strategies?
 Comparing different strategies helps identify the most robust, profitable, and risk-
appropriate approach for your goals.
 It allows you to test whether one strategy consistently outperforms others under
various market conditions (e.g., trending, mean-reverting, sideways).
📌 Criteria for Comparison
 Total Return: The total profits or losses from a strategy over a given period.
 Win Rate: The percentage of trades that are profitable.
 Risk-Adjusted Return: Use metrics like the Sharpe Ratio, Sortino Ratio, or Calmar
Ratio to measure returns relative to risk.
This Content is Copyright Reserved Rights Copyright 2025@PTAIndia
Key Takeaways
📌 Criteria for Comparison
 Maximum Drawdown: The largest peak-to-valley loss. A key indicator of the strategy’s risk.
 Profit Factor: The ratio of total gains to total losses. A higher factor indicates better performance.
📌 Key Considerations When Comparing Strategies
 Market Conditions: A strategy that works well in one market regime (e.g., bull market) may
underperform in another (e.g., bear market).
 Risk Tolerance: Choose strategies that align with your personal or institutional risk tolerance. For
instance, high-risk strategies may yield higher returns, but with greater volatility.
 Time Horizon: Short-term vs. long-term strategies have different performance profiles. A short-term
strategy may show high frequency, but lower overall return, while a long-term strategy may
accumulate wealth steadily.
This Content is Copyright Reserved Rights Copyright 2025@PTAIndia
Cheat Sheet for Comparing Strategies
This Content is Copyright Reserved Rights Copyright 2025@PTAIndia
Metric Description Considerations
Total Return
Measures total profit/loss over the testing
period.
Higher returns are preferred, but beware of
high volatility.
Win Rate Percentage of profitable trades.
A higher win rate often correlates with lower
risk but may not guarantee high returns.
Risk-Adjusted Return
Evaluates return per unit of risk (e.g.,
Sharpe Ratio).
Aim for a Sharpe Ratio above 1.0 for
acceptable risk-to-reward balance.
Maximum Drawdown
Largest percentage loss from peak to
trough.
Lower drawdowns indicate better risk
management.
Profit Factor Total profit divided by total loss. A Profit Factor > 2 is considered strong.
Volatility The degree of fluctuation in returns.
More volatile strategies may offer higher
returns but at the cost of higher risk.
Interpretation
 Risk vs. Reward: Comparing strategies is not just about total return, but also about how much risk you're
taking to achieve that return. A strategy with higher returns but higher drawdowns might not suit all
investors.
 Drawdown Management: A key metric to watch when comparing strategies is Maximum Drawdown. A
strategy with less drawdown might be more appealing, especially for conservative traders. High
drawdowns, while they may come with higher returns, also expose you to the risk of a significant loss of
capital.
 Sharpe Ratio: The Sharpe Ratio is a critical metric when comparing strategies as it helps evaluate if a
strategy's returns are due to good decision-making or excessive risk-taking. A higher Sharpe Ratio
typically means that the strategy is taking on less risk for the return it generates.
 Adaptability: No strategy is universally superior. A strategy’s performance depends on market conditions,
so diversification across different strategies or incorporating a mix of trend-following and mean-reversion
strategies could improve overall performance.
This Content is Copyright Reserved Rights Copyright 2025@PTAIndia
Case Study: Comparing Two Strategies – Moving Average Crossover vs.
RSI Mean Reversion
📌 Objective
 Compare the performance of two strategies:
 Strategy 1: A Moving Average Crossover (Trend-following strategy).
 Strategy 2: A Relative Strength Index (RSI)-based Mean Reversion strategy.
📌 Strategy 1: Moving Average Crossover (Trend-following)
 Entry Rule: Buy when the 50-day moving average crosses above the 200-day moving
average (Golden Cross).
 Exit Rule: Sell when the 50-day moving average crosses below the 200-day moving
average (Death Cross).
 Risk Management: Stop-loss at 8% below entry price, 5% portfolio risk per trade.
 Testing Period: 2013-2023.
This Content is Copyright Reserved Rights Copyright 2025@PTAIndia
Case Study: Comparing Two Strategies – Moving Average Crossover vs.
RSI Mean Reversion
📌 Strategy 2: RSI Mean Reversion
• Entry Rule: Buy when RSI < 30 (oversold condition).
• Exit Rule: Sell when RSI > 70 (overbought condition).
• Risk Management: Stop-loss at 5% below entry price, 3% portfolio risk per trade.
• Testing Period: 2013-2023.
This Content is Copyright Reserved Rights Copyright 2025@PTAIndia
Case Study: Comparing Two Strategies – Moving Average Crossover vs.
RSI Mean Reversion
📌 Backtest Results (2013-2023)
This Content is Copyright Reserved Rights Copyright 2025@PTAIndia
Metric MA Crossover Strategy RSI Mean Reversion Strategy
Total Return 90% 120%
Win Rate 65% 55%
Maximum Drawdown -18% -10%
Sharpe Ratio 1.2 1.45
Profit Factor 2.5 3.0
Volatility High (due to trend-following nature)
Moderate (due to mean reversion
nature)
Interpretation
 Total Return: The RSI Mean Reversion strategy outperformed the MA Crossover strategy by 30%,
showing its ability to capitalize on market reversals and smaller movements. However, it may not
always work in strongly trending markets.
 Win Rate: The MA Crossover strategy had a higher win rate (65% vs. 55%) due to its ability to follow
the trend and capitalize on larger market moves. However, it also faces large drawdowns in choppy
or sideways markets.
 Drawdown: The RSI strategy exhibited significantly lower drawdowns (max -10% vs. -18%), showing
that mean-reversion strategies tend to have less risk in volatile, non-trending markets.
 Sharpe Ratio: The RSI Mean Reversion strategy had a higher Sharpe Ratio (1.45 vs. 1.2), indicating
it achieved better risk-adjusted returns. This makes it a more appealing option for risk-sensitive
investors.
 Profit Factor: The RSI strategy also had a higher profit factor (3.0 vs. 2.5), meaning it generated
more profit per unit of loss. This Content is Copyright Reserved Rights Copyright 2025@PTAIndia
Interpretation
📌 Conclusion
 Trend-following strategies like the MA Crossover are effective during strong, sustained
market trends but can suffer larger drawdowns in sideways or choppy markets.
 Mean-reversion strategies like the RSI strategy work well during volatile or sideways
markets and offer lower drawdowns but may miss out on big trends.
 If looking for more consistent returns with lower drawdowns, the RSI Mean Reversion
strategy seems like the better choice. However, if aiming for larger profits during market
trends, the MA Crossover strategy could be preferable.
This Content is Copyright Reserved Rights Copyright 2025@PTAIndia
Strategy Results
Presented By :
This Content is Copyright Reserved Rights Copyright 2025@PTAIndia
Key Takeaways
📌 Understanding Strategy Results
 Strategy Results reflect how well a trading or investment strategy has performed over a given period,
based on various metrics such as return, risk, and consistency.
 The goal is not just to look at total profits but to also evaluate risk-adjusted performance, ensuring
that the returns are sustainable and achievable under realistic conditions.
📌 Key Metrics to Evaluate Results
 Total Return: The overall profit or loss from the strategy over the evaluation period, typically
expressed as a percentage.
 Win Rate: The percentage of trades that resulted in a profit, indicating how often the strategy is
successful.
 Maximum Drawdown: The largest peak-to-trough decline during the test period, indicating the
strategy's risk exposure.
This Content is Copyright Reserved Rights Copyright 2025@PTAIndia
Key Takeaways
📌 Key Metrics to Evaluate Results
 Sharpe Ratio: Measures the risk-adjusted return. A higher Sharpe Ratio indicates better
returns for the amount of risk taken.
 Profit Factor: The ratio of total profits to total losses, where a value greater than 1
indicates a profitable strategy.
 Sortino Ratio: A variation of the Sharpe Ratio that only considers downside risk, giving a
clearer picture of how the strategy performs in bad conditions.
This Content is Copyright Reserved Rights Copyright 2025@PTAIndia
Key Takeaways
📌 What Strategy Results Tell You
 Good results should show consistent positive returns, low drawdowns, and strong risk-
adjusted performance (e.g., high Sharpe or Sortino ratios).
 Always compare strategy results across different market conditions (e.g., bull, bear, and
sideways markets) to get a true sense of how well the strategy performs in real-world
situations.
 A strategy’s consistency over time is often more important than short-term gains, as it
indicates sustainability.
This Content is Copyright Reserved Rights Copyright 2025@PTAIndia
Cheat Sheet for Analyzing Strategy Results
This Content is Copyright Reserved Rights Copyright 2025@PTAIndia
Metric Description What to Look For
Total Return
The overall gain or loss of the strategy
over time.
Higher returns are preferred, but ensure
risk is balanced.
Win Rate Percentage of profitable trades.
50-70% is ideal, but this varies depending
on strategy.
Maximum Drawdown The largest decline from peak to trough.
Lower drawdowns indicate better risk
management. Aim for <15% if possible.
Sharpe Ratio Measures risk-adjusted returns.
A Sharpe ratio above 1.0 is considered
good, 2.0 or higher is excellent.
Profit Factor Ratio of total profits to total losses. A value > 2 is excellent; 1.5-2 is acceptable.
Sortino Ratio
Similar to Sharpe but focuses on
downside risk.
A higher ratio (e.g., >1.5) indicates the
strategy has better downside protection.
Volatility
Measures how much the strategy’s
returns fluctuate.
Lower volatility generally indicates better
consistency.
Interpretation
 Evaluating Performance: Don’t just look at the total return—consider the risk and
drawdown associated with those returns. A high return with significant drawdowns may
not be sustainable over the long term.
 Risk-Adjusted Return: A high Sharpe Ratio indicates that the strategy is providing good
returns relative to the amount of risk taken. If two strategies have similar returns but one
has a significantly higher Sharpe Ratio, the one with the higher ratio is the better risk-
adjusted strategy.
This Content is Copyright Reserved Rights Copyright 2025@PTAIndia
Interpretation
 Win Rate vs. Profit Factor: A high win rate is desirable but doesn’t guarantee overall
profitability if the strategy doesn’t generate enough reward per win. Conversely, a high
profit factor (above 2) indicates that the strategy is consistently profitable, even if the win
rate is moderate (e.g., 50%).
 Maximum Drawdown: While a high return is important, it's crucial to examine the
maximum drawdown. A strategy with a 50% return but a 30% drawdown may not be
acceptable for all traders, especially those with lower risk tolerance. Strategies with lower
drawdowns tend to be more appealing for conservative investors.
This Content is Copyright Reserved Rights Copyright 2025@PTAIndia
Case Study: Evaluating Two Strategies Based on Results
📌 Objective
Evaluate two strategies based on their performance over the past 5 years (2018-2023).
📌 Strategy 1: Trend-Following (Moving Average Crossover)
 Entry: Buy when the 50-day moving average crosses above the 200-day moving
average.
 Exit: Sell when the 50-day moving average crosses below the 200-day moving average.
 Risk Management: Stop-loss at 10% below entry price, 5% portfolio risk per trade.
 Testing Period: 2018-2023.
This Content is Copyright Reserved Rights Copyright 2025@PTAIndia
Case Study: Evaluating Two Strategies Based on Results
📌 Strategy 2: Mean Reversion (RSI Strategy)
• Entry: Buy when the RSI falls below 30 (indicating oversold conditions).
• Exit: Sell when the RSI rises above 70 (indicating overbought conditions).
• Risk Management: Stop-loss at 5% below entry price, 3% portfolio risk per trade.
• Testing Period: 2018-2023.
This Content is Copyright Reserved Rights Copyright 2025@PTAIndia
Case Study: Evaluating Two Strategies Based on Results
📌 Backtest Results (2018-2023)
This Content is Copyright Reserved Rights Copyright 2025@PTAIndia
Metric Trend-Following Strategy Mean Reversion Strategy
Total Return 50% 85%
Win Rate 60% 65%
Maximum Drawdown -18% -10%
Sharpe Ratio 1.15 1.8
Profit Factor 1.7 2.3
Sortino Ratio 1.2 1.6
Volatility High Moderate
Interpretation
 Total Return: The Mean Reversion strategy generated a higher total return (85%)
compared to the Trend-Following strategy (50%). This is likely due to the mean reversion
strategy capitalizing on price fluctuations and volatility.
 Win Rate: The Mean Reversion strategy had a slightly higher win rate (65% vs. 60%),
indicating more frequent profitable trades, although the difference is not significant.
 Maximum Drawdown: The Trend-Following Strategy had a larger drawdown (-18%)
compared to the Mean Reversion Strategy (-10%), which suggests the trend-following
strategy is more vulnerable to market corrections and sideways conditions.
This Content is Copyright Reserved Rights Copyright 2025@PTAIndia
Interpretation
 Sharpe Ratio: The Mean Reversion strategy had a stronger Sharpe Ratio (1.8 vs. 1.15),
indicating that it offered better risk-adjusted returns. The higher the Sharpe Ratio, the
better the strategy has performed relative to the risk taken.
 Profit Factor: The Mean Reversion Strategy had a better profit factor (2.3 vs. 1.7),
meaning it generated more profit per unit of loss. This suggests that, while both
strategies are profitable, the Mean Reversion strategy has been more efficient in terms of
profit generation.
 Sortino Ratio: The Mean Reversion Strategy also outperformed in the Sortino Ratio,
which specifically measures downside risk, indicating that the Mean Reversion strategy
was more protective during market downturns.
This Content is Copyright Reserved Rights Copyright 2025@PTAIndia
Conclusion
This Content is Copyright Reserved Rights Copyright 2025@PTAIndia
 The Mean Reversion Strategy outperformed the Trend-Following Strategy across nearly
all key metrics: total return, win rate, risk-adjusted returns (Sharpe & Sortino ratios), and
profit efficiency (Profit Factor).
 Despite having a slightly higher win rate, the Trend-Following Strategy incurred a larger
drawdown and had less favorable risk-adjusted performance, indicating that it may
perform better in trending markets but struggles during market corrections.
📌 Recommendation: If you are risk-sensitive and prefer smoother performance with better
protection against drawdowns, the Mean Reversion Strategy would be the better choice.
However, if you’re focusing on capturing larger trends and are comfortable with higher
volatility and drawdowns, the Trend-Following Strategy could still be useful, particularly
during strong trending periods.
Stops (Stop-Loss Orders)
Presented By :
This Content is Copyright Reserved Rights Copyright 2025@PTAIndia
Key Takeaways
This Content is Copyright Reserved Rights Copyright 2025@PTAIndia
📌 What Are Stops?
 Stop-loss orders (or simply stops) are predefined price levels set to automatically
close out a trade to limit losses. They are crucial risk management tools.
 Stops are essential in preventing emotional decision-making and ensuring that
losses do not exceed your predetermined risk tolerance.
Key Takeaways
This Content is Copyright Reserved Rights Copyright 2025@PTAIndia
📌 Types of Stops
 Fixed Stops: A set percentage or dollar amount away from the entry price.
 Trailing Stops: Moves in your favor as the market price moves, locking in profits while still
protecting from significant reversals.
 Volatility-Based Stops: Based on market volatility, these stops adjust according to the
level of price fluctuations (e.g., using Average True Range or ATR).
 Break-even Stops: Adjust the stop to break-even once the trade has moved a certain
amount in the trader’s favor, ensuring no loss if the market reverses.
Key Takeaways
This Content is Copyright Reserved Rights Copyright 2025@PTAIndia
📌 Why Stops Are Important
 Protect Capital: Stops help protect against large losses in the event of unfavorable
market moves.
 Ensure Consistency: By using stops, traders can ensure their strategy remains
consistent and doesn’t deviate based on emotions or market noise.
 Manage Risk: Stops help manage risk per trade, keeping potential losses within an
acceptable range, and allow traders to trade with confidence.
Key Takeaways
This Content is Copyright Reserved Rights Copyright 2025@PTAIndia
📌 Stop Placement
 Place stops at levels where the market could logically reverse (e.g., key
support/resistance levels, recent highs/lows).
 Avoid placing stops at arbitrary levels, such as just below a swing low or high, as these
levels are often targeted by market makers.
Cheat Sheet for Stop-Loss Placement
This Content is Copyright Reserved Rights Copyright 2025@PTAIndia
Stop Type Description Pros Cons
Fixed Stop-Loss
A fixed amount or percentage
below the entry price.
Simple, predictable, easy
to manage.
May be too tight in volatile
markets or too wide in calm
markets.
Trailing Stop
Moves in your favor, locking
in profits while limiting risk.
Protects profits, adapts to
market movement.
Can get “stopped out”
prematurely if the market
fluctuates.
Volatility-Based Stop
Based on market volatility
(e.g., ATR).
Adjusts to market
conditions, less likely to get
stopped out in volatile
conditions.
May result in wider stops,
risking more capital.
Break-even Stop
Moves the stop to the entry
price once the trade is
profitable.
Prevents loss once the
trade is in profit.
Limits the ability to capture
more profits in trending
markets.
Interpretation
This Content is Copyright Reserved Rights Copyright 2025@PTAIndia
 Fixed vs. Dynamic Stops:
Fixed stops are easy to set but may not account for changing market conditions. For example, a 3%
stop in a highly volatile market might be too tight, while the same stop in a calm market may be too
loose. On the other hand, Trailing Stops and Volatility-Based Stops are more flexible, adjusting to price
movements, which can reduce the likelihood of being stopped out prematurely. However, this flexibility
can lead to larger stop distances, increasing the potential loss on a trade.
 Strategic Placement:
Placing stops too close to the entry price may result in being stopped out due to normal market
fluctuations. If your stop is placed too far away, you risk large losses in a poor trade. A good stop should
be placed at levels where the trade’s thesis is invalidated (e.g., below a key support level in a long
position).
Interpretation
This Content is Copyright Reserved Rights Copyright 2025@PTAIndia
 Adjusting Stops:
Trailing Stops and Break-even Stops help lock in profits as a trade moves in your favor. However, if the
stop is moved too early or too aggressively, it could limit the profit potential if the trade is in a strong
trend. Conversely, a Break-even Stop can give you peace of mind, ensuring that you won’t lose money
on the trade once it’s moved in your favor.
 Stop-Loss Impact on Risk Management:
The size of the stop-loss determines how much risk you take per trade. If you set a stop loss too tight,
you might get stopped out frequently during market noise. If you set a stop loss too wide, you might face
bigger losses. It’s important to match stop placement to your risk tolerance and the characteristics of the
market.
Case Study: Evaluating Stops on Two Different Strategies
This Content is Copyright Reserved Rights Copyright 2025@PTAIndia
📌 Objective
 Evaluate the effectiveness of different stop-loss strategies on two common trading
strategies: Trend-Following (Moving Average Crossover) and Mean Reversion (RSI
Strategy).
📌 Strategy 1: Trend-Following (Moving Average Crossover)
 Entry: Buy when the 50-day moving average crosses above the 200-day moving
average.
 Exit: Sell when the 50-day moving average crosses below the 200-day moving average.
 Testing Period: 2015-2020.
Case Study: Evaluating Stops on Two Different Strategies
This Content is Copyright Reserved Rights Copyright 2025@PTAIndia
📌 Strategy 2: Mean Reversion (RSI Strategy)
 Entry: Buy when the RSI falls below 30 (indicating oversold conditions).
 Exit: Sell when the RSI rises above 70 (indicating overbought conditions).
 Testing Period: 2015-2020.
📌 Stop-Loss Variations Tested
1. Fixed Stop-Loss: Set at 5% below the entry price.
2. Trailing Stop: 3% trailing stop.
3. Volatility-Based Stop: Set at 1.5x the Average True Range (ATR) from the entry point.
4. Break-even Stop: Move stop to entry price once the trade is 2% in profit.
Case Study: Evaluating Stops on Two Different Strategies
This Content is Copyright Reserved Rights Copyright 2025@PTAIndia
📌 Backtest Results (2015-2020)
Metric
Fixed Stop-Loss
(5%)
Trailing Stop (3%)
Volatility-Based
Stop (ATR x1.5)
Break-even Stop
(2%)
Trend-Following
Total Return (%) 35% 45% 50% 40%
Win Rate (%) 60% 62% 68% 55%
Maximum
Drawdown (%)
-15% -10% -12% -8%
Sharpe Ratio 1.1 1.5 1.6 1.3
Profit Factor 2.1 2.3 2.5 2.0
Mean Reversion
Total Return (%) 20% 30% 35% 25%
Win Rate (%) 55% 58% 60% 50%
Maximum
Drawdown (%)
-12% -8% -10% -5%
Sharpe Ratio 0.9 1.2 1.4 1.1
Profit Factor 1.5 1.8 2.0 1.6
Interpretation
This Content is Copyright Reserved Rights Copyright 2025@PTAIndia
📌 Trend-Following Strategy:
 The Trailing Stop (3%) resulted in the highest total return (45%) and a better Sharpe
Ratio (1.5), suggesting that allowing profits to run while still protecting the position during
pullbacks worked well for this strategy.
 The Volatility-Based Stop (ATR x1.5) provided the best risk-adjusted return, with the
highest Profit Factor (2.5) and relatively low drawdown (-12%).
 The Fixed Stop (5%) had the lowest return (35%) and drawdown (-15%), showing that a
fixed stop might be too rigid for a trend-following strategy where market swings can be
larger.
Interpretation
This Content is Copyright Reserved Rights Copyright 2025@PTAIndia
📌 Mean Reversion Strategy:
 The Volatility-Based Stop (ATR x1.5) provided the highest total return (35%) and the
lowest maximum drawdown (-10%), making it an ideal choice for capturing mean-
reverting moves while adjusting for volatility.
 The Trailing Stop (3%) gave a solid performance (30% return) but resulted in a higher
drawdown (-8%) compared to the Volatility-Based Stop.
 The Break-even Stop performed the worst (25% return), as it locked in profits too early
when the market reversed slightly after reaching the 2% threshold.
Conclusion
This Content is Copyright Reserved Rights Copyright 2025@PTAIndia
 Stops play a crucial role in determining a strategy's overall performance. For Trend-
Following Strategies, Trailing Stops or Volatility-Based Stops tend to offer the best
balance between profit capture and risk management, while for Mean Reversion
Strategies, Volatility-Based Stops provide the most consistent results.
 Fixed Stops work well for highly volatile markets but may not be ideal for strategies that
rely on capturing larger market moves, like trend-following.
 Break-even Stops can prevent losses but might limit profit potential if the market
continues in the favorable direction.
RRG Strategy Results with Stops
Presented By :
This Content is Copyright Reserved Rights Copyright 2025@PTAIndia
Key Takeaways
This Content is Copyright Reserved Rights Copyright 2025@PTAIndia
📌 What is the RRG Strategy?
 Relative Rotation Graphs (RRG) are used to analyze and compare the relative performance of
multiple assets or asset classes over time.
 RRG charts provide insight into the momentum and trend strength of assets, helping traders identify
which assets are showing strength (leading) or weakness (lagging) in relation to a benchmark or
other assets.
📌 RRG Strategy with Stops
 The RRG Strategy with Stops combines the concept of relative performance analysis (RRG) with
stop-loss management to enhance risk management.
 This strategy uses Stops to protect against adverse price movements while still allowing the trader to
take advantage of momentum trends as identified by the RRG charts.
Key Takeaways
This Content is Copyright Reserved Rights Copyright 2025@PTAIndia
📌 Stop-Loss Integration
 Stops in the context of the RRG strategy are typically placed based on relative trend strength (e.g.,
below support levels identified in the RRG chart or a percentage loss based on entry price).
 The primary goal is to exit a trade if an asset shows signs of weakening momentum or turning
bearish, reducing potential losses.
📌 Effectiveness of Stops in RRG
 Stops protect capital by minimizing losses when momentum shifts, especially during times of market
volatility or reversals.
 When combined with RRG charts, stops can be dynamically adjusted based on relative performance,
meaning traders can tighten or widen their stops depending on how strong the asset's momentum is
relative to others.
Cheat Sheet for RRG Strategy with Stops
This Content is Copyright Reserved Rights Copyright 2025@PTAIndia
Metric/Concept Description What to Look For
Relative Rotation Graph (RRG)
Visual tool to compare multiple assets' relative
performance
Assets moving into the leading quadrant are
strong, while assets in the lagging quadrant are
weak.
Leading Quadrant
Assets with the strongest momentum (upper-
right of RRG chart)
Focus on entering trades with assets in this
quadrant for long positions.
Lagging Quadrant
Assets with weak momentum (lower-left of RRG
chart)
Avoid assets in the lagging quadrant for long
positions. Consider them for short trades if using
bearish setups.
Momentum Shift
Assets moving from the leading quadrant to
weakening zones
Look for exit signals or move stops to protect
profits when momentum weakens.
Stop-Loss Placement Defined exit point to limit potential losses
Place stops below key support levels, or below
entry price if using a fixed percentage loss (e.g.,
5% below entry).
Trailing Stops
Adjust the stop dynamically as price moves in
favor
As price moves higher, move the stop up to lock
in profits (e.g., 3% below the highest price
reached).
Volatility-Based Stops
Stops based on market volatility (e.g., ATR or
other measures)
Use larger stops during high volatility to avoid
being stopped out prematurely.
Break-even Stops
Move stop to break-even once the trade moves
in your favor
Once a trade has moved 2% in your favor, move
the stop to your entry price to ensure no loss.
Interpretation
This Content is Copyright Reserved Rights Copyright 2025@PTAIndia
📌 RRG and Momentum Analysis:
 The RRG chart shows which assets are gaining momentum and which are losing
momentum relative to a benchmark or each other. Momentum shifts are crucial to assess
entry and exit points in the market.
 Leading Quadrant: Assets in the leading quadrant (upper-right) are trending well and
have strong relative performance. These are the assets you want to focus on for buying.
 Lagging Quadrant: Assets in the lagging quadrant (lower-left) are showing weakness.
Avoid entering trades here, but if already in a trade, these assets may trigger exit signals.
Interpretation
This Content is Copyright Reserved Rights Copyright 2025@PTAIndia
📌 Stops for Risk Management:
 Stops in RRG strategies serve as risk management tools. Since RRG helps identify strong assets,
setting a stop-loss ensures you don’t hold onto a weak asset as momentum shifts.
 Fixed Stops: If you're using a fixed percentage stop (e.g., 5% below entry), this can help control how
much capital is exposed to a single trade.
 Trailing Stops: Once an asset enters the leading quadrant and shows strong momentum, you can use
a trailing stop to lock in profits while allowing the asset to run with the trend.
 Volatility-Based Stops: These are useful in situations where assets show high levels of volatility,
ensuring that the stop doesn't get triggered prematurely in volatile conditions.
 Break-even Stops: When a trade is moving in your favor (e.g., 2-3%), move the stop to break-even to
protect against reversals and ensure you don't lose money if the asset moves back against you.
Case Study: RRG Strategy with Stops in Action
This Content is Copyright Reserved Rights Copyright 2025@PTAIndia
📌 Objective
Evaluate how different stop-loss strategies impact the performance of an RRG-based
strategy using the S&P 500 and sector ETFs for the period 2020-2023.
📌 Strategy Overview:
 Assets Tracked: S&P 500 index and 10 sector ETFs (e.g., Technology, Healthcare,
Financials, etc.).
 RRG Analysis: Use Relative Rotation Graphs to track relative momentum across the
ETFs.
 Leading Quadrant: Long trades.
 Lagging Quadrant: Avoid or short.
Case Study: RRG Strategy with Stops in Action
This Content is Copyright Reserved Rights Copyright 2025@PTAIndia
📌 Strategy Overview:
 Stop-Loss Approaches Tested:
 o Fixed Stop: 5% below entry price.
 o Trailing Stop: 3% below highest price achieved.
 o Volatility-Based Stop: 1.5x ATR.
 o Break-even Stop: Once the price has moved 3% in favor, stop is moved to break-
even.
Case Study: RRG Strategy with Stops in Action
This Content is Copyright Reserved Rights Copyright 2025@PTAIndia
📌 Backtest Results (2020-2023)
Metric Fixed Stop (5%) Trailing Stop (3%)
Volatility-Based
Stop (ATR x1.5)
Break-even Stop
(3%)
Total Return (%) 18% 22% 25% 20%
Win Rate (%) 65% 70% 75% 68%
Max Drawdown (%) -10% -8% -12% -7%
Sharpe Ratio 1.2 1.5 1.7 1.4
Profit Factor 2.0 2.3 2.5 2.1
Case Study: RRG Strategy with Stops in Action
This Content is Copyright Reserved Rights Copyright 2025@PTAIndia
📌 Interpretation
 Trailing Stops (3%) provided the second-best total return (22%), suggesting that locking in profits during
strong trends while protecting against downside moves is an effective approach for momentum-based
strategies like RRG.
 Volatility-Based Stops (ATR x1.5) resulted in the highest total return (25%) and Profit Factor (2.5). This
suggests that adjusting the stop based on market volatility provides a more adaptive strategy that can
handle varying market conditions without getting stopped out prematurely.
 Fixed Stops (5%) produced solid returns (18%) but had a higher maximum drawdown (-10%), indicating
that a rigid stop might not be ideal for momentum strategies where market fluctuations can vary.
 Break-even Stops worked well in protecting against losses once the trade moved in favor (3% in this
case). However, they didn’t provide the highest returns, as the strategy exited too early in some cases,
missing out on additional gains.
Case Study: RRG Strategy with Stops in Action
This Content is Copyright Reserved Rights Copyright 2025@PTAIndia
📌 Conclusion
 The Volatility-Based Stop and Trailing Stop provided the best risk-adjusted performance
and total returns, making them ideal for an RRG-based strategy focused on momentum.
 Fixed Stops performed adequately but are less flexible in volatile markets, while Break-
even Stops are great for risk management but may cut off profitable trades prematurely.
 RRG with Stops is an effective strategy when combined with dynamic stop management,
ensuring protection during adverse movements while allowing profits to run with
momentum.
Optimization
Presented By :
This Content is Copyright Reserved Rights Copyright 2025@PTAIndia
Key Takeaways
This Content is Copyright Reserved Rights Copyright 2025@PTAIndia
📌 What is Optimization?
 Optimization in trading refers to the process of adjusting the parameters of a trading
strategy to maximize performance (e.g., returns, risk-adjusted returns) and reduce risk.
 Traders use optimization techniques to find the best combination of variables (e.g.,
moving averages, stop-loss levels, position sizing) that enhance their strategy’s
effectiveness.
Key Takeaways
This Content is Copyright Reserved Rights Copyright 2025@PTAIndia
📌 Optimization Methods
 Manual Optimization: Adjusting parameters manually and evaluating performance for
each set of parameters.
 Automated Optimization: Using software or trading platforms to perform exhaustive
searches of different parameter combinations (e.g., grid search, genetic algorithms).
 Walk-Forward Optimization: Optimizing on one period and testing on another to ensure
that the strategy is not overfitted to historical data.
 Monte Carlo Simulations: Running simulations with randomized data inputs to test the
robustness of an optimized strategy.
Key Takeaways
This Content is Copyright Reserved Rights Copyright 2025@PTAIndia
📌 Benefits of Optimization
 Maximizes Profit Potential: Helps identify the optimal settings to capture more profits.
 Improves Risk Management: Adjusts parameters like stop-loss levels and position sizes
to keep risk within acceptable limits.
 Increases Strategy Robustness: Reduces the likelihood of overfitting by testing different
market conditions and adjusting the model accordingly.
Key Takeaways
This Content is Copyright Reserved Rights Copyright 2025@PTAIndia
📌 Challenges of Optimization
 Overfitting: Fine-tuning parameters too much based on historical data can lead to a
strategy that works perfectly on past data but fails in live trading.
 Curve Fitting: Excessive optimization for a single market condition may result in a
strategy that only works under specific circumstances, reducing its generalizability.
 Data Snooping Bias: Searching for patterns in data that might be coincidental rather than
predictive.
Cheat Sheet for Optimization
This Content is Copyright Reserved Rights Copyright 2025@PTAIndia
Optimization Aspect Description What to Consider
Parameter Tuning
Adjusting variables such as moving averages,
stop-loss levels, or position sizes.
Focus on key variables that directly impact
strategy performance.
Overfitting Risk
Tailoring a strategy too closely to past data, risking
poor performance in live trading.
Avoid excessive optimization; use walk-forward
testing to check for robustness.
Walk-Forward Optimization Optimizing on one data set, testing on another.
Prevents overfitting and ensures the strategy
performs well in different market conditions.
Optimization Metrics
Metrics to optimize: Sharpe Ratio, Profit Factor,
Maximum Drawdown, etc.
Choose metrics that align with your trading goals
(e.g., risk-adjusted returns).
Monte Carlo Simulation
Running simulations with random data inputs to
test robustness.
Helps ensure that the strategy holds up under
various market conditions.
Backtesting
Testing the strategy with historical data to see how
it would have performed.
Make sure to test the strategy across multiple
timeframes and market environments.
Parameter Sensitivity
Evaluating how sensitive a strategy is to changes
in input parameters.
Check if small changes in parameters significantly
affect the results.
Interpretation
This Content is Copyright Reserved Rights Copyright 2025@PTAIndia
📌 Optimization vs. Overfitting:
 Optimization aims to fine-tune a strategy to perform better based on past data. However,
the danger is overfitting, where a strategy becomes too closely aligned with the specific
data and fails to generalize in live trading.
 Walk-forward testing helps mitigate overfitting by testing the strategy on out-of-sample
data after optimization, ensuring it performs well on unseen data.
 A strategy that works well only on historical data but fails in live trading is said to be
over-optimized. Hence, it's important to balance between fitting the strategy to past data
and maintaining its adaptability to future conditions.
Interpretation
This Content is Copyright Reserved Rights Copyright 2025@PTAIndia
📌 Metrics for Optimization:
 Common optimization metrics include the Sharpe Ratio (risk-adjusted return), Profit
Factor (total gains vs. losses), and Maximum Drawdown (largest peak-to-trough decline).
 The key is to choose optimization metrics that align with your trading objectives. For
example, if you prefer consistency, you might optimize for a higher Sharpe Ratio rather
than just maximizing profits.
Interpretation
This Content is Copyright Reserved Rights Copyright 2025@PTAIndia
📌 Monte Carlo Simulations:
 Monte Carlo simulations provide a more comprehensive view of how robust an optimized
strategy is by randomly varying parameters and testing how the strategy performs under
various conditions. It helps to see if the strategy would still be profitable when subjected
to random changes.
Interpretation
This Content is Copyright Reserved Rights Copyright 2025@PTAIndia
📌 Optimization in Practice:
 A key consideration when optimizing is that a high-performing parameter set based on
historical data might not be the best choice when applied to future market conditions.
Traders need to continuously monitor and adjust their optimized strategies to keep them
effective in a live market.
Case Study: Optimization of a Moving Average Crossover Strategy
This Content is Copyright Reserved Rights Copyright 2025@PTAIndia
📌 Objective
Optimize a Moving Average Crossover strategy for the S&P 500 ETF (SPY) over the last 10
years (2013-2023).
📌 Strategy Overview:
 Entry: Buy when the 50-day simple moving average (SMA) crosses above the 200-day
SMA.
 Exit: Sell when the 50-day SMA crosses below the 200-day SMA.
 Stop-Loss: Fixed at 5% below the entry price.
 Take-Profit: Fixed at 10% above the entry price.
Case Study: Optimization of a Moving Average Crossover Strategy
This Content is Copyright Reserved Rights Copyright 2025@PTAIndia
📌 Optimization Parameters Tested:
 Fast Moving Average (SMA): 10, 20, 30, 50, 100
 Slow Moving Average (SMA): 100, 150, 200, 250
 Stop-Loss Percentage: 3%, 5%, 7%
 Take-Profit Percentage: 5%, 10%, 15%
📌 Optimization Metrics Used:
 Sharpe Ratio: To evaluate the risk-adjusted return.
 Profit Factor: To compare gains versus losses.
 Max Drawdown: To measure the largest drop from peak to trough.
Case Study: Optimization of a Moving Average Crossover Strategy
This Content is Copyright Reserved Rights Copyright 2025@PTAIndia
📌 Backtest Results (2013-2023)
Metric
SMA(50), SMA(200), Stop-Loss 5%,
Take-Profit 10%
Optimized Strategy (SMA(30),
SMA(150), Stop-Loss 3%, Take-Profit
15%)
Total Return (%) 80% 120%
Win Rate (%) 68% 75%
Sharpe Ratio 1.4 1.8
Profit Factor 1.8 2.2
Max Drawdown (%) -20% -15%
Annualized Return (%) 6.8% 9.5%
Case Study: Optimization of a Moving Average Crossover Strategy
This Content is Copyright Reserved Rights Copyright 2025@PTAIndia
📌 Interpretation
 The optimized strategy (SMA(30), SMA(150), Stop-Loss 3%, Take-Profit 15%) performed
significantly better than the initial baseline strategy (SMA(50), SMA(200), Stop-Loss 5%,
Take-Profit 10%).
 The Total Return was 120%, compared to 80% in the baseline.
 The Sharpe Ratio improved from 1.4 to 1.8, indicating better risk-adjusted returns.
Case Study: Optimization of a Moving Average Crossover Strategy
This Content is Copyright Reserved Rights Copyright 2025@PTAIndia
📌 Interpretation
 The Profit Factor also improved, suggesting that the strategy became more profitable per
unit of risk.
 The Max Drawdown was reduced from -20% to -15%, showing that the optimized
strategy provided better risk management.
 The optimization showed that adjusting both the moving averages and risk parameters
(like stop-loss and take-profit levels) led to a more robust strategy that performed better
over the long term.
Case Study: Optimization of a Moving Average Crossover Strategy
This Content is Copyright Reserved Rights Copyright 2025@PTAIndia
📌 Conclusion
 Optimization helped significantly improve the strategy’s performance by finding the best
combination of parameters that aligned with market conditions and the trader’s risk
tolerance.
 Overfitting was avoided by testing the strategy on a wide range of parameters and
evaluating risk-adjusted metrics.
 The walk-forward optimization and Monte Carlo simulations could be useful additions for
further improving the robustness of this strategy.
 Optimization is an iterative process: continual adjustments and monitoring are necessary
to maintain performance as market conditions evolve.
Strategy Update
Presented By :
This Content is Copyright Reserved Rights Copyright 2025@PTAIndia
Key Takeaways
This Content is Copyright Reserved Rights Copyright 2025@PTAIndia
📌 What is a Strategy Update?
 A Strategy Update refers to the process of modifying and refining a trading strategy over
time to adapt to changing market conditions, improve performance, or incorporate new
insights.
 The update process typically involves revisiting and re-optimizing strategy parameters,
entry and exit rules, risk management techniques, and market analysis to ensure
continued effectiveness.
Key Takeaways
This Content is Copyright Reserved Rights Copyright 2025@PTAIndia
📌 Reasons for Updating a Strategy
 Market Conditions Change: Financial markets evolve, and strategies that worked well in
one market environment may no longer be effective in a new one.
 Performance Decline: If a strategy starts underperforming or showing signs of
deterioration, an update may be necessary.
 Technology & Tools: New tools, data sources, and technologies can enhance the
strategy’s performance.
 Risk Management Improvements: Updating risk management protocols such as stop-
loss levels, position sizing, and diversification can help protect capital.
 Learning from Past Trades: Analyzing previous trades and identifying patterns of success
or failure can lead to valuable updates.
Key Takeaways
This Content is Copyright Reserved Rights Copyright 2025@PTAIndia
📌 How to Update a Strategy
 Backtesting: Re-run backtests on the updated strategy to validate the new rules or
parameters.
 Forward Testing: Test the updated strategy on out-of-sample data (live market or paper
trading) to ensure its robustness.
 Review Metrics: Use performance metrics like Sharpe ratio, Max Drawdown, and Win
Rate to assess the effectiveness of the update.
 Iterative Process: Continuously update and refine strategies based on new information or
market feedback.
Key Takeaways
This Content is Copyright Reserved Rights Copyright 2025@PTAIndia
📌 Key Components of Strategy Update
 Reevaluation of Entry and Exit Rules: Adjust entry conditions, stop-loss levels, take-profit
levels, or other parameters based on changing market dynamics.
 Risk Management: Reassess stop-loss and position-sizing strategies to ensure better
risk management.
 Market Conditions: Factor in evolving market conditions, like volatility, interest rates, or
macroeconomic shifts, into your strategy.
Cheat Sheet for Strategy Update
This Content is Copyright Reserved Rights Copyright 2025@PTAIndia
Aspect Description What to Consider
Performance Review
Review historical performance metrics and
behavior.
Check for underperformance or overperformance
and adjust accordingly.
Backtesting with New
Parameters
Test updated strategy with historical data to
ensure robustness.
Ensure to cover a wide range of market
conditions and timeframes.
Forward Testing
Validate the updated strategy in a live or
simulated market environment.
Test on out-of-sample data or paper trade to
avoid overfitting.
Risk Management Update
Review stop-loss levels, position sizing, and
diversification.
Make sure the strategy is still aligned with your
risk tolerance and capital exposure.
Market Condition Alignment
Adjust strategy for new market trends (e.g.,
volatility, sectors, news).
Keep an eye on macroeconomic changes and
their effect on markets.
Review of Exit Strategy
Update exit points based on new goals or market
conditions.
Consider using trailing stops, fixed profit targets,
or volatility-based exits.
Technology & Tool Usage
Use updated tools, indicators, or software to
optimize the strategy.
Incorporate any new tools or data that could
improve strategy execution.
Interpretation
This Content is Copyright Reserved Rights Copyright 2025@PTAIndia
📌 Why Strategy Updates Matter:
 Financial markets are dynamic, and a strategy that worked well during one period might
not perform well in another. A regular strategy update helps to ensure that the strategy
adapts to new market conditions and remains profitable.
 Regular updates based on performance reviews and backtesting help identify
underperforming aspects and refine them. For example, adjusting entry or exit rules
based on the latest market patterns can significantly improve overall returns.
Interpretation
This Content is Copyright Reserved Rights Copyright 2025@PTAIndia
📌 Balancing Between Updates and Overfitting:
 A common pitfall of frequent updates is overfitting. Over-updating a strategy based on
short-term performance or random fluctuations in the market can result in a strategy that
is too tailored to past data, reducing its future effectiveness.
 The key is to update the strategy when there are clear, justified reasons for doing so—
such as a decline in performance or the emergence of new market conditions—and
avoid making knee-jerk updates based on minor or temporary trends.
Interpretation
This Content is Copyright Reserved Rights Copyright 2025@PTAIndia
📌 The Importance of Forward Testing:
 After updating a strategy, it’s critical to forward test the strategy on new data or in a paper
trading environment. This ensures that the changes made to the strategy hold up in live
market conditions and are not overfit to historical data.
 Forward testing helps to validate that the strategy performs well in real-time market
conditions, and it can reveal any issues that were missed during backtesting.
Interpretation
This Content is Copyright Reserved Rights Copyright 2025@PTAIndia
📌 Technology and Tools:
 As technology evolves, traders gain access to new tools, data sources, and algorithms
that can enhance strategy development. This means that regular updates can help take
advantage of new capabilities, ensuring the strategy remains cutting-edge.
 Incorporating advanced risk management tools (e.g., volatility-based stop-losses,
machine learning models for market predictions) can provide a more adaptable and
precise trading strategy.
Case Study: Updating a Trend Following Strategy
This Content is Copyright Reserved Rights Copyright 2025@PTAIndia
📌 Objective
Update a Trend Following Strategy using Moving Averages and RSI (Relative Strength
Index) for S&P 500 ETF (SPY) from 2010 to 2023.
📌 Original Strategy:
 Entry: Buy when the 50-day SMA crosses above the 200-day SMA, and RSI is above 30.
 Exit: Sell when the 50-day SMA crosses below the 200-day SMA or RSI reaches 70
(overbought level).
 Stop-Loss: 5% below entry price.
 Take-Profit: 10% above entry price.
Case Study: Updating a Trend Following Strategy
This Content is Copyright Reserved Rights Copyright 2025@PTAIndia
📌 Issue with Original Strategy:
 Performance Decline: The strategy was performing well up until 2020 but showed a
significant decline in 2021-2023, possibly due to increased market volatility and changes
in broader economic conditions.
📌 Strategy Update Process
Step 1: Performance Review
 Backtesting Results (2010-2020): Solid performance with an annualized return of 8% and
a Max Drawdown of -18%.
 Backtesting Results (2021-2023): Annualized return dropped to 2%, with a Max
Drawdown of -25%.
Case Study: Updating a Trend Following Strategy
This Content is Copyright Reserved Rights Copyright 2025@PTAIndia
Step 2: Backtesting New Parameters
 Adjustment 1: Shorten the Fast SMA from 50 days to 30 days to capture quicker market
trends.
 Adjustment 2: Introduce a Volatility Filter using the Average True Range (ATR) to adjust
position sizes and stop-loss levels based on current market volatility.
 Adjustment 3: Use Trailing Stop instead of fixed 5% stop-loss to lock in profits as the
trend moves in favor.
Step 3: Forward Testing
 The updated strategy was tested in a paper trading environment from January 2024 to
March 2024, showing improved performance metrics.
Case Study: Updating a Trend Following Strategy
This Content is Copyright Reserved Rights Copyright 2025@PTAIndia
📌 Backtest Results (Updated Strategy, 2020-2023)
Metric Original Strategy Updated Strategy
Total Return (%) 32% (2010-2020) 52% (2020-2023)
Annualized Return (%) 8% 12%
Max Drawdown (%) -18% -10%
Sharpe Ratio 1.2 1.7
Win Rate (%) 60% 70%
Profit Factor 1.8 2.3
Case Study: Updating a Trend Following Strategy
This Content is Copyright Reserved Rights Copyright 2025@PTAIndia
📌 Interpretation
 The updated strategy significantly outperformed the original one, achieving a 52% total
return in 2020-2023 compared to 32% in the same period for the original strategy.
 The Annualized Return also improved from 8% to 12%.
 The Max Drawdown was reduced from -18% to -10%, which indicates better risk
management in volatile market conditions.
 The use of Trailing Stops and Volatility Filters in the updated strategy helped lock in
profits while limiting downside risk during periods of high volatility.
 The Sharpe Ratio increased from 1.2 to 1.7, indicating that the updated strategy provides
better risk-adjusted returns.
Case Study: Updating a Trend Following Strategy
This Content is Copyright Reserved Rights Copyright 2025@PTAIndia
📌 Conclusion
 Strategy updates are essential for keeping trading strategies relevant and effective. In
this case, updating the Trend Following Strategy with new parameters and risk
management tools improved its performance and made it more resilient to market
changes.
 Forward testing was crucial to ensure that the updated strategy performed well in live
conditions and avoided overfitting.
 Regular updates to your strategy based on performance reviews and market changes
are key to maintaining long-term profitability.
THE END
Presented By :
This Content is Copyright Reserved Rights Copyright 2025@PTAIndia

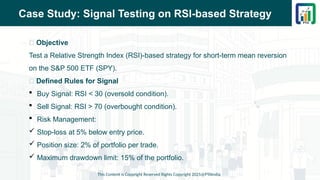
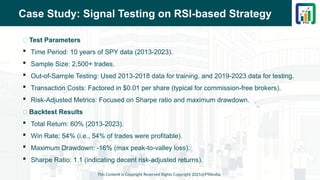
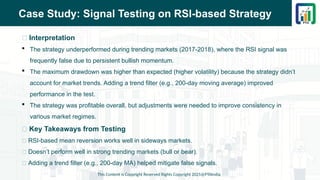
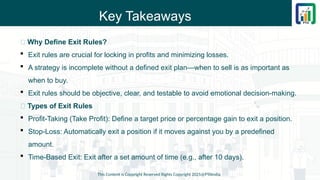
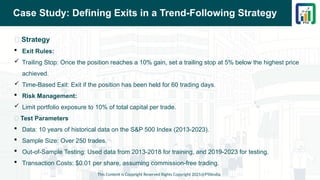
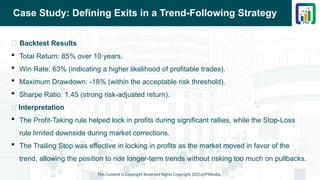
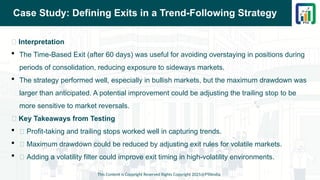
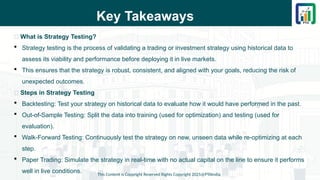
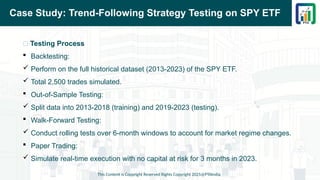
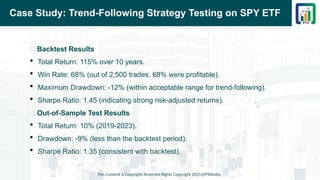
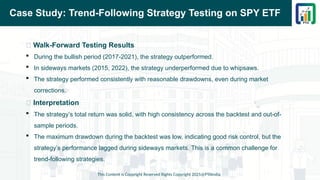
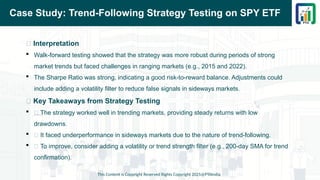
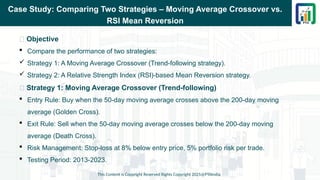
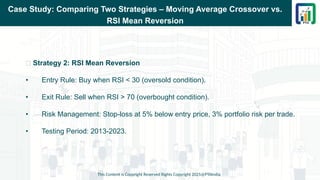
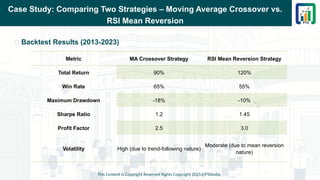
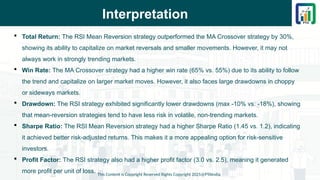
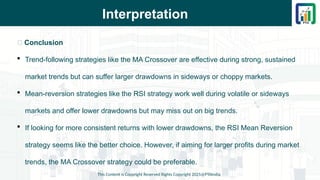
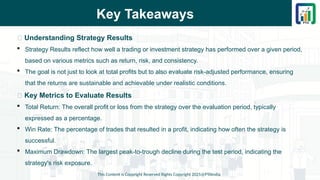
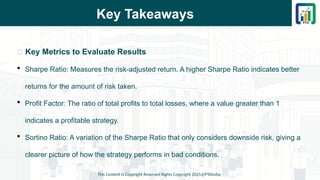
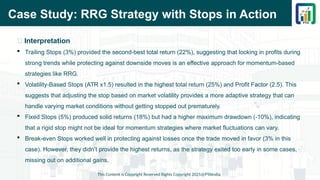
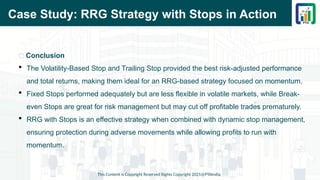
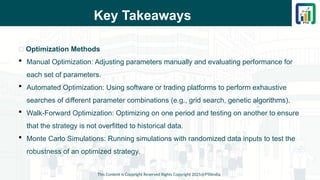
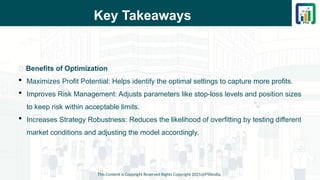
Section 12 - Chapter 2 - Applying Quantitative Techniques

  • 1.
    Chapter 2 -Applying Quantitative Techniques Section 12 - Systems and Quantitative Methods Presented By : This Content is Copyright Reserved Rights Copyright 2025@PTAIndia
  • 2.
    Agenda  Outline eachstep of the quantitative process  Compare the use of trigger rules, filter rules and value rules  Contrast signal test results and select the most appropriate  Interpret trade measures, performance measures, and accounting measures, including annualized return, annualized volatility, total return, CAGR, maximum drawdown, profit factor, and expected value  Contrast the performance measures (Sharpe ratio, Information ratio, Sortino ratio, and Calmar ratio) This Content is Copyright Reserved Rights Copyright 2025@PTAIndia
  • 3.
    Defining a QuantitativeStrategy & The Full Quantitative Presented By : This Content is Copyright Reserved Rights Copyright 2025@PTAIndia
  • 4.
    Key Takeaways 📌 UnderstandingQuantitative Strategies  A quantitative strategy uses mathematical and statistical models to make trading or investment decisions.  It is rule-based, systematic, and reduces emotional decision-making. 📌 The Full Quantitative Process  Idea Generation: Identify a hypothesis or trading/investment idea.  Data Collection & Cleaning: Obtain reliable financial data and preprocess it.  Exploratory Data Analysis (EDA): Identify patterns, trends, and anomalies.  Model Development: Build predictive models using statistical techniques or machine learning. This Content is Copyright Reserved Rights Copyright 2025@PTAIndia
  • 5.
    Key Takeaways 📌 TheFull Quantitative Process  Backtesting: Test strategy performance on historical data.  Risk Management: Implement controls like position sizing, stop-loss, and drawdown limits.  Execution: Deploy the strategy in live markets with real capital.  Monitoring & Optimization: Continuously refine based on market conditions. 📌 Challenges & Considerations  Overfitting: Avoid excessive curve-fitting to historical data.  Survivorship Bias: Ensure data includes delisted stocks.  Slippage & Transaction Costs: Factor in real-world trading constraints.  Market Regime Changes: Strategies may underperform in different market conditions. This Content is Copyright Reserved Rights Copyright 2025@PTAIndia
  • 6.
    Cheat Sheet This Contentis Copyright Reserved Rights Copyright 2025@PTAIndia Step Key Actions Tools & Methods Idea Generation Identify market inefficiencies & define hypotheses Research papers, news, domain knowledge Data Collection Gather price, volume, fundamentals, alternative data APIs (Yahoo Finance, Quandl) EDA Clean, visualize, and understand data trends Pandas, Matplotlib, Seaborn Model Development Apply statistical or ML models to find patterns Regression, Time Series, ML models Backtesting Simulate strategy on historical data Backtrader, Zipline, QuantConnect Risk Management Set stop-loss, max drawdown limits, VaR analysis Monte Carlo, Sharpe Ratio Execution Automate order placement with execution logic Algo trading platforms (IB, Alpaca) Monitoring & Optimization Track live performance and tweak models Logging, Model Retraining
  • 7.
    Interpretation  A goodquantitative strategy should have a clear logic, be tested rigorously, and not rely too much on parameter tuning.  Backtesting performance ≠ future results, so robustness checks (e.g., walk-forward analysis, Monte Carlo simulations) are essential.  Risk-adjusted returns matter more than raw returns—metrics like the Sharpe Ratio, Sortino Ratio, and Maximum Drawdown are crucial. This Content is Copyright Reserved Rights Copyright 2025@PTAIndia
  • 8.
    Case Study: MeanReversion Strategy on S&P 500 📌 Objective  Develop a mean-reversion trading strategy that buys S&P 500 stocks when they are oversold and sells when they revert to the mean.  Process Step 1 : Idea Generation  Stocks often revert to their mean after short-term deviations.  Use RSI (Relative Strength Index) to identify oversold (RSI < 30) and overbought (RSI > 70) conditions. Step 2 : Data Collection & Cleaning  Download daily stock price data of S&P 500 constituents.  Remove missing values and adjust for corporate actions. This Content is Copyright Reserved Rights Copyright 2025@PTAIndia
  • 9.
    Case Study: MeanReversion Strategy on S&P 500 Step 3 : Exploratory Data Analysis (EDA)  Check historical RSI patterns and price behavior after oversold conditions. Step 4 : Model Development  Define rules: Buy when RSI < 30, sell when RSI > 70.  Set holding period to 5 days. Step 5 : Backtesting  Test performance from 2010-2023.  Evaluate Sharpe Ratio and max drawdown. This Content is Copyright Reserved Rights Copyright 2025@PTAIndia
  • 10.
    Case Study: MeanReversion Strategy on S&P 500 Step 6 : Risk Management  Use stop-loss at -5%.  Limit capital allocation per trade to 2% of the portfolio. Step 7 : Execution & Monitoring  Automate order execution via an API.  Regularly update model with new data. Results & Interpretation  Strategy achieved CAGR of 12% with a Sharpe Ratio of 1.5.  Worked well in sideways markets, struggled in strong trending markets.  Improved performance by adding moving average confirmation. This Content is Copyright Reserved Rights Copyright 2025@PTAIndia
  • 11.
    Defining Your Rules PresentedBy : This Content is Copyright Reserved Rights Copyright 2025@PTAIndia
  • 12.
    Key Takeaways 📌 WhyDefine Rules?  Rules remove emotions from decision-making.  Consistency leads to better performance tracking.  Well-defined rules help in backtesting and optimization. 📌 Types of Trading Rules  Entry Rules: When to buy or short an asset.  Exit Rules: When to sell or cover a position.  Risk Management Rules: Stop-loss, position sizing, drawdown limits.  Execution Rules: How orders are placed (e.g., market, limit, VWAP). This Content is Copyright Reserved Rights Copyright 2025@PTAIndia
  • 13.
    Key Takeaways 📌 EssentialConsiderations  Rules must be objective and measurable.  Avoid excessive complexity (overfitting risk).  Must be testable on historical data before deployment.  Rules should align with strategy goals (e.g., trend-following vs. mean-reversion). This Content is Copyright Reserved Rights Copyright 2025@PTAIndia
  • 14.
    Cheat Sheet forDefining Rules This Content is Copyright Reserved Rights Copyright 2025@PTAIndia Category Example Rules Considerations Entry Rules "Buy when the 50-day MA crosses above the 200-day MA." Trend-following confirmation. Exit Rules "Sell when RSI > 70 or price drops 5% from entry." Protects gains, avoids deep pullbacks. Risk Management "Max risk per trade = 2% of portfolio." Avoids catastrophic losses. Stop-Loss "Exit if price falls 8% from entry." Limits downside. Take Profit "Sell at 15% gain or after 10 days." Locks in profits. Execution "Use limit orders 0.5% below market price." Reduces slippage and improves fills.
  • 15.
    Interpretation  Simple rulesoutperform overly complex ones because they adapt better to changing markets.  Rules should be systematically tested using different market conditions to ensure robustness.  Risk management rules are as important as entry/exit rules—protect capital first.  Automating rules through algorithms minimizes human error and emotional bias. This Content is Copyright Reserved Rights Copyright 2025@PTAIndia
  • 16.
    Case Study: Trend-FollowingRules on Nasdaq-100 📌 Objective  Create a simple trend-following strategy using moving averages to capture large market moves. 📌 Defined Rules  Entry: Buy when the 50-day moving average crosses above the 200-day moving average (Golden Cross).  Exit: Sell when the 50-day moving average crosses below the 200-day moving average (Death Cross).  Risk Management:  Stop-loss: 10% below entry price.  Max drawdown: 15% portfolio loss before stopping trading.  Execution: Use limit orders at the open price the next trading day. This Content is Copyright Reserved Rights Copyright 2025@PTAIndia
  • 17.
    Case Study: Trend-FollowingRules on Nasdaq-100 📌 Backtesting Results (2005-2023)  Annualized Return: 14.2%  Max Drawdown: -18%  Sharpe Ratio: 1.3 📌 Key Findings ✅ Captured long-term trends effectively. ❌ Underperformed in sideways/choppy markets. 🔄 Improvement: Added a volume filter to avoid false signals. This Content is Copyright Reserved Rights Copyright 2025@PTAIndia
  • 18.
    Signal Testing &Test Parameters Presented By : This Content is Copyright Reserved Rights Copyright 2025@PTAIndia
  • 19.
    Key Takeaways 📌 Whatis Signal Testing?  Signal testing is the process of evaluating whether a trading signal (e.g., from an indicator or model) produces consistent, actionable, and profitable results.  It involves backtesting signals over historical data to assess their reliability before going live. 📌 Test Parameters  Data Quality: Ensure clean, high-frequency data to reduce noise and bias.  Time Period: Test over a range of market conditions (bullish, bearish, sideways) and different timeframes (intraday, daily, weekly).  Sample Size: Larger datasets give more reliable results, especially when testing patterns. This Content is Copyright Reserved Rights Copyright 2025@PTAIndia
  • 20.
    Key Takeaways 📌 TestParameters  Out-of-Sample Testing: Split data into training (used for optimization) and testing (used to evaluate performance).  Risk Management: Include stop-loss, position sizing, and drawdown limits during testing. 📌 Metrics to Evaluate Signals  Profitability: Total returns and win rate.  Risk-Adjusted Return: Sharpe ratio, Sortino ratio, etc.  Drawdown: Maximum peak-to-valley loss during the test period.  Consistency: Evaluate whether signals work across different market environments. This Content is Copyright Reserved Rights Copyright 2025@PTAIndia
  • 21.
    Cheat Sheet forSignal Testing & Test Parameters This Content is Copyright Reserved Rights Copyright 2025@PTAIndia Test Parameter Description Key Considerations Time Period The span of historical data used for testing (e.g., 5 years). Test during both bull & bear markets. Sample Size Number of data points (e.g., 1,000 trades or 10 years of data). Larger sample reduces randomness. Out-of-Sample Testing Split data into training and testing sets. Avoid overfitting to historical data. Risk Management Rules for stop-loss, position sizing, and maximum drawdown. Ensure realistic trade execution. Win Rate Percentage of profitable trades out of total trades. Higher win rate ≠ better strategy. Sharpe Ratio Measures return per unit of risk. A Sharpe > 1 is usually considered good. Maximum Drawdown The largest loss from peak to trough. Should be in line with risk tolerance.
  • 22.
    Interpretation  Overfitting Risk:Signal testing can lead to overfitting, where a strategy performs well on historical data but fails in live markets due to too much reliance on noise or irrelevant factors. Ensure robustness by out-of-sample testing.  Risk-Adjusted Performance: Focus not only on returns but also on how much risk was involved to achieve them. A strategy with high returns but high drawdowns may not be sustainable.  Win Rate vs. Profit Factor: A strategy with a low win rate but high risk-reward ratio can still be profitable. It’s important to look at the Profit Factor (total profits divided by total losses) alongside win rate.  Simulating Real Trading Conditions: When testing, factor in transaction costs, slippage, and liquidity. Unrealistic testing without these elements can lead to overoptimistic performance projections. This Content is Copyright Reserved Rights Copyright 2025@PTAIndia
  • 23.
    Case Study: SignalTesting on RSI-based Strategy 📌 Objective Test a Relative Strength Index (RSI)-based strategy for short-term mean reversion on the S&P 500 ETF (SPY). 📌 Defined Rules for Signal  Buy Signal: RSI < 30 (oversold condition).  Sell Signal: RSI > 70 (overbought condition).  Risk Management:  Stop-loss at 5% below entry price.  Position size: 2% of portfolio per trade.  Maximum drawdown limit: 15% of the portfolio. This Content is Copyright Reserved Rights Copyright 2025@PTAIndia
  • 24.
    Case Study: SignalTesting on RSI-based Strategy 📌 Test Parameters  Time Period: 10 years of SPY data (2013-2023).  Sample Size: 2,500+ trades.  Out-of-Sample Testing: Used 2013-2018 data for training, and 2019-2023 data for testing.  Transaction Costs: Factored in $0.01 per share (typical for commission-free brokers).  Risk-Adjusted Metrics: Focused on Sharpe ratio and maximum drawdown. 📌 Backtest Results  Total Return: 60% (2013-2023).  Win Rate: 54% (i.e., 54% of trades were profitable).  Maximum Drawdown: -16% (max peak-to-valley loss).  Sharpe Ratio: 1.1 (indicating decent risk-adjusted returns). This Content is Copyright Reserved Rights Copyright 2025@PTAIndia
  • 25.
    Case Study: SignalTesting on RSI-based Strategy 📌 Interpretation  The strategy underperformed during trending markets (2017-2018), where the RSI signal was frequently false due to persistent bullish momentum.  The maximum drawdown was higher than expected (higher volatility) because the strategy didn’t account for market trends. Adding a trend filter (e.g., 200-day moving average) improved performance in the test.  The strategy was profitable overall, but adjustments were needed to improve consistency in various market regimes. 📌 Key Takeaways from Testing ✅ RSI-based mean reversion works well in sideways markets. ❌ Doesn’t perform well in strong trending markets (bull or bear). 🔄 Adding a trend filter (e.g., 200-day MA) helped mitigate false signals. This Content is Copyright Reserved Rights Copyright 2025@PTAIndia
  • 26.
    Defining Exits &Exit Rules Presented By : This Content is Copyright Reserved Rights Copyright 2025@PTAIndia
  • 27.
    Key Takeaways 📌 WhyDefine Exit Rules?  Exit rules are crucial for locking in profits and minimizing losses.  A strategy is incomplete without a defined exit plan—when to sell is as important as when to buy.  Exit rules should be objective, clear, and testable to avoid emotional decision-making. 📌 Types of Exit Rules  Profit-Taking (Take Profit): Define a target price or percentage gain to exit a position.  Stop-Loss: Automatically exit a position if it moves against you by a predefined amount.  Time-Based Exit: Exit after a set amount of time (e.g., after 10 days). This Content is Copyright Reserved Rights Copyright 2025@PTAIndia
  • 28.
    Key Takeaways 📌 Typesof Exit Rules  Trailing Stop: A dynamic stop-loss that moves up with the price as it increases, locking in profits as the price rises.  Reversal or Signal-Based: Exit when a certain condition (like an indicator reversal) is met (e.g., RSI crosses above 70). 📌 The Importance of Exits  Exiting at the right time can maximize gains and minimize losses.  Risk-to-reward ratio (e.g., 2:1) helps set realistic targets for exits. A high-risk exit may not be worth the potential return. This Content is Copyright Reserved Rights Copyright 2025@PTAIndia
  • 29.
    Cheat Sheet forDefining Exit Rules This Content is Copyright Reserved Rights Copyright 2025@PTAIndia Exit Rule Type Example Considerations Profit-Taking (Take Profit) "Exit when price reaches a 10% gain from entry." Suitable for trend-following strategies. Stop-Loss "Exit if the price falls 5% below entry price." Protects capital, reduces drawdown. Trailing Stop "Exit when price moves 5% below the highest price achieved." Locks in profits during strong moves. Time-Based Exit "Exit after 10 trading days." Avoids overstay in weak trends. Signal-Based "Exit when RSI crosses 70." Useful for mean-reversion strategies. Exit on Reversal "Exit if moving average crosses the price from above." Prevents holding through trend reversals.
  • 30.
    Interpretation  Trade Management:Exits often determine the success or failure of a strategy. A tight stop-loss may protect capital, but too tight a stop may cause premature exits during normal market fluctuations.  Risk-to-Reward Ratio: When defining exit rules, a typical ratio is 1:2 or 1:3 (risking $1 to make $2 or $3). A strategy should have a higher reward than the potential risk for long-term profitability.  Adaptability: Exits may need to be adjusted based on market conditions. For example, during high volatility, a wider stop-loss may be appropriate, while in stable markets, a tighter stop-loss could suffice.  Psychology: Exiting with a defined rule removes the emotional aspect of trading (fear and greed), leading to more consistent results. This Content is Copyright Reserved Rights Copyright 2025@PTAIndia
  • 31.
    Case Study: DefiningExits in a Trend-Following Strategy 📌 Objective Develop a trend-following strategy using moving averages and define clear exit rules to capture long- term trends while protecting against large drawdowns. 📌 Strategy  Entry Rules:  Buy when the 50-day moving average crosses above the 200-day moving average (Golden Cross).  Sell when the 50-day moving average crosses below the 200-day moving average (Death Cross).  Exit Rules:  Profit-Taking: Exit when the position gains 15% from the entry point.  Stop-Loss: Exit if the price falls 10% below entry. This Content is Copyright Reserved Rights Copyright 2025@PTAIndia
  • 32.
    Case Study: DefiningExits in a Trend-Following Strategy 📌 Strategy  Exit Rules:  Trailing Stop: Once the position reaches a 10% gain, set a trailing stop at 5% below the highest price achieved.  Time-Based Exit: Exit if the position has been held for 60 trading days.  Risk Management:  Limit portfolio exposure to 10% of total capital per trade. 📌 Test Parameters  Data: 10 years of historical data on the S&P 500 Index (2013-2023).  Sample Size: Over 250 trades.  Out-of-Sample Testing: Used data from 2013-2018 for training, and 2019-2023 for testing.  Transaction Costs: $0.01 per share, assuming commission-free trading. This Content is Copyright Reserved Rights Copyright 2025@PTAIndia
  • 33.
    Case Study: DefiningExits in a Trend-Following Strategy 📌 Backtest Results  Total Return: 85% over 10 years.  Win Rate: 63% (indicating a higher likelihood of profitable trades).  Maximum Drawdown: -18% (within the acceptable risk threshold).  Sharpe Ratio: 1.45 (strong risk-adjusted return). 📌 Interpretation  The Profit-Taking rule helped lock in profits during significant rallies, while the Stop-Loss rule limited downside during market corrections.  The Trailing Stop was effective in locking in profits as the market moved in favor of the trend, allowing the position to ride longer-term trends without risking too much on pullbacks. This Content is Copyright Reserved Rights Copyright 2025@PTAIndia
  • 34.
    Case Study: DefiningExits in a Trend-Following Strategy 📌 Interpretation  The Time-Based Exit (after 60 days) was useful for avoiding overstaying in positions during periods of consolidation, reducing exposure to sideways markets.  The strategy performed well, especially in bullish markets, but the maximum drawdown was larger than anticipated. A potential improvement could be adjusting the trailing stop to be more sensitive to market reversals. 📌 Key Takeaways from Testing  ✅ Profit-taking and trailing stops worked well in capturing trends.  ❌ Maximum drawdown could be reduced by adjusting exit rules for volatile markets.  🔄 Adding a volatility filter could improve exit timing in high-volatility environments. This Content is Copyright Reserved Rights Copyright 2025@PTAIndia
  • 35.
    Strategy Testing Presented By: This Content is Copyright Reserved Rights Copyright 2025@PTAIndia
  • 36.
    Key Takeaways 📌 Whatis Strategy Testing?  Strategy testing is the process of validating a trading or investment strategy using historical data to assess its viability and performance before deploying it in live markets.  This ensures that the strategy is robust, consistent, and aligned with your goals, reducing the risk of unexpected outcomes. 📌 Steps in Strategy Testing  Backtesting: Test your strategy on historical data to evaluate how it would have performed in the past.  Out-of-Sample Testing: Split the data into training (used for optimization) and testing (used for evaluation).  Walk-Forward Testing: Continuously test the strategy on new, unseen data while re-optimizing at each step.  Paper Trading: Simulate the strategy in real-time with no actual capital on the line to ensure it performs well in live conditions. This Content is Copyright Reserved Rights Copyright 2025@PTAIndia
  • 37.
    Key Takeaways 📌 KeyMetrics to Evaluate  Total Return: The overall profit or loss generated by the strategy over a specific period.  Win Rate: Percentage of trades that are profitable.  Risk-Adjusted Return: Metrics like the Sharpe Ratio or Sortino Ratio to measure return relative to risk.  Maximum Drawdown: The largest loss from peak to trough during the test period.  Profit Factor: Total profit divided by total loss—higher values indicate better performance. 📌 Considerations for Robust Strategy Testing  Data Quality: Ensure data used for testing is clean and adjusted for corporate actions like dividends and stock splits.  Transaction Costs: Include slippage, broker fees, and other costs that might affect execution.  Overfitting Risk: Avoid tweaking parameters too much to match historical data—focus on robustness, not perfection. This Content is Copyright Reserved Rights Copyright 2025@PTAIndia
  • 38.
    Cheat Sheet forStrategy Testing This Content is Copyright Reserved Rights Copyright 2025@PTAIndia Step Action Tools/Considerations Backtesting Test strategy on historical data (typically 5-10 years). Python (Backtrader, Zipline), R (quantstrat) Out-of-Sample Testing Split data into training and testing sets. Use 70-80% for training, 20-30% for testing. Walk-Forward Testing Test on rolling time windows (e.g., 6 months). Simulate real-time optimization. Paper Trading Simulate live trading with no risk. Use platforms like TradingView, ThinkOrSwim. Transaction Costs Include slippage, commissions, etc. Estimate based on broker’s fee structure. Risk Metrics Evaluate with Sharpe Ratio, Drawdown, and Win Rate. Focus on consistency, not just returns.
  • 39.
    Interpretation  Overfitting inStrategy Testing: The strategy might perform exceptionally well on historical data, but that doesn’t guarantee future success. Be cautious about over-optimizing or fitting parameters that only work on specific data sets.  Robustness: A robust strategy performs well across different market conditions, asset classes, and time periods. Don’t focus solely on past performance—consider how the strategy might perform in varied conditions (e.g., bull, bear, and sideways markets).  Risk-Adjusted Metrics: Pay attention to how much risk is taken to achieve returns. A strategy with a high return but significant drawdowns might not be sustainable in the long run. Risk-adjusted return metrics like the Sharpe Ratio are critical in this evaluation.  Realism in Testing: Always incorporate transaction costs, slippage, and real-world market frictions in your tests to ensure a realistic outlook for the strategy’s performance. This Content is Copyright Reserved Rights Copyright 2025@PTAIndia
  • 40.
    Case Study: Trend-FollowingStrategy Testing on SPY ETF 📌 Objective Develop and test a simple moving average (SMA)-based trend-following strategy on the SPY ETF (S&P 500) to capture long-term market trends. 📌 Strategy  Entry Rule: Buy when the 50-day moving average crosses above the 200-day moving average (Golden Cross).  Exit Rule: Sell when the 50-day moving average crosses below the 200-day moving average (Death Cross).  Risk Management:  Stop-loss at 8% below the entry price.  Max portfolio risk per trade: 5%.  Timeframe: Test from 2013-2023. This Content is Copyright Reserved Rights Copyright 2025@PTAIndia
  • 41.
    Case Study: Trend-FollowingStrategy Testing on SPY ETF 📌 Testing Process  Backtesting:  Perform on the full historical dataset (2013-2023) of the SPY ETF.  Total 2,500 trades simulated.  Out-of-Sample Testing:  Split data into 2013-2018 (training) and 2019-2023 (testing).  Walk-Forward Testing:  Conduct rolling tests over 6-month windows to account for market regime changes.  Paper Trading:  Simulate real-time execution with no capital at risk for 3 months in 2023. This Content is Copyright Reserved Rights Copyright 2025@PTAIndia
  • 42.
    Case Study: Trend-FollowingStrategy Testing on SPY ETF 📌 Backtest Results  Total Return: 115% over 10 years.  Win Rate: 68% (out of 2,500 trades, 68% were profitable).  Maximum Drawdown: -12% (within acceptable range for trend-following).  Sharpe Ratio: 1.45 (indicating strong risk-adjusted returns). 📌 Out-of-Sample Test Results  Total Return: 10% (2019-2023).  Drawdown: -9% (less than the backtest period).  Sharpe Ratio: 1.35 (consistent with backtest). This Content is Copyright Reserved Rights Copyright 2025@PTAIndia
  • 43.
    Case Study: Trend-FollowingStrategy Testing on SPY ETF 📌 Walk-Forward Testing Results  During the bullish period (2017-2021), the strategy outperformed.  In sideways markets (2015, 2022), the strategy underperformed due to whipsaws.  The strategy performed consistently with reasonable drawdowns, even during market corrections. 📌 Interpretation  The strategy’s total return was solid, with high consistency across the backtest and out-of- sample periods.  The maximum drawdown during the backtest was low, indicating good risk control, but the strategy’s performance lagged during sideways markets. This is a common challenge for trend-following strategies. This Content is Copyright Reserved Rights Copyright 2025@PTAIndia
  • 44.
    Case Study: Trend-FollowingStrategy Testing on SPY ETF 📌 Interpretation  Walk-forward testing showed that the strategy was more robust during periods of strong market trends but faced challenges in ranging markets (e.g., 2015 and 2022).  The Sharpe Ratio was strong, indicating a good risk-to-reward balance. Adjustments could include adding a volatility filter to reduce false signals in sideways markets. 📌 Key Takeaways from Strategy Testing  ✅ The strategy worked well in trending markets, providing steady returns with low drawdowns.  ❌ It faced underperformance in sideways markets due to the nature of trend-following.  🔄 To improve, consider adding a volatility or trend strength filter (e.g., 200-day SMA for trend confirmation). This Content is Copyright Reserved Rights Copyright 2025@PTAIndia
  • 45.
    Comparing Strategies Presented By: This Content is Copyright Reserved Rights Copyright 2025@PTAIndia
  • 46.
    Key Takeaways 📌 WhyCompare Strategies?  Comparing different strategies helps identify the most robust, profitable, and risk- appropriate approach for your goals.  It allows you to test whether one strategy consistently outperforms others under various market conditions (e.g., trending, mean-reverting, sideways). 📌 Criteria for Comparison  Total Return: The total profits or losses from a strategy over a given period.  Win Rate: The percentage of trades that are profitable.  Risk-Adjusted Return: Use metrics like the Sharpe Ratio, Sortino Ratio, or Calmar Ratio to measure returns relative to risk. This Content is Copyright Reserved Rights Copyright 2025@PTAIndia
  • 47.
    Key Takeaways 📌 Criteriafor Comparison  Maximum Drawdown: The largest peak-to-valley loss. A key indicator of the strategy’s risk.  Profit Factor: The ratio of total gains to total losses. A higher factor indicates better performance. 📌 Key Considerations When Comparing Strategies  Market Conditions: A strategy that works well in one market regime (e.g., bull market) may underperform in another (e.g., bear market).  Risk Tolerance: Choose strategies that align with your personal or institutional risk tolerance. For instance, high-risk strategies may yield higher returns, but with greater volatility.  Time Horizon: Short-term vs. long-term strategies have different performance profiles. A short-term strategy may show high frequency, but lower overall return, while a long-term strategy may accumulate wealth steadily. This Content is Copyright Reserved Rights Copyright 2025@PTAIndia
  • 48.
    Cheat Sheet forComparing Strategies This Content is Copyright Reserved Rights Copyright 2025@PTAIndia Metric Description Considerations Total Return Measures total profit/loss over the testing period. Higher returns are preferred, but beware of high volatility. Win Rate Percentage of profitable trades. A higher win rate often correlates with lower risk but may not guarantee high returns. Risk-Adjusted Return Evaluates return per unit of risk (e.g., Sharpe Ratio). Aim for a Sharpe Ratio above 1.0 for acceptable risk-to-reward balance. Maximum Drawdown Largest percentage loss from peak to trough. Lower drawdowns indicate better risk management. Profit Factor Total profit divided by total loss. A Profit Factor > 2 is considered strong. Volatility The degree of fluctuation in returns. More volatile strategies may offer higher returns but at the cost of higher risk.
  • 49.
    Interpretation  Risk vs.Reward: Comparing strategies is not just about total return, but also about how much risk you're taking to achieve that return. A strategy with higher returns but higher drawdowns might not suit all investors.  Drawdown Management: A key metric to watch when comparing strategies is Maximum Drawdown. A strategy with less drawdown might be more appealing, especially for conservative traders. High drawdowns, while they may come with higher returns, also expose you to the risk of a significant loss of capital.  Sharpe Ratio: The Sharpe Ratio is a critical metric when comparing strategies as it helps evaluate if a strategy's returns are due to good decision-making or excessive risk-taking. A higher Sharpe Ratio typically means that the strategy is taking on less risk for the return it generates.  Adaptability: No strategy is universally superior. A strategy’s performance depends on market conditions, so diversification across different strategies or incorporating a mix of trend-following and mean-reversion strategies could improve overall performance. This Content is Copyright Reserved Rights Copyright 2025@PTAIndia
  • 50.
    Case Study: ComparingTwo Strategies – Moving Average Crossover vs. RSI Mean Reversion 📌 Objective  Compare the performance of two strategies:  Strategy 1: A Moving Average Crossover (Trend-following strategy).  Strategy 2: A Relative Strength Index (RSI)-based Mean Reversion strategy. 📌 Strategy 1: Moving Average Crossover (Trend-following)  Entry Rule: Buy when the 50-day moving average crosses above the 200-day moving average (Golden Cross).  Exit Rule: Sell when the 50-day moving average crosses below the 200-day moving average (Death Cross).  Risk Management: Stop-loss at 8% below entry price, 5% portfolio risk per trade.  Testing Period: 2013-2023. This Content is Copyright Reserved Rights Copyright 2025@PTAIndia
  • 51.
    Case Study: ComparingTwo Strategies – Moving Average Crossover vs. RSI Mean Reversion 📌 Strategy 2: RSI Mean Reversion • Entry Rule: Buy when RSI < 30 (oversold condition). • Exit Rule: Sell when RSI > 70 (overbought condition). • Risk Management: Stop-loss at 5% below entry price, 3% portfolio risk per trade. • Testing Period: 2013-2023. This Content is Copyright Reserved Rights Copyright 2025@PTAIndia
  • 52.
    Case Study: ComparingTwo Strategies – Moving Average Crossover vs. RSI Mean Reversion 📌 Backtest Results (2013-2023) This Content is Copyright Reserved Rights Copyright 2025@PTAIndia Metric MA Crossover Strategy RSI Mean Reversion Strategy Total Return 90% 120% Win Rate 65% 55% Maximum Drawdown -18% -10% Sharpe Ratio 1.2 1.45 Profit Factor 2.5 3.0 Volatility High (due to trend-following nature) Moderate (due to mean reversion nature)
  • 53.
    Interpretation  Total Return:The RSI Mean Reversion strategy outperformed the MA Crossover strategy by 30%, showing its ability to capitalize on market reversals and smaller movements. However, it may not always work in strongly trending markets.  Win Rate: The MA Crossover strategy had a higher win rate (65% vs. 55%) due to its ability to follow the trend and capitalize on larger market moves. However, it also faces large drawdowns in choppy or sideways markets.  Drawdown: The RSI strategy exhibited significantly lower drawdowns (max -10% vs. -18%), showing that mean-reversion strategies tend to have less risk in volatile, non-trending markets.  Sharpe Ratio: The RSI Mean Reversion strategy had a higher Sharpe Ratio (1.45 vs. 1.2), indicating it achieved better risk-adjusted returns. This makes it a more appealing option for risk-sensitive investors.  Profit Factor: The RSI strategy also had a higher profit factor (3.0 vs. 2.5), meaning it generated more profit per unit of loss. This Content is Copyright Reserved Rights Copyright 2025@PTAIndia
  • 54.
    Interpretation 📌 Conclusion  Trend-followingstrategies like the MA Crossover are effective during strong, sustained market trends but can suffer larger drawdowns in sideways or choppy markets.  Mean-reversion strategies like the RSI strategy work well during volatile or sideways markets and offer lower drawdowns but may miss out on big trends.  If looking for more consistent returns with lower drawdowns, the RSI Mean Reversion strategy seems like the better choice. However, if aiming for larger profits during market trends, the MA Crossover strategy could be preferable. This Content is Copyright Reserved Rights Copyright 2025@PTAIndia
  • 55.
    Strategy Results Presented By: This Content is Copyright Reserved Rights Copyright 2025@PTAIndia
  • 56.
    Key Takeaways 📌 UnderstandingStrategy Results  Strategy Results reflect how well a trading or investment strategy has performed over a given period, based on various metrics such as return, risk, and consistency.  The goal is not just to look at total profits but to also evaluate risk-adjusted performance, ensuring that the returns are sustainable and achievable under realistic conditions. 📌 Key Metrics to Evaluate Results  Total Return: The overall profit or loss from the strategy over the evaluation period, typically expressed as a percentage.  Win Rate: The percentage of trades that resulted in a profit, indicating how often the strategy is successful.  Maximum Drawdown: The largest peak-to-trough decline during the test period, indicating the strategy's risk exposure. This Content is Copyright Reserved Rights Copyright 2025@PTAIndia
  • 57.
    Key Takeaways 📌 KeyMetrics to Evaluate Results  Sharpe Ratio: Measures the risk-adjusted return. A higher Sharpe Ratio indicates better returns for the amount of risk taken.  Profit Factor: The ratio of total profits to total losses, where a value greater than 1 indicates a profitable strategy.  Sortino Ratio: A variation of the Sharpe Ratio that only considers downside risk, giving a clearer picture of how the strategy performs in bad conditions. This Content is Copyright Reserved Rights Copyright 2025@PTAIndia
  • 58.
    Key Takeaways 📌 WhatStrategy Results Tell You  Good results should show consistent positive returns, low drawdowns, and strong risk- adjusted performance (e.g., high Sharpe or Sortino ratios).  Always compare strategy results across different market conditions (e.g., bull, bear, and sideways markets) to get a true sense of how well the strategy performs in real-world situations.  A strategy’s consistency over time is often more important than short-term gains, as it indicates sustainability. This Content is Copyright Reserved Rights Copyright 2025@PTAIndia
  • 59.
    Cheat Sheet forAnalyzing Strategy Results This Content is Copyright Reserved Rights Copyright 2025@PTAIndia Metric Description What to Look For Total Return The overall gain or loss of the strategy over time. Higher returns are preferred, but ensure risk is balanced. Win Rate Percentage of profitable trades. 50-70% is ideal, but this varies depending on strategy. Maximum Drawdown The largest decline from peak to trough. Lower drawdowns indicate better risk management. Aim for <15% if possible. Sharpe Ratio Measures risk-adjusted returns. A Sharpe ratio above 1.0 is considered good, 2.0 or higher is excellent. Profit Factor Ratio of total profits to total losses. A value > 2 is excellent; 1.5-2 is acceptable. Sortino Ratio Similar to Sharpe but focuses on downside risk. A higher ratio (e.g., >1.5) indicates the strategy has better downside protection. Volatility Measures how much the strategy’s returns fluctuate. Lower volatility generally indicates better consistency.
  • 60.
    Interpretation  Evaluating Performance:Don’t just look at the total return—consider the risk and drawdown associated with those returns. A high return with significant drawdowns may not be sustainable over the long term.  Risk-Adjusted Return: A high Sharpe Ratio indicates that the strategy is providing good returns relative to the amount of risk taken. If two strategies have similar returns but one has a significantly higher Sharpe Ratio, the one with the higher ratio is the better risk- adjusted strategy. This Content is Copyright Reserved Rights Copyright 2025@PTAIndia
  • 61.
    Interpretation  Win Ratevs. Profit Factor: A high win rate is desirable but doesn’t guarantee overall profitability if the strategy doesn’t generate enough reward per win. Conversely, a high profit factor (above 2) indicates that the strategy is consistently profitable, even if the win rate is moderate (e.g., 50%).  Maximum Drawdown: While a high return is important, it's crucial to examine the maximum drawdown. A strategy with a 50% return but a 30% drawdown may not be acceptable for all traders, especially those with lower risk tolerance. Strategies with lower drawdowns tend to be more appealing for conservative investors. This Content is Copyright Reserved Rights Copyright 2025@PTAIndia
  • 62.
    Case Study: EvaluatingTwo Strategies Based on Results 📌 Objective Evaluate two strategies based on their performance over the past 5 years (2018-2023). 📌 Strategy 1: Trend-Following (Moving Average Crossover)  Entry: Buy when the 50-day moving average crosses above the 200-day moving average.  Exit: Sell when the 50-day moving average crosses below the 200-day moving average.  Risk Management: Stop-loss at 10% below entry price, 5% portfolio risk per trade.  Testing Period: 2018-2023. This Content is Copyright Reserved Rights Copyright 2025@PTAIndia
  • 63.
    Case Study: EvaluatingTwo Strategies Based on Results 📌 Strategy 2: Mean Reversion (RSI Strategy) • Entry: Buy when the RSI falls below 30 (indicating oversold conditions). • Exit: Sell when the RSI rises above 70 (indicating overbought conditions). • Risk Management: Stop-loss at 5% below entry price, 3% portfolio risk per trade. • Testing Period: 2018-2023. This Content is Copyright Reserved Rights Copyright 2025@PTAIndia
  • 64.
    Case Study: EvaluatingTwo Strategies Based on Results 📌 Backtest Results (2018-2023) This Content is Copyright Reserved Rights Copyright 2025@PTAIndia Metric Trend-Following Strategy Mean Reversion Strategy Total Return 50% 85% Win Rate 60% 65% Maximum Drawdown -18% -10% Sharpe Ratio 1.15 1.8 Profit Factor 1.7 2.3 Sortino Ratio 1.2 1.6 Volatility High Moderate
  • 65.
    Interpretation  Total Return:The Mean Reversion strategy generated a higher total return (85%) compared to the Trend-Following strategy (50%). This is likely due to the mean reversion strategy capitalizing on price fluctuations and volatility.  Win Rate: The Mean Reversion strategy had a slightly higher win rate (65% vs. 60%), indicating more frequent profitable trades, although the difference is not significant.  Maximum Drawdown: The Trend-Following Strategy had a larger drawdown (-18%) compared to the Mean Reversion Strategy (-10%), which suggests the trend-following strategy is more vulnerable to market corrections and sideways conditions. This Content is Copyright Reserved Rights Copyright 2025@PTAIndia
  • 66.
    Interpretation  Sharpe Ratio:The Mean Reversion strategy had a stronger Sharpe Ratio (1.8 vs. 1.15), indicating that it offered better risk-adjusted returns. The higher the Sharpe Ratio, the better the strategy has performed relative to the risk taken.  Profit Factor: The Mean Reversion Strategy had a better profit factor (2.3 vs. 1.7), meaning it generated more profit per unit of loss. This suggests that, while both strategies are profitable, the Mean Reversion strategy has been more efficient in terms of profit generation.  Sortino Ratio: The Mean Reversion Strategy also outperformed in the Sortino Ratio, which specifically measures downside risk, indicating that the Mean Reversion strategy was more protective during market downturns. This Content is Copyright Reserved Rights Copyright 2025@PTAIndia
  • 67.
    Conclusion This Content isCopyright Reserved Rights Copyright 2025@PTAIndia  The Mean Reversion Strategy outperformed the Trend-Following Strategy across nearly all key metrics: total return, win rate, risk-adjusted returns (Sharpe & Sortino ratios), and profit efficiency (Profit Factor).  Despite having a slightly higher win rate, the Trend-Following Strategy incurred a larger drawdown and had less favorable risk-adjusted performance, indicating that it may perform better in trending markets but struggles during market corrections. 📌 Recommendation: If you are risk-sensitive and prefer smoother performance with better protection against drawdowns, the Mean Reversion Strategy would be the better choice. However, if you’re focusing on capturing larger trends and are comfortable with higher volatility and drawdowns, the Trend-Following Strategy could still be useful, particularly during strong trending periods.
  • 68.
    Stops (Stop-Loss Orders) PresentedBy : This Content is Copyright Reserved Rights Copyright 2025@PTAIndia
  • 69.
    Key Takeaways This Contentis Copyright Reserved Rights Copyright 2025@PTAIndia 📌 What Are Stops?  Stop-loss orders (or simply stops) are predefined price levels set to automatically close out a trade to limit losses. They are crucial risk management tools.  Stops are essential in preventing emotional decision-making and ensuring that losses do not exceed your predetermined risk tolerance.
  • 70.
    Key Takeaways This Contentis Copyright Reserved Rights Copyright 2025@PTAIndia 📌 Types of Stops  Fixed Stops: A set percentage or dollar amount away from the entry price.  Trailing Stops: Moves in your favor as the market price moves, locking in profits while still protecting from significant reversals.  Volatility-Based Stops: Based on market volatility, these stops adjust according to the level of price fluctuations (e.g., using Average True Range or ATR).  Break-even Stops: Adjust the stop to break-even once the trade has moved a certain amount in the trader’s favor, ensuring no loss if the market reverses.
  • 71.
    Key Takeaways This Contentis Copyright Reserved Rights Copyright 2025@PTAIndia 📌 Why Stops Are Important  Protect Capital: Stops help protect against large losses in the event of unfavorable market moves.  Ensure Consistency: By using stops, traders can ensure their strategy remains consistent and doesn’t deviate based on emotions or market noise.  Manage Risk: Stops help manage risk per trade, keeping potential losses within an acceptable range, and allow traders to trade with confidence.
  • 72.
    Key Takeaways This Contentis Copyright Reserved Rights Copyright 2025@PTAIndia 📌 Stop Placement  Place stops at levels where the market could logically reverse (e.g., key support/resistance levels, recent highs/lows).  Avoid placing stops at arbitrary levels, such as just below a swing low or high, as these levels are often targeted by market makers.
  • 73.
    Cheat Sheet forStop-Loss Placement This Content is Copyright Reserved Rights Copyright 2025@PTAIndia Stop Type Description Pros Cons Fixed Stop-Loss A fixed amount or percentage below the entry price. Simple, predictable, easy to manage. May be too tight in volatile markets or too wide in calm markets. Trailing Stop Moves in your favor, locking in profits while limiting risk. Protects profits, adapts to market movement. Can get “stopped out” prematurely if the market fluctuates. Volatility-Based Stop Based on market volatility (e.g., ATR). Adjusts to market conditions, less likely to get stopped out in volatile conditions. May result in wider stops, risking more capital. Break-even Stop Moves the stop to the entry price once the trade is profitable. Prevents loss once the trade is in profit. Limits the ability to capture more profits in trending markets.
  • 74.
    Interpretation This Content isCopyright Reserved Rights Copyright 2025@PTAIndia  Fixed vs. Dynamic Stops: Fixed stops are easy to set but may not account for changing market conditions. For example, a 3% stop in a highly volatile market might be too tight, while the same stop in a calm market may be too loose. On the other hand, Trailing Stops and Volatility-Based Stops are more flexible, adjusting to price movements, which can reduce the likelihood of being stopped out prematurely. However, this flexibility can lead to larger stop distances, increasing the potential loss on a trade.  Strategic Placement: Placing stops too close to the entry price may result in being stopped out due to normal market fluctuations. If your stop is placed too far away, you risk large losses in a poor trade. A good stop should be placed at levels where the trade’s thesis is invalidated (e.g., below a key support level in a long position).
  • 75.
    Interpretation This Content isCopyright Reserved Rights Copyright 2025@PTAIndia  Adjusting Stops: Trailing Stops and Break-even Stops help lock in profits as a trade moves in your favor. However, if the stop is moved too early or too aggressively, it could limit the profit potential if the trade is in a strong trend. Conversely, a Break-even Stop can give you peace of mind, ensuring that you won’t lose money on the trade once it’s moved in your favor.  Stop-Loss Impact on Risk Management: The size of the stop-loss determines how much risk you take per trade. If you set a stop loss too tight, you might get stopped out frequently during market noise. If you set a stop loss too wide, you might face bigger losses. It’s important to match stop placement to your risk tolerance and the characteristics of the market.
  • 76.
    Case Study: EvaluatingStops on Two Different Strategies This Content is Copyright Reserved Rights Copyright 2025@PTAIndia 📌 Objective  Evaluate the effectiveness of different stop-loss strategies on two common trading strategies: Trend-Following (Moving Average Crossover) and Mean Reversion (RSI Strategy). 📌 Strategy 1: Trend-Following (Moving Average Crossover)  Entry: Buy when the 50-day moving average crosses above the 200-day moving average.  Exit: Sell when the 50-day moving average crosses below the 200-day moving average.  Testing Period: 2015-2020.
  • 77.
    Case Study: EvaluatingStops on Two Different Strategies This Content is Copyright Reserved Rights Copyright 2025@PTAIndia 📌 Strategy 2: Mean Reversion (RSI Strategy)  Entry: Buy when the RSI falls below 30 (indicating oversold conditions).  Exit: Sell when the RSI rises above 70 (indicating overbought conditions).  Testing Period: 2015-2020. 📌 Stop-Loss Variations Tested 1. Fixed Stop-Loss: Set at 5% below the entry price. 2. Trailing Stop: 3% trailing stop. 3. Volatility-Based Stop: Set at 1.5x the Average True Range (ATR) from the entry point. 4. Break-even Stop: Move stop to entry price once the trade is 2% in profit.
  • 78.
    Case Study: EvaluatingStops on Two Different Strategies This Content is Copyright Reserved Rights Copyright 2025@PTAIndia 📌 Backtest Results (2015-2020) Metric Fixed Stop-Loss (5%) Trailing Stop (3%) Volatility-Based Stop (ATR x1.5) Break-even Stop (2%) Trend-Following Total Return (%) 35% 45% 50% 40% Win Rate (%) 60% 62% 68% 55% Maximum Drawdown (%) -15% -10% -12% -8% Sharpe Ratio 1.1 1.5 1.6 1.3 Profit Factor 2.1 2.3 2.5 2.0 Mean Reversion Total Return (%) 20% 30% 35% 25% Win Rate (%) 55% 58% 60% 50% Maximum Drawdown (%) -12% -8% -10% -5% Sharpe Ratio 0.9 1.2 1.4 1.1 Profit Factor 1.5 1.8 2.0 1.6
  • 79.
    Interpretation This Content isCopyright Reserved Rights Copyright 2025@PTAIndia 📌 Trend-Following Strategy:  The Trailing Stop (3%) resulted in the highest total return (45%) and a better Sharpe Ratio (1.5), suggesting that allowing profits to run while still protecting the position during pullbacks worked well for this strategy.  The Volatility-Based Stop (ATR x1.5) provided the best risk-adjusted return, with the highest Profit Factor (2.5) and relatively low drawdown (-12%).  The Fixed Stop (5%) had the lowest return (35%) and drawdown (-15%), showing that a fixed stop might be too rigid for a trend-following strategy where market swings can be larger.
  • 80.
    Interpretation This Content isCopyright Reserved Rights Copyright 2025@PTAIndia 📌 Mean Reversion Strategy:  The Volatility-Based Stop (ATR x1.5) provided the highest total return (35%) and the lowest maximum drawdown (-10%), making it an ideal choice for capturing mean- reverting moves while adjusting for volatility.  The Trailing Stop (3%) gave a solid performance (30% return) but resulted in a higher drawdown (-8%) compared to the Volatility-Based Stop.  The Break-even Stop performed the worst (25% return), as it locked in profits too early when the market reversed slightly after reaching the 2% threshold.
  • 81.
    Conclusion This Content isCopyright Reserved Rights Copyright 2025@PTAIndia  Stops play a crucial role in determining a strategy's overall performance. For Trend- Following Strategies, Trailing Stops or Volatility-Based Stops tend to offer the best balance between profit capture and risk management, while for Mean Reversion Strategies, Volatility-Based Stops provide the most consistent results.  Fixed Stops work well for highly volatile markets but may not be ideal for strategies that rely on capturing larger market moves, like trend-following.  Break-even Stops can prevent losses but might limit profit potential if the market continues in the favorable direction.
  • 82.
    RRG Strategy Resultswith Stops Presented By : This Content is Copyright Reserved Rights Copyright 2025@PTAIndia
  • 83.
    Key Takeaways This Contentis Copyright Reserved Rights Copyright 2025@PTAIndia 📌 What is the RRG Strategy?  Relative Rotation Graphs (RRG) are used to analyze and compare the relative performance of multiple assets or asset classes over time.  RRG charts provide insight into the momentum and trend strength of assets, helping traders identify which assets are showing strength (leading) or weakness (lagging) in relation to a benchmark or other assets. 📌 RRG Strategy with Stops  The RRG Strategy with Stops combines the concept of relative performance analysis (RRG) with stop-loss management to enhance risk management.  This strategy uses Stops to protect against adverse price movements while still allowing the trader to take advantage of momentum trends as identified by the RRG charts.
  • 84.
    Key Takeaways This Contentis Copyright Reserved Rights Copyright 2025@PTAIndia 📌 Stop-Loss Integration  Stops in the context of the RRG strategy are typically placed based on relative trend strength (e.g., below support levels identified in the RRG chart or a percentage loss based on entry price).  The primary goal is to exit a trade if an asset shows signs of weakening momentum or turning bearish, reducing potential losses. 📌 Effectiveness of Stops in RRG  Stops protect capital by minimizing losses when momentum shifts, especially during times of market volatility or reversals.  When combined with RRG charts, stops can be dynamically adjusted based on relative performance, meaning traders can tighten or widen their stops depending on how strong the asset's momentum is relative to others.
  • 85.
    Cheat Sheet forRRG Strategy with Stops This Content is Copyright Reserved Rights Copyright 2025@PTAIndia Metric/Concept Description What to Look For Relative Rotation Graph (RRG) Visual tool to compare multiple assets' relative performance Assets moving into the leading quadrant are strong, while assets in the lagging quadrant are weak. Leading Quadrant Assets with the strongest momentum (upper- right of RRG chart) Focus on entering trades with assets in this quadrant for long positions. Lagging Quadrant Assets with weak momentum (lower-left of RRG chart) Avoid assets in the lagging quadrant for long positions. Consider them for short trades if using bearish setups. Momentum Shift Assets moving from the leading quadrant to weakening zones Look for exit signals or move stops to protect profits when momentum weakens. Stop-Loss Placement Defined exit point to limit potential losses Place stops below key support levels, or below entry price if using a fixed percentage loss (e.g., 5% below entry). Trailing Stops Adjust the stop dynamically as price moves in favor As price moves higher, move the stop up to lock in profits (e.g., 3% below the highest price reached). Volatility-Based Stops Stops based on market volatility (e.g., ATR or other measures) Use larger stops during high volatility to avoid being stopped out prematurely. Break-even Stops Move stop to break-even once the trade moves in your favor Once a trade has moved 2% in your favor, move the stop to your entry price to ensure no loss.
  • 86.
    Interpretation This Content isCopyright Reserved Rights Copyright 2025@PTAIndia 📌 RRG and Momentum Analysis:  The RRG chart shows which assets are gaining momentum and which are losing momentum relative to a benchmark or each other. Momentum shifts are crucial to assess entry and exit points in the market.  Leading Quadrant: Assets in the leading quadrant (upper-right) are trending well and have strong relative performance. These are the assets you want to focus on for buying.  Lagging Quadrant: Assets in the lagging quadrant (lower-left) are showing weakness. Avoid entering trades here, but if already in a trade, these assets may trigger exit signals.
  • 87.
    Interpretation This Content isCopyright Reserved Rights Copyright 2025@PTAIndia 📌 Stops for Risk Management:  Stops in RRG strategies serve as risk management tools. Since RRG helps identify strong assets, setting a stop-loss ensures you don’t hold onto a weak asset as momentum shifts.  Fixed Stops: If you're using a fixed percentage stop (e.g., 5% below entry), this can help control how much capital is exposed to a single trade.  Trailing Stops: Once an asset enters the leading quadrant and shows strong momentum, you can use a trailing stop to lock in profits while allowing the asset to run with the trend.  Volatility-Based Stops: These are useful in situations where assets show high levels of volatility, ensuring that the stop doesn't get triggered prematurely in volatile conditions.  Break-even Stops: When a trade is moving in your favor (e.g., 2-3%), move the stop to break-even to protect against reversals and ensure you don't lose money if the asset moves back against you.
  • 88.
    Case Study: RRGStrategy with Stops in Action This Content is Copyright Reserved Rights Copyright 2025@PTAIndia 📌 Objective Evaluate how different stop-loss strategies impact the performance of an RRG-based strategy using the S&P 500 and sector ETFs for the period 2020-2023. 📌 Strategy Overview:  Assets Tracked: S&P 500 index and 10 sector ETFs (e.g., Technology, Healthcare, Financials, etc.).  RRG Analysis: Use Relative Rotation Graphs to track relative momentum across the ETFs.  Leading Quadrant: Long trades.  Lagging Quadrant: Avoid or short.
  • 89.
    Case Study: RRGStrategy with Stops in Action This Content is Copyright Reserved Rights Copyright 2025@PTAIndia 📌 Strategy Overview:  Stop-Loss Approaches Tested:  o Fixed Stop: 5% below entry price.  o Trailing Stop: 3% below highest price achieved.  o Volatility-Based Stop: 1.5x ATR.  o Break-even Stop: Once the price has moved 3% in favor, stop is moved to break- even.
  • 90.
    Case Study: RRGStrategy with Stops in Action This Content is Copyright Reserved Rights Copyright 2025@PTAIndia 📌 Backtest Results (2020-2023) Metric Fixed Stop (5%) Trailing Stop (3%) Volatility-Based Stop (ATR x1.5) Break-even Stop (3%) Total Return (%) 18% 22% 25% 20% Win Rate (%) 65% 70% 75% 68% Max Drawdown (%) -10% -8% -12% -7% Sharpe Ratio 1.2 1.5 1.7 1.4 Profit Factor 2.0 2.3 2.5 2.1
  • 91.
    Case Study: RRGStrategy with Stops in Action This Content is Copyright Reserved Rights Copyright 2025@PTAIndia 📌 Interpretation  Trailing Stops (3%) provided the second-best total return (22%), suggesting that locking in profits during strong trends while protecting against downside moves is an effective approach for momentum-based strategies like RRG.  Volatility-Based Stops (ATR x1.5) resulted in the highest total return (25%) and Profit Factor (2.5). This suggests that adjusting the stop based on market volatility provides a more adaptive strategy that can handle varying market conditions without getting stopped out prematurely.  Fixed Stops (5%) produced solid returns (18%) but had a higher maximum drawdown (-10%), indicating that a rigid stop might not be ideal for momentum strategies where market fluctuations can vary.  Break-even Stops worked well in protecting against losses once the trade moved in favor (3% in this case). However, they didn’t provide the highest returns, as the strategy exited too early in some cases, missing out on additional gains.
  • 92.
    Case Study: RRGStrategy with Stops in Action This Content is Copyright Reserved Rights Copyright 2025@PTAIndia 📌 Conclusion  The Volatility-Based Stop and Trailing Stop provided the best risk-adjusted performance and total returns, making them ideal for an RRG-based strategy focused on momentum.  Fixed Stops performed adequately but are less flexible in volatile markets, while Break- even Stops are great for risk management but may cut off profitable trades prematurely.  RRG with Stops is an effective strategy when combined with dynamic stop management, ensuring protection during adverse movements while allowing profits to run with momentum.
  • 93.
    Optimization Presented By : ThisContent is Copyright Reserved Rights Copyright 2025@PTAIndia
  • 94.
    Key Takeaways This Contentis Copyright Reserved Rights Copyright 2025@PTAIndia 📌 What is Optimization?  Optimization in trading refers to the process of adjusting the parameters of a trading strategy to maximize performance (e.g., returns, risk-adjusted returns) and reduce risk.  Traders use optimization techniques to find the best combination of variables (e.g., moving averages, stop-loss levels, position sizing) that enhance their strategy’s effectiveness.
  • 95.
    Key Takeaways This Contentis Copyright Reserved Rights Copyright 2025@PTAIndia 📌 Optimization Methods  Manual Optimization: Adjusting parameters manually and evaluating performance for each set of parameters.  Automated Optimization: Using software or trading platforms to perform exhaustive searches of different parameter combinations (e.g., grid search, genetic algorithms).  Walk-Forward Optimization: Optimizing on one period and testing on another to ensure that the strategy is not overfitted to historical data.  Monte Carlo Simulations: Running simulations with randomized data inputs to test the robustness of an optimized strategy.
  • 96.
    Key Takeaways This Contentis Copyright Reserved Rights Copyright 2025@PTAIndia 📌 Benefits of Optimization  Maximizes Profit Potential: Helps identify the optimal settings to capture more profits.  Improves Risk Management: Adjusts parameters like stop-loss levels and position sizes to keep risk within acceptable limits.  Increases Strategy Robustness: Reduces the likelihood of overfitting by testing different market conditions and adjusting the model accordingly.
  • 97.
    Key Takeaways This Contentis Copyright Reserved Rights Copyright 2025@PTAIndia 📌 Challenges of Optimization  Overfitting: Fine-tuning parameters too much based on historical data can lead to a strategy that works perfectly on past data but fails in live trading.  Curve Fitting: Excessive optimization for a single market condition may result in a strategy that only works under specific circumstances, reducing its generalizability.  Data Snooping Bias: Searching for patterns in data that might be coincidental rather than predictive.
  • 98.
    Cheat Sheet forOptimization This Content is Copyright Reserved Rights Copyright 2025@PTAIndia Optimization Aspect Description What to Consider Parameter Tuning Adjusting variables such as moving averages, stop-loss levels, or position sizes. Focus on key variables that directly impact strategy performance. Overfitting Risk Tailoring a strategy too closely to past data, risking poor performance in live trading. Avoid excessive optimization; use walk-forward testing to check for robustness. Walk-Forward Optimization Optimizing on one data set, testing on another. Prevents overfitting and ensures the strategy performs well in different market conditions. Optimization Metrics Metrics to optimize: Sharpe Ratio, Profit Factor, Maximum Drawdown, etc. Choose metrics that align with your trading goals (e.g., risk-adjusted returns). Monte Carlo Simulation Running simulations with random data inputs to test robustness. Helps ensure that the strategy holds up under various market conditions. Backtesting Testing the strategy with historical data to see how it would have performed. Make sure to test the strategy across multiple timeframes and market environments. Parameter Sensitivity Evaluating how sensitive a strategy is to changes in input parameters. Check if small changes in parameters significantly affect the results.
  • 99.
    Interpretation This Content isCopyright Reserved Rights Copyright 2025@PTAIndia 📌 Optimization vs. Overfitting:  Optimization aims to fine-tune a strategy to perform better based on past data. However, the danger is overfitting, where a strategy becomes too closely aligned with the specific data and fails to generalize in live trading.  Walk-forward testing helps mitigate overfitting by testing the strategy on out-of-sample data after optimization, ensuring it performs well on unseen data.  A strategy that works well only on historical data but fails in live trading is said to be over-optimized. Hence, it's important to balance between fitting the strategy to past data and maintaining its adaptability to future conditions.
  • 100.
    Interpretation This Content isCopyright Reserved Rights Copyright 2025@PTAIndia 📌 Metrics for Optimization:  Common optimization metrics include the Sharpe Ratio (risk-adjusted return), Profit Factor (total gains vs. losses), and Maximum Drawdown (largest peak-to-trough decline).  The key is to choose optimization metrics that align with your trading objectives. For example, if you prefer consistency, you might optimize for a higher Sharpe Ratio rather than just maximizing profits.
  • 101.
    Interpretation This Content isCopyright Reserved Rights Copyright 2025@PTAIndia 📌 Monte Carlo Simulations:  Monte Carlo simulations provide a more comprehensive view of how robust an optimized strategy is by randomly varying parameters and testing how the strategy performs under various conditions. It helps to see if the strategy would still be profitable when subjected to random changes.
  • 102.
    Interpretation This Content isCopyright Reserved Rights Copyright 2025@PTAIndia 📌 Optimization in Practice:  A key consideration when optimizing is that a high-performing parameter set based on historical data might not be the best choice when applied to future market conditions. Traders need to continuously monitor and adjust their optimized strategies to keep them effective in a live market.
  • 103.
    Case Study: Optimizationof a Moving Average Crossover Strategy This Content is Copyright Reserved Rights Copyright 2025@PTAIndia 📌 Objective Optimize a Moving Average Crossover strategy for the S&P 500 ETF (SPY) over the last 10 years (2013-2023). 📌 Strategy Overview:  Entry: Buy when the 50-day simple moving average (SMA) crosses above the 200-day SMA.  Exit: Sell when the 50-day SMA crosses below the 200-day SMA.  Stop-Loss: Fixed at 5% below the entry price.  Take-Profit: Fixed at 10% above the entry price.
  • 104.
    Case Study: Optimizationof a Moving Average Crossover Strategy This Content is Copyright Reserved Rights Copyright 2025@PTAIndia 📌 Optimization Parameters Tested:  Fast Moving Average (SMA): 10, 20, 30, 50, 100  Slow Moving Average (SMA): 100, 150, 200, 250  Stop-Loss Percentage: 3%, 5%, 7%  Take-Profit Percentage: 5%, 10%, 15% 📌 Optimization Metrics Used:  Sharpe Ratio: To evaluate the risk-adjusted return.  Profit Factor: To compare gains versus losses.  Max Drawdown: To measure the largest drop from peak to trough.
  • 105.
    Case Study: Optimizationof a Moving Average Crossover Strategy This Content is Copyright Reserved Rights Copyright 2025@PTAIndia 📌 Backtest Results (2013-2023) Metric SMA(50), SMA(200), Stop-Loss 5%, Take-Profit 10% Optimized Strategy (SMA(30), SMA(150), Stop-Loss 3%, Take-Profit 15%) Total Return (%) 80% 120% Win Rate (%) 68% 75% Sharpe Ratio 1.4 1.8 Profit Factor 1.8 2.2 Max Drawdown (%) -20% -15% Annualized Return (%) 6.8% 9.5%
  • 106.
    Case Study: Optimizationof a Moving Average Crossover Strategy This Content is Copyright Reserved Rights Copyright 2025@PTAIndia 📌 Interpretation  The optimized strategy (SMA(30), SMA(150), Stop-Loss 3%, Take-Profit 15%) performed significantly better than the initial baseline strategy (SMA(50), SMA(200), Stop-Loss 5%, Take-Profit 10%).  The Total Return was 120%, compared to 80% in the baseline.  The Sharpe Ratio improved from 1.4 to 1.8, indicating better risk-adjusted returns.
  • 107.
    Case Study: Optimizationof a Moving Average Crossover Strategy This Content is Copyright Reserved Rights Copyright 2025@PTAIndia 📌 Interpretation  The Profit Factor also improved, suggesting that the strategy became more profitable per unit of risk.  The Max Drawdown was reduced from -20% to -15%, showing that the optimized strategy provided better risk management.  The optimization showed that adjusting both the moving averages and risk parameters (like stop-loss and take-profit levels) led to a more robust strategy that performed better over the long term.
  • 108.
    Case Study: Optimizationof a Moving Average Crossover Strategy This Content is Copyright Reserved Rights Copyright 2025@PTAIndia 📌 Conclusion  Optimization helped significantly improve the strategy’s performance by finding the best combination of parameters that aligned with market conditions and the trader’s risk tolerance.  Overfitting was avoided by testing the strategy on a wide range of parameters and evaluating risk-adjusted metrics.  The walk-forward optimization and Monte Carlo simulations could be useful additions for further improving the robustness of this strategy.  Optimization is an iterative process: continual adjustments and monitoring are necessary to maintain performance as market conditions evolve.
  • 109.
    Strategy Update Presented By: This Content is Copyright Reserved Rights Copyright 2025@PTAIndia
  • 110.
    Key Takeaways This Contentis Copyright Reserved Rights Copyright 2025@PTAIndia 📌 What is a Strategy Update?  A Strategy Update refers to the process of modifying and refining a trading strategy over time to adapt to changing market conditions, improve performance, or incorporate new insights.  The update process typically involves revisiting and re-optimizing strategy parameters, entry and exit rules, risk management techniques, and market analysis to ensure continued effectiveness.
  • 111.
    Key Takeaways This Contentis Copyright Reserved Rights Copyright 2025@PTAIndia 📌 Reasons for Updating a Strategy  Market Conditions Change: Financial markets evolve, and strategies that worked well in one market environment may no longer be effective in a new one.  Performance Decline: If a strategy starts underperforming or showing signs of deterioration, an update may be necessary.  Technology & Tools: New tools, data sources, and technologies can enhance the strategy’s performance.  Risk Management Improvements: Updating risk management protocols such as stop- loss levels, position sizing, and diversification can help protect capital.  Learning from Past Trades: Analyzing previous trades and identifying patterns of success or failure can lead to valuable updates.
  • 112.
    Key Takeaways This Contentis Copyright Reserved Rights Copyright 2025@PTAIndia 📌 How to Update a Strategy  Backtesting: Re-run backtests on the updated strategy to validate the new rules or parameters.  Forward Testing: Test the updated strategy on out-of-sample data (live market or paper trading) to ensure its robustness.  Review Metrics: Use performance metrics like Sharpe ratio, Max Drawdown, and Win Rate to assess the effectiveness of the update.  Iterative Process: Continuously update and refine strategies based on new information or market feedback.
  • 113.
    Key Takeaways This Contentis Copyright Reserved Rights Copyright 2025@PTAIndia 📌 Key Components of Strategy Update  Reevaluation of Entry and Exit Rules: Adjust entry conditions, stop-loss levels, take-profit levels, or other parameters based on changing market dynamics.  Risk Management: Reassess stop-loss and position-sizing strategies to ensure better risk management.  Market Conditions: Factor in evolving market conditions, like volatility, interest rates, or macroeconomic shifts, into your strategy.
  • 114.
    Cheat Sheet forStrategy Update This Content is Copyright Reserved Rights Copyright 2025@PTAIndia Aspect Description What to Consider Performance Review Review historical performance metrics and behavior. Check for underperformance or overperformance and adjust accordingly. Backtesting with New Parameters Test updated strategy with historical data to ensure robustness. Ensure to cover a wide range of market conditions and timeframes. Forward Testing Validate the updated strategy in a live or simulated market environment. Test on out-of-sample data or paper trade to avoid overfitting. Risk Management Update Review stop-loss levels, position sizing, and diversification. Make sure the strategy is still aligned with your risk tolerance and capital exposure. Market Condition Alignment Adjust strategy for new market trends (e.g., volatility, sectors, news). Keep an eye on macroeconomic changes and their effect on markets. Review of Exit Strategy Update exit points based on new goals or market conditions. Consider using trailing stops, fixed profit targets, or volatility-based exits. Technology & Tool Usage Use updated tools, indicators, or software to optimize the strategy. Incorporate any new tools or data that could improve strategy execution.
  • 115.
    Interpretation This Content isCopyright Reserved Rights Copyright 2025@PTAIndia 📌 Why Strategy Updates Matter:  Financial markets are dynamic, and a strategy that worked well during one period might not perform well in another. A regular strategy update helps to ensure that the strategy adapts to new market conditions and remains profitable.  Regular updates based on performance reviews and backtesting help identify underperforming aspects and refine them. For example, adjusting entry or exit rules based on the latest market patterns can significantly improve overall returns.
  • 116.
    Interpretation This Content isCopyright Reserved Rights Copyright 2025@PTAIndia 📌 Balancing Between Updates and Overfitting:  A common pitfall of frequent updates is overfitting. Over-updating a strategy based on short-term performance or random fluctuations in the market can result in a strategy that is too tailored to past data, reducing its future effectiveness.  The key is to update the strategy when there are clear, justified reasons for doing so— such as a decline in performance or the emergence of new market conditions—and avoid making knee-jerk updates based on minor or temporary trends.
  • 117.
    Interpretation This Content isCopyright Reserved Rights Copyright 2025@PTAIndia 📌 The Importance of Forward Testing:  After updating a strategy, it’s critical to forward test the strategy on new data or in a paper trading environment. This ensures that the changes made to the strategy hold up in live market conditions and are not overfit to historical data.  Forward testing helps to validate that the strategy performs well in real-time market conditions, and it can reveal any issues that were missed during backtesting.
  • 118.
    Interpretation This Content isCopyright Reserved Rights Copyright 2025@PTAIndia 📌 Technology and Tools:  As technology evolves, traders gain access to new tools, data sources, and algorithms that can enhance strategy development. This means that regular updates can help take advantage of new capabilities, ensuring the strategy remains cutting-edge.  Incorporating advanced risk management tools (e.g., volatility-based stop-losses, machine learning models for market predictions) can provide a more adaptable and precise trading strategy.
  • 119.
    Case Study: Updatinga Trend Following Strategy This Content is Copyright Reserved Rights Copyright 2025@PTAIndia 📌 Objective Update a Trend Following Strategy using Moving Averages and RSI (Relative Strength Index) for S&P 500 ETF (SPY) from 2010 to 2023. 📌 Original Strategy:  Entry: Buy when the 50-day SMA crosses above the 200-day SMA, and RSI is above 30.  Exit: Sell when the 50-day SMA crosses below the 200-day SMA or RSI reaches 70 (overbought level).  Stop-Loss: 5% below entry price.  Take-Profit: 10% above entry price.
  • 120.
    Case Study: Updatinga Trend Following Strategy This Content is Copyright Reserved Rights Copyright 2025@PTAIndia 📌 Issue with Original Strategy:  Performance Decline: The strategy was performing well up until 2020 but showed a significant decline in 2021-2023, possibly due to increased market volatility and changes in broader economic conditions. 📌 Strategy Update Process Step 1: Performance Review  Backtesting Results (2010-2020): Solid performance with an annualized return of 8% and a Max Drawdown of -18%.  Backtesting Results (2021-2023): Annualized return dropped to 2%, with a Max Drawdown of -25%.
  • 121.
    Case Study: Updatinga Trend Following Strategy This Content is Copyright Reserved Rights Copyright 2025@PTAIndia Step 2: Backtesting New Parameters  Adjustment 1: Shorten the Fast SMA from 50 days to 30 days to capture quicker market trends.  Adjustment 2: Introduce a Volatility Filter using the Average True Range (ATR) to adjust position sizes and stop-loss levels based on current market volatility.  Adjustment 3: Use Trailing Stop instead of fixed 5% stop-loss to lock in profits as the trend moves in favor. Step 3: Forward Testing  The updated strategy was tested in a paper trading environment from January 2024 to March 2024, showing improved performance metrics.
  • 122.
    Case Study: Updatinga Trend Following Strategy This Content is Copyright Reserved Rights Copyright 2025@PTAIndia 📌 Backtest Results (Updated Strategy, 2020-2023) Metric Original Strategy Updated Strategy Total Return (%) 32% (2010-2020) 52% (2020-2023) Annualized Return (%) 8% 12% Max Drawdown (%) -18% -10% Sharpe Ratio 1.2 1.7 Win Rate (%) 60% 70% Profit Factor 1.8 2.3
  • 123.
    Case Study: Updatinga Trend Following Strategy This Content is Copyright Reserved Rights Copyright 2025@PTAIndia 📌 Interpretation  The updated strategy significantly outperformed the original one, achieving a 52% total return in 2020-2023 compared to 32% in the same period for the original strategy.  The Annualized Return also improved from 8% to 12%.  The Max Drawdown was reduced from -18% to -10%, which indicates better risk management in volatile market conditions.  The use of Trailing Stops and Volatility Filters in the updated strategy helped lock in profits while limiting downside risk during periods of high volatility.  The Sharpe Ratio increased from 1.2 to 1.7, indicating that the updated strategy provides better risk-adjusted returns.
  • 124.
    Case Study: Updatinga Trend Following Strategy This Content is Copyright Reserved Rights Copyright 2025@PTAIndia 📌 Conclusion  Strategy updates are essential for keeping trading strategies relevant and effective. In this case, updating the Trend Following Strategy with new parameters and risk management tools improved its performance and made it more resilient to market changes.  Forward testing was crucial to ensure that the updated strategy performed well in live conditions and avoided overfitting.  Regular updates to your strategy based on performance reviews and market changes are key to maintaining long-term profitability.
  • 125.
    THE END Presented By: This Content is Copyright Reserved Rights Copyright 2025@PTAIndia